key performance indicators (kpis) for evaluation of ...€¦ · engineers (nace) published standard...
TRANSCRIPT

.
Paper Number: 2017-01
Key Performance Indicators (KPIs) for Evaluation of Corrosion
Control Status in the Gathering Pipelines of an Oil Production Field
of the Amazon Basin in Ecuador
Carlos Melo University of Calgary, Canada
Petroamazonas EP, Ecuador
Abstract Pipelines are considered the safest and most economical transportation infrastructure for natural
resources such as oil and gas. However, pipelines can fail due to different causes including external
and internal corrosion. Failures, due to internal and external corrosion, cause considerable loss of
resources to the operators of oil and gas pipelines. The National Association of Corrosion
Engineers (NACE) published standard practices (NACE SP-0502 Pipeline External Corrosion
Direct Assessment Methodology (ECDA) and NACE SP-0116 Multiphase Internal Corrosion
Direct Assessment (MP-ICDA)) to support pipeline operators with external and internal corrosion
control. In addition, the fifty KPIs methodology was first published in 2013 to get a better
understanding the status of internal and external corrosion control for oil and gas
infrastructures.
There are many challenges for the corrosion and integrity management of oil production
infrastructure in harsh environments such as the Amazon Basin in Ecuador. Petroamazonas EP
(PAM) is a public oil and gas producer that operates in several regions of the Amazon Basin in
Ecuador. PAM implemented the NACE ECDA and MP-ICDA between the years 2010 and 2015
to assess the risk of external and internal corrosion on some of the gathering pipelines of the Eden
Yuturi (EY) field. In 2017, Petroamazonas EP applied the fifty KPIs methodology to complement
the ECDA and MP-ICDA and better under the status of internal and external corrosion control of
the gathering pipelines of the EY field.
The objective of this paper is to summarize the results of application of the fifty KPIs methodology
by PAM.

1. Introduction
This report focuses on the gathering pipeline system of an oil field operated by Ecuador’s public
petroleum company, Petroamazonas EP (PAM). PAM operates within several regions of the
Amazon Basin in Ecuador. These operating regions are called “blocks”. The total oil production
of PAM was 423,500 Barrels Per Day (BPD) (67,311 m3/day) as on July of 2017 [1]. The
production comes from four main zones: East, West, North, and South. Figure 1 details the
percentage of oil production from each one of the zones.
Figure.1 Percentages of Total Oil Production per Zones PAM, July 2017
The gathering pipelines that are the focus of this paper are located in Block 12 of the East zone
(Figure 2, Figure 3, and Figure 4). The operating temperature of these pipelines is close to 93oC
(200oF). The total production from Block 12 is approximately 36,421 BPD (5,790 m3/day) of oil,
360,154 BPD (57,260 m3/day) of water and 8 Million Standard Cubic Feet Per Day (MMSCFD)
(226,243 m3/day) of gas [1].
Figure 5 gives a more detailed view of the Eden Yuturi (EY) field, including the production
platforms (A, C, D, F, G, H, J, K, and T), the water injection platform (L), and the central Eden
Production Facilities (EPF). The EPF were built in 2002 and have undergone several
modifications since then. Currently EPF process fluids from:
• Eden Yuturi (EY) field
• Panacocha (PCC) field
• Apaika (APK) field
• ITT field
A PAM’s 2010 study [2], shows that internal and external corrosion caused more than 50% of the
failures for the gathering pipeline systems of the Blocks 12 and 15 (Figure 6).

• Before 2010, PAM only used hydrostatic test as the integrity validation technique for the
gathering pipelines.
• Since 2010, PAM started with the application of the ECDA on several of the gathering
pipelines of the Block 12 [3].
• In 2015 PAM completed the implementation of the MP-ICDA on the oldest gathering
pipelines from the Block 12 [2].
The gathering pipelines that will be included in the present report are detailed in Table 1.
This report is divided into three sections following the introduction. The next section summarizes
the results of the estimation of the fifty KPIs on the gathering pipeline systems of Block 12 [4].
Section three details the results of the application of the fifty KPIs methodology, and section four
includes conclusions and recommendations.
Figure 2 EY Production Field in South America (Image from Google Earth).
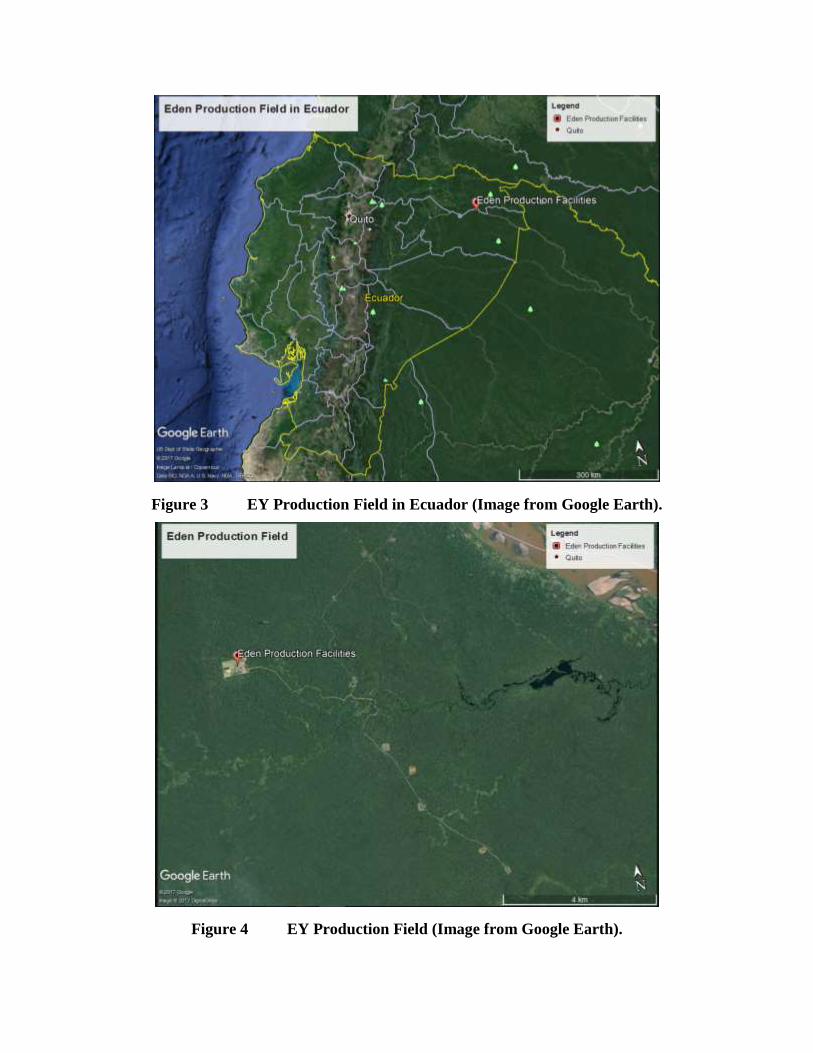
Figure 3 EY Production Field in Ecuador (Image from Google Earth).
Figure 4 EY Production Field (Image from Google Earth).
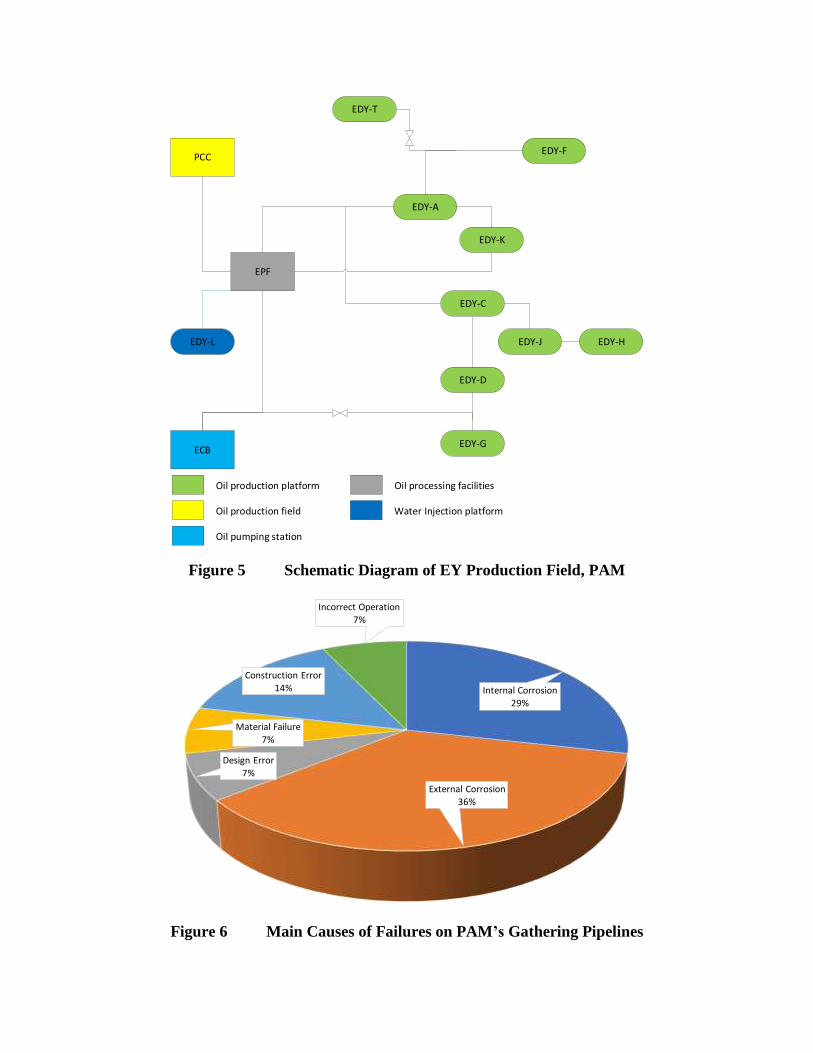
Figure 5 Schematic Diagram of EY Production Field, PAM
Figure 6 Main Causes of Failures on PAM’s Gathering Pipelines
EPF
PCCEDY-F
EDY-T
EDY-A
EDY-K
EDY-C
EDY-J EDY-H
EDY-D
EDY-GECB
Oil processing facilitiesOil production platform
Oil production field
Oil pumping station
EDY-L
Water Injection platform
Internal Corrosion
29%
External Corrosion
36%
Design Error
7%
Material Failure
7%
Construction Error
14%
Incorrect Operation
7%

Table 1 EY Gathering Pipelines 2017
a The gathering pipeline transport a multiphase fluid composed by oil, water and gas
2. Context of Corrosion Control
The results and the rationale for assigning the scores for the KPIs for Corrosion Control Context
are shown in Table 2 and the rationale for the KPI scores is described in the following sections.
Table 2 Summary of KPI for Corrosion Control Context
Internal External (m) (inches) (mm) (inches) (km) (miles) installed (°F) (°C) (psi) (kPa)
Pad G- Pad D MPa Amercoat 91 FBE 0.457 18 7.92 0.312 2.84 1.76 2004 185 85 294 2,027
Pad D-Y MPa Amercoat 91 FBE 0.457 18 7.92 0.312 4.29 2.67 2002 193 89 240 1,655
Pad J-Pad C MPa Amercoat 91 FBE 0.457 18 7.92 0.312 1.21 0.75 2007 200 93 245 1,689
Pad F-Pad A MPa Amercoat 91 FBE 0.457 18 7.92 0.312 7.14 4.44 2004 200 93 299 2,062
Pad A-EPF Line 1 MPa Amercoat 91 FBE 0.457 18 7.92 0.312 3.78 2.35 2002 200 93 193 1,331
Pad A-EPF Line 2 MPa TK-505 FBE 0.457 18 7.92 0.312 3.78 2.35 2008 200 93 193 1,331
Pad K-Y MPa TK-505 FBE 0.305 12 12.70 0.500 0.34 0.21 2009 190 88 200 1,379
Pad H-Pad J MPa FBE 0.152 6 7.11 0.280 2.86 1.78 2012 191 88 285 1,965
PCC B-PCC C MPa TK-505 FBE 0.406 16 7.92 0.312 7.60 4.72 2010 190 88 255 1,758
PCC C-EPF MPa TK-505 FBE 0.406 16 7.92 0.312 24.50 15.22 2010 190 88 770 5,309
DBM-Napo Norte MPa FBE 0.152 6 7.92 0.312 7.67 4.77 2013 150 66 370 2,551
APK-ECB MPa FBE 0.457 18 10.31 0.406 24.00 14.91 2013 166 74 462 3,185
ECB-EPF MPa FBE 0.610 24 12.70 0.500 32.50 20.19 2013 152 67 350 2,413
EPF-EDYL Water Plasite 7159 FBE 0.610 24 9.53 0.375 3.24 2.01 2013 170 77 121 834
Pad T-Tee MPa FBE 0.203 8 8.18 0.322 0.33 0.21 2014 204 96 240 1,655
Pipeline ProductCoating Length Year
Operating Operating
Temperature PressureDiameter
Nominal
Thickness
Wall
KP
I
Pa
d G
- P
ad
D
Pa
d D
- Y
Pa
d J
- P
ad
C
Pa
d F
- P
ad
A
Pa
d A
- E
PF
Lin
e 1
Pa
d A
- E
PF
Lin
e 2
Pa
d K
- Y
Pa
d H
- P
ad
J
PC
C B
- P
CC
C
PC
C C
- E
PF
DB
M -
Na
po
No
rte
AP
K-E
CB
EC
B -
EP
F
EP
F -
Pa
d L
Pa
d T
- T
ee
Remarks:
1 0 0 4 4 0 4 3 4 4 4 4 4 4 4 3
0-1: Segment less than 1 km
2-3: Segment greater than 1 km
4-5: Variable segmentation or non
2 3 3 2 3 3 2 2 3 2 2 4 4 4 1 4
0-1: Low or no corrosion risk
2-3: Secondary corrosion risk
4-5: Main corrosion risk
3 3 3 3 3 3 3 3 3 4 4 4 5 5 3 3
0-1: Low consequence of failure
2-3: Medium consequence of failure
4-5: High consequence of failure
4 2 2 1 2 2 1 1 2 2 2 4 5 5 0 3
0-1: Overall corrosion risk low
2-3: Overall corrosion risk medium
4-5: Overall corrosion risk high
5 4 4 4 4 4 3 3 2 2 2 1 1 1 1 0
0-1: Life between 1-5 years
2-3: Life between 5-10 years
4-5: Life more than 10 years

KPI 1: Segmentation of Infrastructure
For the MP-ICDA, PAM created the segmentation of various pipelines. KPI 1 scores were
assigned based on this segmentation [2] (Table 1).
KPI 2: Corrosion Risk
Almost all the pipelines transport multiphase fluid (oil, gas, and water), with the exception of the
water injection pipeline. It is assumed that the corrosivity of the fluids is similar because
production is from the same reservoirs. The higher KPI 2 score was assigned to the gathering
pipelines that do not have an internal coating and score was reduced for the pipelines that have
internal coating.
KPI 3: Location of Infrastructure
All the pipelines are located in environmentally sensitive areas, as defined by the Code of Federal
Regulations (CFR) Title 49, Part 195.6, USA. In addition, the pipelines APK-ECB, 7 ECB-EPF,
PCC B-PCC C, PCC C- EPF, and DBM-Napo Norte, are located near national parks and rivers
such as the Napo. Therefore, the consequence of failure is medium or high.
KPI 4: Quantification of Risk
This KPI is estimated by the multiplication of KPIs 2 and 3.
KPI 5: Life of Infrastructure
This KPI 5 score was calculated based on information provided in Table 1.
3. Internal corrosion – Model
The results and the rationale for assigning the scores for the KPIs for Internal Corrosion Model are
shown in Table 3 and the rationale for the KPI scores is described in the following sections.
KPI 6: Material of Construction
All the gathering pipelines are constructed using pipeline steel API 5L, grades 42, 65, or 70 [5].
Additionally, as shown in Table 1, most of the pipelines are internally coated (lower KPI 6 score)
and some are constructed without any coatings (higher KPI 6 score).
KPI 7: Corrosion Allowance
Corrosion allowance is only considered for the pipelines that do not have internal coating. In
addition, the gathering pipelines from PCC-C-EPF, APK-ECB, and ECB-EPF have a greater wall
thickness on the main river crossings.
KPI 9: Effect of Upset Condition in Upstream Sector on the Current Sector
The gathering pipelines from the EY field (Pads A, C, D, F, G, H, J, K, and T) are not affected by
upstream operations. On the other hand, the pipelines from PCC, APK, and ECB are directly
affected by upstream operations on pumping equipment, and operating pressure that can accelerate
internal corrosion.

Table 3 Summary of KPI for Internal Corrosion Control Model
KPI 10: Effect of Upset Condition in the Current Sector on the Downstream Sector
Upset conditions of all pipelines will affect the EPF separation process.
KPI 11: Mechanisms of corrosion
For all gathering pipelines the main corrosion mechanism is localized corrosion due the high
corrosivity of the transported products according to the analysis performed as part of the MP ICDA
project [2].
Some pipelines do not have facilities for mechanical cleaning tools. Therefore, the risks of
corrosion under deposits and water accumulation are high. Water pipelines are susceptible for
Microbiologically Influenced Corrosion (MIC).
KPI 12: Maximum Corrosion Rate (internal surface)
The corrosion rate obtained from the MP ICDA project is used to score KPI 12.
KPI 14: Accessories (internal surface)
Corrosion and integrity engineers were involved in the design and construction stages of the older
pipelines and in the establishment of accessories and their locations. However, their involvement
is less in the newer pipelines due to costs optimization.
KP
I
Pa
d G
- P
ad
D
Pa
d D
- Y
Pa
d J
- P
ad
C
Pa
d F
- P
ad
A
Pa
d A
- E
PF
Lin
e 1
Pa
d A
- E
PF
Lin
e 2
Pa
d K
- Y
Pa
d H
- P
ad
J
PC
C B
- P
CC
C
PC
C C
- E
PF
DB
M -
Na
po
No
rte
AP
K-E
CB
EC
B -
EP
F
EP
F -
Pa
d L
Pa
d T
- T
ee
Remarks:
6 IC 3 3 3 3 3 3 4 4 3 3 3 4 4 3 4
0-1: Material selection based on corrosion
2-3: Material adequate with corrosion control
4-5: Unknown suitability of material
7 IC 4 4 4 4 4 4 3 3 3 3 3 3 3 4 3
0-1: Proper corrosion allowance
2-3: Corrosion allowance with corrosion control
4-5: Improper corrosion allowance
9 IC 1 1 1 1 1 1 1 1 3 3 2 3 3 3 1
0-1: Plan to control of upstream segments implemented
2-3: Plan to control upset upstream not implemented
4-5: No plan to control upset upstream
10 IC 2 2 2 2 2 2 2 2 3 3 2 3 3 2 2
0-1: Plan to control of downstream segments implemented
2-3: Plan to control upset downstream not implemented
4-5: No plan to control upset downstream
11 IC 2 2 2 2 2 2 2 2 3 3 3 3 3 3 2
0-1: Proper knowledge of corrosion mechanisms
2-3: Some knowledge of corrosion mechanisms
4-5: Improper knowledge of corrosion mechanisms
12 1 1 3 3 1 3 3 3 4 4 4 4 4 4 3
0-1: Corrosion rate based on model
2-3: No basis for selection of corrosion rate
4-5: Unknown corrosion rate
14 IC 2 2 2 2 2 3 3 3 3 3 3 3 3 3 3
0-1: Corrosion professional involved in all stages
2-3: Corrosion professional involved in some stages
4-5: Corrosion professional not involved
39 3 3 3 3 3 3 3 3 3 3 3 3 3 3 3
0-1: Corrosion rate reduced after maintenance activities
2-3: Corrosion rate maintained after maintenance activities
4-5: Corrosion rate increased after maintenance activities
40 3 3 3 3 3 3 3 3 3 3 3 2 2 3 3
0-1: Corrosion rate within 10% of expected
2-3: Corrosion rate less than 10% of expected
4-5: Corrosion rate is more than 10% of expected

KPI 39: Internal corrosion rate after maintenance activities
The maintenance operations are regulated by the Management of Change (MOC) policies. MOC
are implemented to reduce internal corrosion rates after the maintenance activities. However, there
are not records or measurements to establish their effectiveness.
KPI 40: Internal corrosion rate reduction after maintenance activities
Most pipelines have facilities for launching and receiving the cleaning tools. For these pipelines,
mechanical cleaning is used to reduce internal corrosion. Polyurethane pigs and used for the coated
pipelines and mandrel pigs in the un-coated pipelines. However, there is no comparison of the
corrosion rates before and after the maintenance activities.
4. Internal corrosion – Mitigation The results and the rationale for assigning the scores for the KPIs for Internal Corrosion Mitigation
are shown in Table 4 and the rationale for the KPI scores is described in the following sections.
Table 4 Summary of KPI for Internal Corrosion Mitigation
KPI 16: Mitigation to Control Internal Corrosion
Most of the pipelines have internal coatings as a mitigation strategy for internal corrosion.
Corrosion rates of some pipelines are reduced by mechanical cleaning and by the addition of
corrosion inhibitors.
KPI 17: Mitigation Strategies to Control Internal Corrosion
Most of the pipelines have facilities for mechanical cleaning programs, however these activities
are not regularly performed for all the pipelines.
KPI 18: Mitigated Corrosion Rate for Internal Corrosion
The mitigated corrosion rates for internal corrosion has not been established for the EY gathering
pipelines.
KP
I
Pa
d G
- P
ad
D
Pa
d D
- Y
Pa
d J
- P
ad
C
Pa
d F
- P
ad
A
Pa
d A
- E
PF
Lin
e 1
Pa
d A
- E
PF
Lin
e 2
Pa
d K
- Y
Pa
d H
- P
ad
J
PC
C B
- P
CC
C
PC
C C
- E
PF
DB
M -
Na
po
No
rte
AP
K-E
CB
EC
B -
EP
F
EP
F -
Pa
d L
Pa
d T
- T
ee
Remarks:
16 1 1 1 1 1 1 4 4 1 1 4 4 4 1 4
0-1: No mitigation required based on design
2-3: Mitigation required based on design
4-5: Mitigation required based on current operating conditions
17 2 2 2 2 2 2 4 3 2 2 2 3 3 3 4
0-1: No mitigation required or properly implemented
2-3: Mitigation implemented for current operating conditions
4-5: Mitigation improper for current operating conditions
18 4 4 4 4 4 4 4 4 4 4 4 4 4 4 4
0-1: Mitigated corrosion rate based on baseline
2-3: No basis for selection of mitigated corrosion rate
4-5: Unknown mitigated corrosion rate
19 2 2 2 2 2 2 3 2 2 2 2 2 2 2 4
0-1: 99% Availability of mitigation practices
2-3: 95-99% Availability of mitigation practices
4-5: Less than 95% Availability of mitigation practices

KPI 19: Effectiveness of Internal Corrosion Mitigation
The effectiveness of internal corrosion mitigation including corrosion inhibitor effectiveness is
monitored based on corrosion coupons on the flow pipelines, but there is no direct monitoring for
the corrosion rate of the gathering pipelines.
For internally coated pipelines, the corrosion rate from the coupons can’t be directly obtained. One
of the recommendations of the MP-ICDA project was to test samples of the internal coating to find
the estimated life of the system and the corrosion rates after the failure of the coating system [2].
The gathering pipelines from Pad K-Y and Pad T-Tee do not have launchers and receivers for
mechanical cleaning.
5. Internal corrosion – Monitoring: The results and the rationale for assigning the scores for the KPIs for Internal Corrosion
Monitoring are shown in Table 5 and the rationale for the KPI scores is described in the following
sections.
Table 5 Summary of KPI for Internal Corrosion Monitoring
KPI 24: Internal Corrosion Monitoring Techniques
Coupons are used to monitor internal corrosion rate on some of the gathering pipelines, but the
methodology has not proven to be effective.
KPI 25: Number of Internal Corrosion Monitoring Probes
Coupons are installed only at the beginning or end of some of the gathering pipelines. There are
not enough monitoring probes for internal corrosion monitoring and further only one type of
monitoring technique is used.
KP
I
Pa
d G
- P
ad
D
Pa
d D
- Y
Pa
d J
- P
ad
C
Pa
d F
- P
ad
A
Pa
d A
- E
PF
Lin
e 1
Pa
d A
- E
PF
Lin
e 2
Pa
d K
- Y
Pa
d H
- P
ad
J
PC
C B
- P
CC
C
PC
C C
- E
PF
DB
M -
Na
po
No
rte
AP
K-E
CB
EC
B -
EP
F
EP
F -
Pa
d L
Pa
d T
- T
ee
Remarks:
24 4 4 4 4 4 4 4 4 4 4 4 4 4 4 4
0-1: Two or more complimentary monitoring techniques
2-3: One monitoring technique proven to be effective
4-5: No monitoring or ineffective (not proven) monitoring
25 4 4 4 4 4 4 4 4 4 4 4 4 4 4 4
0-1: Probes in all critical locations an non-critical
2-3: Probes in most of the critical locations
4-5: Probes in some of the critical locations
26 4 4 4 4 4 4 4 4 4 4 4 4 4 4 4
0-1: Corrosion rates from two monitoring within 10%
2-3: Corrosion rates from two monitoring within 11-25%
4-5: Corrosion rates from two monitoring within > 25%
27 4 4 4 4 4 4 4 4 4 4 4 4 4 4 4
0-1: Mitigated corrosion rates from two monitoring within 10%
2-3: Mitigated corrosion rates from two monitoring within 11-25%
4-5: Mitigated corrosion rates from two monitoring within > 25%
32 IC 2 2 4 4 2 4 4 3 3 3 3 3 3 3 3
0-1: Frequency of inspection based on RBI
2-3: Frequency of inspection based on engineering processes
4-5: More than then 10 without inspection
33 4 4 4 4 4 4 4 4 4 4 4 4 4 4 4
0-1: Corrosion rate from monitoring and inspection within 10%
2-3: Corrosion rate from monitoring and inspection within 11-25%
4-5: Corrosion rate from monitoring and inspection within >25%
KPI 26: Internal Corrosion Rates from Monitoring
Corrosion rates for the gathering pipelines have not been established.
KPI 27: Accuracy of Internal Corrosion Monitoring
There are not enough probes to compare the accuracy of the monitoring techniques.
KPI 32: Frequency of Inspections for Internal Corrosion
The high temperature of operation (above 90oC) restrict the use of ILI tools. Other gathering
pipelines have no facilities for the delivery and reception of the ILI tools.
KPI 33: Comparison between Inspection and Monitoring for Internal Corrosion
There is no ILI data and not enough probes for monitoring. Therefore, the comparison can’t be
made.
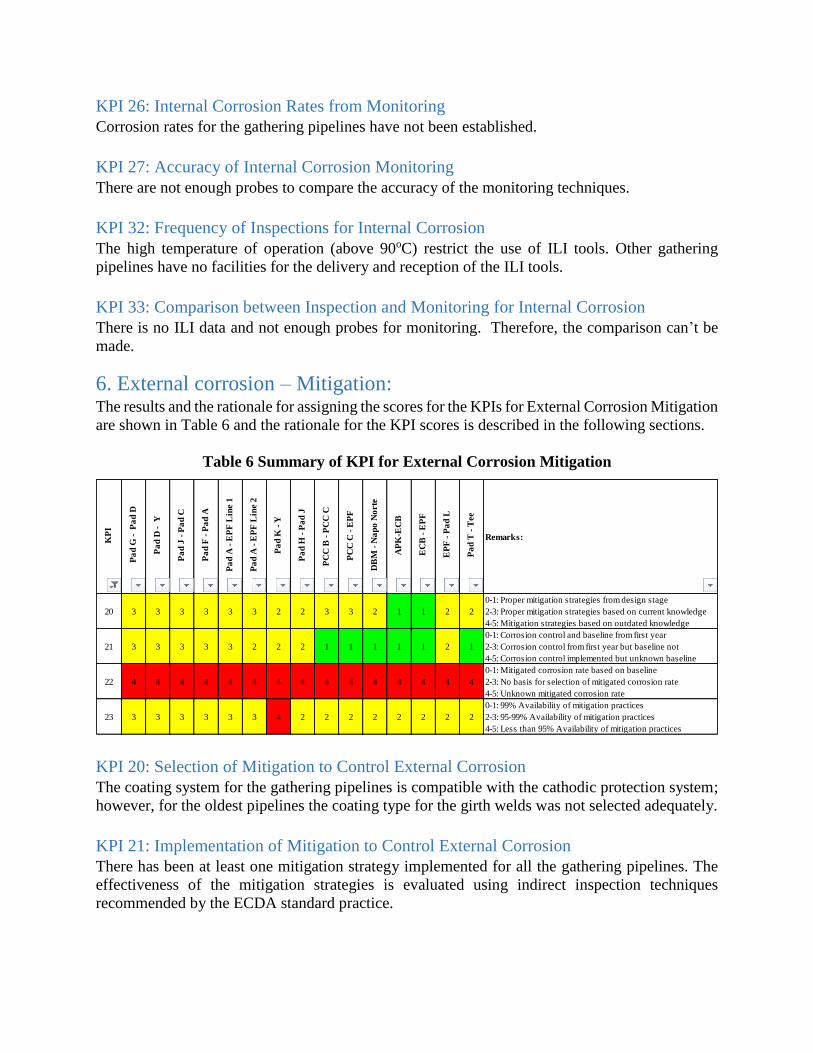
6. External corrosion – Mitigation: The results and the rationale for assigning the scores for the KPIs for External Corrosion Mitigation
are shown in Table 6 and the rationale for the KPI scores is described in the following sections.
Table 6 Summary of KPI for External Corrosion Mitigation
KPI 20: Selection of Mitigation to Control External Corrosion
The coating system for the gathering pipelines is compatible with the cathodic protection system;
however, for the oldest pipelines the coating type for the girth welds was not selected adequately.
KPI 21: Implementation of Mitigation to Control External Corrosion
There has been at least one mitigation strategy implemented for all the gathering pipelines. The
effectiveness of the mitigation strategies is evaluated using indirect inspection techniques
recommended by the ECDA standard practice.
KP
I
Pa
d G
- P
ad
D
Pa
d D
- Y
Pa
d J
- P
ad
C
Pa
d F
- P
ad
A
Pa
d A
- E
PF
Lin
e 1
Pa
d A
- E
PF
Lin
e 2
Pa
d K
- Y
Pa
d H
- P
ad
J
PC
C B
- P
CC
C
PC
C C
- E
PF
DB
M -
Na
po
No
rte
AP
K-E
CB
EC
B -
EP
F
EP
F -
Pa
d L
Pa
d T
- T
ee
Remarks:
20 3 3 3 3 3 3 2 2 3 3 2 1 1 2 2
0-1: Proper mitigation strategies from design stage
2-3: Proper mitigation strategies based on current knowledge
4-5: Mitigation strategies based on outdated knowledge
21 3 3 3 3 3 2 2 2 1 1 1 1 1 2 1
0-1: Corrosion control and baseline from first year
2-3: Corrosion control from first year but baseline not
4-5: Corrosion control implemented but unknown baseline
22 4 4 4 4 4 4 4 4 4 4 4 4 4 4 4
0-1: Mitigated corrosion rate based on baseline
2-3: No basis for selection of mitigated corrosion rate
4-5: Unknown mitigated corrosion rate
23 3 3 3 3 3 3 4 2 2 2 2 2 2 2 2
0-1: 99% Availability of mitigation practices
2-3: 95-99% Availability of mitigation practices
4-5: Less than 95% Availability of mitigation practices

KPI 22: Mitigated External Corrosion Target
Under normal operating conditions, the expected corrosion rate for a steel pipeline with a
calibrated cathodic protection system and compatible coating system is 1 milli-inch per year (mpy)
or 0.0254 mm/year [6]. However, this target has not yet been established for the gathering pipelines
of EY.
KPI 23: Effectiveness of Mitigation for External Corrosion
The cathodic protection systems are operating most of the time, but several external works have
accidentally disconnected the systems temporarily reducing the mitigation effectiveness. In
addition, the cathodic protection system was installed in the Pad K-Y system after one year of
operation.
7. External corrosion – Model: The results and the rationale for assigning the scores for the KPIs for External Corrosion Model
are shown in Table 7 and the rationale for the KPI scores is described in the following sections.
Table 7 Summary of KPI for External Corrosion Model
KPI 6: Material of Construction
As mentioned on KPI 6 section, all the gathering pipelines from the EY field are constructed from
pipeline steel API 5L, grades 42, 65, or 70 [5].
KP
I
Pa
d G
- P
ad
D
Pa
d D
- Y
Pa
d J
- P
ad
C
Pa
d F
- P
ad
A
Pa
d A
- E
PF
Lin
e 1
Pa
d A
- E
PF
Lin
e 2
Pa
d K
- Y
Pa
d H
- P
ad
J
PC
C B
- P
CC
C
PC
C C
- E
PF
DB
M -
Na
po
No
rte
AP
K-E
CB
EC
B -
EP
F
EP
F -
Pa
d L
Pa
d T
- T
ee
Remarks:
6 EC 2 2 2 2 2 2 2 2 2 2 2 2 2 2 2
0-1: Material selection based on corrosion
2-3: Material adequate with corrosion control
4-5: Unknown suitability of material
7 EC 4 4 4 4 4 4 3 3 3 3 3 3 3 4 3
0-1: Proper corrosion allowance
2-3: Corrosion allorwance with corrosion control
4-5: Improper corrosion allowance
9 EC 1 1 1 1 1 1 1 1 3 3 2 3 3 3 1
0-1: Plan to control of upstream segments implemented
2-3: Plan to control upset upstream not implemented
4-5: No plan to control upset upstream
10 EC 3 3 3 3 3 3 2 2 3 3 2 1 1 1 1
0-1: Plan to control of downstream segments implemented
2-3: Plan to control upset downstream not implemented
4-5: No plan to control upset downstream
11 EC 2 2 2 2 2 2 2 2 3 3 3 3 3 3 2
0-1: Proper knowledge of corrosion mechanisms
2-3: Some knowledge of corrosion mechanisms
4-5: Improper knowledge of corrosion mechanisms
13 4 4 4 4 4 4 4 4 4 4 4 4 4 4 4
0-1: Corrosion rate based on model
2-3: No basis for selection of corrosion rate
4-5: Unknown corrosion rate
14 EC 2 2 2 2 2 3 3 3 3 3 3 3 3 3 3
0-1: Corrosion professional involved in all stages
2-3: Corrosion professional involved in some stages
4-5: Corrosion professional not involved
41 3 3 3 3 3 3 3 3 3 3 3 3 3 3 3
0-1: Corrosion rate reduced after maintenance activities
2-3: Corrosion rate maintaned after maintenance activities
4-5: Corrosion rate increased after maintenance activities
42 3 3 3 3 3 3 3 3 3 3 3 3 3 3 3
0-1: Corrosion rate within 10% of expected
2-3: Corrosion rate less than 10% of expected
4-5: Corrosion rate is more than 10% of expected

KPI 7: Corrosion Allowance
As explained on KPI 7 section, the corrosion allowance was only considered for the pipelines that
do not have internal coating. In addition, the gathering pipelines from PCC-C EPF, APK-ECB,
and ECB-EPF have a greater wall thickness on the main river crossings.
KPIs 9 and 10: Upset Condition upstream and downstream
The only parameter that can affect external corrosion is the temperature. The operating
temperatures are relatively high (90oC) and are relatively constant in all segments.
KPI 11: Mechanisms of corrosion
The main corrosion mechanism for all gathering pipelines is localized corrosion that can occur on
the external surface when there is a coating failure and the current from the cathodic protection
system is not able to reach the metal surface. Additionally, shrinks sleeves were used as the coating
system for the girth welds of the older gathering pipelines. Localized corrosion has been identified
below disbonded sleeves in some excavations of gathering pipelines with similar operational
temperatures as the EPF. Shrink sleeves are identified as a coating system that can create a
shielding effect on the cathodic protection current and generate external corrosion mechanisms
[3].
KPI 13: Maximum Corrosion Rate (external surface)
According to NACE ECDA standard practice the corrosion rate for an unprotected steel in soil is
expected to be 16 mpy (0.4 mm/year). However, this value has not been measured for the EY field
conditions.
KPI 14: Accessories (external surface)
Refer to KPI 14.
KPI 41: External corrosion rate after maintenance activities
The maintenance activities for external corrosion included coating repairs in the areas of severe
indications according to the indirect inspection surveys performed in accordance to NACE ECDA
standard practice. Nevertheless, the corrosion rate has not been measured and the comparison can’t
be established.
KPI 42: External corrosion rate reduction after maintenance activities
Refer to KPI 41.
8. External corrosion – Monitoring
The results and the rationale for assigning the scores for the KPIs for External Corrosion
Monitoring are shown in Table 8 and the rationale for the KPI scores is described in the following
sections.

Table 8 Summary of KPI for External Corrosion Monitoring
KPI 28: External Corrosion Monitoring Techniques
The monitoring techniques for external corrosion concentrate on the cathodic protection
polarization criterion. In addition, as already explained the NACE ECDA was used to assess the
effectiveness of the coating system for all the gathering pipelines of the EY. However, there is not
a good monitoring technique in use for the corrosion below the shielding coatings installed on the
oldest pipelines.
KPI 29: Number of External Corrosion Monitoring Probes per unit area
The probes for cathodic protection are located at least every two kilometers for the oldest pipelines,
and every kilometer for the newest pipelines. Nevertheless, newer monitoring points have not been
installed on the locations detected by the NACE ECDA as critical.
KPI 30: External Corrosion Rates from Monitoring
The corrosion rates are not measured with the monitoring techniques.
KPI 31: Accuracy of External Corrosion Monitoring
There are no probes for external corrosion rate monitoring and the accuracy can’t be established.
KPI 32 Frequency of Inspections for External Corrosion
All gathering pipelines from EY has been inspected using the NACE ECDA methodology. The
use of ILI has been restricted by the operating conditions and the presence of internal coatings.
KPI 34 Comparison between Inspection and Monitoring for External Corrosion
No probes were in place to measure external corrosion rates and operating conditions restrict the
use of ILI. Severe corrosion was only observed in limited locations during the direct examination.
KP
I
Pa
d G
- P
ad
D
Pa
d D
- Y
Pa
d J
- P
ad
C
Pa
d F
- P
ad
A
Pa
d A
- E
PF
Lin
e 1
Pa
d A
- E
PF
Lin
e 2
Pa
d K
- Y
Pa
d H
- P
ad
J
PC
C B
- P
CC
C
PC
C C
- E
PF
DB
M -
Na
po
No
rte
AP
K-E
CB
EC
B -
EP
F
EP
F -
Pa
d L
Pa
d T
- T
ee
Remarks:
28 4 4 4 4 4 4 3 3 4 4 3 3 3 3 3
0-1: Two or more complimentary monitoring techniques
2-3: One monitoring technique proven to be effective
4-5: No monitoring or ineffective (not proven) monitoring
29 4 4 4 4 4 4 3 3 4 4 3 3 3 3 3
0-1: Probes in all critical locations an non-critical
2-3: Probes in most of the critical locations
4-5: Probes in some of the critical locations
30 4 4 4 4 4 4 4 4 4 4 4 4 4 4 4
0-1: Corrosion rates from two monitoring within 10%
2-3: Corrosion rates from two monitoring within 11-25%
4-5: Corrosion rates from two monitoring within > 25%
31 4 4 4 4 4 4 4 4 4 4 4 4 4 4 4
0-1: Mitigated corrosion rates from two monitoring within 10%
2-3: Mitigated corrosion rates from two monitoring within 11-25%
4-5: Mitigated corrosion rates from two monitoring within > 25%
32 EC 2 2 2 2 2 2 2 2 2 2 2 2 2 2 2
0-1: Frequency of inspection based on RBI
2-3: Frequency of inspection based on engineering processes
4-5: More than 10 years without inspection
34 4 4 4 4 4 4 4 4 4 4 4 4 4 4 4
0-1: Corrosion rate from monitoring and inspection within 10%
2-3: Corrosion rate from monitoring and inspection within 11-25%
4-5: Corrosion rate from monitoring and inspection within >25%

9. Measurement
The results and the rationale for assigning the scores for the KPIs for Measurements are shown in
Table 9 and the rationale for the KPI scores is described in the following sections.
Table 9 Summary of KPI for Measurement
KPI 35: Measurement
No information is available on how various measurements (such as temperature and pressure).
KPI 36: Validation of the Measured data
The data used for corrosion analysis is not validated using a formal approach.
10. Maintenance
The results and the rationale for assigning the scores for the KPIs for Maintenance are shown in
Table 10 and the rationale for the KPI scores is described in the following sections.
KPI 8: Normal Operating Conditions
Normal operating conditions are maintained most of the time for all the gathering pipelines.
KPI 15: Commissioning
All the gathering pipelines were adequately hydrotested but there is not a baseline with ILI.
KPI 37: Procedures for maintenance schedule
The risk level of the sections of the pipelines has been established as part of the implementation
of the ECDA and MP-ICDA methodologies. However, maintenance decisions are based on service
time or time of last inspection and are not risk based.
KPI 38: Maintenance activities
The maintenance activities are normally planned, but there are some occasions that the tasks are
not completed due to reductions in personnel or budget.
KP
I
Pa
d G
- P
ad
D
Pa
d D
- Y
Pa
d J
- P
ad
C
Pa
d F
- P
ad
A
Pa
d A
- E
PF
Lin
e 1
Pa
d A
- E
PF
Lin
e 2
Pa
d K
- Y
Pa
d H
- P
ad
J
PC
C B
- P
CC
C
PC
C C
- E
PF
DB
M -
Na
po
No
rte
AP
K-E
CB
EC
B -
EP
F
EP
F -
Pa
d L
Pa
d T
- T
ee
Remarks:
35 3 3 3 3 3 3 4 4 4 4 4 4 4 4 4
0-1: All corrosion related data is available and usable
2-3: All corrosion related data is available but not usable
4-5: Not all the corrosion related data is available
36 4 4 4 4 4 4 4 4 4 4 4 4 4 4 4
0-1: Data validated according to documented procedure
2-3: Data not properly validated but used for corrosion rate
4-5: Data not properly validated and used to guide corrosion rate

Table 10 Summary of KPI for Maintenance
KPI 43: Workforce Capacity
The number of workers to control internal and external corrosion has been significantly reduced
even though the area of responsibility has increased considerably. In addition, the personnel of the
maintenance and operation departments have not a clear definition of the responsibilities between
external and internal corrosion control.
KPI 44: Workforce Experience and Knowledge
Most of the personnel related with internal and external corrosion control have more than 5 years
of experience in similar areas.
KPI 45: Data to Database
There is no clearly established data management process.
KPI 46: Data from Database
Refer to KPI 45.
11. Management
The results and the rationale for assigning the scores for the KPIs for Management are shown in
Table 11 and the rationale for the KPI scores is described in the following sections.
KP
I
Pa
d G
- P
ad
D
Pa
d D
- Y
Pa
d J
- P
ad
C
Pa
d F
- P
ad
A
Pa
d A
- E
PF
Lin
e 1
Pa
d A
- E
PF
Lin
e 2
Pa
d K
- Y
Pa
d H
- P
ad
J
PC
C B
- P
CC
C
PC
C C
- E
PF
DB
M -
Na
po
No
rte
AP
K-E
CB
EC
B -
EP
F
EP
F -
Pa
d L
Pa
d T
- T
ee
Remarks:
8 3 3 3 3 3 3 3 3 3 3 3 3 3 3 3
0-1: Operating conditions within range
2-3: 10% Outside proper operating conditions
4-5: Frequent inadequate operating conditions
15 3 3 3 3 3 3 3 3 3 3 3 3 3 3 3
0-1: Proper commissioning and baseline established
2-3: Proper commissioning but non baseline established
4-5: Improper commissioning
37 4 4 4 4 4 4 4 4 4 4 4 4 4 4 4
0-1: Preventive maintenance based on risk before ALARP
2-3: Preventive maintenance based on higher risk levels
4-5: Corrective maintenance
38 3 3 3 3 3 3 3 3 3 3 3 3 3 3 3
0-1: All maintenance activities are adequately planned
2-3: Some delays for the implementation of maintenance activities
4-5: Frequent changes to maintenance activities
43 4 4 4 4 4 4 4 4 4 4 4 4 4 4 4
0-1: Corrosion personnel enough and with proper training
2-3: Corrosion personnel is enough and some training
4-5: Insufficient corrosion personnel and training
44 2 2 2 2 2 2 2 2 2 2 2 2 2 2 2
0-1: All personnel have more than five years of experience
2-3: Only key personnel have more than 5 years of experience
4-5: Unknown experience of corrosion personnel
45 4 4 4 4 4 4 4 4 4 4 4 4 4 4 4
0-1: Automatic collection and storage of corrosion data
2-3: Data measured and manually stored
4-5: Not adequate management of data
46 4 4 4 4 4 4 4 4 4 4 4 4 4 4 4
0-1: Data verified, stored and proactively used
2-3: Data verified and stored but not used proactively
4-5: Not adequate management of data

KPI 47: Internal Communication Strategy
There is an internal communication strategy for the topics related to corrosion control, however
the strategy is not always practiced or documented.
KPI 48: External Communication Strategy
There is a communication department but is not regularly providing information to external parties
about topics related to corrosion control.
KPI 49: Corrosion Management Review
There is not a fixed schedule for reviewing all the activities related to corrosion control.
KPI 50: Failure Frequency
In most of the EY gathering pipelines there have not been any failure.
Table 11 Summary of KPI for Management
12. Results of Application of Fifty KPIs to the Gathering Pipelines EY
The results of the application of the fifty KPIs are shown on Figures 7 to 21.
KP
I
Pa
d G
- P
ad
D
Pa
d D
- Y
Pa
d J
- P
ad
C
Pa
d F
- P
ad
A
Pa
d A
- E
PF
Lin
e 1
Pa
d A
- E
PF
Lin
e 2
Pa
d K
- Y
Pa
d H
- P
ad
J
PC
C B
- P
CC
C
PC
C C
- E
PF
DB
M -
Na
po
No
rte
AP
K-E
CB
EC
B -
EP
F
EP
F -
Pa
d L
Pa
d T
- T
ee
Remarks:
47 2 2 2 2 2 2 2 2 2 2 2 2 2 2 2
0-1: Proper internal communication
2-3: Some internal communication
4-5: Improper internal communications
48 3 3 3 3 3 3 3 3 3 3 3 3 3 3 3
0-1: Proper external communication
2-3: Some external communication
4-5: Improper external communications
49 4 4 4 4 4 4 4 4 4 4 4 4 4 4 4
0-1: Annual revision of KPIs
2-3: Revision of KPIs every 2-5 years
4-5: Not established schedule for KPIs revision
50 1 1 1 1 3 1 1 1 1 1 3 1 1 1 1
0-1: Zero failures between KPIs reviews
2-3: Less than 5 failures between KPIs reviews
4-5: More than 5 failres between KPIs reviews

Figure 7 KPI Status Pad G-Pad D Gathering Pipeline, PAM
Figure 8 KPI Status Pad D-Y Gathering Pipeline, PAM
3 40
Pad G - Pad D 3 39
2 15 4
Internal Corrosion 1 14 3 36
2 12 4 35
2 11 2 33
1 10 2 4 32 2
3 3 9 4 19 4 27 4 44
59% 3 3 4 8 2 18 4 26 3 43
0 2 3 7 1 17 4 25 4 38 41%
1 6 16 24 37M
anag
emen
t
2
Mo
del
2
Mit
igat
ion
3
Mo
nito
ring
4
Mai
nten
ance
4
4 4 6 4 20 3 28 4 45 4
5 4 7 3 21 4 29 4 46 2
49 1 8 1 22 3 30 4 47 3
50 9 3 23 31 2 48
10 2 32 4
11 4 34 3
13 2 35 4
Colour Score External Corrosion 14 3 36
Good 0 to 1 15 3
Fair 2 to 3 41 3
Poor 4 to 5 42
Corrosion( 58 %)
CorrosionControl(42 %)
3 40
Pad D - Y 3 39
2 15 4
Internal Corrosion 1 14 3 36
2 12 4 35
2 11 2 33
1 10 2 4 32 2
3 3 9 4 19 4 27 4 44
59% 3 3 4 8 2 18 4 26 3 43
0 2 3 7 1 17 4 25 4 38 41%
1 6 16 24 37
Man
agem
ent
2
Mo
del
2
Mit
igat
ion
3
Mo
nito
ring
4
Mai
nten
ance
4
4 4 6 4 20 3 28 4 45 4
5 4 7 3 21 4 29 4 46 2
49 1 8 1 22 3 30 4 47 3
50 9 3 23 31 2 48
10 2 32 4
11 4 34 3
13 2 35 4
Colour Score External Corrosion 14 3 36
Good 0 to 1 15 3
Fair 2 to 3 41 3
Poor 4 to 5 42
Corrosion( 58 %)
CorrosionControl(42 %)

Figure 9 KPI Status Pad J-Pad C Gathering Pipeline, PAM
Figure 10 KPI Status Pad F-Pad A Gathering Pipeline, PAM
3 40
Pad J - Pad C 3 39
2 15 4
Internal Corrosion 3 14 3 36
2 12 4 35
2 11 4 33
1 10 2 4 32 2
3 3 9 4 19 4 27 4 44
61% 2 3 4 8 2 18 4 26 3 43
4 2 3 7 1 17 4 25 4 38 39%
1 6 16 24 37M
anag
emen
t
1
Mo
del
2
Mit
igat
ion
3
Mo
nito
ring
4
Mai
nten
ance
4
4 4 6 4 20 3 28 4 45 4
5 4 7 3 21 4 29 4 46 2
49 1 8 1 22 3 30 4 47 3
50 9 3 23 31 2 48
10 2 32 4
11 4 34 3
13 2 35 4
Colour Score External Corrosion 14 3 36
Good 0 to 1 15 3
Fair 2 to 3 41 3
Poor 4 to 5 42
Corrosion( 61 %)
CorrosionControl(39 %)
3 40
Pad F - Pad A 3 39
2 15 4
Internal Corrosion 3 14 3 36
2 12 4 35
2 11 4 33
1 10 2 4 32 2
3 3 9 4 19 4 27 4 44
61% 3 3 4 8 2 18 4 26 3 43
4 2 3 7 1 17 4 25 4 38 39%
1 6 16 24 37
Man
agem
ent
2
Mo
del
2
Mit
igat
ion
3
Mo
nito
ring
4
Mai
nten
ance
4
4 4 6 4 20 3 28 4 45 4
5 4 7 3 21 4 29 4 46 2
49 1 8 1 22 3 30 4 47 3
50 9 3 23 31 2 48
10 2 32 4
11 4 34 3
13 2 35 4
Colour Score External Corrosion 14 3 36
Good 0 to 1 15 3
Fair 2 to 3 41 3
Poor 4 to 5 42
Corrosion( 61 %)
CorrosionControl(39 %)

Figure 11 KPI Status Pad A-EPF 1 Gathering Pipeline, PAM
Figure 12 KPI Status Pad A-EPF 2 Gathering Pipeline, PAM
3 40
Pad A - EPF Line 1 3 39
2 15 4
Internal Corrosion 1 14 3 36
2 12 4 35
2 11 2 33
1 10 2 4 32 2
3 3 9 4 19 4 27 4 44
59% 3 3 4 8 2 18 4 26 3 43
0 2 3 7 1 17 4 25 4 38 41%
1 6 16 24 37M
anag
emen
t
2
Mo
del
2
Mit
igat
ion
3
Mo
nito
ring
4
Mai
nten
ance
4
4 4 6 4 20 3 28 4 45 4
5 4 7 3 21 4 29 4 46 2
49 3 8 1 22 3 30 4 47 3
50 9 3 23 31 2 48
10 2 32 4
11 4 34 3
13 2 35 4
Colour Score External Corrosion 14 3 36
Good 0 to 1 15 3
Fair 2 to 3 41 3
Poor 4 to 5 42
Corrosion( 59 %)
CorrosionControl(41 %)
3 40
Pad A - EPF Line 2 3 39
3 15 4
Internal Corrosion 3 14 3 36
2 12 4 35
2 11 4 33
1 10 2 4 32 2
3 3 9 4 19 4 27 4 44
61% 2 3 4 8 2 18 4 26 3 43
4 2 3 7 1 17 4 25 4 38 39%
1 6 16 24 37
Man
agem
ent
1
Mo
del
2
Mit
igat
ion
3
Mo
nito
ring
4
Mai
nten
ance
4
4 3 6 4 20 2 28 4 45 4
5 4 7 3 21 4 29 4 46 2
49 1 8 1 22 3 30 4 47 3
50 9 3 23 31 2 48
10 2 32 4
11 4 34 3
13 3 35 4
Colour Score External Corrosion 14 3 36
Good 0 to 1 15 3
Fair 2 to 3 41 3
Poor 4 to 5 42
Corrosion( 61 %)
CorrosionControl(39 %)

Figure 13 KPI Status Pad K-Y Gathering Pipeline, PAM
Figure 14 KPI Status Pad H-Pad J Gathering Pipeline, PAM
3 40
Pad K - Y 3 39
3 15 4
Internal Corrosion 3 14 4 36
2 12 4 35
2 11 4 33
1 10 3 4 32 2
3 3 9 4 19 4 27 4 44
61% 2 3 3 8 4 18 4 26 3 43
3 2 4 7 4 17 4 25 4 38 39%
1 6 16 24 37M
anag
emen
t
1
Mo
del
2
Mit
igat
ion
2
Mo
nito
ring
3
Mai
nten
ance
4
4 3 6 3 20 2 28 3 45 4
5 4 7 3 21 4 29 4 46 2
49 1 8 1 22 4 30 4 47 3
50 9 2 23 31 2 48
10 2 32 4
11 4 34 4
13 3 35 4
Colour Score External Corrosion 14 3 36
Good 0 to 1 15 3
Fair 2 to 3 41 3
Poor 4 to 5 42
Corrosion( 63 %)
CorrosionControl(37 %)
3 40
Pad H - Pad J 3 39
3 15 4
Internal Corrosion 3 14 4 36
2 12 4 35
2 11 3 33
1 10 2 4 32 2
3 3 9 4 19 4 27 4 44
60% 3 3 3 8 3 18 4 26 3 43
4 2 4 7 4 17 4 25 4 38 40%
1 6 16 24 37
Man
agem
ent
2
Mo
del
2
Mit
igat
ion
2
Mo
nito
ring
3
Mai
nten
ance
4
4 2 6 3 20 2 28 3 45 4
5 4 7 3 21 4 29 4 46 2
49 1 8 1 22 2 30 4 47 3
50 9 2 23 31 2 48
10 2 32 4
11 4 34 4
13 3 35 4
Colour Score External Corrosion 14 3 36
Good 0 to 1 15 3
Fair 2 to 3 41 3
Poor 4 to 5 42
Corrosion( 61 %)
CorrosionControl(39 %)

Figure 15 KPI Status PCC B-PCC C Gathering Pipeline, PAM
Figure 16 KPI Status PCC C-EPF Gathering Pipeline, PAM
3 40
PCC B - PCC C 3 39
3 15 4
Internal Corrosion 4 14 4 36
3 12 4 35
3 11 3 33
3 10 2 4 32 2
4 3 9 4 19 4 27 4 44
62% 2 3 3 8 2 18 4 26 3 43
4 2 3 7 1 17 4 25 4 38 38%
1 6 16 24 37M
anag
emen
t
2
Mo
del
2
Mit
igat
ion
3
Mo
nito
ring
4
Mai
nten
ance
4
4 2 6 3 20 1 28 4 45 4
5 4 7 3 21 4 29 4 46 2
49 1 8 3 22 2 30 4 47 3
50 9 3 23 31 2 48
10 3 32 4
11 4 34 4
13 3 35 4
Colour Score External Corrosion 14 3 36
Good 0 to 1 15 3
Fair 2 to 3 41 3
Poor 4 to 5 42
Corrosion( 63 %)
CorrosionControl(37 %)
3 40
PCC C - EPF 3 39
3 15 4
Internal Corrosion 4 14 4 36
3 12 4 35
3 11 3 33
3 10 2 4 32 2
4 3 9 4 19 4 27 4 44
62% 2 3 3 8 2 18 4 26 3 43
4 2 3 7 1 17 4 25 4 38 38%
1 6 16 24 37
Man
agem
ent
2
Mo
del
2
Mit
igat
ion
3
Mo
nito
ring
4
Mai
nten
ance
4
4 2 6 3 20 1 28 4 45 4
5 4 7 3 21 4 29 4 46 2
49 1 8 3 22 2 30 4 47 3
50 9 3 23 31 2 48
10 3 32 4
11 4 34 4
13 3 35 4
Colour Score External Corrosion 14 3 36
Good 0 to 1 15 3
Fair 2 to 3 41 3
Poor 4 to 5 42
Corrosion( 63 %)
CorrosionControl(37 %)

Figure 17 KPI Status DBM-Napo Gathering Pipeline, PAM
Figure 18 KPI Status APK-ECB Gathering Pipeline, PAM
3 40
DBM - Napo Norte 3 39
3 15 4
Internal Corrosion 4 14 4 36
3 12 4 35
2 11 3 33
2 10 2 4 32 2
4 3 9 4 19 4 27 4 44
63% 4 3 3 8 2 18 4 26 3 43
4 2 3 7 4 17 4 25 4 38 37%
1 6 16 24 37M
anag
emen
t
4
Mo
del
2
Mit
igat
ion
2
Mo
nito
ring
3
Mai
nten
ance
4
4 1 6 3 20 1 28 3 45 4
5 4 7 3 21 4 29 4 46 2
49 3 8 2 22 2 30 4 47 3
50 9 2 23 31 2 48
10 3 32 4
11 4 34 4
13 3 35 4
Colour Score External Corrosion 14 3 36
Good 0 to 1 15 3
Fair 2 to 3 41 3
Poor 4 to 5 42
Corrosion( 62 %)
CorrosionControl(38 %)
3 40
APK-ECB 3 39
3 15 4
Internal Corrosion 4 14 4 36
3 12 4 35
3 11 3 33
3 10 2 4 32 2
5 3 9 4 19 4 27 4 44
64% 4 3 3 8 3 18 4 26 3 43
4 2 4 7 4 17 4 25 4 38 36%
1 6 16 24 37
Man
agem
ent
5
Mo
del
2
Mit
igat
ion
1
Mo
nito
ring
3
Mai
nten
ance
4
4 1 6 3 20 1 28 3 45 4
5 4 7 3 21 4 29 4 46 2
49 1 8 3 22 2 30 4 47 3
50 9 1 23 31 2 48
10 3 32 4
11 4 34 4
13 3 35 4
Colour Score External Corrosion 14 3 36
Good 0 to 1 15 3
Fair 2 to 3 41 3
Poor 4 to 5 42
Corrosion( 63 %)
CorrosionControl(37 %)

Figure 19 KPI Status ECB-EPF Gathering Pipeline, PAM
Figure 20 KPI Status EPF-Pad L Gathering Pipeline, PAM
3 40
ECB - EPF 3 39
3 15 4
Internal Corrosion 4 14 4 36
3 12 4 35
3 11 3 33
3 10 2 4 32 2
5 3 9 4 19 4 27 4 44
64% 4 3 3 8 3 18 4 26 3 43
4 2 4 7 4 17 4 25 4 38 36%
1 6 16 24 37M
anag
emen
t
5
Mo
del
2
Mit
igat
ion
1
Mo
nito
ring
3
Mai
nten
ance
4
4 1 6 3 20 1 28 3 45 4
5 4 7 3 21 4 29 4 46 2
49 1 8 3 22 2 30 4 47 3
50 9 1 23 31 2 48
10 3 32 4
11 4 34 4
13 3 35 4
Colour Score External Corrosion 14 3 36
Good 0 to 1 15 3
Fair 2 to 3 41 3
Poor 4 to 5 42
Corrosion( 63 %)
CorrosionControl(37 %)
3 40
EPF - Pad L 3 39
3 15 4
Internal Corrosion 4 14 4 36
3 12 4 35
2 11 3 33
3 10 2 4 32 2
3 3 9 4 19 4 27 4 44
60% 1 3 4 8 3 18 4 26 3 43
4 2 3 7 1 17 4 25 4 38 40%
1 6 16 24 37
Man
agem
ent
0
Mo
del
2
Mit
igat
ion
2
Mo
nito
ring
3
Mai
nten
ance
4
4 1 6 4 20 2 28 3 45 4
5 4 7 3 21 4 29 4 46 2
49 1 8 3 22 2 30 4 47 3
50 9 1 23 31 2 48
10 3 32 4
11 4 34 4
13 3 35 4
Colour Score External Corrosion 14 3 36
Good 0 to 1 15 3
Fair 2 to 3 41 3
Poor 4 to 5 42
Corrosion( 63 %)
CorrosionControl(37 %)

Figure 21 KPI Status Pad T-Tee Gathering Pipeline, PAM
13. Recommendations The first recommendation of the analysis is to improve internal and external corrosion monitoring
for the EY gathering pipelines, by increasing the number of probes, including probes on critical
locations, and using complimentary monitoring techniques. This recommendation should be also
applied to new pipelines. However, probes are not effective in monitoring localized corrosion.
Another option is to use ILI. However, the majority of the gathering pipelines are internally coated
and operate at temperatures that will require cooling fluids for the inspection. Therefore, for such
pipelines the use of ILI is difficult and impractical. ILI is a better option to detect localized internal
and external corrosion but is not effective for internally coated pipelines. Hence, ILI is not
recommended as the primary option.
14. Conclusions On average the corrosion score, according to the evaluation of 50 KPIs for the gathering pipelines
of EY was 61% while the corrosion control score was 39%.
Internal and external corrosion monitoring of the EY gathering pipelines is the weakest corrosion
control strategy according to the present analysis.
There is an opportunity for improvement by determining the corrosion rates before and after the
maintenance activities of the gathering pipelines.
3 40
Pad T - Tee 3 39
3 15 4
Internal Corrosion 3 14 4 36
2 12 4 35
2 11 3 33
1 10 4 4 32 2
3 3 9 4 19 4 27 4 44
60% 4 3 3 8 4 18 4 26 3 43
3 2 4 7 4 17 4 25 4 38 40%
1 6 16 24 37M
anag
emen
t
3
Mo
del
2
Mit
igat
ion
2
Mo
nito
ring
3
Mai
nten
ance
4
4 0 6 3 20 1 28 3 45 4
5 4 7 3 21 4 29 4 46 2
49 1 8 1 22 2 30 4 47 3
50 9 1 23 31 2 48
10 2 32 4
11 4 34 4
13 3 35 4
Colour Score External Corrosion 14 3 36
Good 0 to 1 15 3
Fair 2 to 3 41 3
Poor 4 to 5 42
Corrosion( 63 %)
CorrosionControl(37 %)

There is a necessity to schedule regular meetings for the analysis of the corrosion control strategies
of the EY gathering pipelines.
The 5-M methodology using the 50 KPI is useful to determine areas for improvement for the
corrosion control strategies and to reduce the risk of failure due to degradation mechanisms such
as internal and external corrosion.
The 5-M methodology will facilitate a continuous improvement process for the corrosion control
of pipelines by Petroamazonas EP.
The 5-M methodology is complementary to the integrity assessment techniques such as ECDA
and MP-ICDA.
15. Acknowledgements The author is grateful for funding from The Secretariat of Higher Education, Science, Technology
and Innovation from the National Government of the Republic of Ecuador. The author is thankful
to the Maintenance Department of Petroamazonas EP and CorrMagnet Consulting Inc. for
providing the required data and for their guidance on this project, respectively.
16. References 1. Petroamazonas EP, “Daily production report,” Ecuador, 2017.
2. C. M. González, S. Arumugam, and P. Teevens, “MP-ICDA Analysis on Block 12 and
Block 15 Gathering Pipelines on Petroamazonas EP in Ecuador,” in Proceedings of the
CORROSION 2016. NACE International, 2016.
3. NACE/ANSI, “ANSI/NACE SP0502-2010. Standard Practice. Pipeline External
Corrosion Direct Assessment Methodology,” Houston, TX, 2010.
4. S. Papavinasam, Corrosion control in the oil and gas industry. Elsevier, 2013.
5. American Petroleum Institute (API), “API Specification 5L, Forty-fifth Edition,
Specification for Line Pipe,” Washington, DC, 2013.
6. R. Gummow, “Examining the controversy surrounding the-850 mv cp criteria,” Pipeline
& Gas Journal, vol. 237, no. 11, pp. 85–87, 2010.