kbc group company presentation 2q 2016€¦ · kbc group company presentation 2q 2016 kbc group -...
TRANSCRIPT
1
KBC GroupCompany presentation2Q 2016
KBC Group - Investor Relations Office – E-mail:
More information: www.kbc.com
2
This presentation is provided for informational purposes only. It does not constitute an offer to sell or the solicitation to buy anysecurity issued by the KBC Group.
KBC believes that this presentation is reliable, although some information is condensed and therefore incomplete. KBC cannot beheld liable for any loss or damage resulting from the use of the information.
This presentation contains non-IFRS information and forward-looking statements with respect to the strategy, earnings and capitaltrends of KBC, involving numerous assumptions and uncertainties. There is a risk that these statements may not be fulfilled andthat future developments differ materially. Moreover, KBC does not undertake any obligation to update the presentation in linewith new developments.
By reading this presentation, each investor is deemed to represent that it possesses sufficient expertise to understand the risksinvolved.
Important information for investors
3
2Q 2016 key takeaways for KBC Group
STRONG BUSINESS PERFORMANCE IN 2Q16Exceptionally good net result of 721m EUR in 2Q16 (and 1.11bn EUR in 1H16), as a result of:o Strong commercial bank-insurance franchises in our core markets and core activitieso Q-o-q increase in customer loan and deposit volumes in most of our core countrieso Slightly higher net interest income despite somewhat lower net interest margin q-o-qo Higher net fee and commission income q-o-q (in line with guidance), despite net asset management outflowso Higher net gains from financial instruments at fair value, higher realised AFS gains (mainly on Visa) and lower net other income o Combined ratio of 95% YTD. Excellent sales of both non-life and life insurance productso Good cost management resulted in a cost/income ratio of 56% YTD adjusted for specific items o Low impairment charges. Net loan provision release of 1m EUR in 2Q16 in Ireland. We are lowering our impairment guidance for Ireland
towards a 0m-40m EUR range for FY16
SOLID CAPITAL AND ROBUST LIQUIDITY POSITIONSo Common equity ratio (B3 phased-in) of 14.9% based on the Danish Compromise at end 1H16, which clearly exceeds the new minimum
capital requirements set by the ECB (9.75%) and the NBB (0.5%), i.e. an aggregate 10.25% for 2016. The B3 fully loaded common equityratio stood at 14.9% based on the Danish Compromise at end 1H16
o KBC remains adequately capitalised under 2016 EU-wide EBA stress testo Fully loaded B3 leverage ratio, based on current CRR legislation, amounted to 6.0% at KBC Groupo Continued strong liquidity position (NSFR at 123% and LCR at 132%) at end 1H16o Interim dividend:o KBC will pay an interim dividend of 1 EUR per share in November 2016, as an advance payment on the total dividend.o This is the start of an interim dividend policy whereby KBC aims to pay each year an interim dividend of 1 EUR per share*
o The current pay-out ratio policy (i.e. dividend + AT1 coupon) of at least 50% of consolidated profit is confirmed
* More details on slide 55
4
Contents
1
4
Strong solvency and solid liquidity
2Q 2016 wrap up
Annex 1: Company profile
2
2Q 2016 performance of KBC Group
3
2Q 2016 performance of business units
Annex 2: Other items
5
KBC Group
Section 1
2Q 2016 performance of KBC Group
6
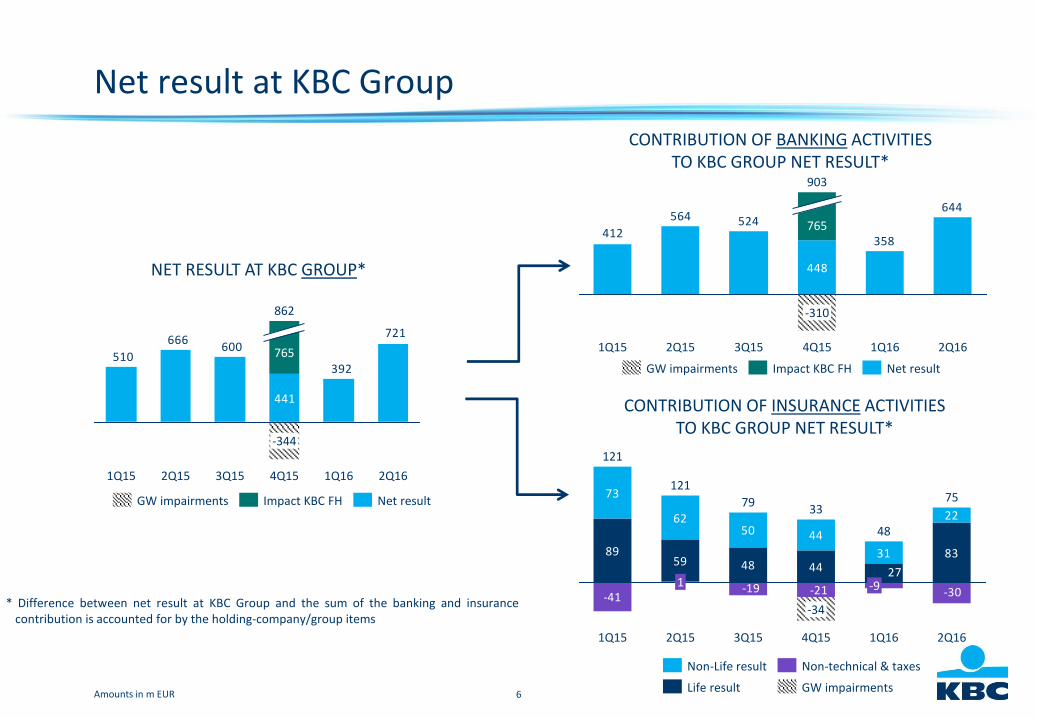
Net result at KBC Group
* Difference between net result at KBC Group and the sum of the banking and insurancecontribution is accounted for by the holding-company/group items
CONTRIBUTION OF BANKING ACTIVITIES TO KBC GROUP NET RESULT*
721
392
600666
510
441
1Q15 2Q161Q164Q15
862
765
-344
3Q152Q15
NET RESULT AT KBC GROUP*
644
358
524564
412
448
4Q15
903
765
-310
3Q152Q151Q15 2Q161Q16
-41
8959 48 44
73
6250 44
31
-21-19 -30
27
83
2233
-34
3Q15
79
2Q15
121
1
1Q15
121
2Q16
75
1Q16
48
-9
4Q15
CONTRIBUTION OF INSURANCE ACTIVITIES TO KBC GROUP NET RESULT*
Amounts in m EUR
Impact KBC FH Net resultGW impairments
GW impairments Impact KBC FH Net result
GW impairmentsLife result
Non-Life result Non-technical & taxes
7
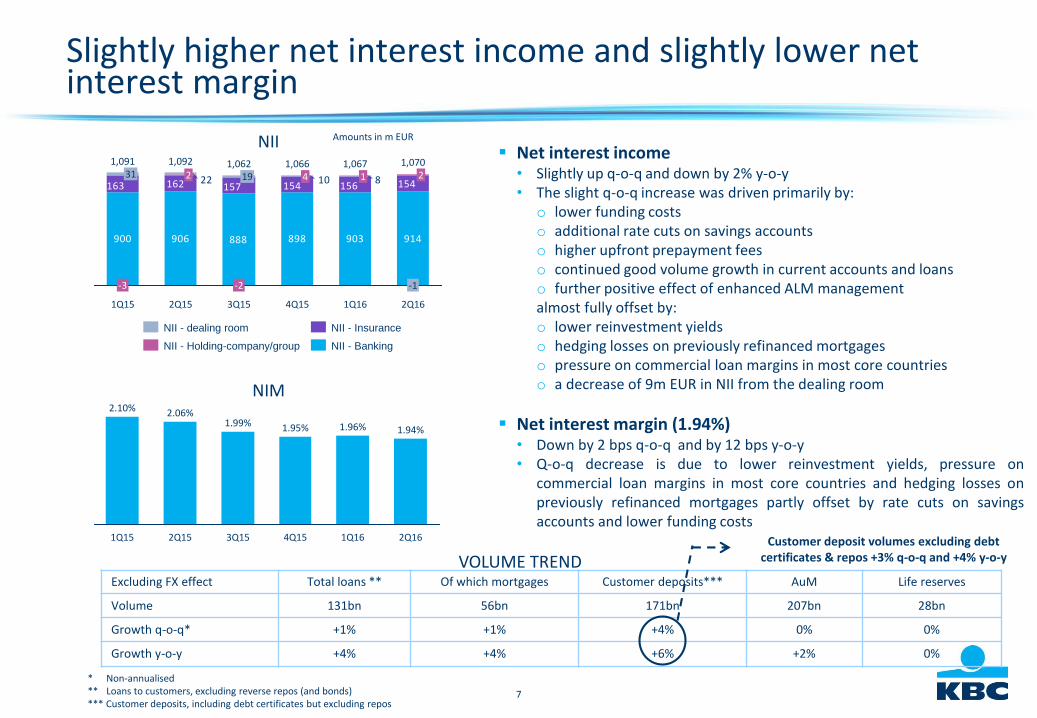
Slightly higher net interest income and slightly lower net interest margin
Net interest income• Slightly up q-o-q and down by 2% y-o-y• The slight q-o-q increase was driven primarily by:
o lower funding costso additional rate cuts on savings accountso higher upfront prepayment feeso continued good volume growth in current accounts and loanso further positive effect of enhanced ALM managementalmost fully offset by:o lower reinvestment yieldso hedging losses on previously refinanced mortgageso pressure on commercial loan margins in most core countrieso a decrease of 9m EUR in NII from the dealing room
Net interest margin (1.94%)• Down by 2 bps q-o-q and by 12 bps y-o-y• Q-o-q decrease is due to lower reinvestment yields, pressure on
commercial loan margins in most core countries and hedging losses onpreviously refinanced mortgages partly offset by rate cuts on savingsaccounts and lower funding costs
NIM
NII
906 898 903900 888
156154162
914
15415716381022 1
4Q15
1,0664
3Q15
1,062
-2
19
2Q15
1,092
2
1Q15
1,091
-3
31
2Q16
1,0702
-1
1Q16
1,067
2Q16
1.94%
1Q16
1.96%
4Q15
1.95%
3Q15
1.99%
2Q15
2.06%
1Q15
2.10%
Amounts in m EUR
NII - Banking
NII - Insurance
NII - Holding-company/group
NII - dealing room
* Non-annualised ** Loans to customers, excluding reverse repos (and bonds)*** Customer deposits, including debt certificates but excluding repos
VOLUME TRENDExcluding FX effect Total loans ** Of which mortgages Customer deposits*** AuM Life reserves
Volume 131bn 56bn 171bn 207bn 28bn
Growth q-o-q* +1% +1% +4% 0% 0%
Growth y-o-y +4% +4% +6% +2% 0%
Customer deposit volumes excluding debtcertificates & repos +3% q-o-q and +4% y-o-y

8
Higher net fee and commission income (in line with guidance)
Net fee and commission income• Up by 4% q-o-q and down by 23% y-o-y
• Q-o-q increase was the result chiefly of:o higher management fees from mutual funds & unit-
linked life insurance products (thanks to reset date CPPI)o higher fees from credit files and bank guarantees (due to
more mortgage refinancings in BE, CZ and Slovakia)o higher fees from payment services in the Czech Republic
and Hungaryo lower commissions paid on insurance salespartly offset by:o lower entry fees from mutual funds & unit-linked life
insurance productso lower securities related fees in Belgium
• Y-o-y decline resulted chiefly in the Belgium Business Unitfrom lower management and entry fees from mutual fundsand unit-linked life insurance products, lower fees fromsecurities transactions, lower fees from credit files and bankguarantees and higher commissions paid on insurance sales
• Net F&C income will remain an important top-linecontributor going forward
Assets under management (207bn EUR)• Flat q-o-q as a result of net outflows (-1%) and a positive
price effect (+1%)
• Rose by 2% y-o-y owing to net inflows (+2%) anda negative price effect (-1%)
F&C
Amounts in m EUR
518 530453 445 422
-76-70-69-64-59 -71
432
360
-1
1Q16
346
4Q15
371
-4
3Q15
383
-1
2Q15
465
-1
1Q15
459
2Q16
F&C - contribution of holding-company/group
F&C - banking contribution
F&C - insurance contribution
Amounts in bn EUR
AuM
207207209200204208
3Q152Q151Q15 2Q161Q164Q15
9
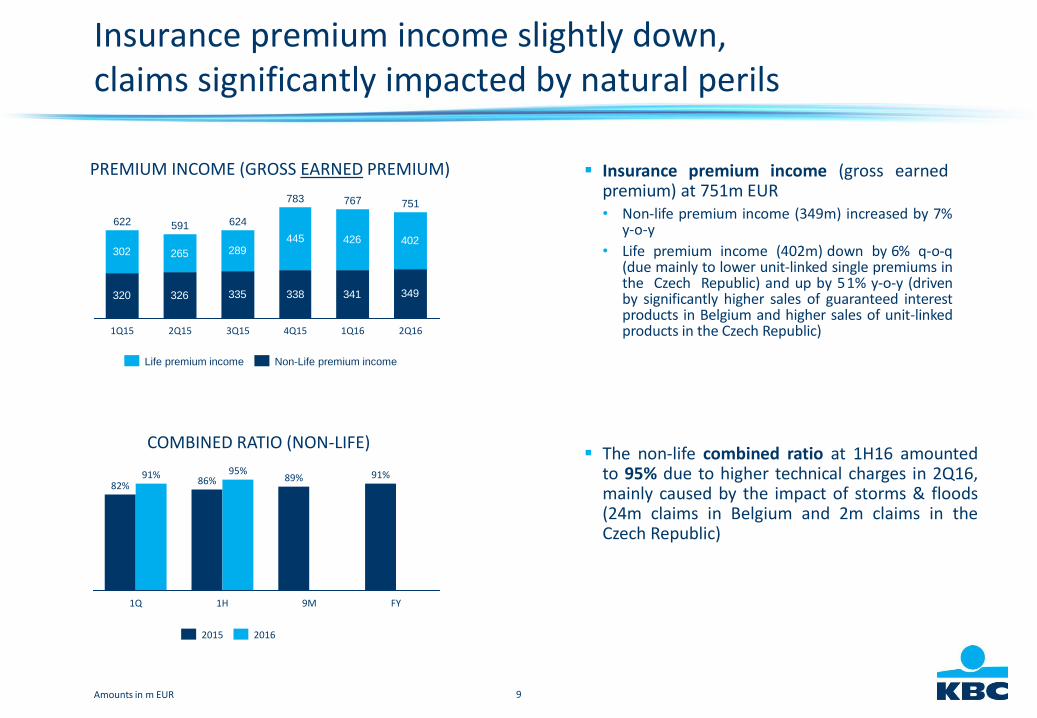
Insurance premium income (gross earned premium) at 751m EUR• Non-life premium income (349m) increased by 7%
y-o-y
• Life premium income (402m) down by 6% q-o-q(due mainly to lower unit-linked single premiums inthe Czech Republic) and up by 51% y-o-y (drivenby significantly higher sales of guaranteed interestproducts in Belgium and higher sales of unit-linkedproducts in the Czech Republic)
The non-life combined ratio at 1H16 amountedto 95% due to higher technical charges in 2Q16,mainly caused by the impact of storms & floods(24m claims in Belgium and 2m claims in theCzech Republic)
Amounts in m EUR
Insurance premium income slightly down, claims significantly impacted by natural perils
COMBINED RATIO (NON-LIFE)
PREMIUM INCOME (GROSS EARNED PREMIUM)
89%95%
86%91%
1Q
91%
FY1H
82%
9M
2015 2016
320 326 335 338 341
302 265 289445 426
349
402
1Q16
751
2Q16
767
622
3Q151Q15
591
2Q15
783
4Q15
624
Non-Life premium incomeLife premium income
10
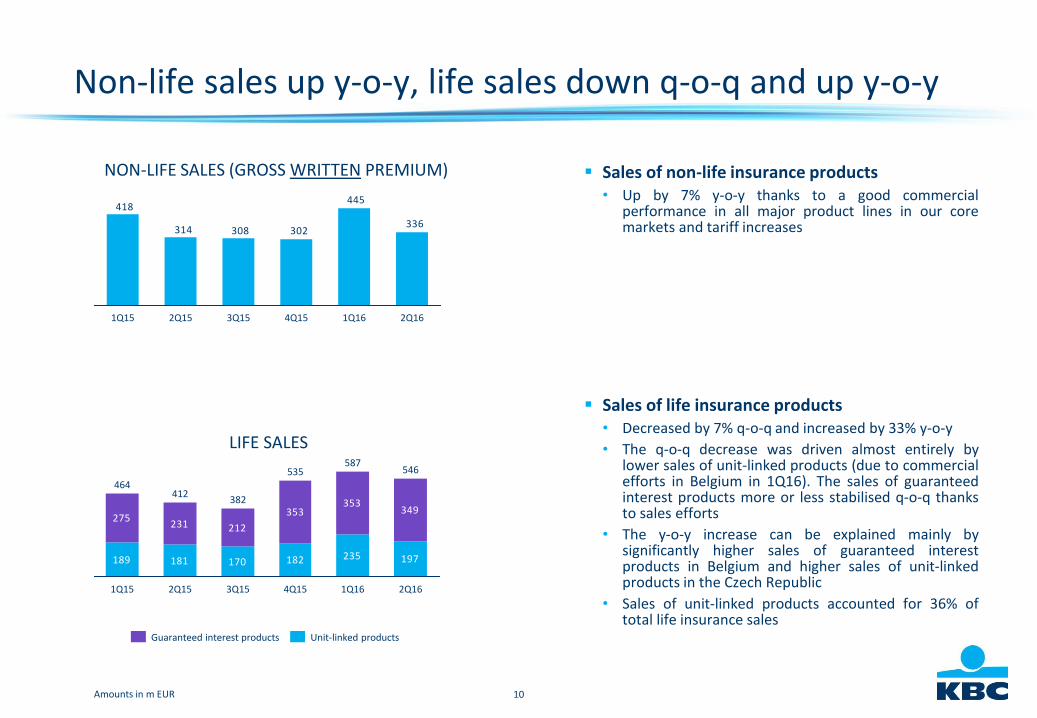
Non-life sales up y-o-y, life sales down q-o-q and up y-o-y
Sales of non-life insurance products• Up by 7% y-o-y thanks to a good commercial
performance in all major product lines in our coremarkets and tariff increases
Sales of life insurance products• Decreased by 7% q-o-q and increased by 33% y-o-y
• The q-o-q decrease was driven almost entirely bylower sales of unit-linked products (due to commercialefforts in Belgium in 1Q16). The sales of guaranteedinterest products more or less stabilised q-o-q thanksto sales efforts
• The y-o-y increase can be explained mainly bysignificantly higher sales of guaranteed interestproducts in Belgium and higher sales of unit-linkedproducts in the Czech Republic
• Sales of unit-linked products accounted for 36% oftotal life insurance sales
LIFE SALES
NON-LIFE SALES (GROSS WRITTEN PREMIUM)
189 181 170 182 235
275231 212
353353
197
349
1Q16 2Q164Q15
535
3Q15
382
2Q15
412
1Q15
464
587546
Unit-linked productsGuaranteed interest products
Amounts in m EUR
336
445
302308314
418
2Q161Q164Q153Q152Q151Q15
11
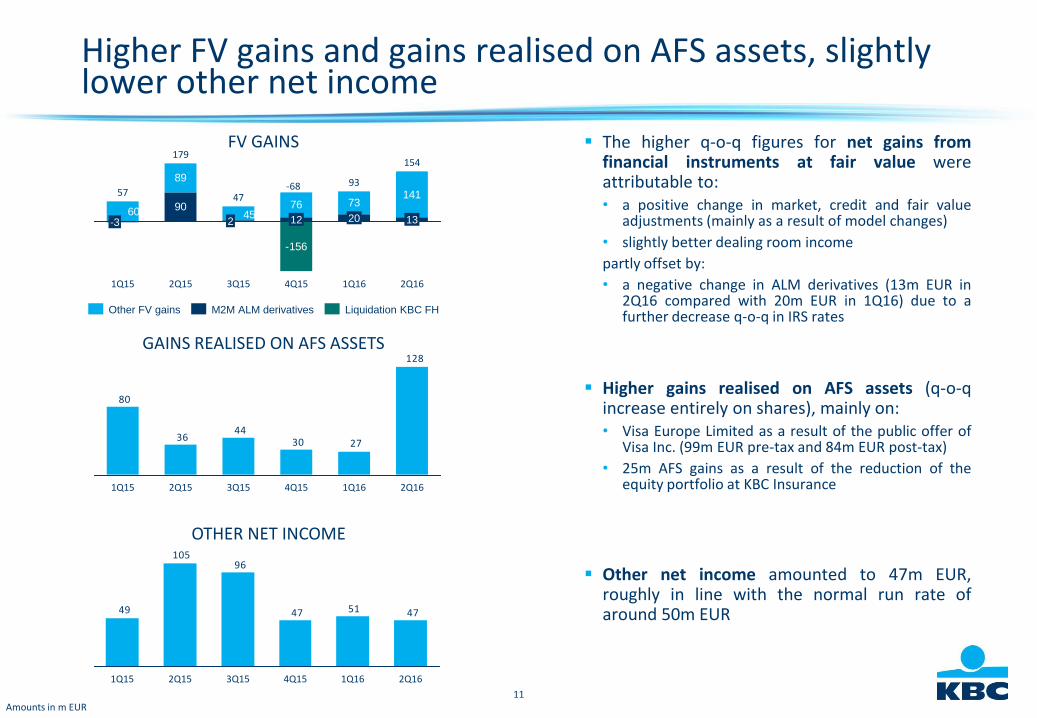
Higher FV gains and gains realised on AFS assets, slightly lower other net income
The higher q-o-q figures for net gains fromfinancial instruments at fair value wereattributable to:• a positive change in market, credit and fair value
adjustments (mainly as a result of model changes)
• slightly better dealing room income
partly offset by:
• a negative change in ALM derivatives (13m EUR in2Q16 compared with 20m EUR in 1Q16) due to afurther decrease q-o-q in IRS rates
Higher gains realised on AFS assets (q-o-qincrease entirely on shares), mainly on:• Visa Europe Limited as a result of the public offer of
Visa Inc. (99m EUR pre-tax and 84m EUR post-tax)
• 25m AFS gains as a result of the reduction of theequity portfolio at KBC Insurance
Other net income amounted to 47m EUR,roughly in line with the normal run rate ofaround 50m EUR
FV GAINS
Amounts in m EUR
89
76 73
-156
904560
141
4Q15
2012
1Q16
93
2Q15
47
3Q15 2Q16
2
154179
1Q15
57
-3 13
128
273044
36
80
1Q15 2Q161Q164Q153Q152Q15
GAINS REALISED ON AFS ASSETS
475147
96105
49
2Q162Q15 4Q15 1Q161Q15 3Q15
OTHER NET INCOME
Other FV gains Liquidation KBC FHM2M ALM derivatives
-68
12
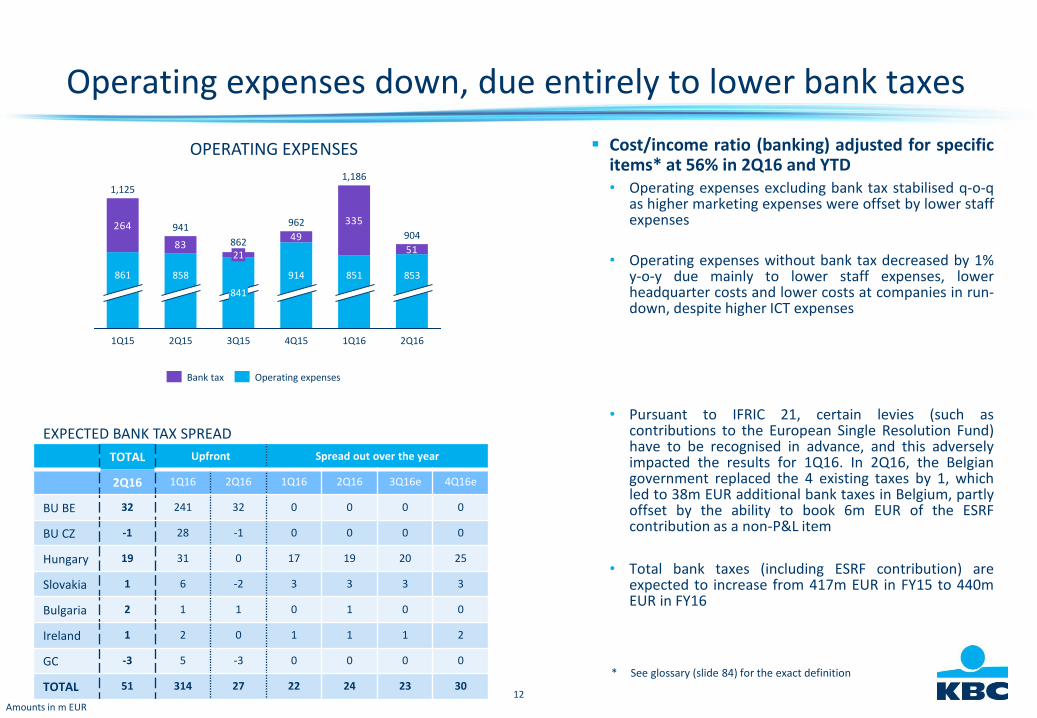
Operating expenses down, due entirely to lower bank taxes
Cost/income ratio (banking) adjusted for specificitems* at 56% in 2Q16 and YTD• Operating expenses excluding bank tax stabilised q-o-q
as higher marketing expenses were offset by lower staffexpenses
• Operating expenses without bank tax decreased by 1%y-o-y due mainly to lower staff expenses, lowerheadquarter costs and lower costs at companies in run-down, despite higher ICT expenses
• Pursuant to IFRIC 21, certain levies (such ascontributions to the European Single Resolution Fund)have to be recognised in advance, and this adverselyimpacted the results for 1Q16. In 2Q16, the Belgiangovernment replaced the 4 existing taxes by 1, whichled to 38m EUR additional bank taxes in Belgium, partlyoffset by the ability to book 6m EUR of the ESRFcontribution as a non-P&L item
• Total bank taxes (including ESRF contribution) areexpected to increase from 417m EUR in FY15 to 440mEUR in FY16
OPERATING EXPENSES
264
8349
335
51
1,125
861 853
1Q16
1,186
851
4Q15
962
914
3Q15
862
841
21
2Q15
941
858
1Q15 2Q16
904
Operating expensesBank tax
* See glossary (slide 84) for the exact definition
Amounts in m EUR
TOTAL Upfront Spread out over the year
2Q16 1Q16 2Q16 1Q16 2Q16 3Q16e 4Q16e
BU BE 32 241 32 0 0 0 0
BU CZ -1 28 -1 0 0 0 0
Hungary 19 31 0 17 19 20 25
Slovakia 1 6 -2 3 3 3 3
Bulgaria 2 1 1 0 1 0 0
Ireland 1 2 0 1 1 1 2
GC -3 5 -3 0 0 0 0
TOTAL 51 314 27 22 24 23 30
EXPECTED BANK TAX SPREAD
13
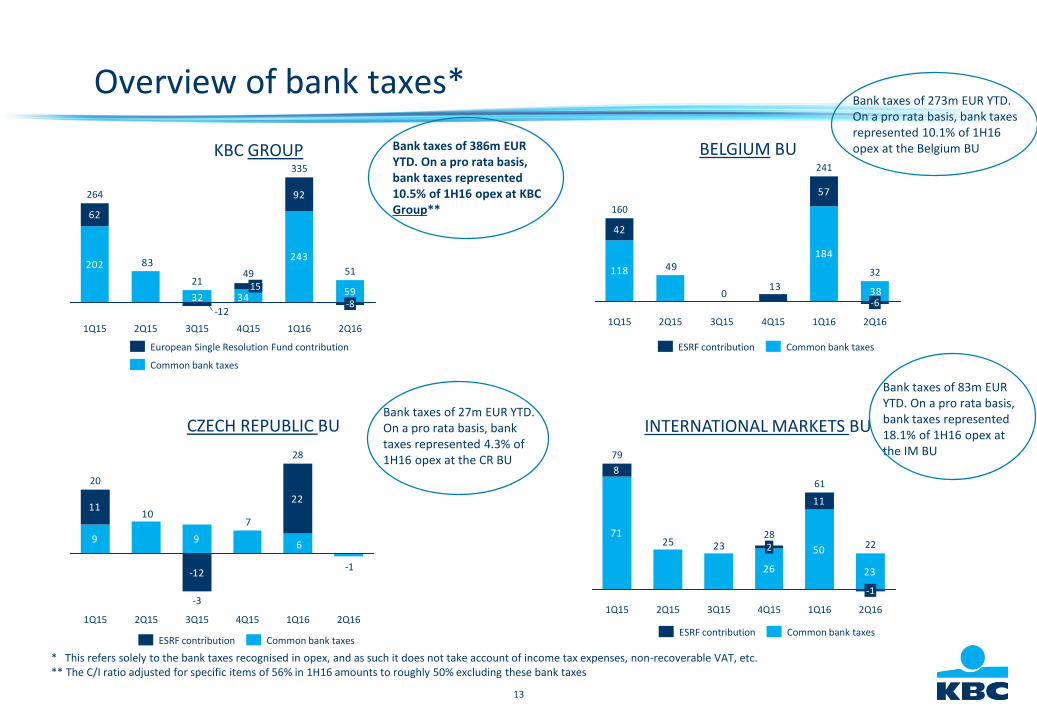
Overview of bank taxes*
INTERNATIONAL MARKETS BUCZECH REPUBLIC BU
BELGIUM BUKBC GROUP
71
26
502325
23
11
8
1Q15
79
2Q161Q16
61
4Q15
282
3Q152Q15
22
-1
Common bank taxesESRF contribution
118
18449
130
57
42
38
2Q161Q16
241
4Q153Q152Q151Q15
160
-6
32
Common bank taxesESRF contribution
9
-12
11
9
22
6
710
-1
3Q15
28
4Q15 2Q161Q16
-3
2Q151Q15
20
ESRF contribution Common bank taxes
202243
62
92
34
-12
83
3259
2Q151Q15
264
15
3Q15
21
4Q15
49
-8
1Q16
51
2Q16
335
European Single Resolution Fund contribution
Common bank taxes
* This refers solely to the bank taxes recognised in opex, and as such it does not take account of income tax expenses, non-recoverable VAT, etc.** The C/I ratio adjusted for specific items of 56% in 1H16 amounts to roughly 50% excluding these bank taxes
Bank taxes of 386m EUR YTD. On a pro rata basis, bank taxes represented10.5% of 1H16 opex at KBC Group**
Bank taxes of 273m EUR YTD. On a pro rata basis, bank taxes represented 10.1% of 1H16 opex at the Belgium BU
Bank taxes of 27m EUR YTD. On a pro rata basis, bank taxes represented 4.3% of 1H16 opex at the CR BU
Bank taxes of 83m EUR YTD. On a pro rata basis, bank taxes represented 18.1% of 1H16 opex at the IM BU
14
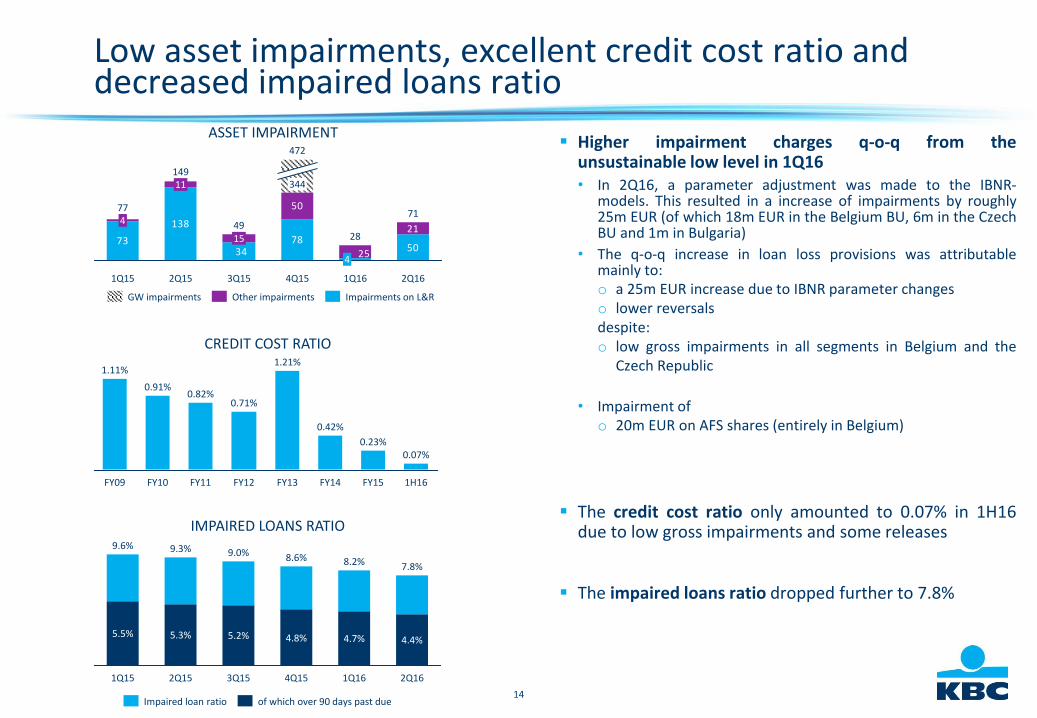
Low asset impairments, excellent credit cost ratio and decreased impaired loans ratio
Higher impairment charges q-o-q from theunsustainable low level in 1Q16• In 2Q16, a parameter adjustment was made to the IBNR-
models. This resulted in a increase of impairments by roughly25m EUR (of which 18m EUR in the Belgium BU, 6m in the CzechBU and 1m in Bulgaria)
• The q-o-q increase in loan loss provisions was attributablemainly to:o a 25m EUR increase due to IBNR parameter changeso lower reversalsdespite:o low gross impairments in all segments in Belgium and the
Czech Republic
• Impairment ofo 20m EUR on AFS shares (entirely in Belgium)
The credit cost ratio only amounted to 0.07% in 1H16due to low gross impairments and some releases
The impaired loans ratio dropped further to 7.8%
ASSET IMPAIRMENT
73
138
7834 50
21
25
50
2Q16
71
1Q16
28
4
4Q15
472
344
3Q15
4915
2Q15
14911
1Q15
774
IMPAIRED LOANS RATIO
2Q16
7.8%
4.4%
1Q16
8.2%
4.7%
4Q15
8.6%
4.8%
3Q15
9.0%
5.2%
2Q15
9.3%
5.3%
1Q15
9.6%
5.5%
CREDIT COST RATIO
1H16
0.07%
FY15
0.23%
FY14
0.42%
FY13
1.21%
FY12
0.71%
FY11
0.82%
FY10
0.91%
FY09
1.11%
of which over 90 days past dueImpaired loan ratio
Impairments on L&ROther impairmentsGW impairments
15
KBC Group
Section 2
2Q 2016 performance of business units
16
BELGIUM BUSINESS UNIT
CFO SERVICES
CRO SERVICES
CORPORATE STAFF
BELGIUMCZECH
REPUBLICINTERNATIONAL
MARKETS
17
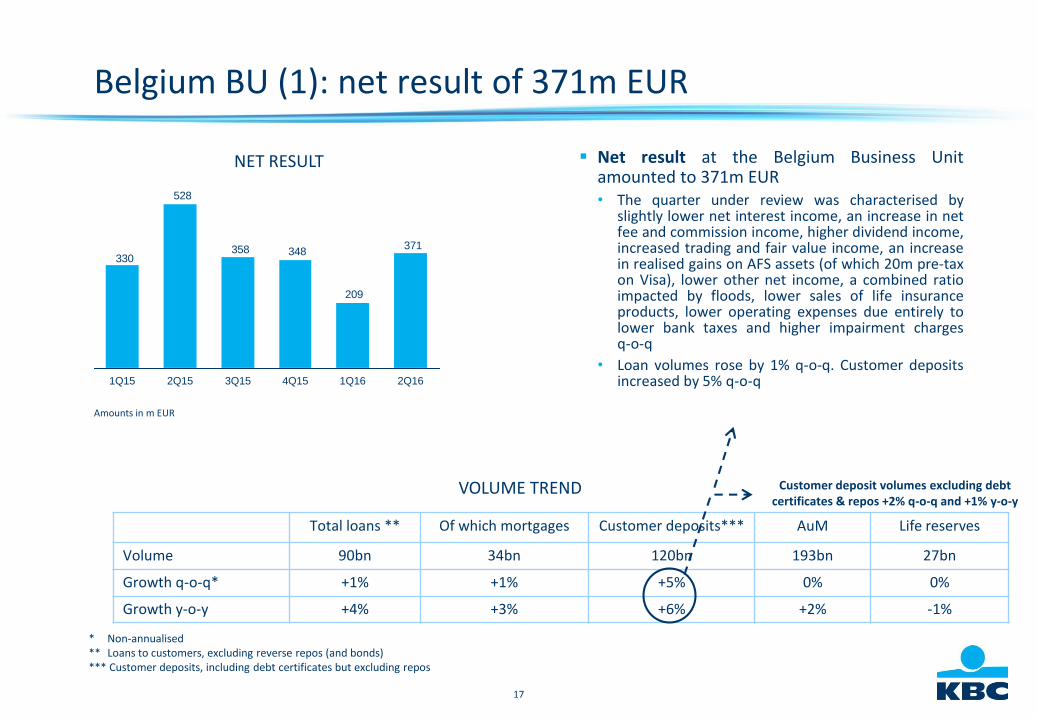
Belgium BU (1): net result of 371m EUR
Net result at the Belgium Business Unitamounted to 371m EUR• The quarter under review was characterised by
slightly lower net interest income, an increase in netfee and commission income, higher dividend income,increased trading and fair value income, an increasein realised gains on AFS assets (of which 20m pre-taxon Visa), lower other net income, a combined ratioimpacted by floods, lower sales of life insuranceproducts, lower operating expenses due entirely tolower bank taxes and higher impairment chargesq-o-q
• Loan volumes rose by 1% q-o-q. Customer depositsincreased by 5% q-o-q
* Non-annualised ** Loans to customers, excluding reverse repos (and bonds)*** Customer deposits, including debt certificates but excluding repos
VOLUME TREND
Total loans ** Of which mortgages Customer deposits*** AuM Life reserves
Volume 90bn 34bn 120bn 193bn 27bn
Growth q-o-q* +1% +1% +5% 0% 0%
Growth y-o-y +4% +3% +6% +2% -1%
371
209
348358
528
330
4Q153Q15 1Q16 2Q161Q15 2Q15
NET RESULT
Amounts in m EUR
Customer deposit volumes excluding debtcertificates & repos +2% q-o-q and +1% y-o-y
18
Belgium BU (2): slightly lower NII and NIM
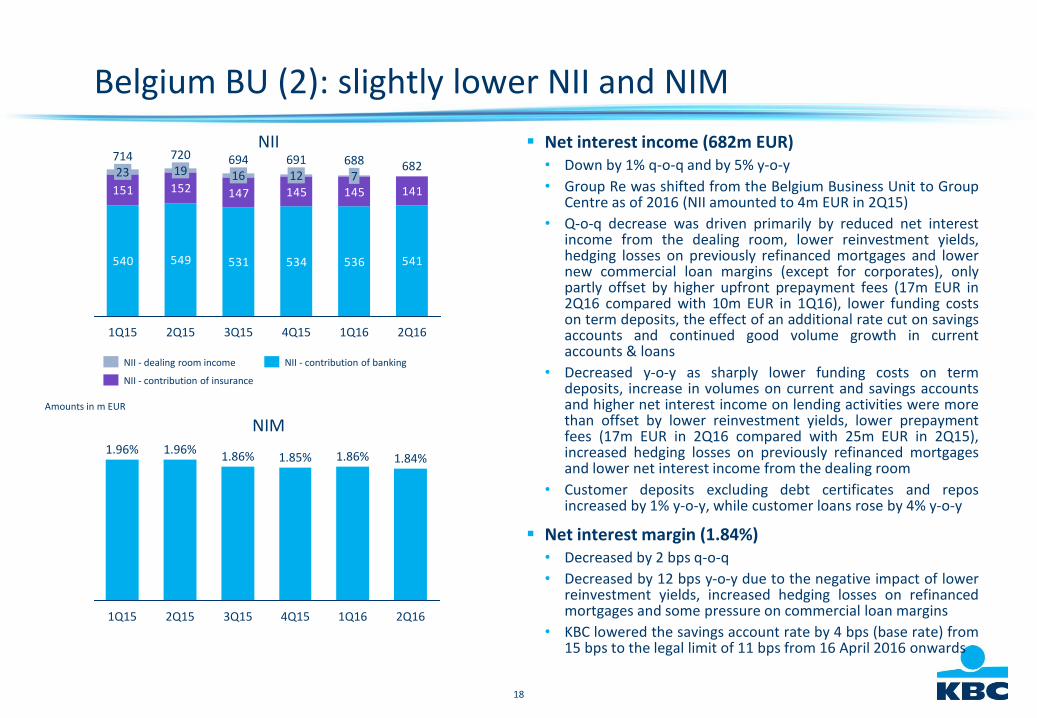
Net interest income (682m EUR)• Down by 1% q-o-q and by 5% y-o-y
• Group Re was shifted from the Belgium Business Unit to GroupCentre as of 2016 (NII amounted to 4m EUR in 2Q15)
• Q-o-q decrease was driven primarily by reduced net interestincome from the dealing room, lower reinvestment yields,hedging losses on previously refinanced mortgages and lowernew commercial loan margins (except for corporates), onlypartly offset by higher upfront prepayment fees (17m EUR in2Q16 compared with 10m EUR in 1Q16), lower funding costson term deposits, the effect of an additional rate cut on savingsaccounts and continued good volume growth in currentaccounts & loans
• Decreased y-o-y as sharply lower funding costs on termdeposits, increase in volumes on current and savings accountsand higher net interest income on lending activities were morethan offset by lower reinvestment yields, lower prepaymentfees (17m EUR in 2Q16 compared with 25m EUR in 2Q15),increased hedging losses on previously refinanced mortgagesand lower net interest income from the dealing room
• Customer deposits excluding debt certificates and reposincreased by 1% y-o-y, while customer loans rose by 4% y-o-y
Net interest margin (1.84%)• Decreased by 2 bps q-o-q
• Decreased by 12 bps y-o-y due to the negative impact of lowerreinvestment yields, increased hedging losses on refinancedmortgages and some pressure on commercial loan margins
• KBC lowered the savings account rate by 4 bps (base rate) from15 bps to the legal limit of 11 bps from 16 April 2016 onwards
NIM
NII
Amounts in m EUR
540 549 531 534 536
151 152 147 145 145
541
141
714
1Q15
19720
23
2Q161Q16
6826887
4Q15
69112
3Q15
69416
2Q15
1.85%
1Q16
1.84%
1Q15
1.96%1.86% 1.86%
2Q15 3Q15 4Q15 2Q16
1.96%
NII - dealing room income
NII - contribution of insurance
NII - contribution of banking

19
Credit margins in Belgium
PRODUCT SPREAD ON CUSTOMER LOAN BOOK, OUTSTANDING
PRODUCT SPREAD ON NEW PRODUCTION
1.2
1.0
0.8
0.6
0.4
0.2
0.0
1.4
4Q133Q132Q131Q134Q123Q122Q121Q124Q113Q112Q111Q11 2Q161Q164Q153Q152Q151Q154Q143Q142Q141Q14
Customer loans
0.6
1.8
1.2
1.4
1.6
0.8
0.2
1.0
0.4
2Q161Q164Q153Q152Q152Q121Q124Q113Q112Q111Q11 3Q13 4Q13 1Q14 2Q14 3Q14 4Q14 1Q151Q134Q123Q12 2Q13
SME and corporate loans Mortgage loans
20
Belgium BU (3): higher net F&C income
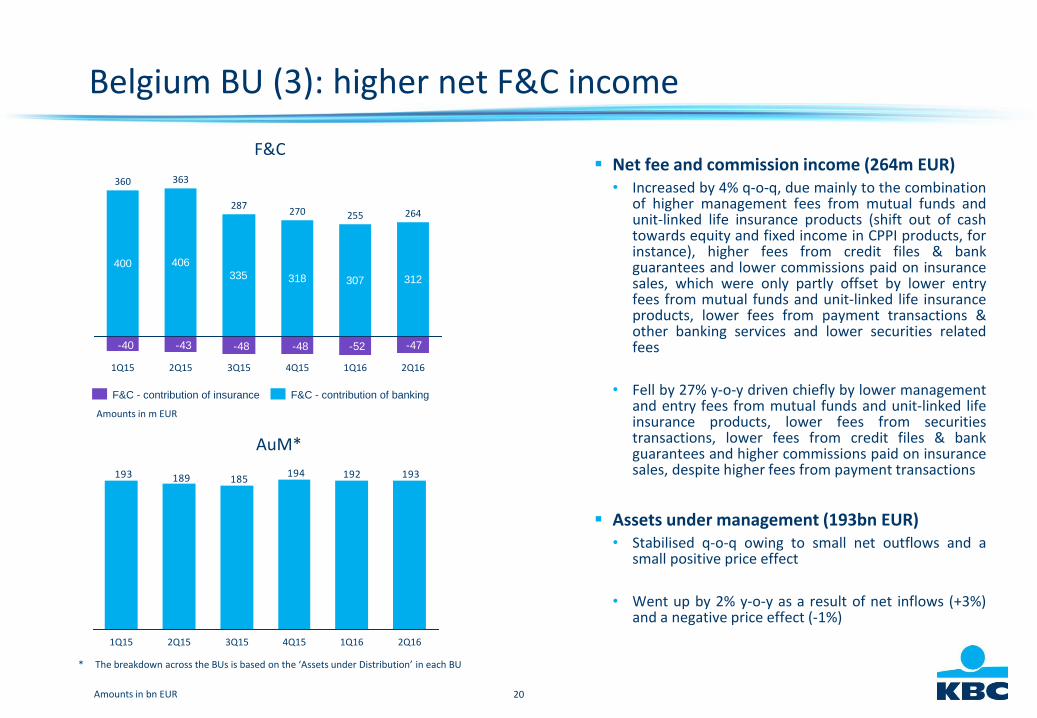
Net fee and commission income (264m EUR)• Increased by 4% q-o-q, due mainly to the combination
of higher management fees from mutual funds andunit-linked life insurance products (shift out of cashtowards equity and fixed income in CPPI products, forinstance), higher fees from credit files & bankguarantees and lower commissions paid on insurancesales, which were only partly offset by lower entryfees from mutual funds and unit-linked life insuranceproducts, lower fees from payment transactions &other banking services and lower securities relatedfees
• Fell by 27% y-o-y driven chiefly by lower managementand entry fees from mutual funds and unit-linked lifeinsurance products, lower fees from securitiestransactions, lower fees from credit files & bankguarantees and higher commissions paid on insurancesales, despite higher fees from payment transactions
Assets under management (193bn EUR)• Stabilised q-o-q owing to small net outflows and a
small positive price effect
• Went up by 2% y-o-y as a result of net inflows (+3%)and a negative price effect (-1%)
AuM*
F&C
Amounts in bn EUR
400 406
335 318 307
-52-48-48-43-40 -47
312
1Q16
255
4Q15
270
3Q15
287
2Q15
363
1Q15
360
2Q16
264
193192194185189193
2Q161Q164Q153Q152Q151Q15
Amounts in m EUR
* The breakdown across the BUs is based on the ‘Assets under Distribution’ in each BU
F&C - contribution of bankingF&C - contribution of insurance
21
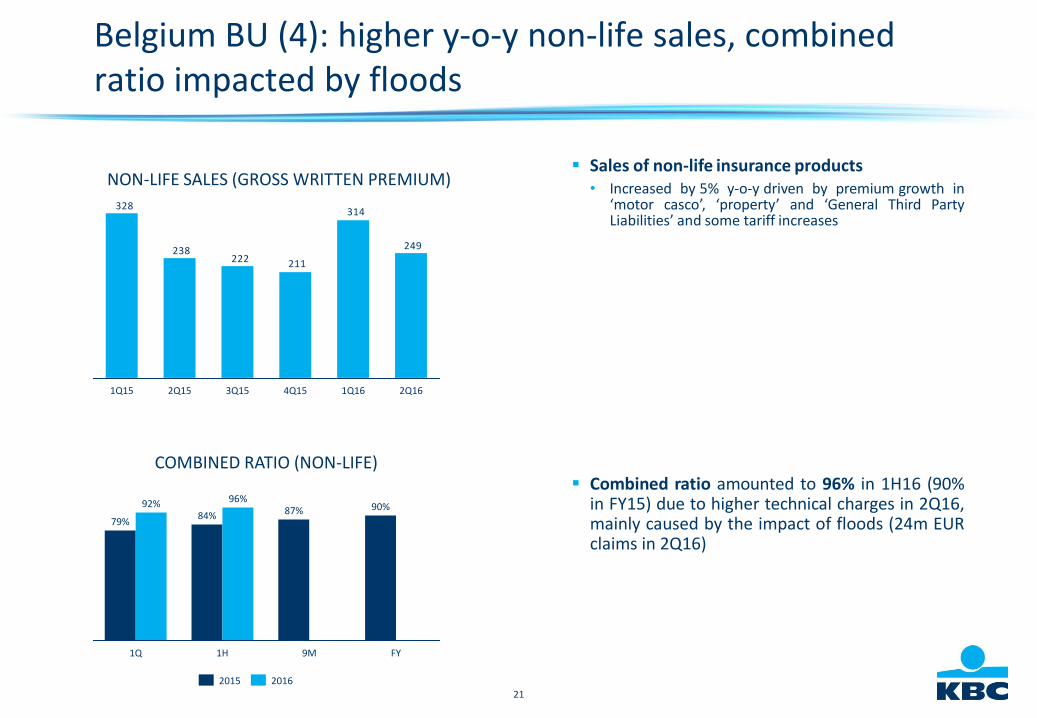
Sales of non-life insurance products• Increased by 5% y-o-y driven by premium growth in
‘motor casco’, ‘property’ and ‘General Third PartyLiabilities’ and some tariff increases
Combined ratio amounted to 96% in 1H16 (90%in FY15) due to higher technical charges in 2Q16,mainly caused by the impact of floods (24m EURclaims in 2Q16)
Belgium BU (4): higher y-o-y non-life sales, combinedratio impacted by floods
COMBINED RATIO (NON-LIFE)
79%
1Q
92%
1H
84%90%87%
9M FY
96%
2015 2016
NON-LIFE SALES (GROSS WRITTEN PREMIUM)
249
314
211222238
328
1Q16 2Q164Q153Q152Q151Q15
22
Belgium BU (5): lower life sales, but good cross-sellingratios
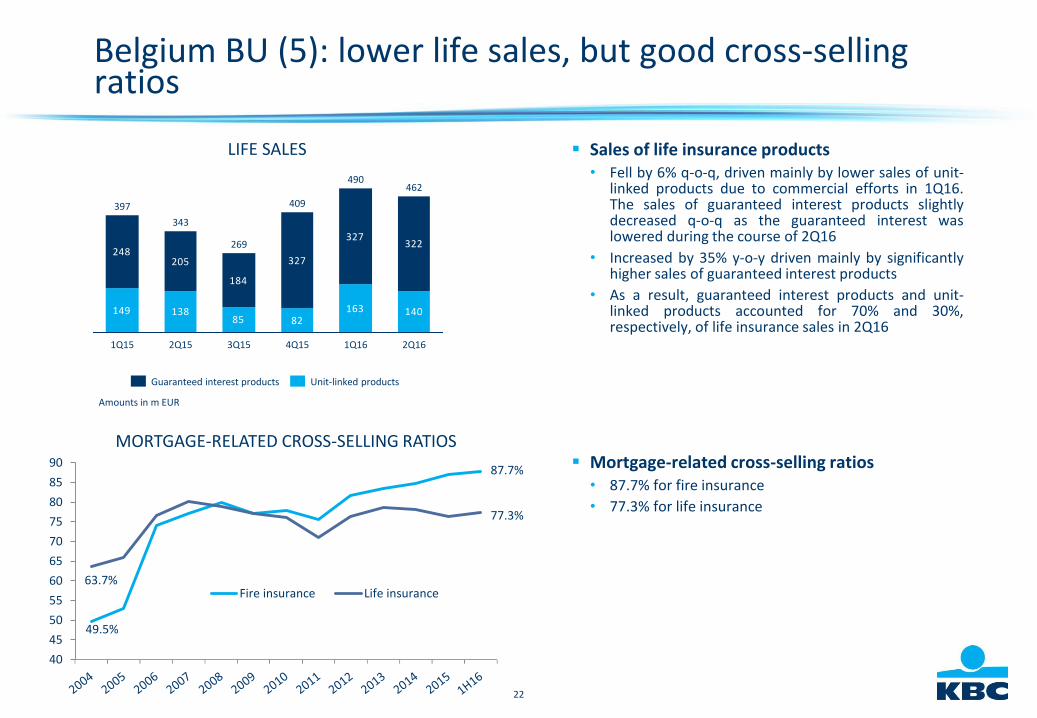
Sales of life insurance products• Fell by 6% q-o-q, driven mainly by lower sales of unit-
linked products due to commercial efforts in 1Q16.The sales of guaranteed interest products slightlydecreased q-o-q as the guaranteed interest waslowered during the course of 2Q16
• Increased by 35% y-o-y driven mainly by significantlyhigher sales of guaranteed interest products
• As a result, guaranteed interest products and unit-linked products accounted for 70% and 30%,respectively, of life insurance sales in 2Q16
Mortgage-related cross-selling ratios• 87.7% for fire insurance
• 77.3% for life insurance
LIFE SALES
Amounts in m EUR
149 13885 82
163
248205
184
327
327
140
322
462
2Q16
343
2Q15
269
3Q15
409
4Q15
490
1Q16
397
1Q15
Unit-linked productsGuaranteed interest products
MORTGAGE-RELATED CROSS-SELLING RATIOS
87.7%
77.3%
49.5%
63.7%
40
45
50
55
60
65
70
75
80
85
90
Fire insurance Life insurance
23
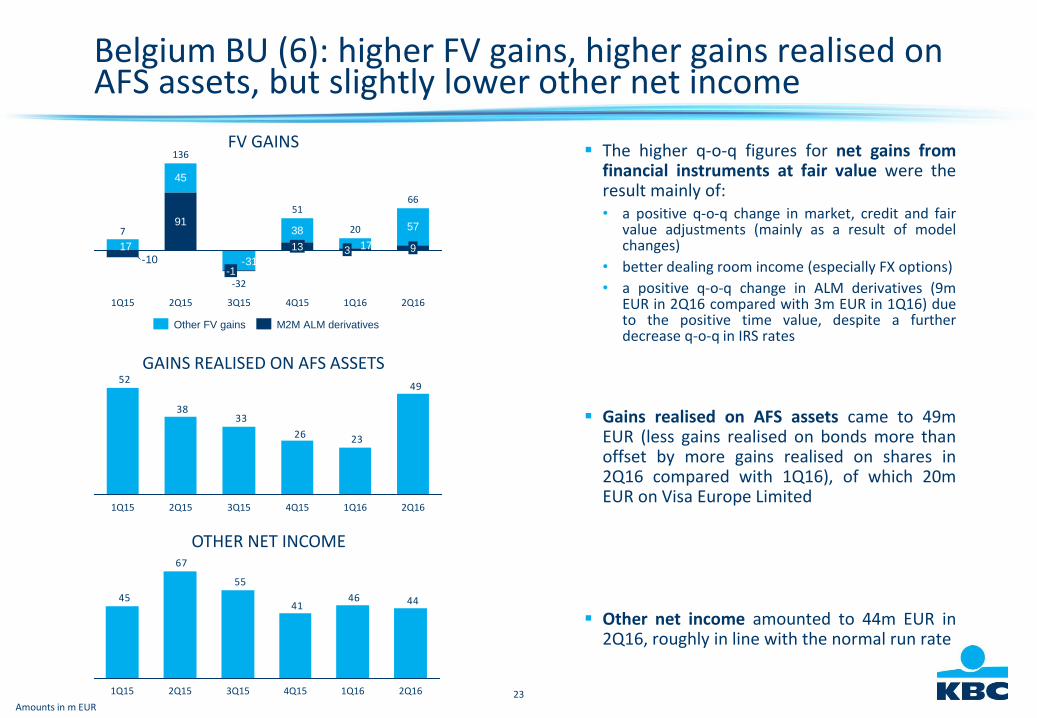
The higher q-o-q figures for net gains fromfinancial instruments at fair value were theresult mainly of:• a positive q-o-q change in market, credit and fair
value adjustments (mainly as a result of modelchanges)
• better dealing room income (especially FX options)
• a positive q-o-q change in ALM derivatives (9mEUR in 2Q16 compared with 3m EUR in 1Q16) dueto the positive time value, despite a furtherdecrease q-o-q in IRS rates
Gains realised on AFS assets came to 49mEUR (less gains realised on bonds more thanoffset by more gains realised on shares in2Q16 compared with 1Q16), of which 20mEUR on Visa Europe Limited
Other net income amounted to 44m EUR in2Q16, roughly in line with the normal run rate
FV GAINS
Amounts in m EUR
91
45
38
-31-10
1717
57
9
66
-1
2Q15
7
136
1Q15 1Q16
13
2Q16
51
4Q153Q15
20
-32
3
49
2326
3338
52
1Q16 2Q163Q15 4Q151Q15 2Q15
GAINS REALISED ON AFS ASSETS
444641
55
67
45
3Q152Q15 4Q15 2Q161Q15 1Q16
OTHER NET INCOME
Belgium BU (6): higher FV gains, higher gains realised on AFS assets, but slightly lower other net income
M2M ALM derivativesOther FV gains
24
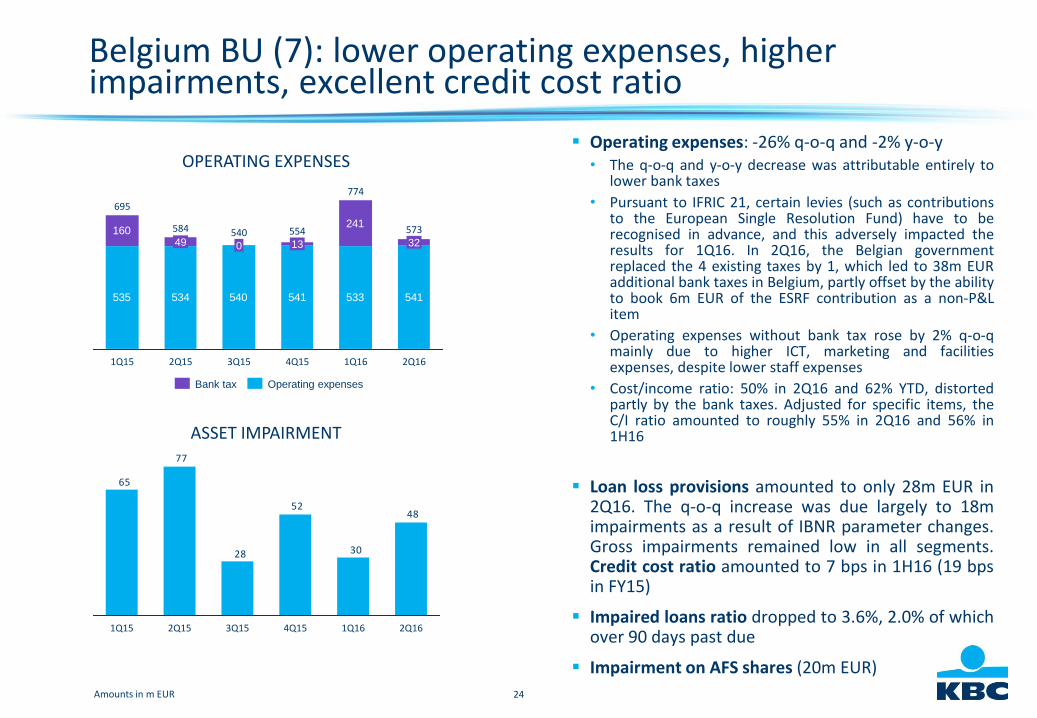
Belgium BU (7): lower operating expenses, higherimpairments, excellent credit cost ratio
Operating expenses: -26% q-o-q and -2% y-o-y• The q-o-q and y-o-y decrease was attributable entirely to
lower bank taxes
• Pursuant to IFRIC 21, certain levies (such as contributionsto the European Single Resolution Fund) have to berecognised in advance, and this adversely impacted theresults for 1Q16. In 2Q16, the Belgian governmentreplaced the 4 existing taxes by 1, which led to 38m EURadditional bank taxes in Belgium, partly offset by the abilityto book 6m EUR of the ESRF contribution as a non-P&Litem
• Operating expenses without bank tax rose by 2% q-o-qmainly due to higher ICT, marketing and facilitiesexpenses, despite lower staff expenses
• Cost/income ratio: 50% in 2Q16 and 62% YTD, distortedpartly by the bank taxes. Adjusted for specific items, theC/I ratio amounted to roughly 55% in 2Q16 and 56% in1H16
Loan loss provisions amounted to only 28m EUR in2Q16. The q-o-q increase was due largely to 18mimpairments as a result of IBNR parameter changes.Gross impairments remained low in all segments.Credit cost ratio amounted to 7 bps in 1H16 (19 bpsin FY15)
Impaired loans ratio dropped to 3.6%, 2.0% of whichover 90 days past due
Impairment on AFS shares (20m EUR)
ASSET IMPAIRMENT
OPERATING EXPENSES
Amounts in m EUR
535 534 540 541 533 541
241160 554
4Q15
774
573
1Q16 2Q16
32540
3Q15
130
2Q151Q15
695
584
49
48
30
52
28
77
65
4Q15 2Q161Q162Q151Q15 3Q15
Bank tax Operating expenses
25
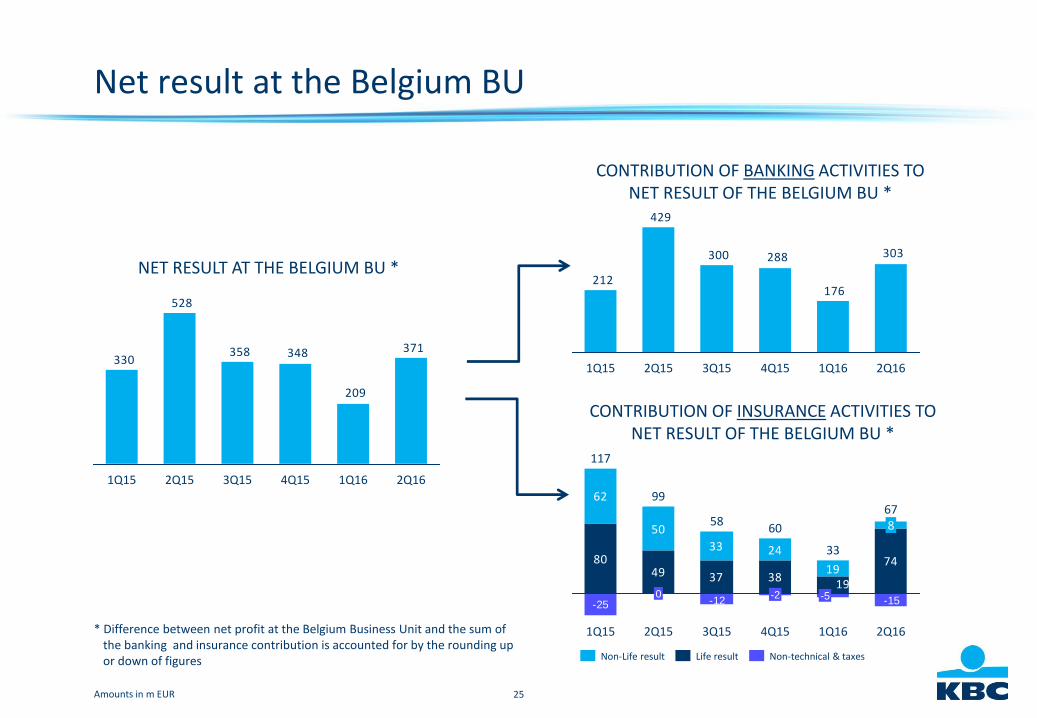
Net result at the Belgium BU
* Difference between net profit at the Belgium Business Unit and the sum of the banking and insurance contribution is accounted for by the rounding up or down of figures
CONTRIBUTION OF BANKING ACTIVITIES TO NET RESULT OF THE BELGIUM BU *
NET RESULT AT THE BELGIUM BU *
Amounts in m EUR
371
209
348358
528
330
2Q161Q164Q153Q152Q151Q15
303
176
288300
429
212
2Q161Q164Q153Q152Q151Q15
8049 37 38
62
50
33 24
19
-15-12-25
19
74
2Q16
678
1Q16
33
-5
4Q15
60
-2
3Q15
58
2Q15
99
0
1Q15
117
Non-Life result Life result Non-technical & taxes
CONTRIBUTION OF INSURANCE ACTIVITIES TO NET RESULT OF THE BELGIUM BU *
26
CZECH REPUBLIC BUSINESS UNIT
CFO SERVICES
CRO SERVICES
CORPORATE STAFF
BELGIUMCZECH
REPUBLICINTERNATIONAL
MARKETS
27
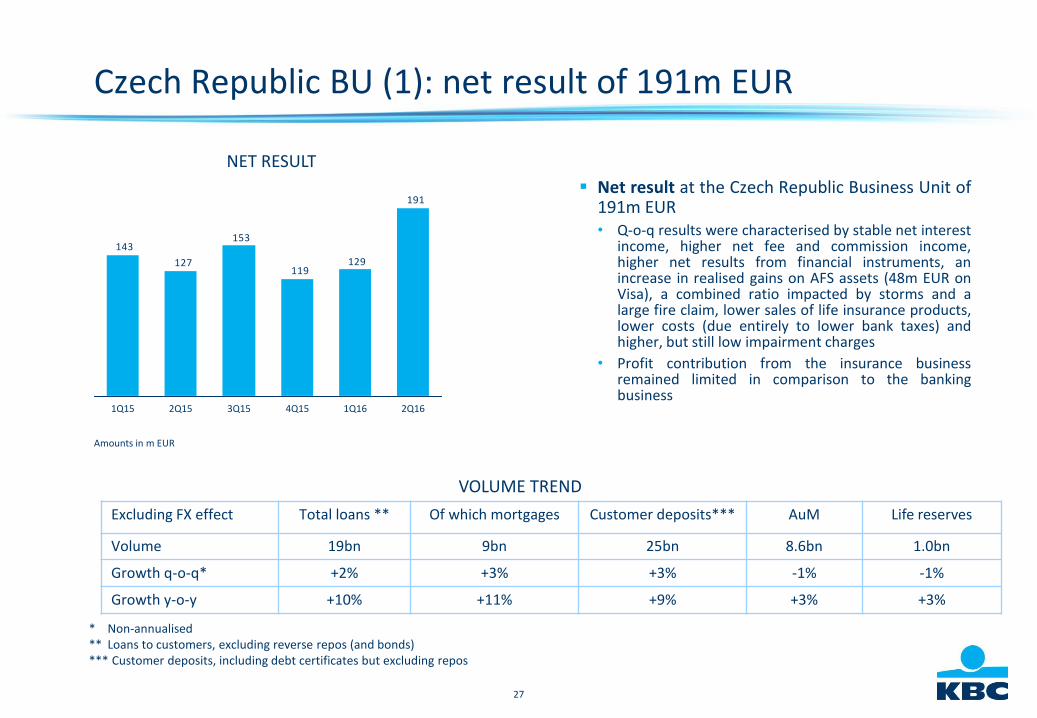
Czech Republic BU (1): net result of 191m EUR
Net result at the Czech Republic Business Unit of191m EUR• Q-o-q results were characterised by stable net interest
income, higher net fee and commission income,higher net results from financial instruments, anincrease in realised gains on AFS assets (48m EUR onVisa), a combined ratio impacted by storms and alarge fire claim, lower sales of life insurance products,lower costs (due entirely to lower bank taxes) andhigher, but still low impairment charges
• Profit contribution from the insurance businessremained limited in comparison to the bankingbusiness
* Non-annualised ** Loans to customers, excluding reverse repos (and bonds)*** Customer deposits, including debt certificates but excluding repos
VOLUME TREND
Excluding FX effect Total loans ** Of which mortgages Customer deposits*** AuM Life reserves
Volume 19bn 9bn 25bn 8.6bn 1.0bn
Growth q-o-q* +2% +3% +3% -1% -1%
Growth y-o-y +10% +11% +9% +3% +3%
NET RESULT
Amounts in m EUR
191
129119
153
127
143
2Q151Q15 1Q163Q15 2Q164Q15
28
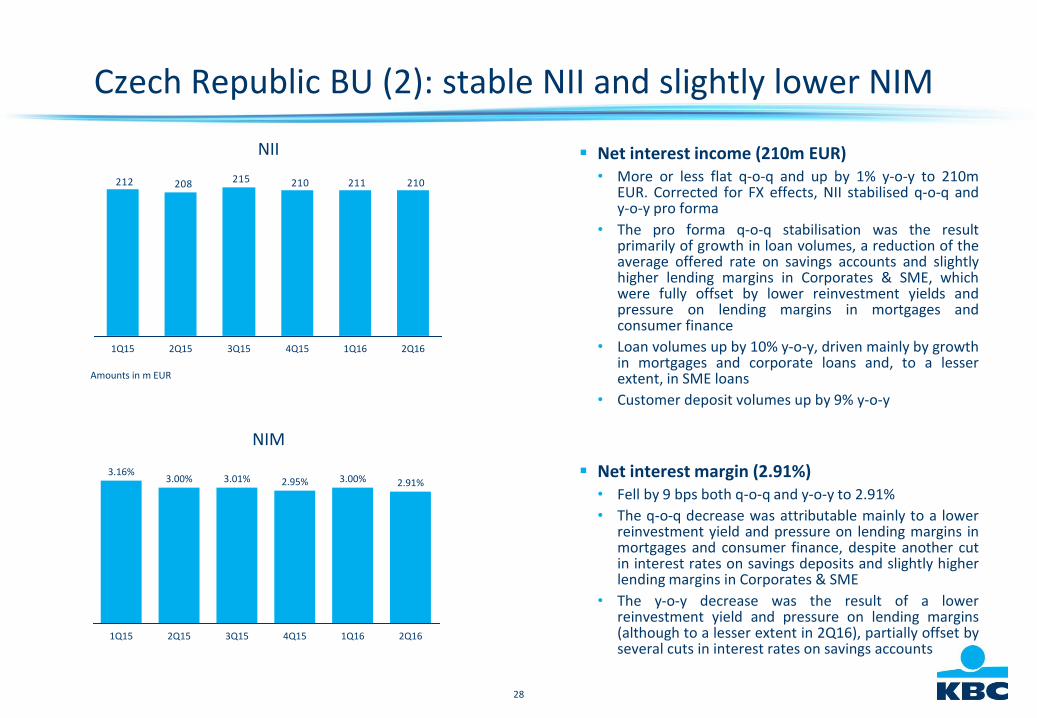
Czech Republic BU (2): stable NII and slightly lower NIM
Net interest income (210m EUR)• More or less flat q-o-q and up by 1% y-o-y to 210m
EUR. Corrected for FX effects, NII stabilised q-o-q andy-o-y pro forma
• The pro forma q-o-q stabilisation was the resultprimarily of growth in loan volumes, a reduction of theaverage offered rate on savings accounts and slightlyhigher lending margins in Corporates & SME, whichwere fully offset by lower reinvestment yields andpressure on lending margins in mortgages andconsumer finance
• Loan volumes up by 10% y-o-y, driven mainly by growthin mortgages and corporate loans and, to a lesserextent, in SME loans
• Customer deposit volumes up by 9% y-o-y
Net interest margin (2.91%)• Fell by 9 bps both q-o-q and y-o-y to 2.91%
• The q-o-q decrease was attributable mainly to a lowerreinvestment yield and pressure on lending margins inmortgages and consumer finance, despite another cutin interest rates on savings deposits and slightly higherlending margins in Corporates & SME
• The y-o-y decrease was the result of a lowerreinvestment yield and pressure on lending margins(although to a lesser extent in 2Q16), partially offset byseveral cuts in interest rates on savings accounts
NIM
NII
Amounts in m EUR
210211210215208212
1Q15 2Q15 3Q15 4Q15 1Q16 2Q16
1Q16
2.91%
4Q15
2.95%
3Q15
3.01%
2Q15
3.00%
1Q15
3.16%3.00%
2Q16
29
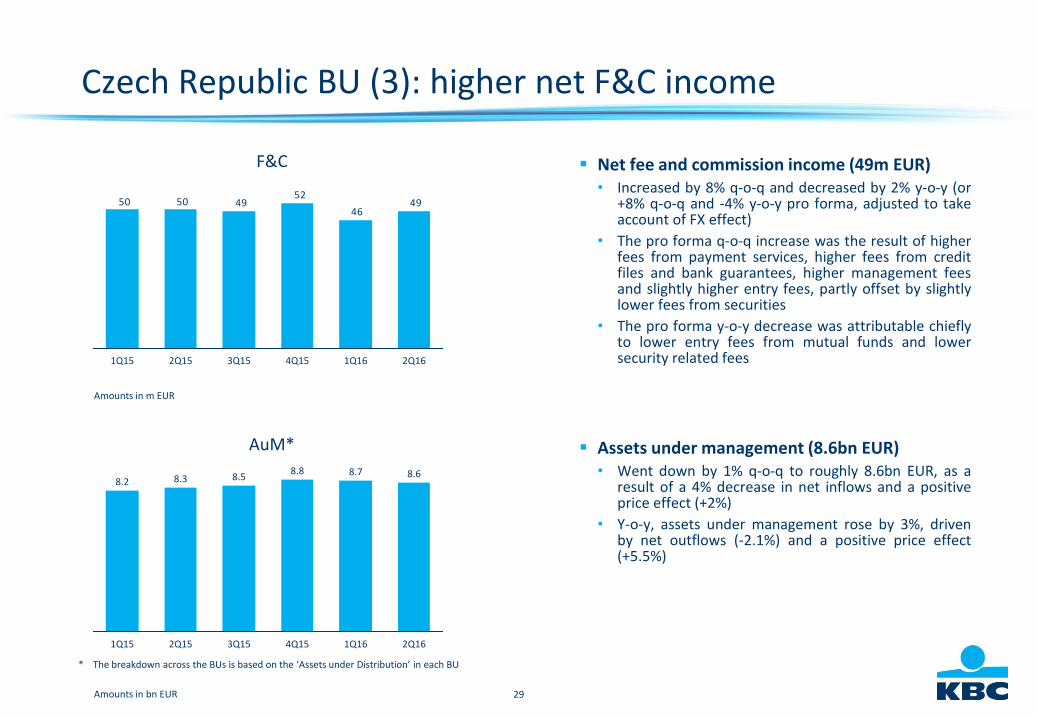
Czech Republic BU (3): higher net F&C income
Net fee and commission income (49m EUR)• Increased by 8% q-o-q and decreased by 2% y-o-y (or
+8% q-o-q and -4% y-o-y pro forma, adjusted to takeaccount of FX effect)
• The pro forma q-o-q increase was the result of higherfees from payment services, higher fees from creditfiles and bank guarantees, higher management feesand slightly higher entry fees, partly offset by slightlylower fees from securities
• The pro forma y-o-y decrease was attributable chieflyto lower entry fees from mutual funds and lowersecurity related fees
Assets under management (8.6bn EUR)• Went down by 1% q-o-q to roughly 8.6bn EUR, as a
result of a 4% decrease in net inflows and a positiveprice effect (+2%)
• Y-o-y, assets under management rose by 3%, drivenby net outflows (-2.1%) and a positive price effect(+5.5%)
AuM*
F&C
Amounts in bn EUR
Amounts in m EUR
4946
52495050
2Q161Q164Q153Q152Q151Q15
8.68.7
2Q161Q164Q15
8.8
3Q15
8.5
2Q15
8.3
1Q15
8.2
* The breakdown across the BUs is based on the ‘Assets under Distribution’ in each BU
30
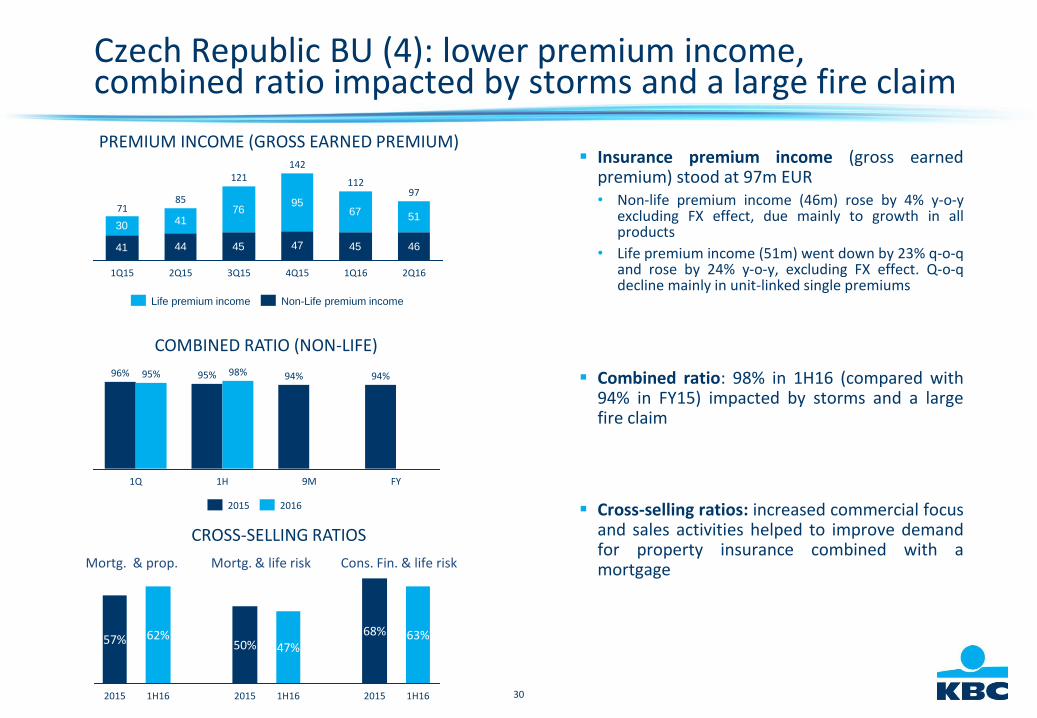
Czech Republic BU (4): lower premium income, combined ratio impacted by storms and a large fire claim
Insurance premium income (gross earnedpremium) stood at 97m EUR• Non-life premium income (46m) rose by 4% y-o-y
excluding FX effect, due mainly to growth in allproducts
• Life premium income (51m) went down by 23% q-o-qand rose by 24% y-o-y, excluding FX effect. Q-o-qdecline mainly in unit-linked single premiums
Combined ratio: 98% in 1H16 (compared with94% in FY15) impacted by storms and a largefire claim
Cross-selling ratios: increased commercial focusand sales activities helped to improve demandfor property insurance combined with amortgage
COMBINED RATIO (NON-LIFE)
PREMIUM INCOME (GROSS EARNED PREMIUM)
41 44 45 47 45
30 4176
9567
46
51
2Q16
97
1Q16
112
4Q15
142
3Q15
121
2Q15
85
1Q15
71
98%
FY
94%
9M
94%
1H
95%
1Q
95%96%
20162015
Non-Life premium incomeLife premium income
CROSS-SELLING RATIOS
Mortg. & prop. Mortg. & life risk Cons. Fin. & life risk
68%
1H16
47%
2015
50%
1H16
62%
2015
57%
1H16
63%
2015
31
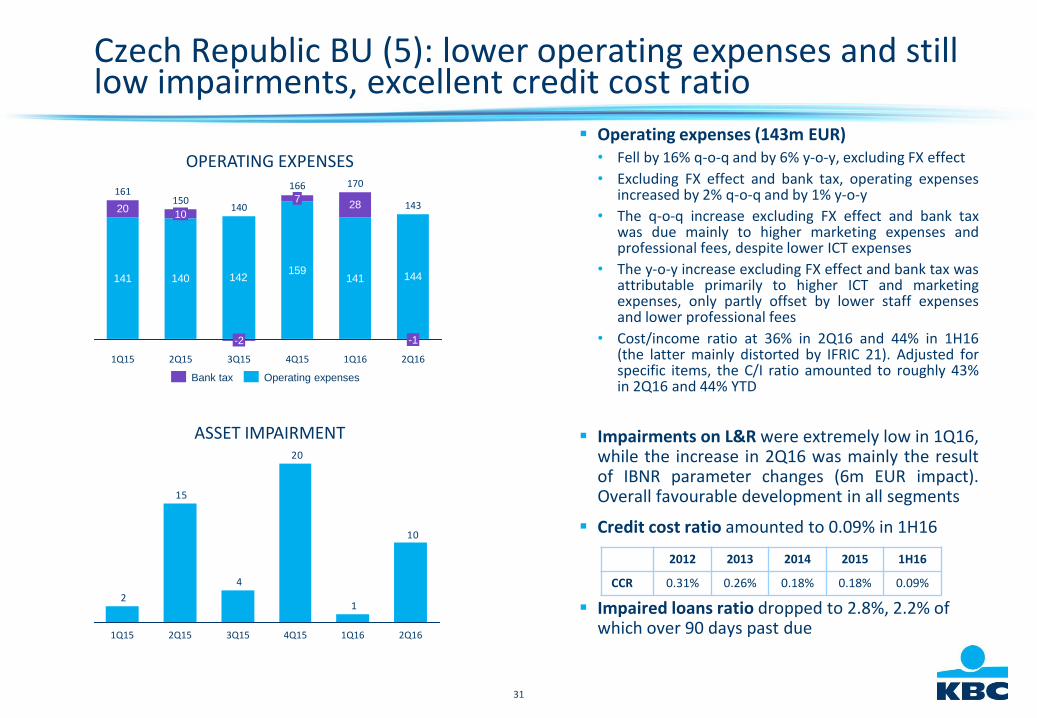
Czech Republic BU (5): lower operating expenses and stilllow impairments, excellent credit cost ratio
Operating expenses (143m EUR)• Fell by 16% q-o-q and by 6% y-o-y, excluding FX effect
• Excluding FX effect and bank tax, operating expensesincreased by 2% q-o-q and by 1% y-o-y
• The q-o-q increase excluding FX effect and bank taxwas due mainly to higher marketing expenses andprofessional fees, despite lower ICT expenses
• The y-o-y increase excluding FX effect and bank tax wasattributable primarily to higher ICT and marketingexpenses, only partly offset by lower staff expensesand lower professional fees
• Cost/income ratio at 36% in 2Q16 and 44% in 1H16(the latter mainly distorted by IFRIC 21). Adjusted forspecific items, the C/I ratio amounted to roughly 43%in 2Q16 and 44% YTD
Impairments on L&R were extremely low in 1Q16,while the increase in 2Q16 was mainly the resultof IBNR parameter changes (6m EUR impact).Overall favourable development in all segments
Credit cost ratio amounted to 0.09% in 1H16
Impaired loans ratio dropped to 2.8%, 2.2% of which over 90 days past due
ASSET IMPAIRMENT
OPERATING EXPENSES
141 140159
141
20
142
28
144
161
1Q15
10
150 7
4Q15
166
1Q16
170
2Q16
-1
140
3Q15
143
-2
2Q15
10
1
20
4
15
2
2Q15 3Q15 4Q15 1Q161Q15 2Q16
2012 2013 2014 2015 1H16
CCR 0.31% 0.26% 0.18% 0.18% 0.09%
Bank tax Operating expenses
32
INTERNATIONAL MARKETS BUSINESS UNIT
CFO SERVICES
CRO SERVICES
CORPORATE STAFF
BELGIUMCZECH
REPUBLICINTERNATIONAL
MARKETS
33
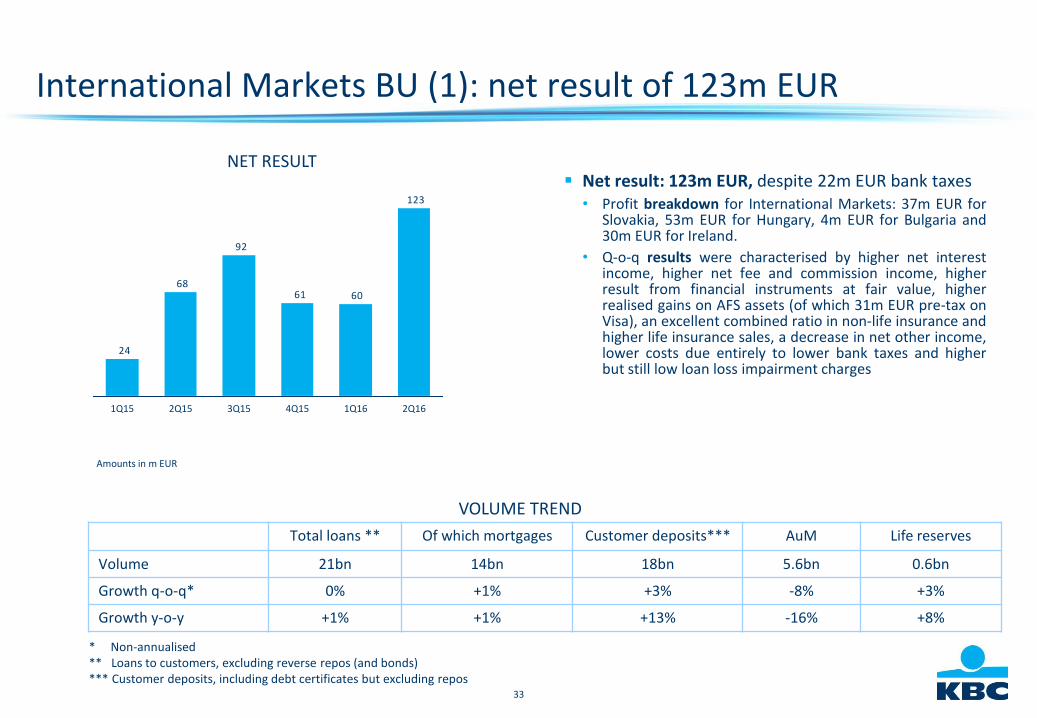
International Markets BU (1): net result of 123m EUR
* Non-annualised ** Loans to customers, excluding reverse repos (and bonds)*** Customer deposits, including debt certificates but excluding repos
VOLUME TREND
Total loans ** Of which mortgages Customer deposits*** AuM Life reserves
Volume 21bn 14bn 18bn 5.6bn 0.6bn
Growth q-o-q* 0% +1% +3% -8% +3%
Growth y-o-y +1% +1% +13% -16% +8%
NET RESULT
Amounts in m EUR
123
6061
92
68
24
1Q15 2Q164Q15 1Q162Q15 3Q15
Net result: 123m EUR, despite 22m EUR bank taxes• Profit breakdown for International Markets: 37m EUR for
Slovakia, 53m EUR for Hungary, 4m EUR for Bulgaria and30m EUR for Ireland.
• Q-o-q results were characterised by higher net interestincome, higher net fee and commission income, higherresult from financial instruments at fair value, higherrealised gains on AFS assets (of which 31m EUR pre-tax onVisa), an excellent combined ratio in non-life insurance andhigher life insurance sales, a decrease in net other income,lower costs due entirely to lower bank taxes and higherbut still low loan loss impairment charges
34
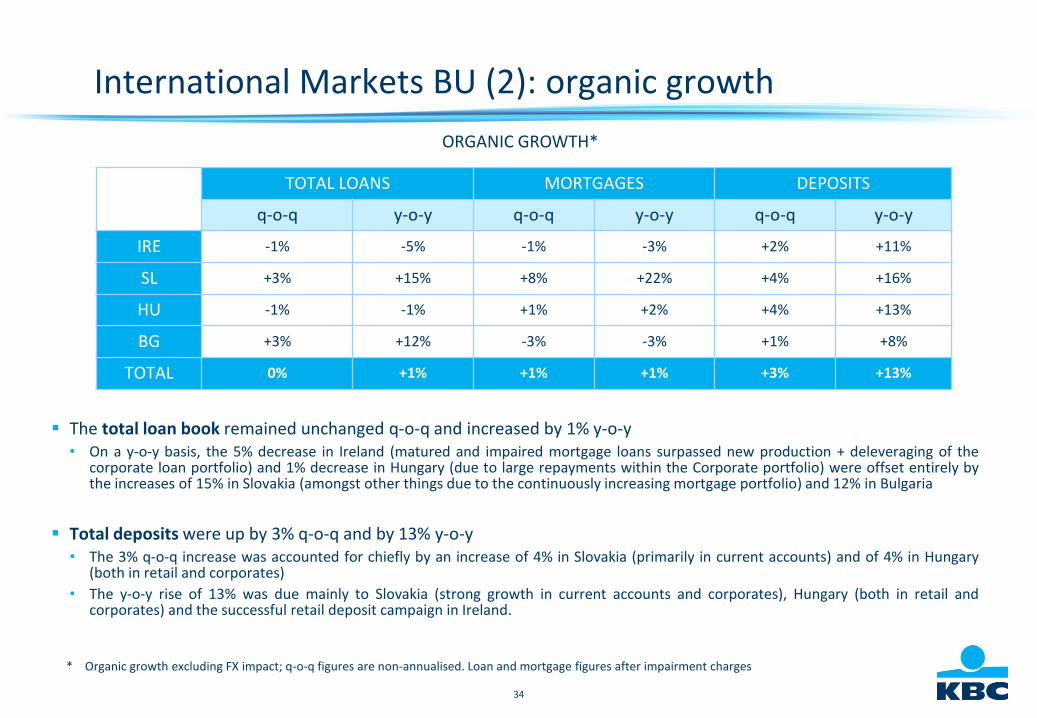
International Markets BU (2): organic growth
The total loan book remained unchanged q-o-q and increased by 1% y-o-y• On a y-o-y basis, the 5% decrease in Ireland (matured and impaired mortgage loans surpassed new production + deleveraging of the
corporate loan portfolio) and 1% decrease in Hungary (due to large repayments within the Corporate portfolio) were offset entirely bythe increases of 15% in Slovakia (amongst other things due to the continuously increasing mortgage portfolio) and 12% in Bulgaria
Total deposits were up by 3% q-o-q and by 13% y-o-y• The 3% q-o-q increase was accounted for chiefly by an increase of 4% in Slovakia (primarily in current accounts) and of 4% in Hungary
(both in retail and corporates)
• The y-o-y rise of 13% was due mainly to Slovakia (strong growth in current accounts and corporates), Hungary (both in retail andcorporates) and the successful retail deposit campaign in Ireland.
* Organic growth excluding FX impact; q-o-q figures are non-annualised. Loan and mortgage figures after impairment charges
ORGANIC GROWTH*
TOTAL LOANS MORTGAGES DEPOSITS
q-o-q y-o-y q-o-q y-o-y q-o-q y-o-y
IRE -1% -5% -1% -3% +2% +11%
SL +3% +15% +8% +22% +4% +16%
HU -1% -1% +1% +2% +4% +13%
BG +3% +12% -3% -3% +1% +8%
TOTAL 0% +1% +1% +1% +3% +13%
35
International Markets BU (3): slightly higher NII and NIM
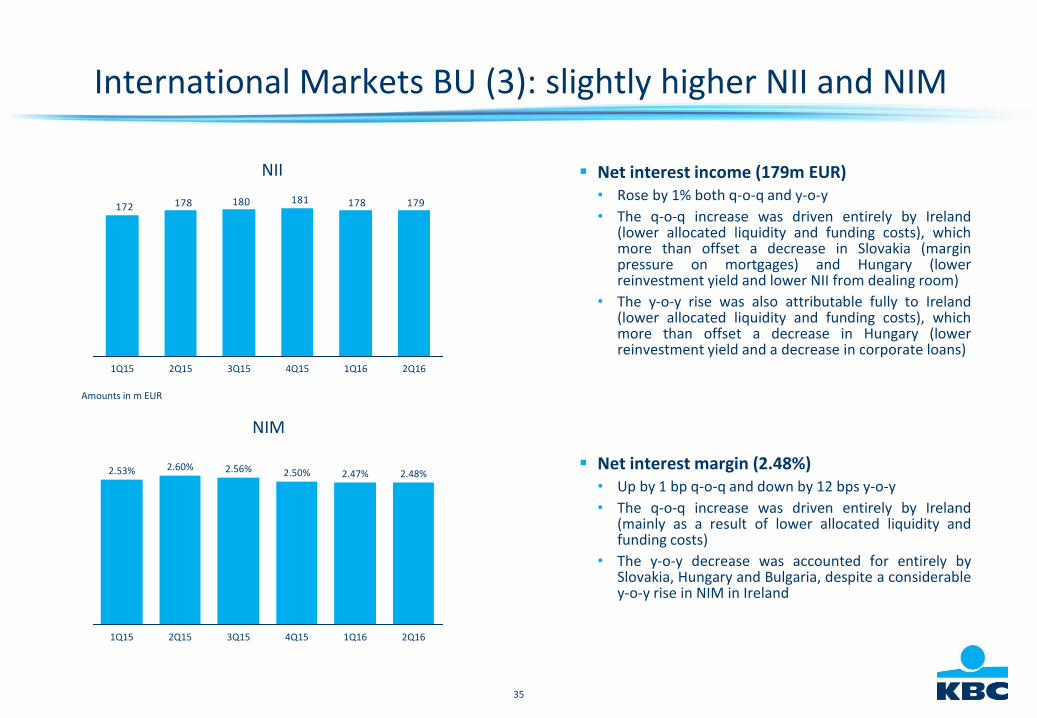
Net interest income (179m EUR)• Rose by 1% both q-o-q and y-o-y
• The q-o-q increase was driven entirely by Ireland(lower allocated liquidity and funding costs), whichmore than offset a decrease in Slovakia (marginpressure on mortgages) and Hungary (lowerreinvestment yield and lower NII from dealing room)
• The y-o-y rise was also attributable fully to Ireland(lower allocated liquidity and funding costs), whichmore than offset a decrease in Hungary (lowerreinvestment yield and a decrease in corporate loans)
Net interest margin (2.48%)• Up by 1 bp q-o-q and down by 12 bps y-o-y
• The q-o-q increase was driven entirely by Ireland(mainly as a result of lower allocated liquidity andfunding costs)
• The y-o-y decrease was accounted for entirely bySlovakia, Hungary and Bulgaria, despite a considerabley-o-y rise in NIM in Ireland
NIM
NII
Amounts in m EUR
179178181180178172
2Q161Q164Q153Q152Q151Q15
4Q15
2.50%
3Q15
2.56%
2Q15
2.60%
1Q15
2.53%
1Q16
2.48%
2Q16
2.47%
36
International Markets BU (4): higher net F&C income
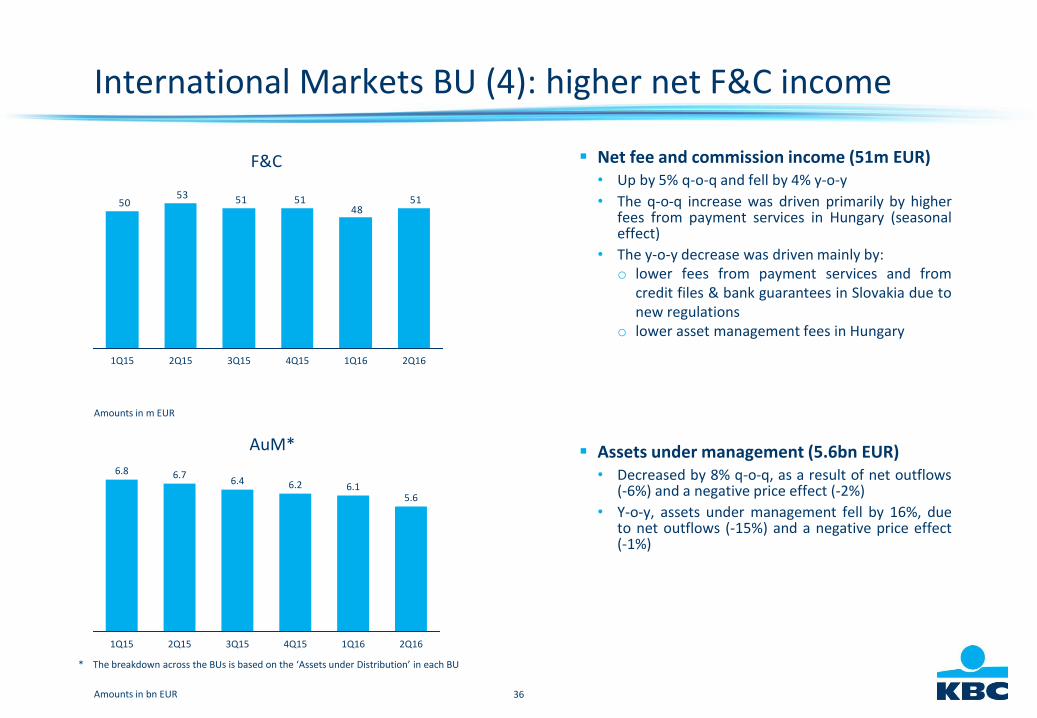
Net fee and commission income (51m EUR)• Up by 5% q-o-q and fell by 4% y-o-y
• The q-o-q increase was driven primarily by higherfees from payment services in Hungary (seasonaleffect)
• The y-o-y decrease was driven mainly by:o lower fees from payment services and from
credit files & bank guarantees in Slovakia due tonew regulations
o lower asset management fees in Hungary
Assets under management (5.6bn EUR)• Decreased by 8% q-o-q, as a result of net outflows
(-6%) and a negative price effect (-2%)
• Y-o-y, assets under management fell by 16%, dueto net outflows (-15%) and a negative price effect(-1%)
AuM*
F&C
Amounts in bn EUR
Amounts in m EUR
5148
51515350
4Q15 2Q161Q162Q15 3Q151Q15
1Q16 2Q16
6.8
4Q152Q15 3Q15
6.76.26.4
6.1
1Q15
5.6
* The breakdown across the BUs is based on the ‘Assets under Distribution’ in each BU
37
International Markets BU (5): higher premium incomeand excellent combined ratio
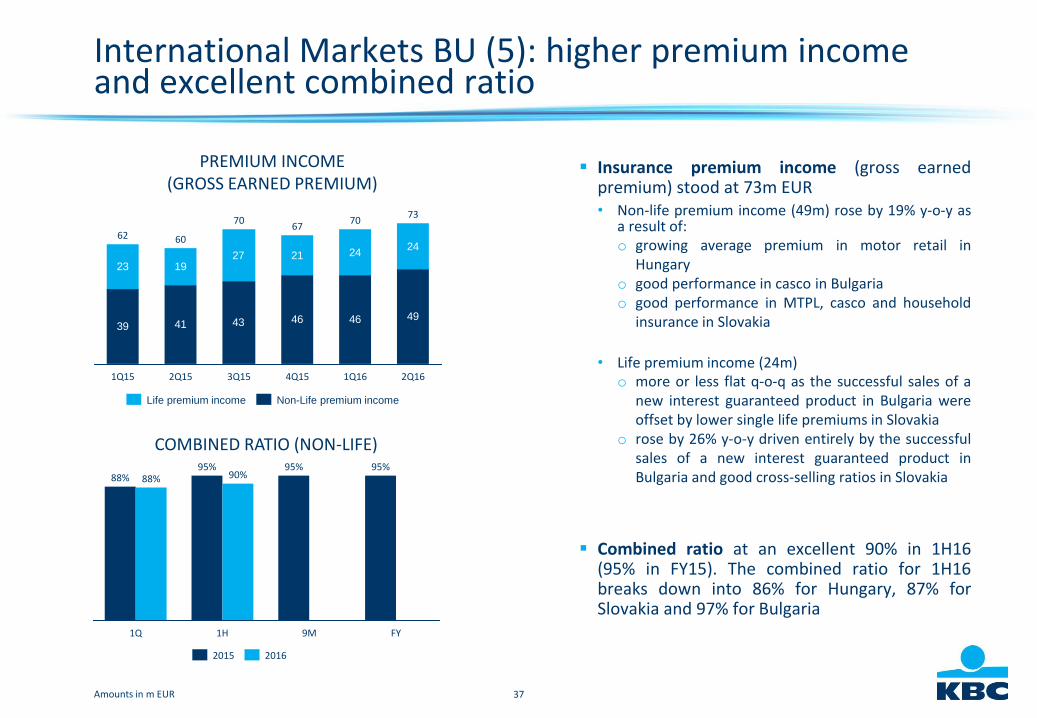
Insurance premium income (gross earnedpremium) stood at 73m EUR• Non-life premium income (49m) rose by 19% y-o-y as
a result of:o growing average premium in motor retail in
Hungaryo good performance in casco in Bulgariao good performance in MTPL, casco and household
insurance in Slovakia
• Life premium income (24m)o more or less flat q-o-q as the successful sales of a
new interest guaranteed product in Bulgaria wereoffset by lower single life premiums in Slovakia
o rose by 26% y-o-y driven entirely by the successfulsales of a new interest guaranteed product inBulgaria and good cross-selling ratios in Slovakia
Combined ratio at an excellent 90% in 1H16(95% in FY15). The combined ratio for 1H16breaks down into 86% for Hungary, 87% forSlovakia and 97% for Bulgaria
COMBINED RATIO (NON-LIFE)
PREMIUM INCOME(GROSS EARNED PREMIUM)
Amounts in m EUR
39 41 43 46 46
23 1927 21 24
49
24
2Q16
73
1Q16
70
4Q15
67
3Q15
70
2Q15
60
1Q15
62
95%
1H
95%
1Q
88%88% 90%
FY
95%
9M
20162015
Non-Life premium incomeLife premium income
38
International Markets BU (6): lower operating expenses, low impairments, excellent credit cost ratio
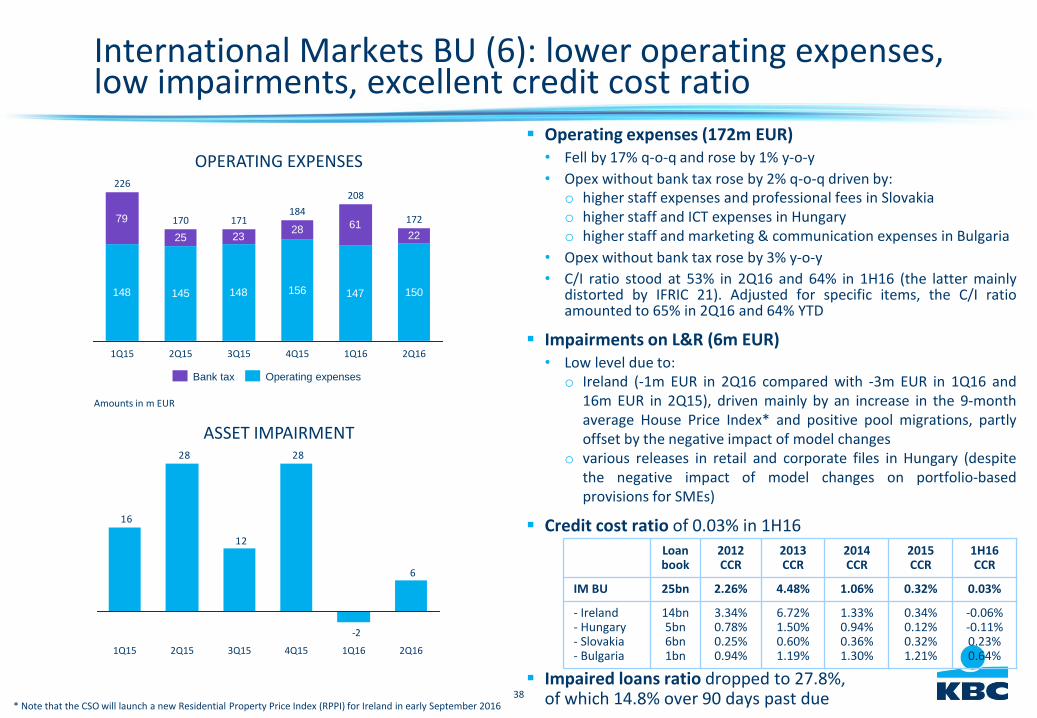
Operating expenses (172m EUR)• Fell by 17% q-o-q and rose by 1% y-o-y
• Opex without bank tax rose by 2% q-o-q driven by:o higher staff expenses and professional fees in Slovakiao higher staff and ICT expenses in Hungaryo higher staff and marketing & communication expenses in Bulgaria
• Opex without bank tax rose by 3% y-o-y
• C/I ratio stood at 53% in 2Q16 and 64% in 1H16 (the latter mainlydistorted by IFRIC 21). Adjusted for specific items, the C/I ratioamounted to 65% in 2Q16 and 64% YTD
Impairments on L&R (6m EUR)• Low level due to:
o Ireland (-1m EUR in 2Q16 compared with -3m EUR in 1Q16 and16m EUR in 2Q15), driven mainly by an increase in the 9-monthaverage House Price Index* and positive pool migrations, partlyoffset by the negative impact of model changes
o various releases in retail and corporate files in Hungary (despitethe negative impact of model changes on portfolio-basedprovisions for SMEs)
Credit cost ratio of 0.03% in 1H16
Impaired loans ratio dropped to 27.8%, of which 14.8% over 90 days past due
ASSET IMPAIRMENT
OPERATING EXPENSES
Amounts in m EUR
148 145 148 156 147
79
25 2328 61
150
22
172
2Q161Q16
208
4Q15
184
3Q15
171
2Q15
170
1Q15
226
6
-2
28
12
28
16
2Q161Q164Q153Q152Q151Q15
Loan book
2012CCR
2013CCR
2014CCR
2015CCR
1H16CCR
IM BU 25bn 2.26% 4.48% 1.06% 0.32% 0.03%
- Ireland- Hungary- Slovakia- Bulgaria
14bn5bn6bn1bn
3.34%0.78%0.25%0.94%
6.72%1.50%0.60%1.19%
1.33%0.94%0.36%1.30%
0.34%0.12%0.32%1.21%
-0.06%-0.11%0.23%0.64%
Operating expensesBank tax
* Note that the CSO will launch a new Residential Property Price Index (RPPI) for Ireland in early September 2016
39
Ireland (1): profitable in 1H16 (53m EUR)
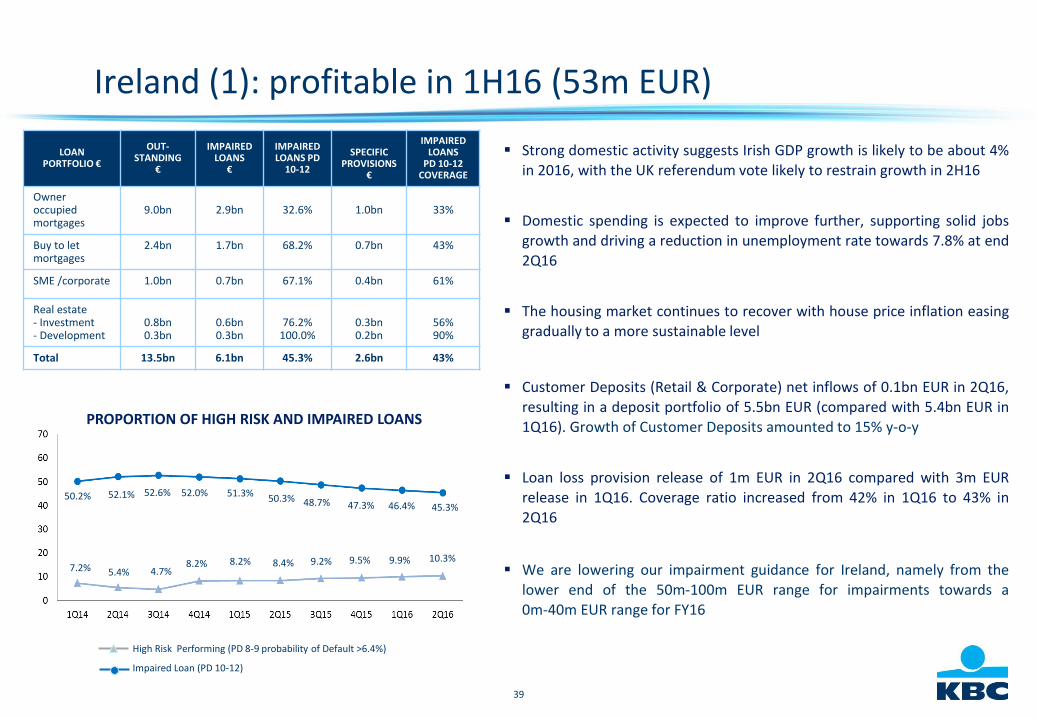
Strong domestic activity suggests Irish GDP growth is likely to be about 4%in 2016, with the UK referendum vote likely to restrain growth in 2H16
Domestic spending is expected to improve further, supporting solid jobsgrowth and driving a reduction in unemployment rate towards 7.8% at end2Q16
The housing market continues to recover with house price inflation easinggradually to a more sustainable level
Customer Deposits (Retail & Corporate) net inflows of 0.1bn EUR in 2Q16,
resulting in a deposit portfolio of 5.5bn EUR (compared with 5.4bn EUR in1Q16). Growth of Customer Deposits amounted to 15% y-o-y
Loan loss provision release of 1m EUR in 2Q16 compared with 3m EURrelease in 1Q16. Coverage ratio increased from 42% in 1Q16 to 43% in2Q16
We are lowering our impairment guidance for Ireland, namely from the
lower end of the 50m-100m EUR range for impairments towards a0m-40m EUR range for FY16
LOAN PORTFOLIO €
OUT-STANDING
€
IMPAIRED LOANS
€
IMPAIRED LOANS PD
10-12
SPECIFIC PROVISIONS
€
IMPAIRED LOANS
PD 10-12 COVERAGE
Owner occupied mortgages
9.0bn 2.9bn 32.6% 1.0bn 33%
Buy to let mortgages
2.4bn 1.7bn 68.2% 0.7bn 43%
SME /corporate 1.0bn 0.7bn 67.1% 0.4bn 61%
Real estate- Investment- Development
0.8bn0.3bn
0.6bn0.3bn
76.2%100.0%
0.3bn0.2bn
56%90%
Total 13.5bn 6.1bn 45.3% 2.6bn 43%
PROPORTION OF HIGH RISK AND IMPAIRED LOANS
7.2%
52.1%
High Risk Performing (PD 8-9 probability of Default >6.4%)
Impaired Loan (PD 10-12)
5.4%
52.6%50.2%
4.7%8.2%
52.0% 51.3% 50.3%
8.4%8.2% 9.2%
48.7%
9.5%
47.3% 46.4%
9.9%
45.3%
10.3%
40
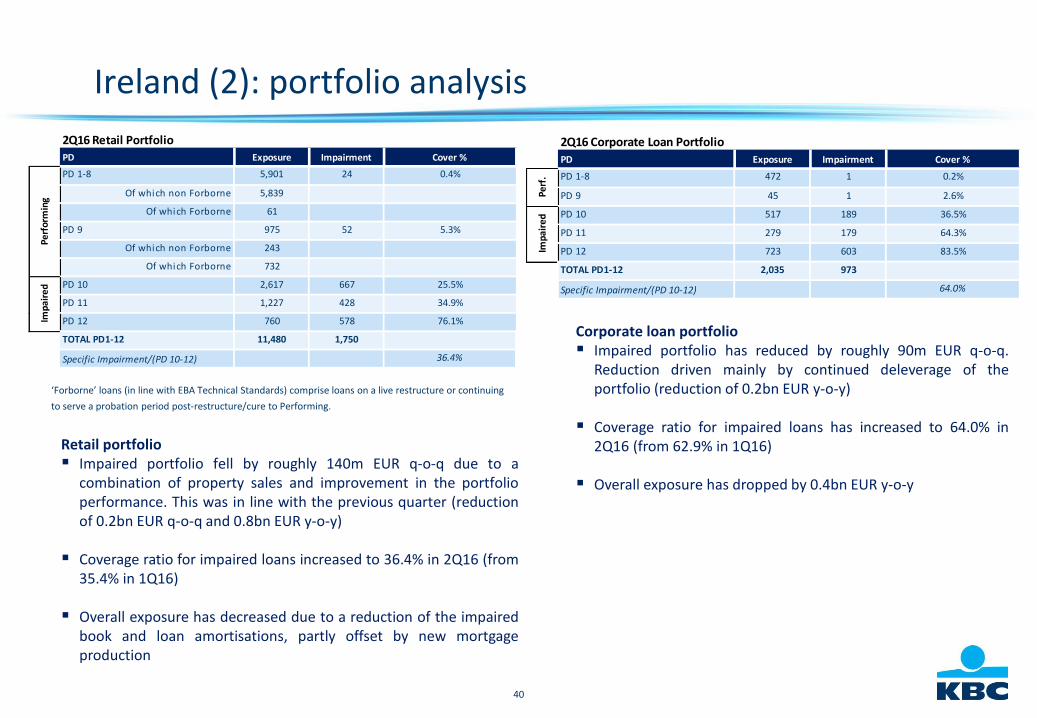
Retail portfolio Impaired portfolio fell by roughly 140m EUR q-o-q due to a
combination of property sales and improvement in the portfolioperformance. This was in line with the previous quarter (reductionof 0.2bn EUR q-o-q and 0.8bn EUR y-o-y)
Coverage ratio for impaired loans increased to 36.4% in 2Q16 (from35.4% in 1Q16)
Overall exposure has decreased due to a reduction of the impairedbook and loan amortisations, partly offset by new mortgageproduction
Ireland (2): portfolio analysis
Corporate loan portfolio Impaired portfolio has reduced by roughly 90m EUR q-o-q.
Reduction driven mainly by continued deleverage of theportfolio (reduction of 0.2bn EUR y-o-y)
Coverage ratio for impaired loans has increased to 64.0% in2Q16 (from 62.9% in 1Q16)
Overall exposure has dropped by 0.4bn EUR y-o-y
‘Forborne’ loans (in line with EBA Technical Standards) comprise loans on a live restructure or continuing
to serve a probation period post-restructure/cure to Performing.
2Q16 Retail Portfolio
PD Exposure Impairment Cover %
PD 1-8 5,901 24 0.4%
Of which non Forborne 5,839
Of which Forborne 61
PD 9 975 52 5.3%
Of which non Forborne 243
Of which Forborne 732
PD 10 2,617 667 25.5%
PD 11 1,227 428 34.9%
PD 12 760 578 76.1%
TOTAL PD1-12 11,480 1,750
Specific Impairment/(PD 10-12) 36.4%
Perf
orm
ing
Impa
ired
2Q16 Corporate Loan Portfolio
PD Exposure Impairment Cover %
PD 1-8 472 1 0.2%
PD 9 45 1 2.6%
PD 10 517 189 36.5%
PD 11 279 179 64.3%
PD 12 723 603 83.5%
TOTAL PD1-12 2,035 973
Specific Impairment/(PD 10-12) 64.0%
Impa
ired
Perf
.
41
GROUP CENTRE
CFO SERVICES
CRO SERVICES
CORPORATE STAFF
BELGIUMCZECH
REPUBLICINTERNATIONAL
MARKETS
42
Group Centre: net result of 37m EUR
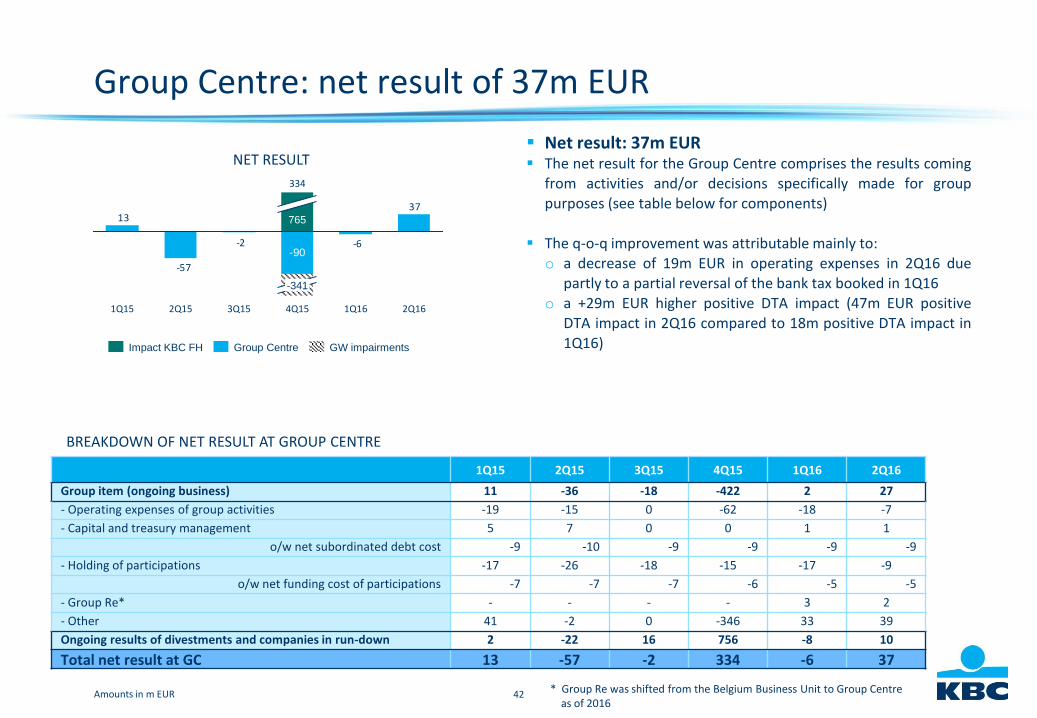
Net result: 37m EUR The net result for the Group Centre comprises the results coming
from activities and/or decisions specifically made for grouppurposes (see table below for components)
The q-o-q improvement was attributable mainly to:o a decrease of 19m EUR in operating expenses in 2Q16 due
partly to a partial reversal of the bank tax booked in 1Q16o a +29m EUR higher positive DTA impact (47m EUR positive
DTA impact in 2Q16 compared to 18m positive DTA impact in1Q16)
NET RESULT
Amounts in m EUR
-6-2
-57
-90
3713
1Q16
765
3Q152Q15 4Q15
334
-341
2Q161Q15
BREAKDOWN OF NET RESULT AT GROUP CENTRE
1Q15 2Q15 3Q15 4Q15 1Q16 2Q16
Group item (ongoing business) 11 -36 -18 -422 2 27
- Operating expenses of group activities -19 -15 0 -62 -18 -7
- Capital and treasury management 5 7 0 0 1 1
o/w net subordinated debt cost -9 -10 -9 -9 -9 -9
- Holding of participations -17 -26 -18 -15 -17 -9
o/w net funding cost of participations -7 -7 -7 -6 -5 -5
- Group Re* - - - - 3 2
- Other 41 -2 0 -346 33 39
Ongoing results of divestments and companies in run-down 2 -22 16 756 -8 10
Total net result at GC 13 -57 -2 334 -6 37
GW impairmentsImpact KBC FH Group Centre
* Group Re was shifted from the Belgium Business Unit to Group Centre as of 2016
43
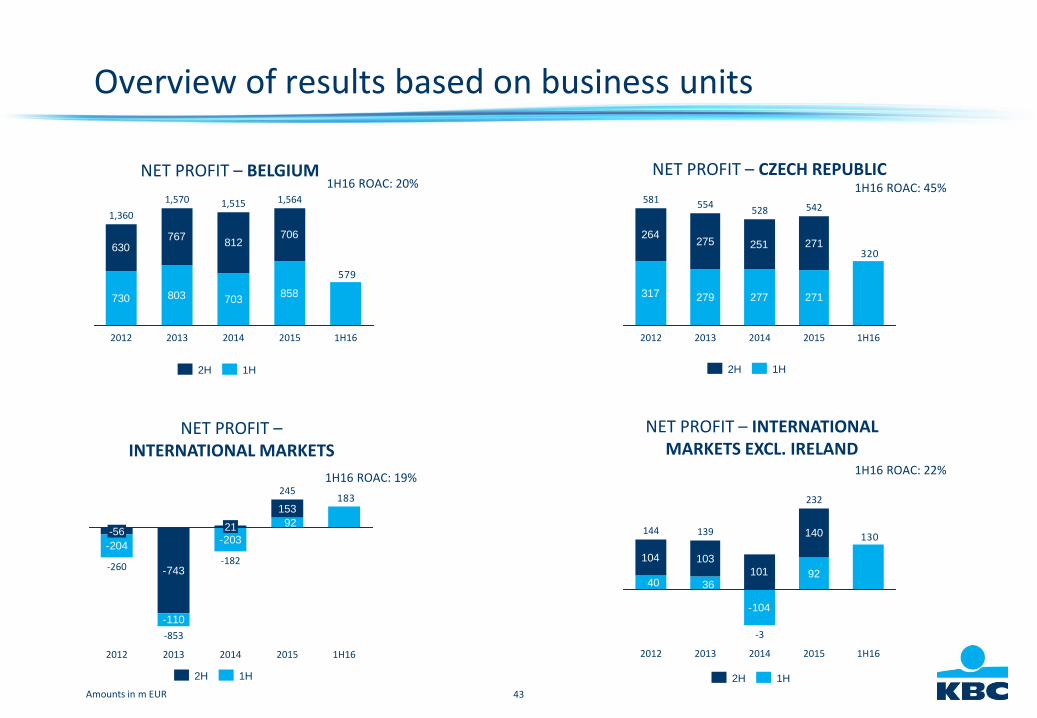
NET PROFIT – BELGIUM NET PROFIT – CZECH REPUBLIC
730 803 703858
630767
812706
579
1H162015
1,564
2014
1,515
2013
1,570
2012
1,360
1H16 ROAC: 20%
Amounts in m EUR
317 279 277 271
264275 251 271
320
1H162015
542
2014
528
2013
554
2012
5811H16 ROAC: 45%
NET PROFIT –INTERNATIONAL MARKETS
-743
-203-204
-110
153
92
183
1H162015
245
2014
-182
21
2013
-853
2012
-260
-56
1H16 ROAC: 19%
-104
92
104 103
101
140
3640
130
1H162015
232
2014
-3
2013
139
2012
144
NET PROFIT – INTERNATIONAL MARKETS EXCL. IRELAND
Overview of results based on business units
2H 1H 2H 1H
1H2H 2H 1H
1H16 ROAC: 22%
44
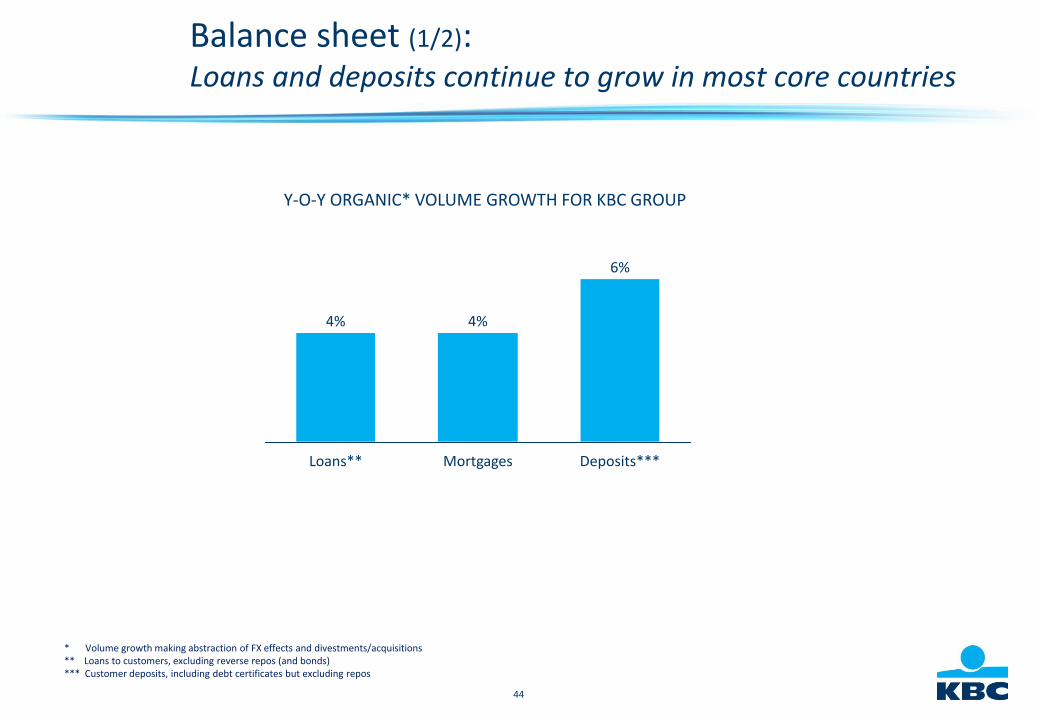
Balance sheet (1/2):Loans and deposits continue to grow in most core countries
Deposits***
6%
4% 4%
MortgagesLoans**
* Volume growth making abstraction of FX effects and divestments/acquisitions** Loans to customers, excluding reverse repos (and bonds)*** Customer deposits, including debt certificates but excluding repos
Y-O-Y ORGANIC* VOLUME GROWTH FOR KBC GROUP
45
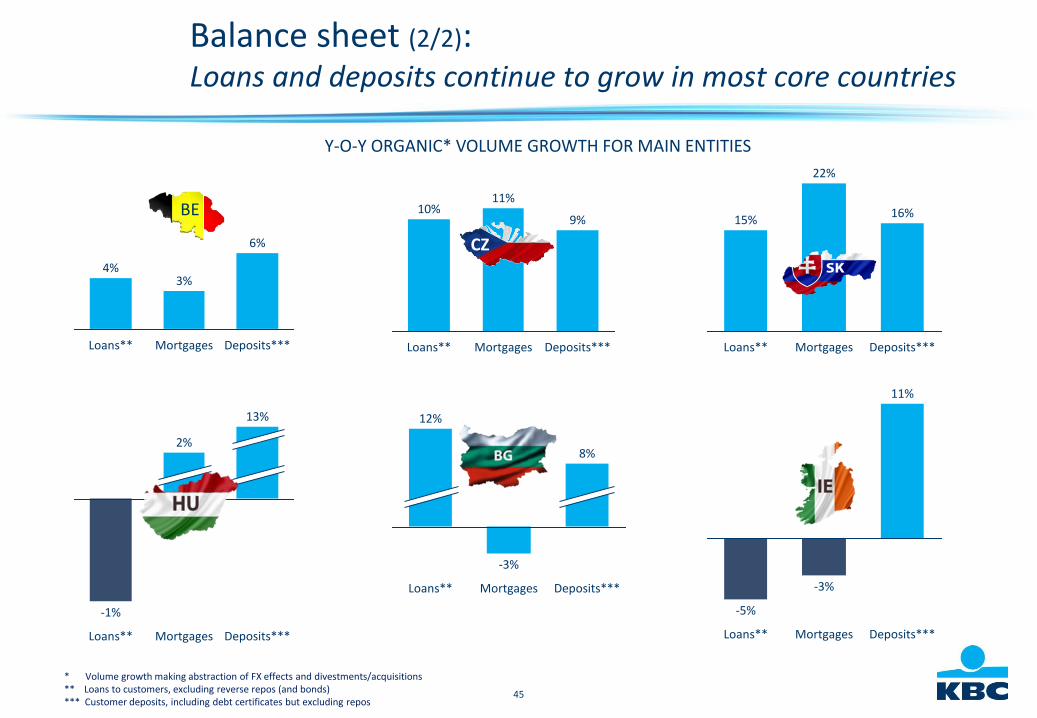
Balance sheet (2/2):Loans and deposits continue to grow in most core countries
Deposits***
6%
Mortgages
3%
Loans**
4%
Deposits***
9%
Mortgages
11%
Loans**
10%
Deposits***
11%
Mortgages
-3%
Loans**
-5%
Deposits***
16%
Mortgages
22%
Loans**
15%
Deposits***
13%
Mortgages
2%
Loans**
-1%
Deposits***
8%
Mortgages
-3%
Loans**
12%
BE
CZ
Y-O-Y ORGANIC* VOLUME GROWTH FOR MAIN ENTITIES
* Volume growth making abstraction of FX effects and divestments/acquisitions** Loans to customers, excluding reverse repos (and bonds)*** Customer deposits, including debt certificates but excluding repos
46
KBC Group
Section 3
Strong solvency andsolid liquidity
47
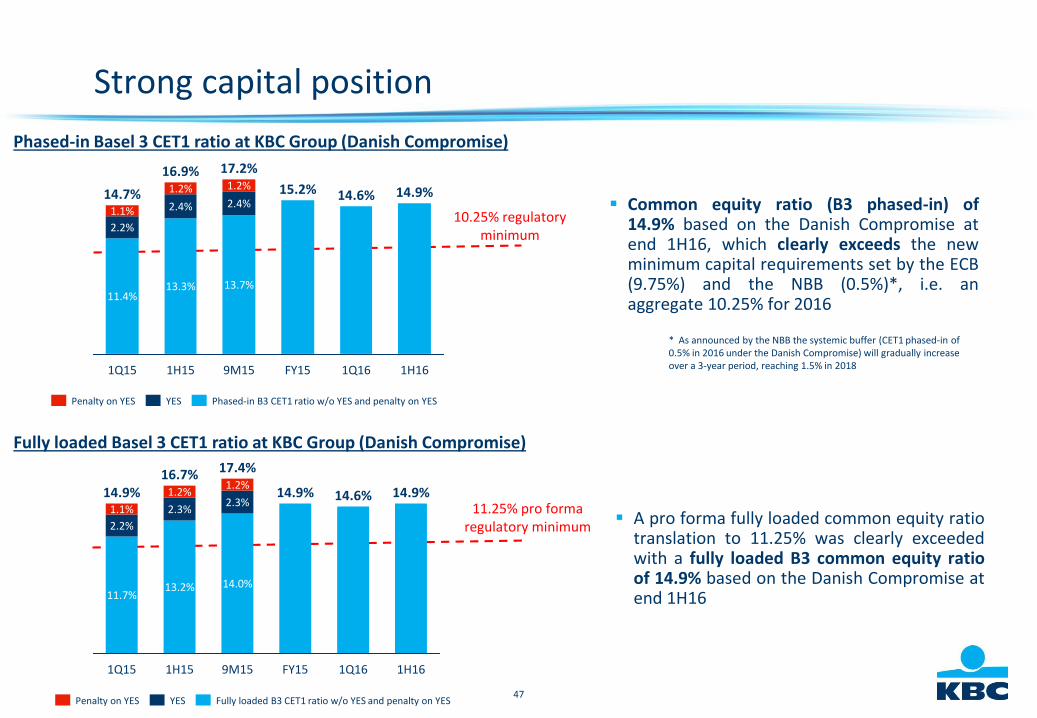
Strong capital position
Phased-in Basel 3 CET1 ratio at KBC Group (Danish Compromise)
10.25% regulatoryminimum
1H16
14.9%
1Q16
14.6%
FY15
15.2%
9M15
17.2%
13.7%
2.4%
1.2%
1H15
16.9%
13.3%
2.4%
1.2%
1Q15
14.7%
11.4%
2.2%
1.1%
Phased-in B3 CET1 ratio w/o YES and penalty on YESYESPenalty on YES
Common equity ratio (B3 phased-in) of14.9% based on the Danish Compromise atend 1H16, which clearly exceeds the newminimum capital requirements set by the ECB(9.75%) and the NBB (0.5%)*, i.e. anaggregate 10.25% for 2016
* As announced by the NBB the systemic buffer (CET1 phased-in of 0.5% in 2016 under the Danish Compromise) will gradually increase over a 3-year period, reaching 1.5% in 2018
Fully loaded Basel 3 CET1 ratio at KBC Group (Danish Compromise)
11.25% pro forma regulatory minimum
14.9%
1H161Q16
14.6%
FY15
14.9%
9M15
17.4%
14.0%
2.3%
1.2%
1H15
16.7%
13.2%
2.3%
1.2%
1Q15
14.9%
11.7%
2.2%
1.1%
Fully loaded B3 CET1 ratio w/o YES and penalty on YESYESPenalty on YES
A pro forma fully loaded common equity ratiotranslation to 11.25% was clearly exceededwith a fully loaded B3 common equity ratioof 14.9% based on the Danish Compromise atend 1H16
48
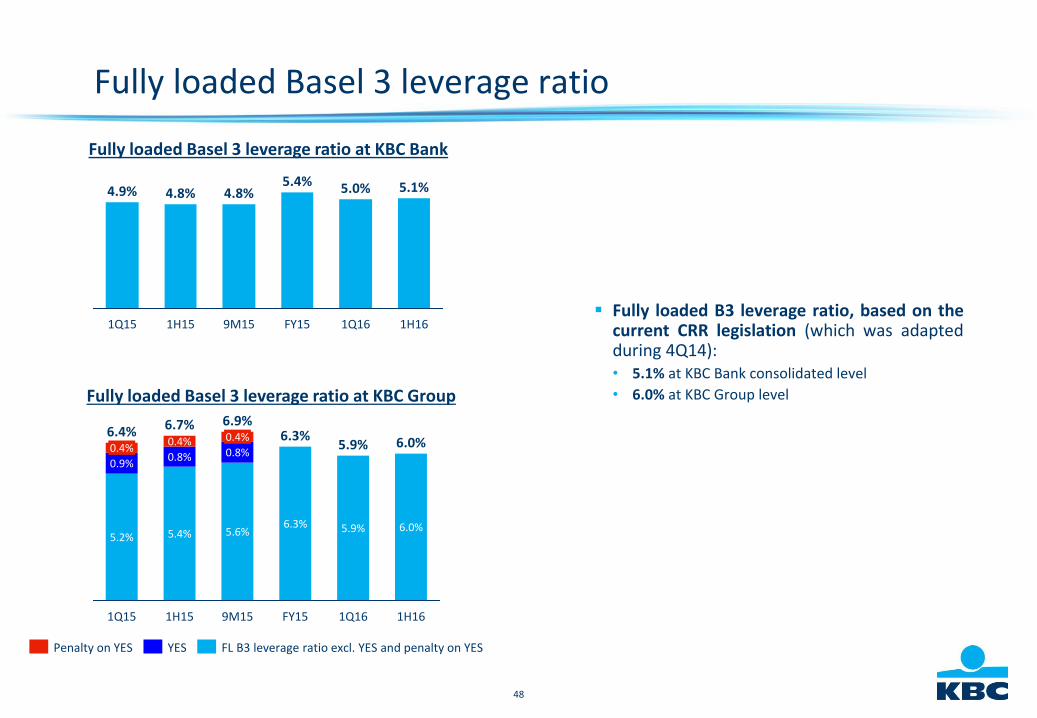
Fully loaded Basel 3 leverage ratio
Fully loaded B3 leverage ratio, based on thecurrent CRR legislation (which was adaptedduring 4Q14):• 5.1% at KBC Bank consolidated level
• 6.0% at KBC Group level
5.1%
1Q16
5.0%
FY15
5.4%
9M15 1H16
4.8%
1H15
4.8%
1Q15
4.9%
Fully loaded Basel 3 leverage ratio at KBC Bank
Fully loaded Basel 3 leverage ratio at KBC Group
6.0%
6.7%
1H15 1Q16
5.9%6.4%
5.2%
0.9%
0.4%
FY15
0.4%
0.8%
6.3%
5.9%
0.8%
5.4%6.3%
9M15
6.9%
5.6%
0.4%
1H16
6.0%
1Q15
Penalty on YES YES FL B3 leverage ratio excl. YES and penalty on YES
49
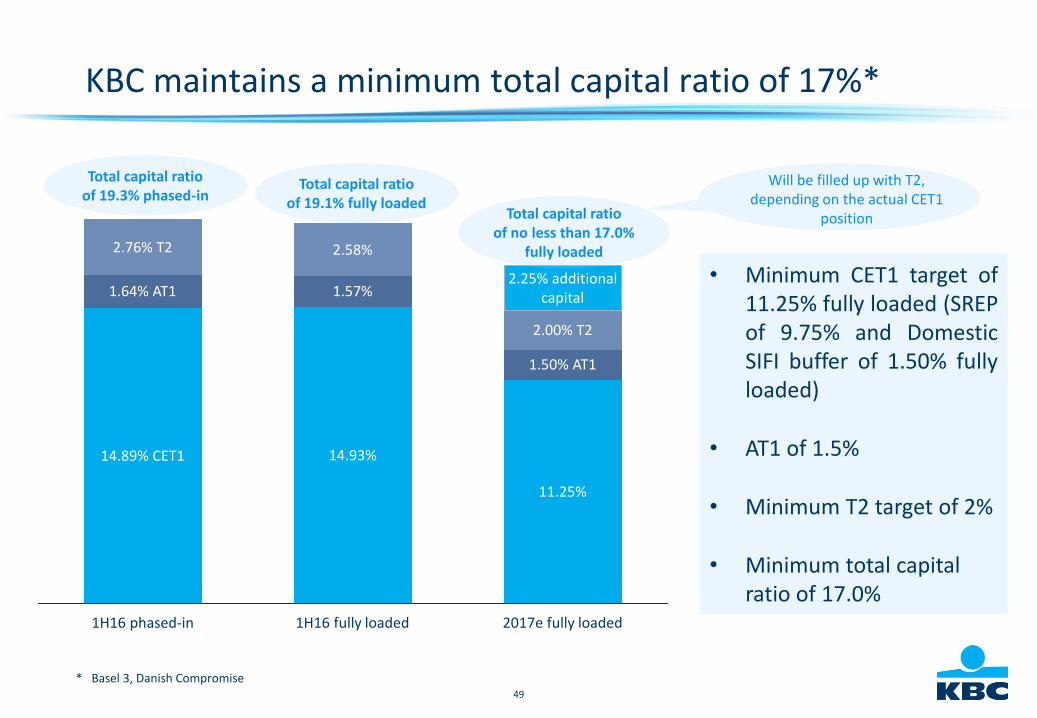
KBC maintains a minimum total capital ratio of 17%*
• Minimum CET1 target of11.25% fully loaded (SREPof 9.75% and DomesticSIFI buffer of 1.50% fullyloaded)
• AT1 of 1.5%
• Minimum T2 target of 2%
• Minimum total capital ratio of 17.0%
Total capital ratioof 19.3% phased-in
2017e fully loaded
11.25%
1.50% AT1
2.00% T2
2.25% additionalcapital
1H16 fully loaded
14.93%
1.57%
2.58%
1H16 phased-in
14.89% CET1
1.64% AT1
2.76% T2
Total capital ratioof no less than 17.0%
fully loaded
Will be filled up with T2, depending on the actual CET1
position
* Basel 3, Danish Compromise
Total capital ratioof 19.1% fully loaded

50
Solid liquidity position (1)
KBC Bank continues to have a strong retail/mid-cap deposit base in its core markets – resulting in a stablefunding mix with a significant portion of the funding attracted from core customer segments & markets
64%70% 69% 73% 75% 73% 73%
8%
8%9%
9% 8% 9% 8%6%
10% 8% 8%8%
5%5%
9%5%
6%
74%
7%
7%
8%7%
7%
8%
2%2%2%0% 9%4%6%3%
8%
FY11
3%
3%
FY10FY09
100%
1H16
-4%
FY15
3%
FY14
3%
FY13
2%
3%
FY12
3%
Funding from customers
Certificates of deposit
Total equity
Debt issues placed with institutional investors
Net secured funding
Net unsecured interbank funding
8%1%
20%
71%
Government and PSE
Debt issues in retail network
Mid-cap
Retail and SME
74% customer
driven
51
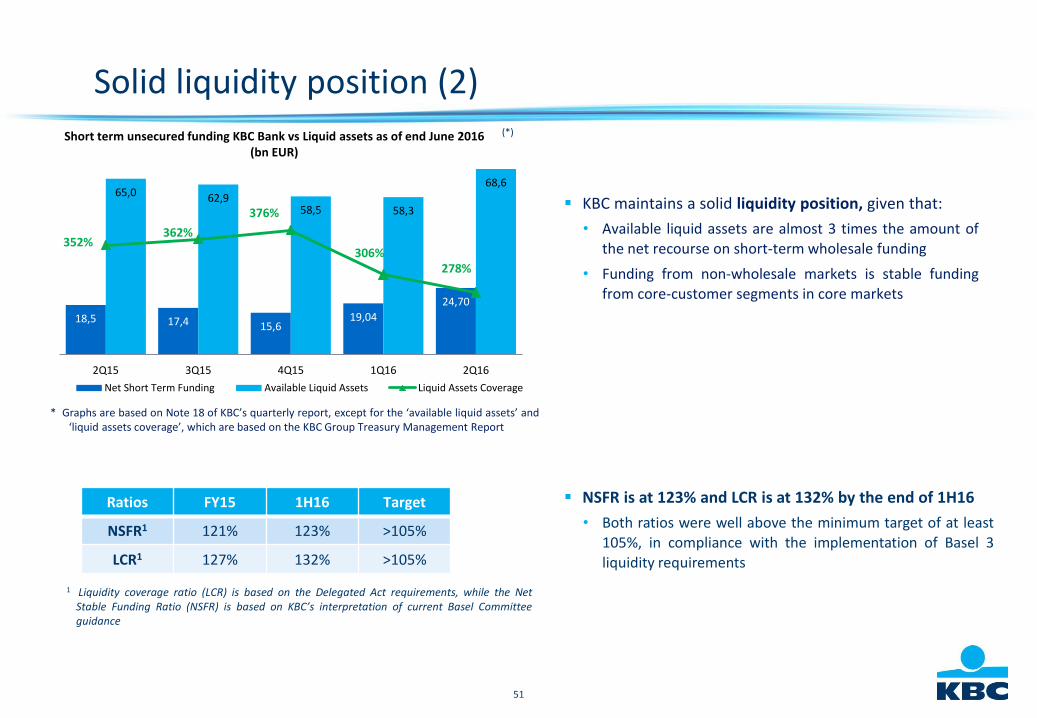
Short term unsecured funding KBC Bank vs Liquid assets as of end June 2016 (bn EUR)
* Graphs are based on Note 18 of KBC’s quarterly report, except for the ‘available liquid assets’ and‘liquid assets coverage’, which are based on the KBC Group Treasury Management Report
(*)
NSFR is at 123% and LCR is at 132% by the end of 1H16
• Both ratios were well above the minimum target of at least105%, in compliance with the implementation of Basel 3liquidity requirements
Solid liquidity position (2)
Ratios FY15 1H16 Target
NSFR1 121% 123% >105%
LCR1 127% 132% >105%
1 Liquidity coverage ratio (LCR) is based on the Delegated Act requirements, while the NetStable Funding Ratio (NSFR) is based on KBC’s interpretation of current Basel Committeeguidance
18,5 17,4 15,619,04
24,70
65,0 62,958,5 58,3
68,6
352%362%
376%
306%278%
2Q15 3Q15 4Q15 1Q16 2Q16
Net Short Term Funding Available Liquid Assets Liquid Assets Coverage
KBC maintains a solid liquidity position, given that:
• Available liquid assets are almost 3 times the amount ofthe net recourse on short-term wholesale funding
• Funding from non-wholesale markets is stable fundingfrom core-customer segments in core markets

52
KBC Group
Section 4
2Q 2016 wrap up
53
2Q 2016 wrap up
Strong commercial bank-insurance results in our core countries
Successful underlying earnings track record
Solid capital and robust liquidity position
54
KBC Group is the bank-insurer that puts its clients centre stage, even in demanding economiccircumstances
We expect the remainder of 2016 to be a year of sustained economic growth in both the euro areaand the US, despite the continuing low level of interest rates, the volatility on the financial marketsand higher than average economic & political uncertainty
Management guides for:• continued stable and solid returns for the Belgium & Czech Republic Business Units
• loan impairments for Ireland towards a 0m-40m EUR range for FY16
• a phased-in B3 common equity ratio of minimum 10.25% for 2016
• LCR and NSFR of at least 105%
Looking forward
55
KBC refines its dividend policy:
Starting as of this year, KBC aims to pay each year an interim dividend of 1 EUR per share inNovember of the accounting year, as an advance on the total dividend. This will ensure a more evenlydistributed cash flow to shareholders throughout the year
The current pay-out ratio policy (i.e. dividend + AT1 coupon) of at least 50% of consolidated profit isconfirmed
At its meeting held on 10 August 2016, the KBC Board of Directors approved an interimdividend* of 1 EUR per share, an advance payment on the total 2016 dividend. This dividendwill be paid on 18 November 2016
KBC Group introduces an interim dividend policy
* Ex-coupon date: 16 November 2016; Payment date: 18 November 2016
56
KBC Group
Annex 1
Company profile
57
Business profile
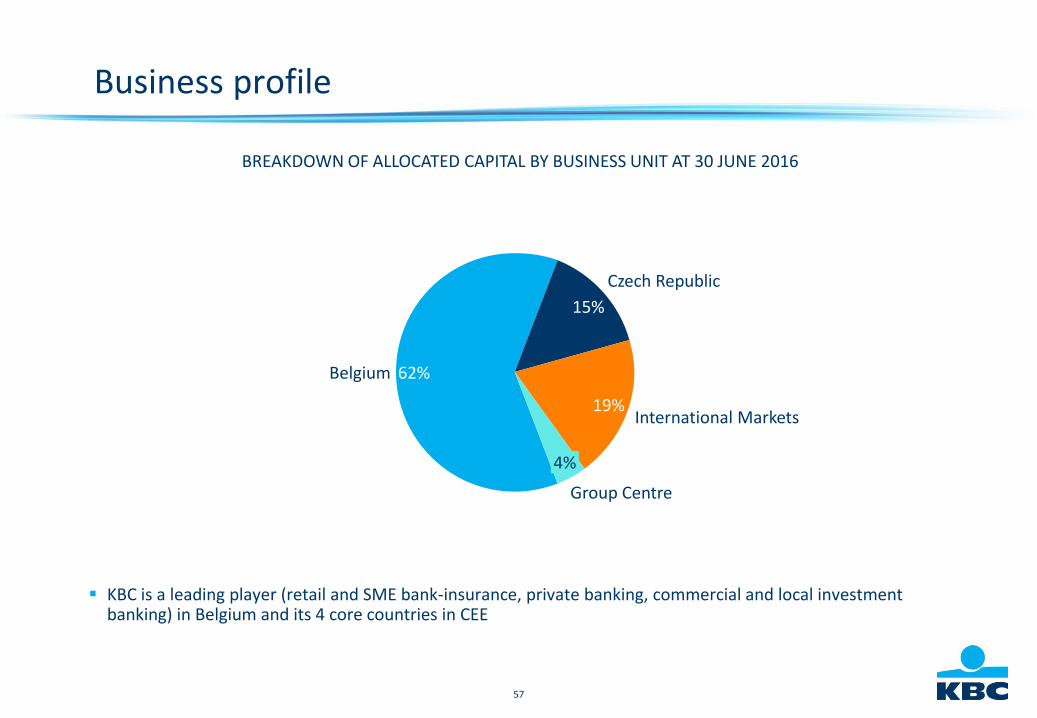
KBC is a leading player (retail and SME bank-insurance, private banking, commercial and local investment banking) in Belgium and its 4 core countries in CEE
BREAKDOWN OF ALLOCATED CAPITAL BY BUSINESS UNIT AT 30 JUNE 2016
Group Centre
4%
International Markets19%
Czech Republic
15%
Belgium 62%
58
BE CZ SK HU BG
Loans and deposits
Investment funds
Life insurance
Non-life insurance
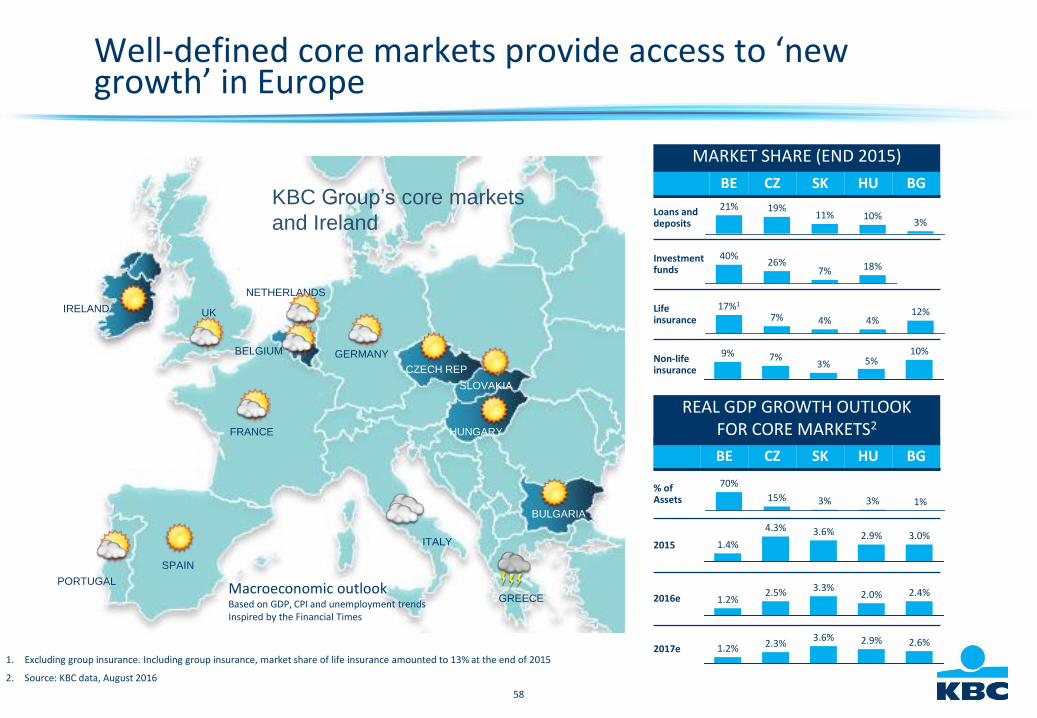
Well-defined core markets provide access to ‘new growth’ in Europe
1. Excluding group insurance. Including group insurance, market share of life insurance amounted to 13% at the end of 2015
2. Source: KBC data, August 2016
MARKET SHARE (END 2015)
21% 19%11% 10%
3%
18%7%26%
40%
7%17%1
12%4%4%
10%5%3%
7%9%
BE CZ SK HU BG
% of Assets
2015
2016e
2017e
1%3%3%15%
70%
3.0%2.9%3.6%4.3%
1.4%
2.4%2.0%3.3%2.5%
1.2%
2.6%2.9%3.6%2.3%1.2%
REAL GDP GROWTH OUTLOOK FOR CORE MARKETS2
Macroeconomic outlookBased on GDP, CPI and unemployment trendsInspired by the Financial Times
IRELAND UK
BELGIUM
NETHERLANDS
GERMANY
CZECH REP
SLOVAKIA
HUNGARY
BULGARIA
GREECE
ITALY
PORTUGAL
SPAIN
FRANCE
KBC Group’s core markets
and Ireland
59
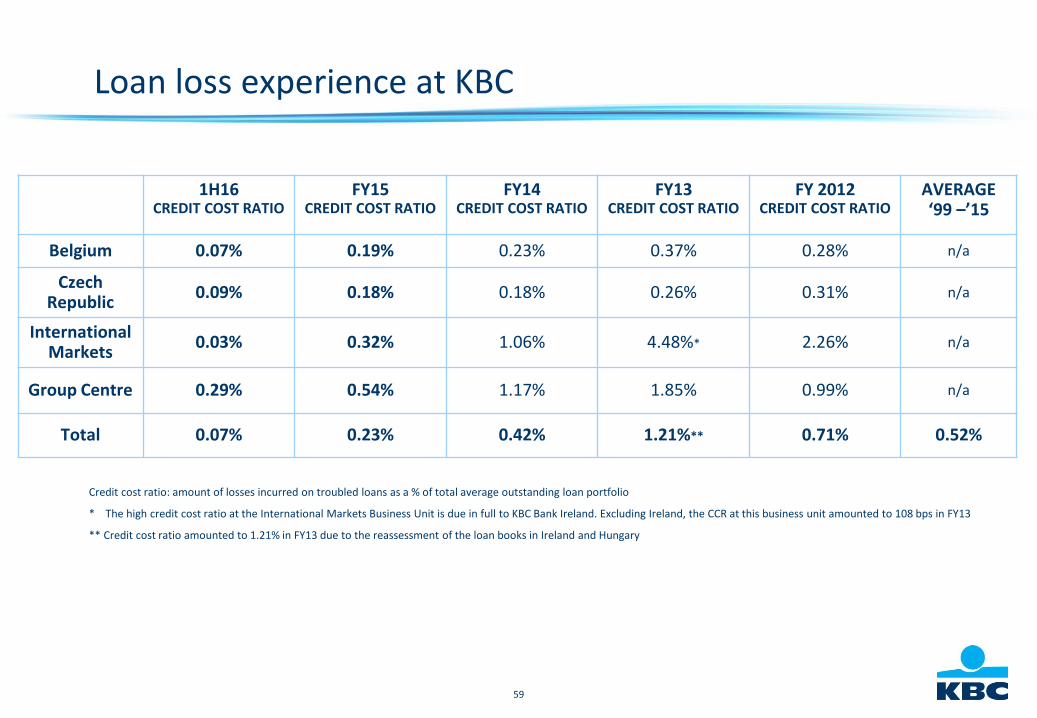
Loan loss experience at KBC
1H16CREDIT COST RATIO
FY15CREDIT COST RATIO
FY14CREDIT COST RATIO
FY13CREDIT COST RATIO
FY 2012CREDIT COST RATIO
AVERAGE ‘99 –’15
Belgium 0.07% 0.19% 0.23% 0.37% 0.28% n/a
Czech Republic
0.09% 0.18% 0.18% 0.26% 0.31% n/a
International Markets
0.03% 0.32% 1.06% 4.48%* 2.26% n/a
Group Centre 0.29% 0.54% 1.17% 1.85% 0.99% n/a
Total 0.07% 0.23% 0.42% 1.21%** 0.71% 0.52%
Credit cost ratio: amount of losses incurred on troubled loans as a % of total average outstanding loan portfolio
* The high credit cost ratio at the International Markets Business Unit is due in full to KBC Bank Ireland. Excluding Ireland, the CCR at this business unit amounted to 108 bps in FY13
** Credit cost ratio amounted to 1.21% in FY13 due to the reassessment of the loan books in Ireland and Hungary
60
Key strengths
Well-developed bank-insurance strategy and strong cross-selling capabilities
Strong commercial bank-insurance franchises in Belgium and the Czech Republic with stable and solid returns
Turnaround achieved in the International Markets Business Unit
Successful underlying earnings track record
Solid capital and robust liquidity position
61
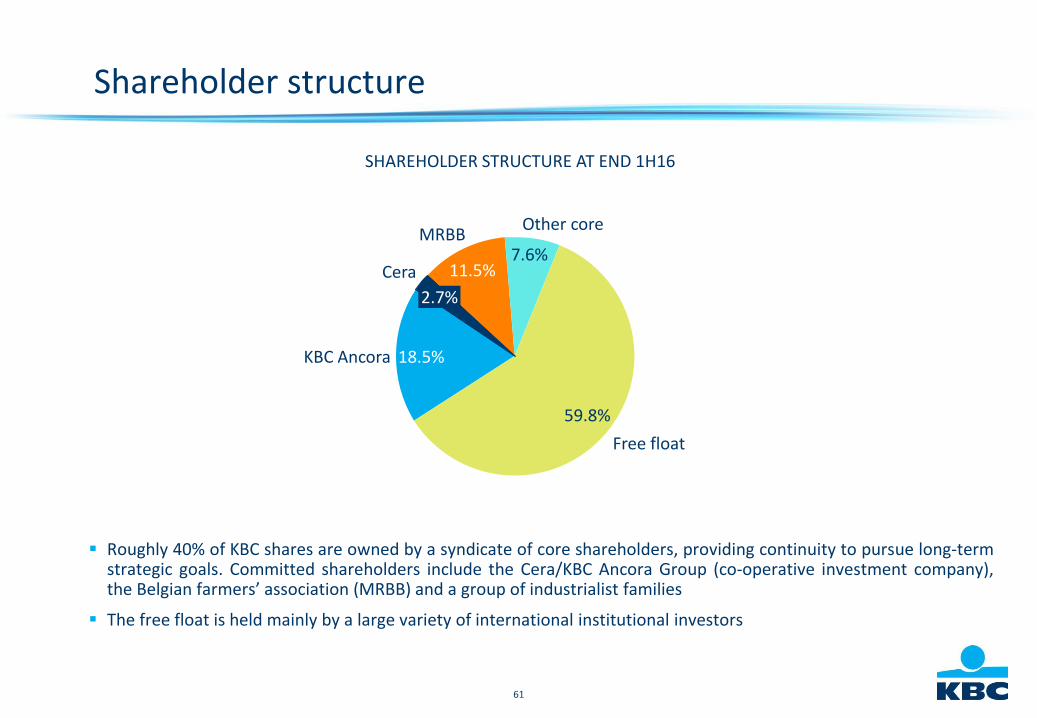
Shareholder structure
Roughly 40% of KBC shares are owned by a syndicate of core shareholders, providing continuity to pursue long-termstrategic goals. Committed shareholders include the Cera/KBC Ancora Group (co-operative investment company),the Belgian farmers’ association (MRBB) and a group of industrialist families
The free float is held mainly by a large variety of international institutional investors
SHAREHOLDER STRUCTURE AT END 1H16
MRBB
Free float
18.5%
7.6%11.5%
Other core
2.7%
Cera
59.8%
KBC Ancora
62
KBC Group going forward:To be among the best performing retail-focused institutions in Europe
KBC wants to build on its strengths and be among Europe’s best performing retail-focused financial institutions. This will be achieved by:
• Strengthening our bank-insurance business model for retail, SME and mid-cap clients in our core markets, in a highly cost-efficient way
• Focusing on sustainable and profitable growth within the framework of solid risk, capital and liquidity management
• Creating superior client satisfaction via a seamless, multi-channel, client-centric distribution approach
By achieving this, KBC wants to become the reference in bank-insurance in its core markets
63
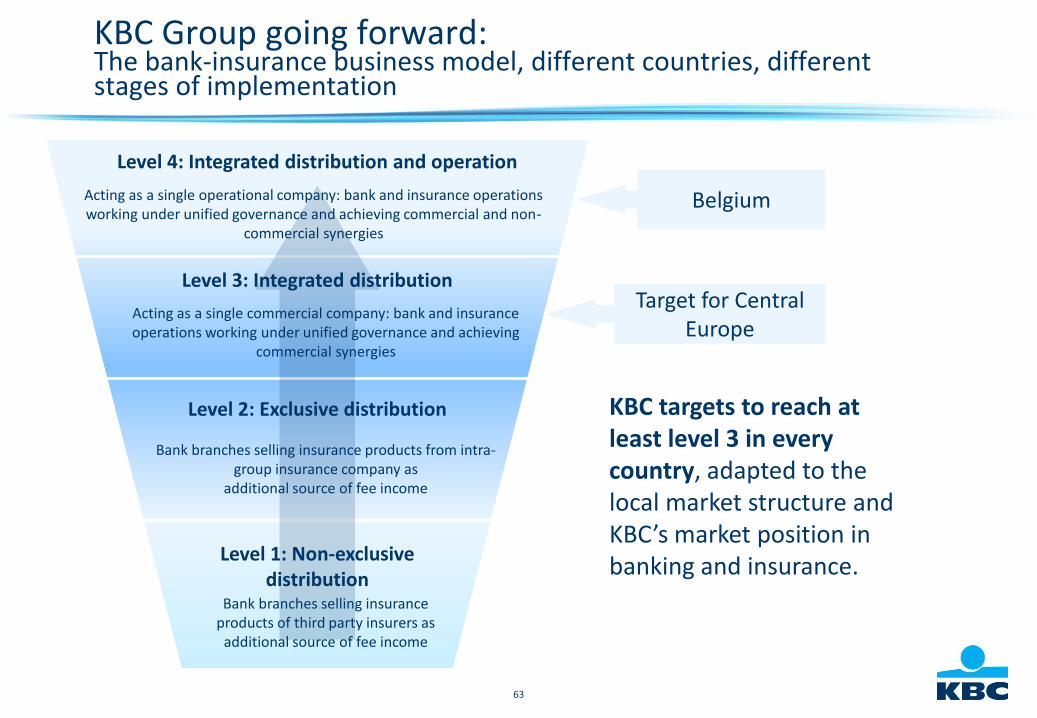
KBC Group going forward:The bank-insurance business model, different countries, different stages of implementation
Bank branches selling insurance products from intra-group insurance company as
additional source of fee income
Bank branches selling insurance products of third party insurers as
additional source of fee income
Acting as a single operational company: bank and insurance operations working under unified governance and achieving commercial and non-
commercial synergies
Acting as a single commercial company: bank and insurance operations working under unified governance and achieving
commercial synergies
Level 4: Integrated distribution and operation
Level 3: Integrated distribution
Level 2: Exclusive distribution
Level 1: Non-exclusive distribution
KBC targets to reach at least level 3 in every country, adapted to the local market structure and KBC’s market position in banking and insurance.
Belgium
Target for Central Europe
64
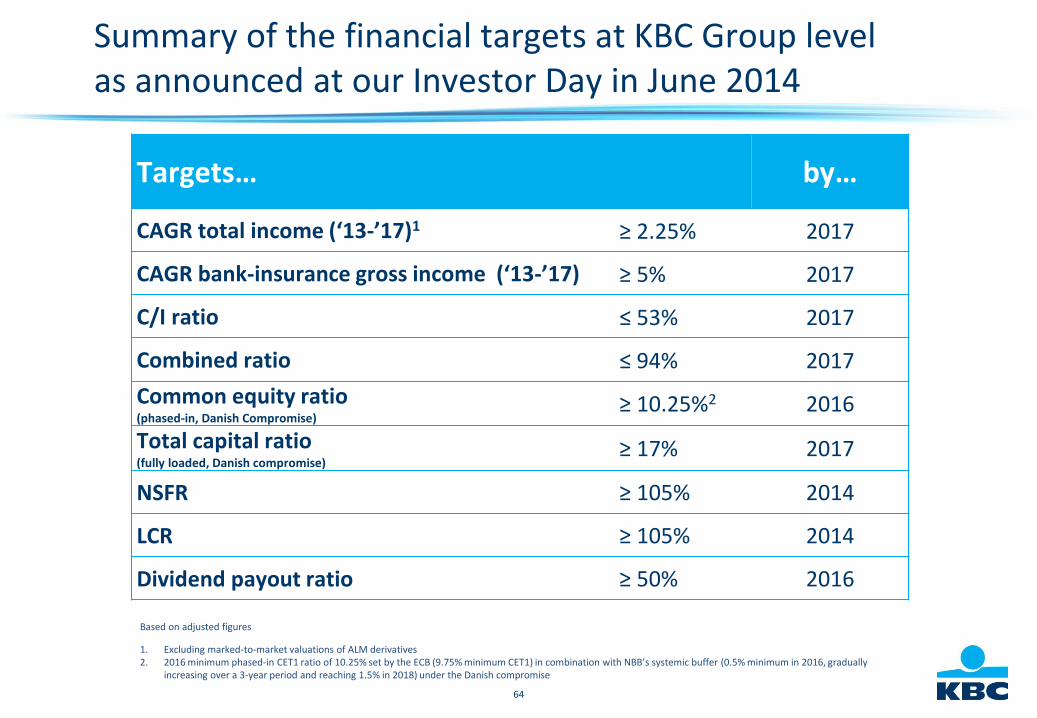
Summary of the financial targets at KBC Group levelas announced at our Investor Day in June 2014
Based on adjusted figures
1. Excluding marked-to-market valuations of ALM derivatives2. 2016 minimum phased-in CET1 ratio of 10.25% set by the ECB (9.75% minimum CET1) in combination with NBB’s systemic buffer (0.5% minimum in 2016, gradually
increasing over a 3-year period and reaching 1.5% in 2018) under the Danish compromise
Targets… by…
CAGR total income (‘13-’17)1 ≥ 2.25% 2017
CAGR bank-insurance gross income (‘13-’17) ≥ 5% 2017
C/I ratio ≤ 53% 2017
Combined ratio ≤ 94% 2017
Common equity ratio (phased-in, Danish Compromise)
≥ 10.25%2 2016
Total capital ratio(fully loaded, Danish compromise)
≥ 17% 2017
NSFR ≥ 105% 2014
LCR ≥ 105% 2014
Dividend payout ratio ≥ 50% 2016
65
KBC Group going forward: An optimised geographic footprint
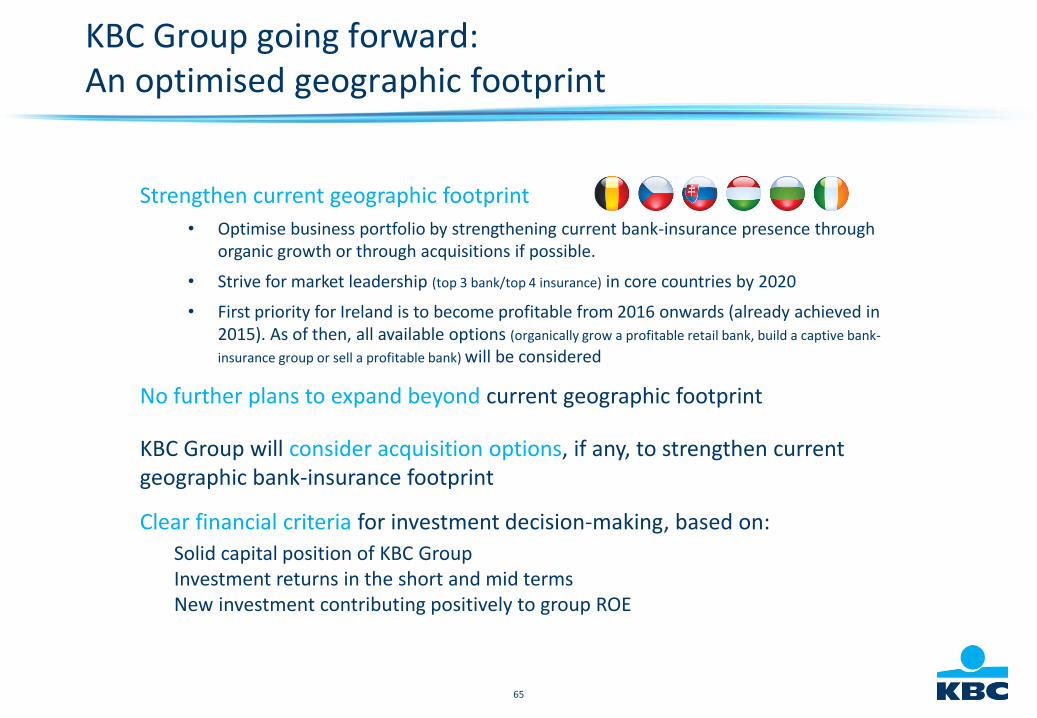
Strengthen current geographic footprint
• Optimise business portfolio by strengthening current bank-insurance presence through organic growth or through acquisitions if possible.
• Strive for market leadership (top 3 bank/top 4 insurance) in core countries by 2020
• First priority for Ireland is to become profitable from 2016 onwards (already achieved in 2015). As of then, all available options (organically grow a profitable retail bank, build a captive bank-
insurance group or sell a profitable bank) will be considered
No further plans to expand beyond current geographic footprint
KBC Group will consider acquisition options, if any, to strengthen current geographic bank-insurance footprint
Clear financial criteria for investment decision-making, based on:
Solid capital position of KBC GroupInvestment returns in the short and mid termsNew investment contributing positively to group ROE
66
KBC Group going forward: An optimised geographic footprint
Become a reference in bank-insurance in each core country
Through a locally embedded bank-insurance business model and a strong corporate culture, creating superior client satisfaction
With a clear focus on sustainable and profitable growth

67
KBC Group
Annex 2
Other items
68
Some specific remarks for 2Q16
• As a result of the public offer of Visa Inc., KBC realised gains (on AFS assets) of 99m pre-tax and 84mpost-tax, of which:• 20m EUR pre-tax (also 20m post-tax) in the Belgium Business Unit• 48m EUR pre-tax and 39m EUR post-tax in the Czech Business Unit• 31m EUR pre-tax and 25m EUR post-tax in the International Markets Business Unit
• The Belgian government replaced the 4 existing taxes by 1, which led to 32m EUR extra bank taxes inthe Belgium BU in 2Q16 (38m EUR additional bank taxes partly offset by the ability to book 6m EURof the ESRF contribution as a non-P&L item)
• In 2Q16, a parameter adjustment was made to the IBNR-models (annual back-test). This resulted in aincrease of impairments by roughly 25m EUR, of which:• 18m EUR in the Belgium Business Unit• 6m in the Czech Business Unit• 1m in Bulgaria (International Markets Business Unit)
• A positive DTA impact of 27m EUR was booked, of which:• +47m DTA adjustment at KBC Credit Investment (in Group Center)• -20m DTA reversal at KBCS (in the Belgium Business Unit)
69
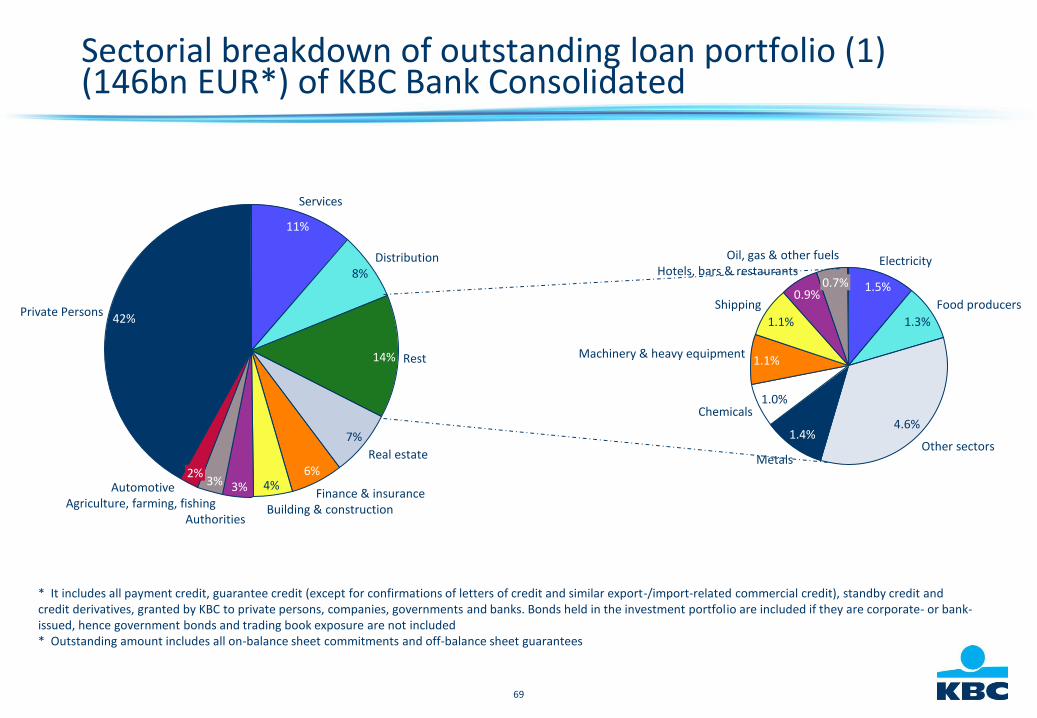
Sectorial breakdown of outstanding loan portfolio (1)(146bn EUR*) of KBC Bank Consolidated
Services
11%
Private Persons42%
Automotive2%
Agriculture, farming, fishing
3%
Authorities
3%
Building & construction
4%Finance & insurance
6%Real estate
7%
Rest14%
Distribution8%
Oil, gas & other fuels
1.5%0.7%Hotels, bars & restaurants
0.9%Shipping
1.1%
Machinery & heavy equipment1.1%
Chemicals1.0%
Metals
1.4%Other sectors
4.6%
Food producers
1.3%
Electricity
* It includes all payment credit, guarantee credit (except for confirmations of letters of credit and similar export-/import-related commercial credit), standby credit and credit derivatives, granted by KBC to private persons, companies, governments and banks. Bonds held in the investment portfolio are included if they are corporate- or bank-issued, hence government bonds and trading book exposure are not included* Outstanding amount includes all on-balance sheet commitments and off-balance sheet guarantees
70
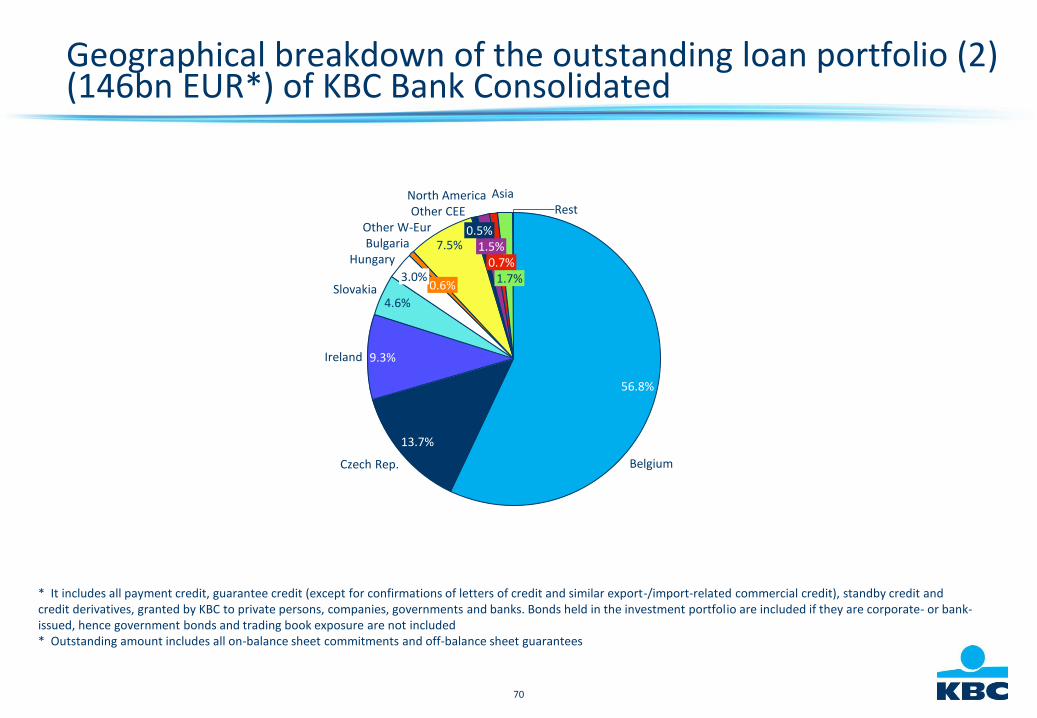
Geographical breakdown of the outstanding loan portfolio (2)(146bn EUR*) of KBC Bank Consolidated
Rest
1.7%
Asia
0.7%
North America
1.5%
Other CEE
0.5%Other W-Eur
7.5%Bulgaria
0.6%
Hungary
3.0%Slovakia
4.6%
Ireland 9.3%
Czech Rep.
13.7%
Belgium
56.8%
* It includes all payment credit, guarantee credit (except for confirmations of letters of credit and similar export-/import-related commercial credit), standby credit and credit derivatives, granted by KBC to private persons, companies, governments and banks. Bonds held in the investment portfolio are included if they are corporate- or bank-issued, hence government bonds and trading book exposure are not included* Outstanding amount includes all on-balance sheet commitments and off-balance sheet guarantees
71
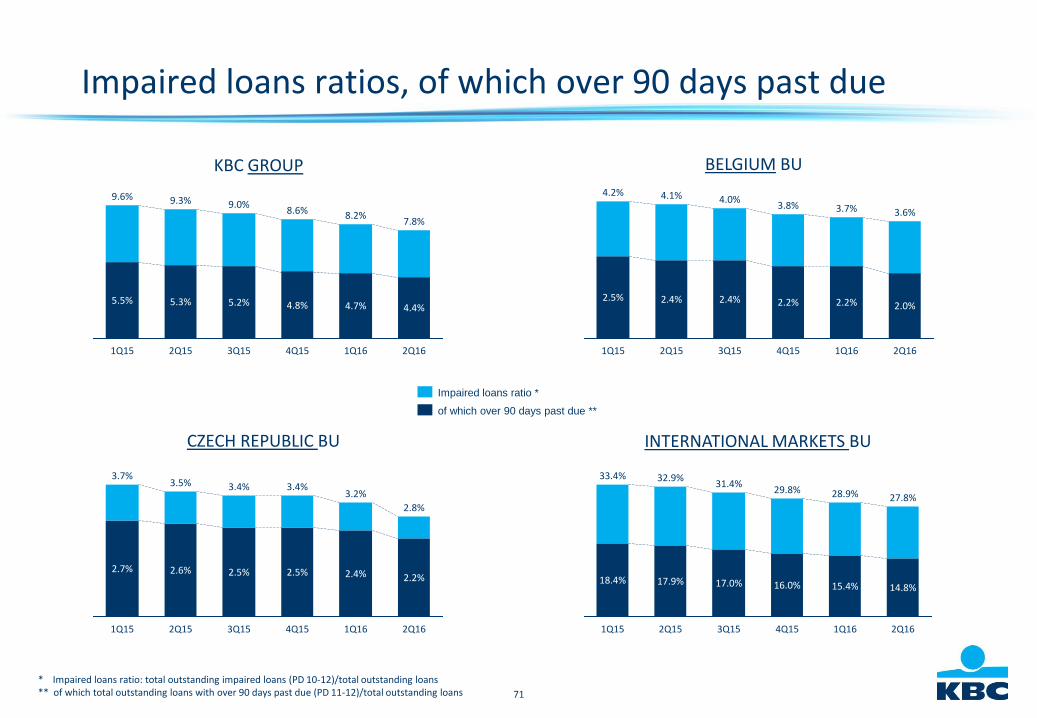
Impaired loans ratios, of which over 90 days past due
INTERNATIONAL MARKETS BUCZECH REPUBLIC BU
2Q15
9.3%
5.3%
1Q15
9.6%
5.5%4.4%
2Q16
7.8%
1Q16
8.2%
4.7%
4Q15
8.6%
4.8%
3Q15
9.0%
5.2%
of which over 90 days past due **
Impaired loans ratio *
2.8%
2.2%
3.4%
2.5%
2Q15
3.5%
2.6%
1Q15
3.7%
2.7%
1Q16
3.2%
2.4%
4Q15
3.4%
2.5%
3Q15 2Q16 1Q16
28.9%
15.4%
2Q16
27.8%
14.8%
4Q15
29.8%
16.0%
3Q15
31.4%
17.0%
2Q15
32.9%
17.9%
1Q15
33.4%
18.4%
BELGIUM BU
1Q15
4.2%
2.5%
2Q161Q16
3.7%
2.2%
4Q15
3.8%
2.2%
3Q15
4.0%
2.4%
2Q15
4.1%
2.4%
3.6%
2.0%
KBC GROUP
* Impaired loans ratio: total outstanding impaired loans (PD 10-12)/total outstanding loans** of which total outstanding loans with over 90 days past due (PD 11-12)/total outstanding loans
72
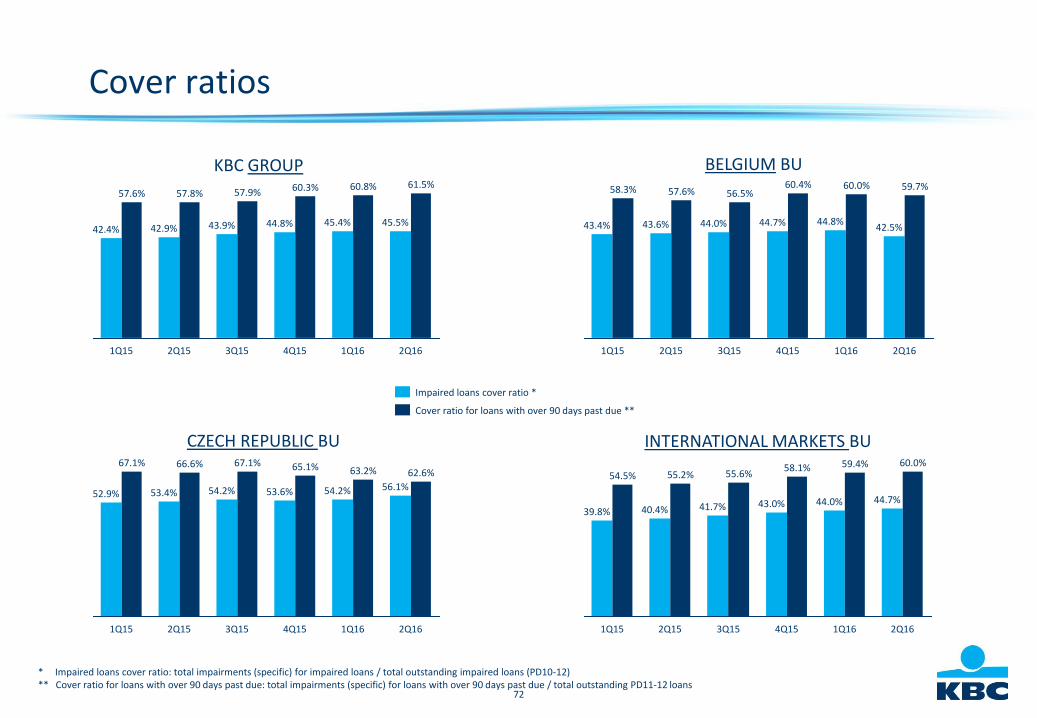
Cover ratios
INTERNATIONAL MARKETS BUCZECH REPUBLIC BU
BELGIUM BUKBC GROUP
* Impaired loans cover ratio: total impairments (specific) for impaired loans / total outstanding impaired loans (PD10-12)** Cover ratio for loans with over 90 days past due: total impairments (specific) for loans with over 90 days past due / total outstanding PD11-12 loans
1Q16
60.8%
45.4%
4Q15
60.3%
44.8%
3Q15
57.9%
43.9%
2Q15
57.8%
42.9%
1Q15
57.6%
42.4%
61.5%
2Q16
45.5%
Cover ratio for loans with over 90 days past due **
Impaired loans cover ratio *
2Q16
56.1%
1Q16
63.2%
54.2%
4Q15
65.1%
53.6%
3Q15
67.1%
54.2%
2Q15
66.6%
53.4%
1Q15
67.1%
52.9%
62.6%
59.7%
2Q16
42.5%
1Q16
60.0%
44.8%
4Q15
60.4%
44.7%
3Q15
56.5%
44.0%
2Q15
57.6%
43.6%
1Q15
58.3%
43.4%
43.0%
3Q152Q15
55.6%
41.7%
4Q15
58.1%
44.0%
59.4%
44.7%
60.0%
2Q16
55.2%
1Q15
54.5%
39.8% 40.4%
1Q16
73
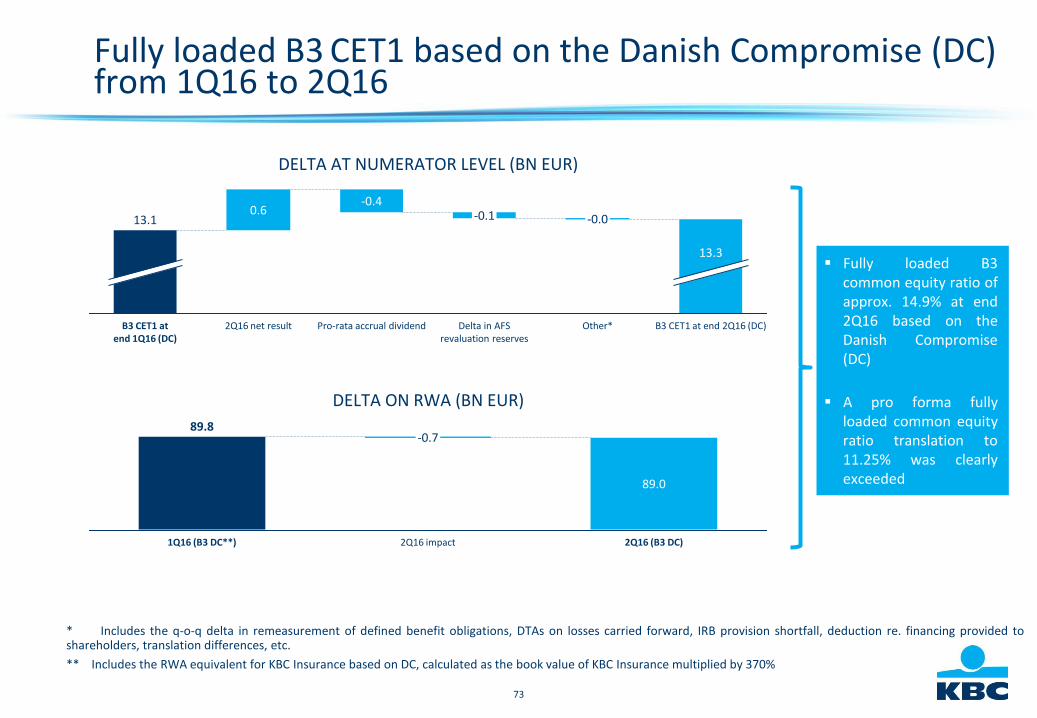
Fully loaded B3 CET1 based on the Danish Compromise (DC)from 1Q16 to 2Q16
Jan 2012 Dec 2012 2014-2020
2Q16 impact1Q16 (B3 DC**)
-0.7
89.0
2Q16 (B3 DC)
89.8
DELTA AT NUMERATOR LEVEL (BN EUR)
DELTA ON RWA (BN EUR)
* Includes the q-o-q delta in remeasurement of defined benefit obligations, DTAs on losses carried forward, IRB provision shortfall, deduction re. financing provided toshareholders, translation differences, etc.
** Includes the RWA equivalent for KBC Insurance based on DC, calculated as the book value of KBC Insurance multiplied by 370%
Fully loaded B3common equity ratio ofapprox. 14.9% at end2Q16 based on theDanish Compromise(DC)
A pro forma fullyloaded common equityratio translation to11.25% was clearlyexceeded
-0.00.6
Pro-rata accrual dividend B3 CET1 at end 2Q16 (DC)Other*
13.1
-0.4
B3 CET1 at end 1Q16 (DC)
2Q16 net result
13.3
-0.1
Delta in AFS revaluation reserves

74
Overview of B3 CET1 ratios at KBC Group
Method Numerator Denominator B3 CET1 ratio
FICOD*, phased-in 13,638 101,353 13.5%
FICOD, fully loaded 13,804 102,237 13.5%
DC**, phased-in 13,125 88,149 14.9%
DC, fully loaded 13,290 89,033 14.9%
DM***, fully loaded 12,151 83,222 14.6%
* FICOD: Financial Conglomerate Directive** DC: Danish Compromise*** DM: Deduction Method
75
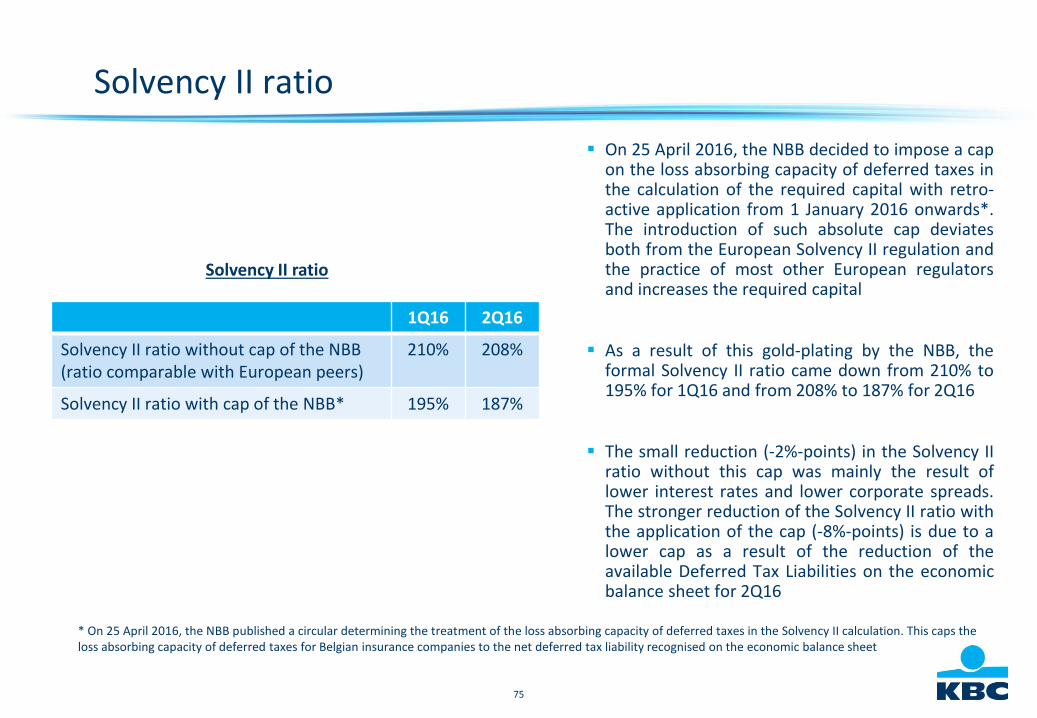
Solvency II ratio
Solvency II ratio
1Q16 2Q16
Solvency II ratio without cap of the NBB(ratio comparable with European peers)
210% 208%
Solvency II ratio with cap of the NBB* 195% 187%
* On 25 April 2016, the NBB published a circular determining the treatment of the loss absorbing capacity of deferred taxes in the Solvency II calculation. This caps theloss absorbing capacity of deferred taxes for Belgian insurance companies to the net deferred tax liability recognised on the economic balance sheet
On 25 April 2016, the NBB decided to impose a capon the loss absorbing capacity of deferred taxes inthe calculation of the required capital with retro-active application from 1 January 2016 onwards*.The introduction of such absolute cap deviatesboth from the European Solvency II regulation andthe practice of most other European regulatorsand increases the required capital
As a result of this gold-plating by the NBB, theformal Solvency II ratio came down from 210% to195% for 1Q16 and from 208% to 187% for 2Q16
The small reduction (-2%-points) in the Solvency IIratio without this cap was mainly the result oflower interest rates and lower corporate spreads.The stronger reduction of the Solvency II ratio withthe application of the cap (-8%-points) is due to alower cap as a result of the reduction of theavailable Deferred Tax Liabilities on the economicbalance sheet for 2Q16
76
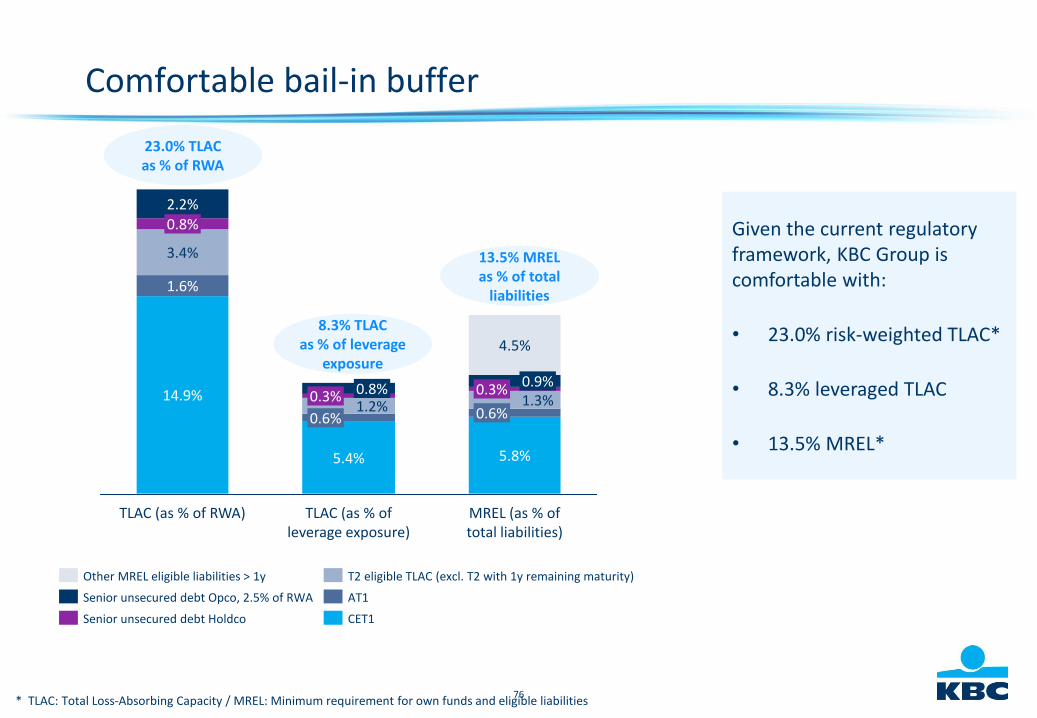
Given the current regulatory framework, KBC Group is comfortable with:
• 23.0% risk-weighted TLAC*
• 8.3% leveraged TLAC
• 13.5% MREL*
23.0% TLAC as % of RWA
MREL (as % of total liabilities)
5.8%
0.6%1.3%0.9%
4.5%
TLAC (as % of leverage exposure)
5.4%
0.6%1.2%0.8%
TLAC (as % of RWA)
14.9%
1.6%
3.4%
2.2%0.8%
0.3%0.3%
Senior unsecured debt Holdco
T2 eligible TLAC (excl. T2 with 1y remaining maturity)
Senior unsecured debt Opco, 2.5% of RWA
Other MREL eligible liabilities > 1y
AT1
CET1
8.3% TLAC as % of leverage
exposure
13.5% MREL as % of total
liabilities
Comfortable bail-in buffer
* TLAC: Total Loss-Absorbing Capacity / MREL: Minimum requirement for own funds and eligible liabilities
77
P&L volatility from ALM derivatives
ALM derivatives (swaps and options) are used to hedge the interest rate risk of the loan & deposit portfolios. This creates an accounting mismatch between derivatives (at market value) and hedged products (at amortised cost)• Options are used to hedge the caps/floors that KBC is obliged by law to include in Belgian mortgages
Most of this mismatch is removed with IFRS hedge accounting
A part of the ALM derivatives has not been included in any hedge accounting structure for different reasons:• Option hedging for mortgage loans: no hedge accounting possible given the dynamic hedging strategy used
• Part of the ALM interest rate derivatives has not been included in a hedge accounting structure, due to the offsetting effect with AFS bonds impact on capital ratios (which is not the case with valuation changes of cash flow hedges due to the applied regulatory capital filter)
78
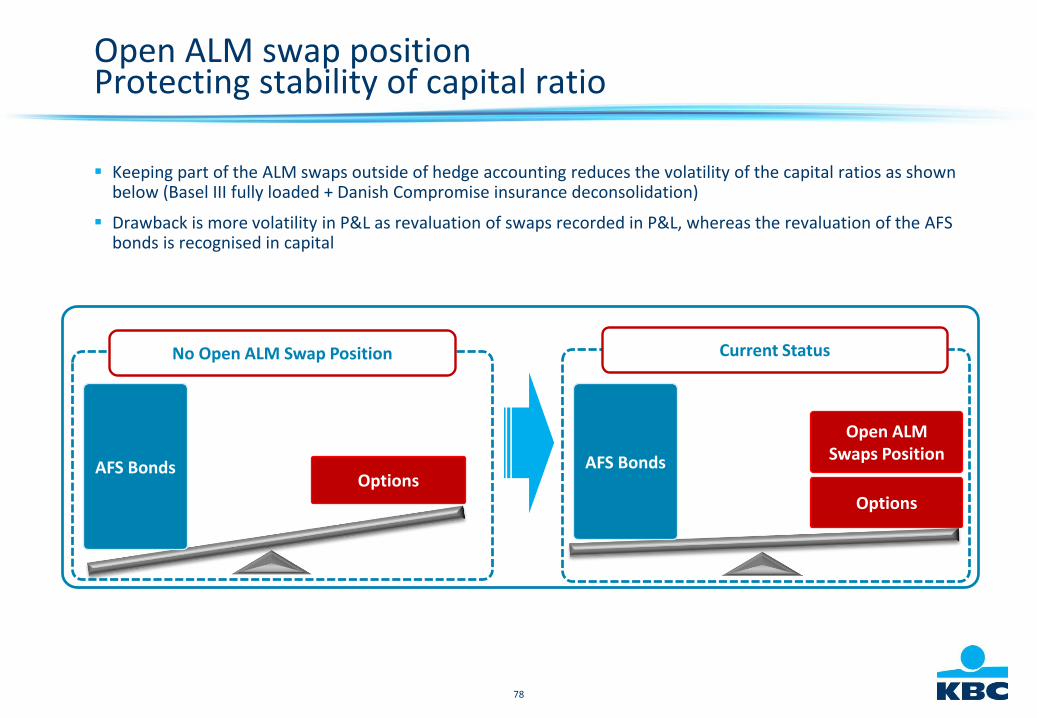
Open ALM swap positionProtecting stability of capital ratio
Keeping part of the ALM swaps outside of hedge accounting reduces the volatility of the capital ratios as shown below (Basel III fully loaded + Danish Compromise insurance deconsolidation)
Drawback is more volatility in P&L as revaluation of swaps recorded in P&L, whereas the revaluation of the AFS bonds is recognised in capital
AFS BondsOptions
AFS Bonds
Options
Open ALM Swaps Position
No Open ALM Swap Position Current Status
79
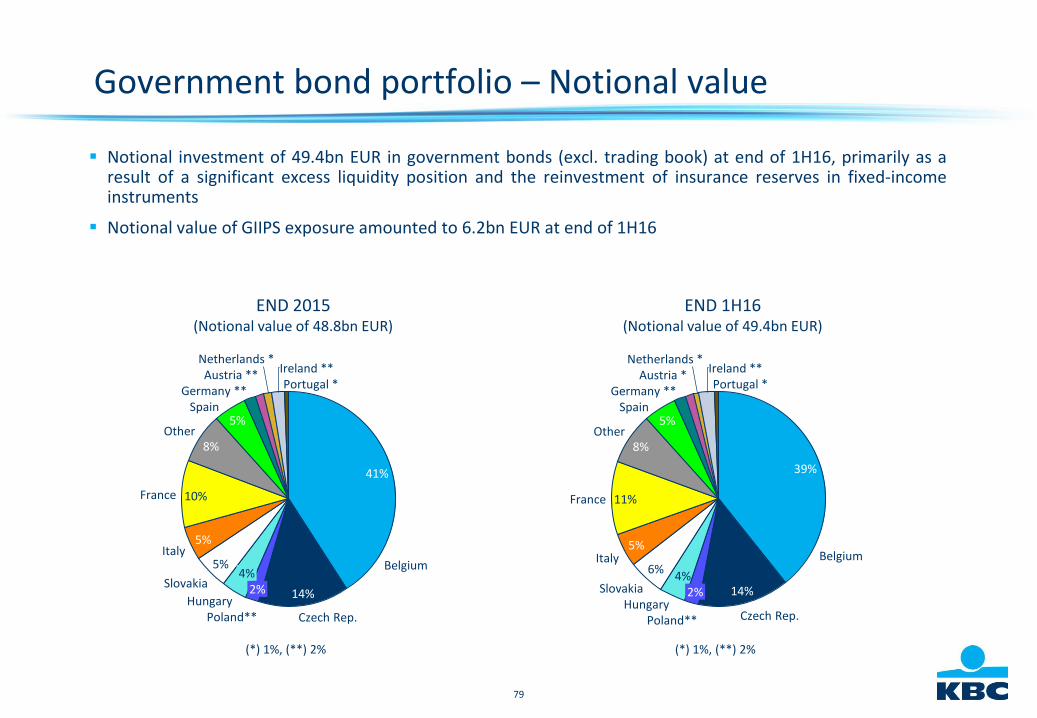
Government bond portfolio – Notional value
Notional investment of 49.4bn EUR in government bonds (excl. trading book) at end of 1H16, primarily as aresult of a significant excess liquidity position and the reinvestment of insurance reserves in fixed-incomeinstruments
Notional value of GIIPS exposure amounted to 6.2bn EUR at end of 1H16
Portugal *Ireland **
Netherlands *Austria *
Germany **Spain
5%Other
8%
France 11%
Italy5%
Slovakia
6%
Hungary
4%
Poland**
2%
Czech Rep.
14%
Belgium
39%
END 1H16(Notional value of 49.4bn EUR)
(*) 1%, (**) 2%
Spain5%
Other8%
France 10%
Italy5%
Slovakia
5%
Hungary
4%
Poland**
2%
Czech Rep.
14%
Belgium
41%
Portugal *Ireland **
Netherlands *Austria **
Germany **
END 2015(Notional value of 48.8bn EUR)
(*) 1%, (**) 2%
80
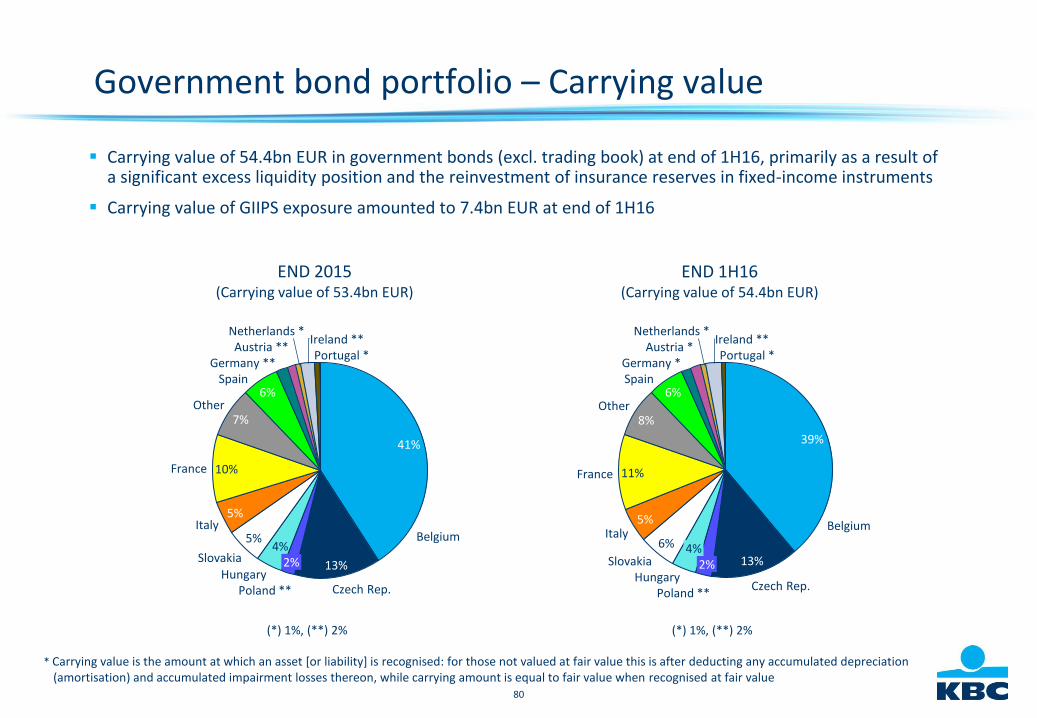
Government bond portfolio – Carrying value
Carrying value of 54.4bn EUR in government bonds (excl. trading book) at end of 1H16, primarily as a result of a significant excess liquidity position and the reinvestment of insurance reserves in fixed-income instruments
Carrying value of GIIPS exposure amounted to 7.4bn EUR at end of 1H16
* Carrying value is the amount at which an asset [or liability] is recognised: for those not valued at fair value this is after deducting any accumulated depreciation (amortisation) and accumulated impairment losses thereon, while carrying amount is equal to fair value when recognised at fair value
END 1H16(Carrying value of 54.4bn EUR)
(*) 1%, (**) 2%
Portugal *Ireland **
Netherlands *Austria *
Germany *Spain
6%Other
8%
France 11%
Italy5%
Slovakia
6%
Hungary
4%
Poland **
2%
Czech Rep.
13%
Belgium
39%
END 2015(Carrying value of 53.4bn EUR)
(*) 1%, (**) 2%
Portugal *Ireland **
Netherlands *Austria **
Germany **Spain
6%Other
7%
France 10%
Italy5%
Slovakia
5%
Hungary
4%
Poland **
2%
Czech Rep.
13%
Belgium
41%
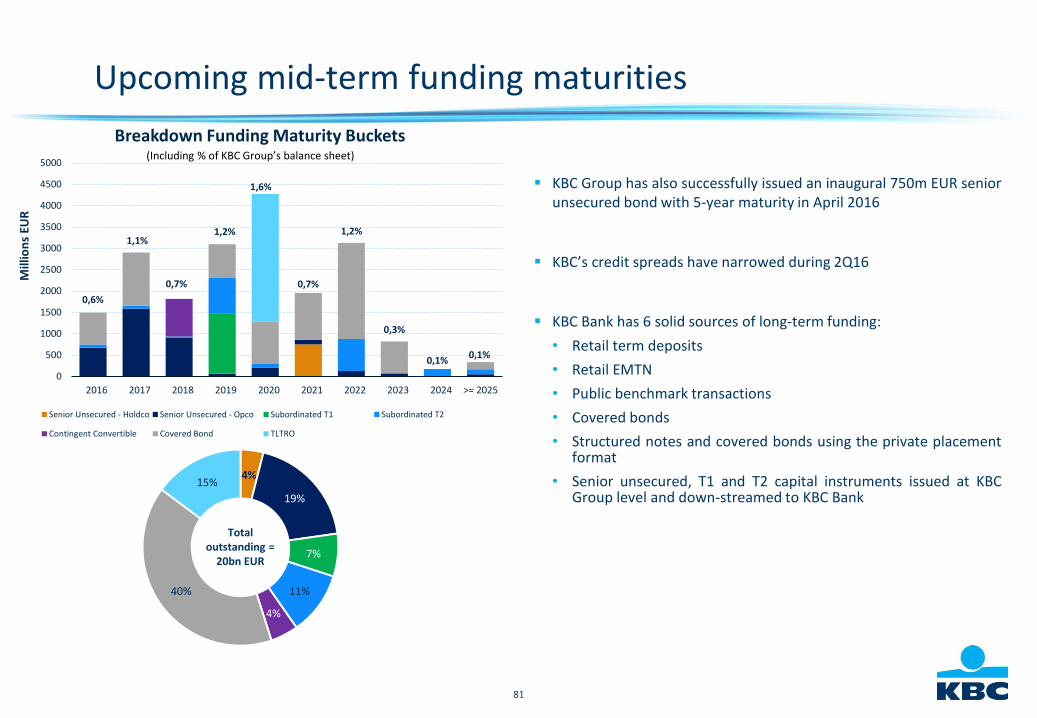
81
Upcoming mid-term funding maturities
KBC Group has also successfully issued an inaugural 750m EUR seniorunsecured bond with 5-year maturity in April 2016
KBC’s credit spreads have narrowed during 2Q16
KBC Bank has 6 solid sources of long-term funding:
• Retail term deposits
• Retail EMTN
• Public benchmark transactions
• Covered bonds
• Structured notes and covered bonds using the private placementformat
• Senior unsecured, T1 and T2 capital instruments issued at KBCGroup level and down-streamed to KBC Bank
4%
19%
7%
11%
4%
40%
15%
0,6%
1,1%
0,7%
1,2%
1,6%
0,7%
1,2%
0,3%
0,1%0,1%
0
500
1000
1500
2000
2500
3000
3500
4000
4500
5000
2016 2017 2018 2019 2020 2021 2022 2023 2024 >= 2025
Mill
ion
sEU
R
Breakdown Funding Maturity Buckets
Senior Unsecured - Holdco Senior Unsecured - Opco Subordinated T1 Subordinated T2
Contingent Convertible Covered Bond TLTRO
Total outstanding =
20bn EUR
(Including % of KBC Group’s balance sheet)
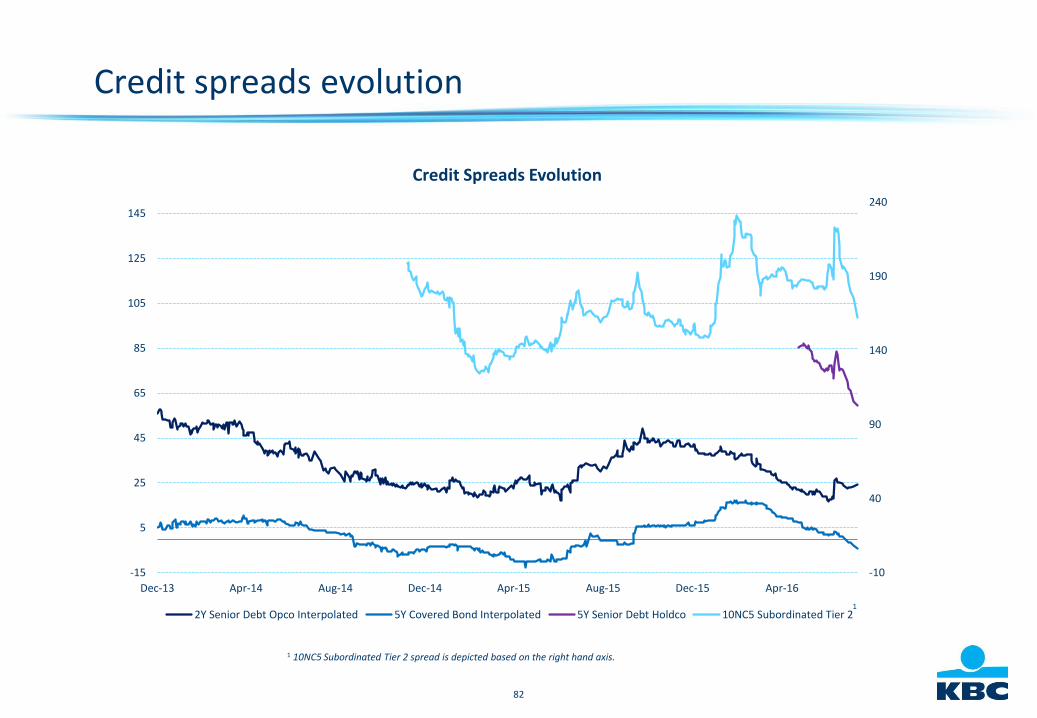
82
-10
40
90
140
190
240
-15
5
25
45
65
85
105
125
145
Dec-13 Apr-14 Aug-14 Dec-14 Apr-15 Aug-15 Dec-15 Apr-16
Credit Spreads Evolution
2Y Senior Debt Opco Interpolated 5Y Covered Bond Interpolated 5Y Senior Debt Holdco 10NC5 Subordinated Tier 2
Credit spreads evolution
1 10NC5 Subordinated Tier 2 spread is depicted based on the right hand axis.
1
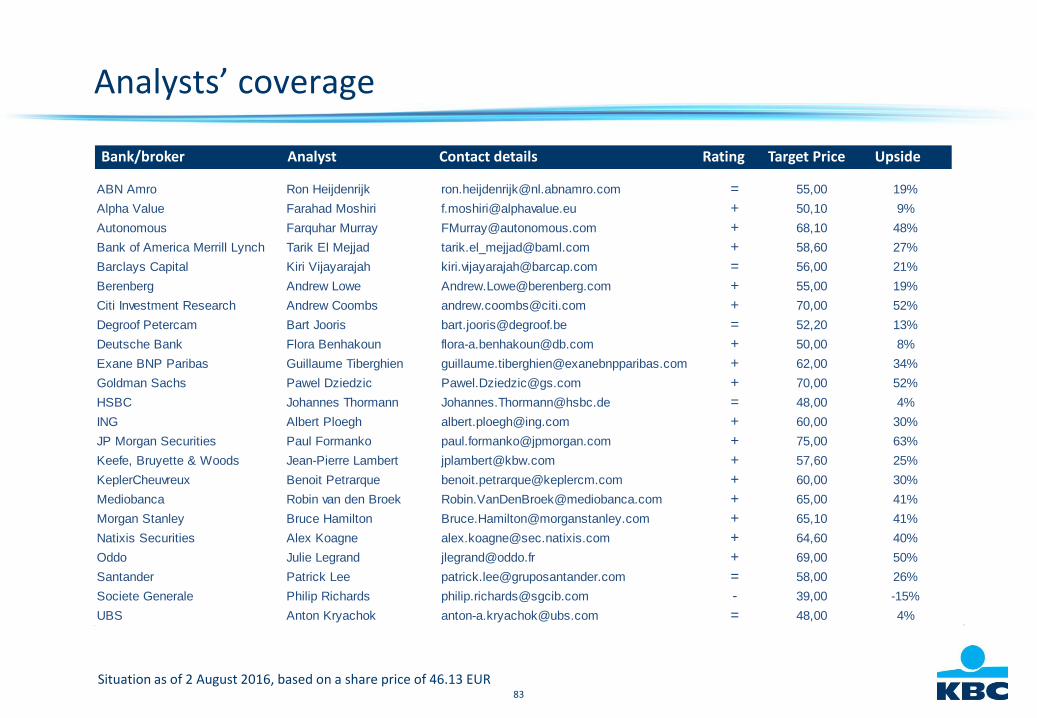
83
Analysts’ coverage
Bank/broker Analyst Contact details Rating Target Price Upside
Situation as of 2 August 2016, based on a share price of 46.13 EUR
ABN Amro Ron Heijdenrijk [email protected] = 55,00 19%
Alpha Value Farahad Moshiri [email protected] + 50,10 9%
Autonomous Farquhar Murray [email protected] + 68,10 48%
Bank of America Merrill Lynch Tarik El Mejjad [email protected] + 58,60 27%
Barclays Capital Kiri Vijayarajah [email protected] = 56,00 21%
Berenberg Andrew Lowe [email protected] + 55,00 19%
Citi Investment Research Andrew Coombs [email protected] + 70,00 52%
Degroof Petercam Bart Jooris [email protected] = 52,20 13%
Deutsche Bank Flora Benhakoun [email protected] + 50,00 8%
Exane BNP Paribas Guillaume Tiberghien [email protected] + 62,00 34%
Goldman Sachs Pawel Dziedzic [email protected] + 70,00 52%
HSBC Johannes Thormann [email protected] = 48,00 4%
ING Albert Ploegh [email protected] + 60,00 30%
JP Morgan Securities Paul Formanko [email protected] + 75,00 63%
Keefe, Bruyette & Woods Jean-Pierre Lambert [email protected] + 57,60 25%
KeplerCheuvreux Benoit Petrarque [email protected] + 60,00 30%
Mediobanca Robin van den Broek [email protected] + 65,00 41%
Morgan Stanley Bruce Hamilton [email protected] + 65,10 41%
Natixis Securities Alex Koagne [email protected] + 64,60 40%
Oddo Julie Legrand [email protected] + 69,00 50%
Santander Patrick Lee [email protected] = 58,00 26%
Societe Generale Philip Richards [email protected] - 39,00 -15%
UBS Anton Kryachok [email protected] = 48,00 4%
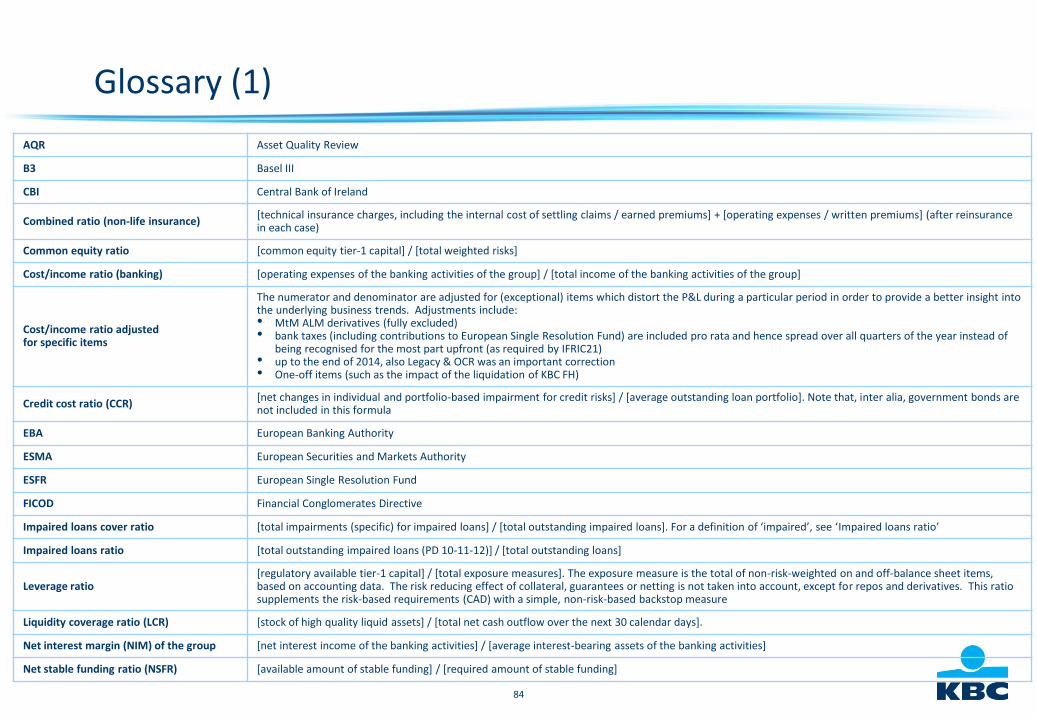
84
Glossary (1)
AQR Asset Quality Review
B3 Basel III
CBI Central Bank of Ireland
Combined ratio (non-life insurance)[technical insurance charges, including the internal cost of settling claims / earned premiums] + [operating expenses / written premiums] (after reinsurance in each case)
Common equity ratio [common equity tier-1 capital] / [total weighted risks]
Cost/income ratio (banking) [operating expenses of the banking activities of the group] / [total income of the banking activities of the group]
Cost/income ratio adjusted for specific items
The numerator and denominator are adjusted for (exceptional) items which distort the P&L during a particular period in order to provide a better insight into the underlying business trends. Adjustments include: • MtM ALM derivatives (fully excluded)• bank taxes (including contributions to European Single Resolution Fund) are included pro rata and hence spread over all quarters of the year instead of
being recognised for the most part upfront (as required by IFRIC21)• up to the end of 2014, also Legacy & OCR was an important correction• One-off items (such as the impact of the liquidation of KBC FH)
Credit cost ratio (CCR)[net changes in individual and portfolio-based impairment for credit risks] / [average outstanding loan portfolio]. Note that, inter alia, government bonds are not included in this formula
EBA European Banking Authority
ESMA European Securities and Markets Authority
ESFR European Single Resolution Fund
FICOD Financial Conglomerates Directive
Impaired loans cover ratio [total impairments (specific) for impaired loans] / [total outstanding impaired loans]. For a definition of ‘impaired’, see ‘Impaired loans ratio’
Impaired loans ratio [total outstanding impaired loans (PD 10-11-12)] / [total outstanding loans]
Leverage ratio[regulatory available tier-1 capital] / [total exposure measures]. The exposure measure is the total of non-risk-weighted on and off-balance sheet items, based on accounting data. The risk reducing effect of collateral, guarantees or netting is not taken into account, except for repos and derivatives. This ratio supplements the risk-based requirements (CAD) with a simple, non-risk-based backstop measure
Liquidity coverage ratio (LCR) [stock of high quality liquid assets] / [total net cash outflow over the next 30 calendar days].
Net interest margin (NIM) of the group [net interest income of the banking activities] / [average interest-bearing assets of the banking activities]
Net stable funding ratio (NSFR) [available amount of stable funding] / [required amount of stable funding]
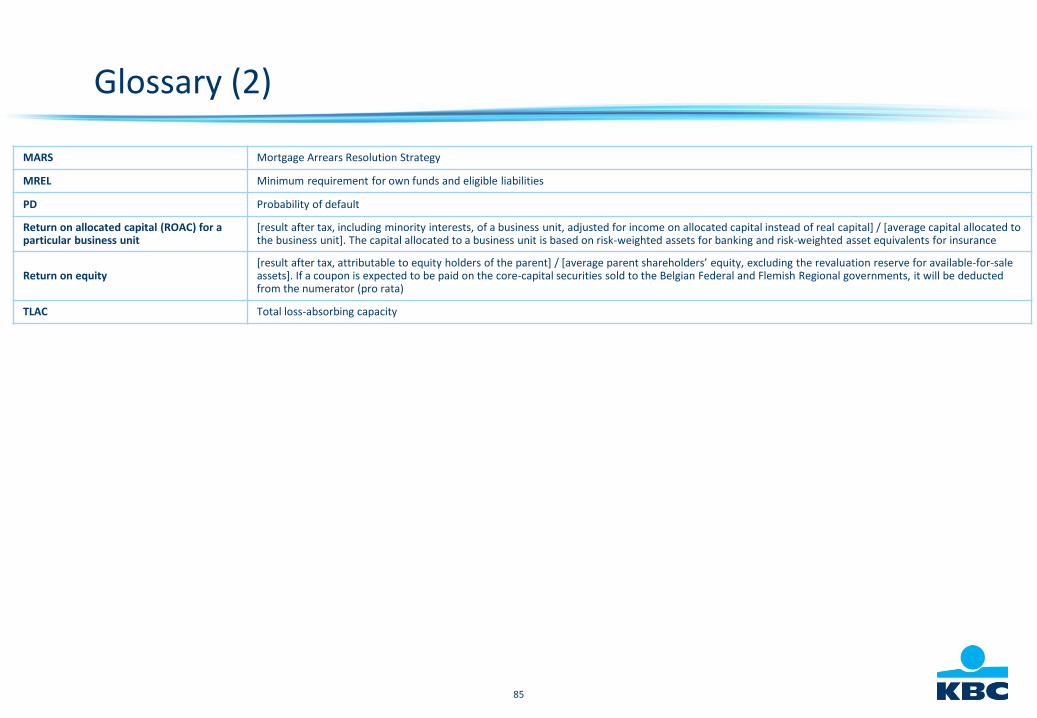
85
Glossary (2)
MARS Mortgage Arrears Resolution Strategy
MREL Minimum requirement for own funds and eligible liabilities
PD Probability of default
Return on allocated capital (ROAC) for a particular business unit
[result after tax, including minority interests, of a business unit, adjusted for income on allocated capital instead of real capital] / [average capital allocated to the business unit]. The capital allocated to a business unit is based on risk-weighted assets for banking and risk-weighted asset equivalents for insurance
Return on equity[result after tax, attributable to equity holders of the parent] / [average parent shareholders’ equity, excluding the revaluation reserve for available-for-sale assets]. If a coupon is expected to be paid on the core-capital securities sold to the Belgian Federal and Flemish Regional governments, it will be deducted from the numerator (pro rata)
TLAC Total loss-absorbing capacity

86
Contact informationInvestor Relations OfficeE-mail: [email protected]
www.kbc.comvisit for the latest update