kansas department of health and environment bureau of water · kansas department of health and...
TRANSCRIPT

KANSAS DEPARTMENT OF HEALTH AND ENVIRONMENT Bureau of Water
Simplified Vulnerability Assessment Tool for
Drinking Water
www.kdheks.gov
Our Mission: To protect and improve the health and environment of all Kansans.

K A N S A S D E P A R T M E N T O F H E A L T H A N D E N V I R O N M E N T
Simplified Vulnerability Assessment Tool for Drinking Water
Updated February 2013
KDHE-BOW 1000 SW Jackson Street • Suite 420
Phone 785.296.5504 • Fax 785.296.5509

Table of ContentsIntroduction i
C H A P T E R 1
An Overview of Risk Minimization 1
C H A P T E R 2
Probability of Threats to Assets 4
C H A P T E R 3
Consequences of Threats 6
C H A P T E R 4
Deterrents to Threats 7
C H A P T E R 5
Risk Assessment- Putting it All Together 11
A P P E N D I X A
KDHE Water System Security Brochure 15
A P P E N D I X B
Example Risk Evaluation for a Well House 18
V U L N E R A B I L I T Y A N A L Y S I S – D R I N K I N G W A T E R
An Overview of Risk Minimization Using risk assessment methods to assess the vulnerability of a water supply.
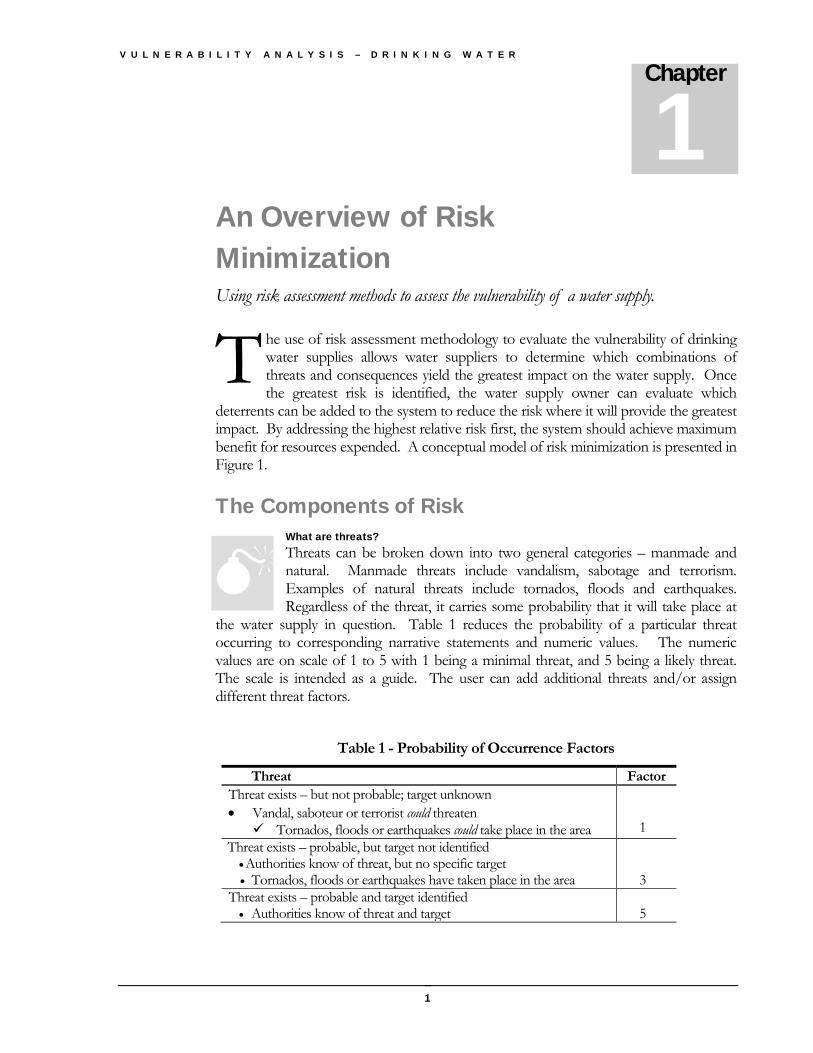
he use of risk assessment methodology to evaluate the vulnerability of drinking water supplies allows water suppliers to determine which combinations of threats and consequences yield the greatest impact on the water supply. Once the greatest risk is identified, the water supply owner can evaluate which
deterrents can be added to the system to reduce the risk where it will provide the greatest impact. By addressing the highest relative risk first, the system should achieve maximum benefit for resources expended. A conceptual model of risk minimization is presented in Figure 1.
The Components of Risk What are threats? Threats can be broken down into two general categories – manmade and natural. Manmade threats include vandalism, sabotage and terrorism. Examples of natural threats include tornados, floods and earthquakes. Regardless of the threat, it carries some probability that it will take place at
the water supply in question. Table 1 reduces the probability of a particular threat occurring to corresponding narrative statements and numeric values. The numeric values are on scale of 1 to 5 with 1 being a minimal threat, and 5 being a likely threat. The scale is intended as a guide. The user can add additional threats and/or assign different threat factors.
Table 1 - Probability of Occurrence Factors
Threat Factor Threat exists – but not probable; target unknown • Vandal, saboteur or terrorist could threaten Tornados, floods or earthquakes could take place in the area
1 Threat exists – probable, but target not identified
• Authorities know of threat, but no specific target • Tornados, floods or earthquakes have taken place in the area
3 Threat exists – probable and target identified • Authorities know of threat and target
5
Chapter
1
T
1

V U L N E R A B I L I T Y A N A L Y S I S – D R I N K I N G W A T E R
Figure 1 – Risk Concepts
What are Consequences? Consequences are outcomes that can be expected if a threat is carried out. For instance, if a tornado would disrupt electrical power to a well, the consequence would be that the well would not function, and the supply would lose the water produced from that well. The loss of water may or
may not affect end users, depending on the presence or absence of other sources of water. Generally, consequences of a threat carried out on a water supply can affect the quantity and/or quality of water supplied, as well as general sanitation and safety issues in a community. For instance, it might be possible to provide water that would not be potable, but could be used for fire fighting and sanitary purposes. Table 2 reduces the consequences of threats to corresponding narrative statements and numeric values. The numeric values are on scale of 1 to 5 with 1 being a minimal consequence, and 5 being a severe consequence. Again, The scale is intended as a guide. The user can add additional consequences and/or assign different consequence factors.
MINIMIZE RISK
Assess Effectivenessof Deterrents
AssessConsequences of
Threat
Probability ofThreat
Identify Assets
Identify Deterrents
Sabotage
Terro
rism
Vandalism Flood
Tornado
IceManmade Natural
Facility
Source Distrib
ution
Cameras
Motion Sensors
Detection
Bars on Windows Locks
Fence
Delay
Law Enforcement
Guards
Response
Identify Threats
SanitationQuality
Quantity
Assets
Backup Power
Spare Parts
Spar
e U
nits
Redundancy
Consequences
Risk and Drinking Water Supplies
Power
Loss Spill
Intentional
Uni
nten
tiona
l
2

V U L N E R A B I L I T Y A N A L Y S I S – D R I N K I N G W A T E R
Table 2 - Severity of Consequence Factors
Consequence Factor Normal supply of safe water – all demands met 1 Adequate supply of safe water –all emergency demands met 2 Inadequate supply of safe water - parts of system without water 3 No supply of safe water - only contaminated water available for fire fighting and sanitary needs
4
No water available - system shut down 5
What are deterrents? Deterrents refer to actions taken to protect a water supply and reduce the consequences that may occur if a threat is carried out. In terms of intentional manmade threats, deterrents can be thought of as security measures – such as a fence, locks and cameras. In terms of the natural and
unintentional manmade threats, deterrents can include design redundancy (an alternate supply source, spare treatment units or a backup power source), availability of spare parts, good safety practices and source water protection. In risk analysis, the effectiveness of deterrents needs to be evaluated. Table 3 reduces the effectiveness of deterrents to corresponding narrative statements and numeric values. The numeric values are on scale of 1 to 5 with 1 being highly effective deterrents, and 5 being no deterrents. Again, the scale is intended as a guide. The user can add additional effectiveness levels and/or assign different effectiveness factors.
Table 3 - Deterrent Effectiveness Factors
Effectiveness of Deterrents Factor Highly effective deterrents
• Physical means to detect, delay and respond to threat in place • Additional source of supply readily available
1 Moderately effective deterrents
• Physical means to delay vandals in place • Key spare parts available
3 Ineffective deterrents
• No physical means to detect, delay and respond to threat in place • No alternate source of supply or key spare parts available.
5
3

V U L N E R A B I L I T Y A N A L Y S I S – D R I N K I N G W A T E R
Probability of Threats to Assets How likely is a threat to actually occur?
hreats to water supplies carry some degree of probability that they will actually occur. In terms of manmade types of threats, the probability of vandalism and sabotage threats are best determined by the water supply. Have these types of threats been observed in the past? Certainly, vandalism has occurred in many, if
not most, water supply systems. Typically, vandalism is considered a threat that is likely to occur. Sabotage, on the other hand is rare. Acts of deliberate harm to a system carried out by someone associated with that system have been scarce. Fortunately, credible terroristic threats to systems in Kansas have been virtually non-existent. Therefore, it must be recognized terroristic threats could occur, but do not have a high probability of occurrence. The types of terroristic threats that could affect a supply are chemical, biological, radiological, and destruction/disruption. Due to the large volume of water in a system, chemical and biological agents are thought to be very unlikely contaminants. The agents would be diluted many times over, and possibly rendered less effective by disinfectants used to treat the water. The primary radiological threat is thought to be a “dirty bomb” – explosives combined with waste radiological material. Again, this type of terroristic act is thought to be highly unlikely. The most likely terroristic threat is from destruction of all or a portion of a system by use of conventional explosives. Explosives are readily available, and many public water supply assets are not well protected. Destruction of specific system components could render a facility unable to supply water. The inability to supply water could cause public health problems and lessen the public’s confidence in the water supplier and ability of various levels of government to protect their interests. When threats are carried out, they are aimed at certain physical components of water or the system assets. Assets typically refer to properties owned by a system. For simplification, this document addresses assets in terms of properties and equipment associated with the source of a supply (for example, wells or surface water intakes), treatment facilities and distribution system components (for example, storage, pumping and piping). Figure 2 shows how threats are related to each part of a water supply system.
Chapter
2 T
4

V U L N E R A B I L I T Y A N A L Y S I S – D R I N K I N G W A T E R
Figure 2 – Threats to Assets
Essentially, Figure 2 puts forth the idea that each threat needs to be addressed for each asset, since the threat can, and often does affect each asset differently. For example, a system needs to assess the impact of a tornado on the source of the supply, any treatment facilities, and the distribution system. Obviously, if all the distribution system assets are below ground, a tornado poses little threat.
Identify Threatsto Assets
Manmade
Natural
Unintentional
Intentional
TornadoIce StormFlooding
EarthquakeDrought
VandalismSabotageTerrorism
SpillPower Loss
Identify Assets
Source
Treatment Facility
Distribution System
Identify Threats to Assets
5

V U L N E R A B I L I T Y A N A L Y S I S – D R I N K I N G W A T E R
Consequences of Threats How severely will the threat affect the system users?
onsequnces of threats to water supplies can range anywhere from minor to devastating. Most incidents of vandalism result in very minor if any adverse consequence to the users of a system. The system users would not observe any difference in the quantity or quality of water they received. In the case of more
devastating threats such as tornados or possible terrorist attacks, a system might not be able to supply any water to its customers, or the water they are able to supply may not be fit for potable use. The water supplier needs to determine the possible consequence on the system for each of the types of threats identified. Obviously, the greater the consequence of a threat, the greater the risk the supplier will not be able to meet customer demands. As a part of a supply’s Emergency Management Plan (EMP), the supply should identify the quantity and quality of water needed to meet various levels of service. For example, how much, and what water quality is needed to: 1) meet demands of all customers under normal conditions, 2) meet demands of emergency facilities only, or 3) meet non-potable demands? The quantity and quality requirements identified in the EMP will effect the determination of consequences by various threats.
Chapter
3
C
6

V U L N E R A B I L I T Y A N A L Y S I S – D R I N K I N G W A T E R
Deterrents to Threats How effective are the security measures that are in place throughout the system?
eterrents to possible water system threats generally fall into two categories, security measures - such as fences, detection device and cameras - and redundancies built into the system – such as spare treatment units, spare parts and standby power sources. Again, each asset and the deterrents in place at
each asset must be evaluated individually as indicated in Figure 3.
Figure 3 – Deterrent Analysis
The security analysis of each asset needs to take into account the components of detection, delay, and response. The component most often used in water supply systems is delay.
Chapter
4
D
Response
Delay
Detection
Source
Treatment Facility
Distribution Sy stem
IdentifyDeterrents
Identify Deterrents At Assets
Identify Assets
Redundancy
7

V U L N E R A B I L I T Y A N A L Y S I S – D R I N K I N G W A T E R
Well House
xxxxxxxxxxxxxxxxxxxxxxxxxxxxxxxxxxxxxxxxxxxxxx
xxxxxxxxxxxxxxxxxxxxxxxxxxxxxxxxxxxxxxxxxxxxxxx
xxxxxxxxxxxxxxxxxxxxxxxxxxxxxxxxxxxxxxxxxxxxxxxxxxxx
xxxxxxxxxxxxx xxxxxxxxxxxxxxxx
Œ
Œ
ŒŒ Œ
Delay measures include such things as lighting, fencing, locks and grates or bars on windows. These items delay or dissuade an individual who is trying to approach the asset. Therefore, they work well alone if vandalism is the primary threat to an asset. The vandal may decide it is not worth trying to overcome the delay measures. However, these delay measures present only a minor inconvenience to a saboteur or terrorist. If they want to threaten the asset, a fence or lock will not stop them.
Therefore, if the goal is to stop a saboteur or a terrorist, some type of detection system needs to be in place to alert the water supplier that an asset has been compromised. If there is no detection system, the intruder can go undetected and carry out a threat against the asset. A detection system may consist of cameras, motion sensors and door or window sensors. Ideally, after a detection system is triggered, additional mechanisms should be in place to delay the intruder until supplier staff or law enforcement personnel can respond. The goal is to initiate a response before the intruder can damage the system. In other words, the clock starts running when an intruder is detected. If the intruder carries out an attack before there is a successful response, the asset is compromised.
To further understand how detection and delay components might be used, a schematic of a well facility is shown in Figure 4.
- Perimeter Fence
- Perimeter Gate w/Lock
- Hatch w/Lock
- Window w/Grate
- Outer Door w/Lock & Sensor
- Inner Door w/Lock
- Exterior Light
- Security Camera
Figure 4 – Well House Security
8

V U L N E R A B I L I T Y A N A L Y S I S – D R I N K I N G W A T E R
Table 4 was developed utilizing Figure 4 to indicate which well house, security measures are classified as detection or delay. NOTE: KDHE does not specifically endorse the measures indicated here. The measures chosen by a water supplier should be appropriate for the supply’s assets.
Table 4 – Well House Security Features
Additional detection could be added with sensors on the gate, fence, hatch and window. Obviously, this would add to the security costs for the facility. However, it should be noted that many of the sensors could be integrated into an existing system control and data acquisition (SCADA) system for those supplies that already have SCADA capabilities at their central and remote facilities. Thus, a large portion of the cost for adding intrusion detection may already be covered by existing hardware. There would be additional hardware costs for the sensors and reprogramming costs for software.
Deterrents to natural threats consist primarily of providing for redundancy. Ideally, critical backup components should be engineered into the system. This would allow the system to fall back on redundant units if problems occur in the primary units. Additional redundancies to consider include standby power sources and pumps, spare treatment units (such as chlorinators and chemical feeders), spare parts and piping.
Table 5 allows the user to develop an inventory of the deterrents in place to protect their assets.
Item # Name Detection Delay Perimeter Fence Perimeter Gate w/Lock Hatch w/Lock Window w/Grate Outer Door w/Lock and Sensor Inner Door w/Lock Exterior Light Security Camera
9

V U L N E R A B I L I T Y A N A L Y S I S – D R I N K I N G W A T E R
Table 5 - Inventory of Deterrents
Effectiveness of Deterrents Factor Highly effective deterrents
• Physical means to detect, delay, and respond to threat in place • Additional source of supply readily available
1 Moderately effective deterrents
• Physical means to delay vandals in place • Key spare parts available
3 Ineffective deterrents
• No physical means to detect, delay or respond to threat in place • No alternate source of supply or key spare parts available.
5
Asset Y/# N NA Y/# N NA Y/# N NA Y/# N NA1 Fence sensor 1 Fence 1 Utility staff 1 Pumps2 Motion sensor 2 Locks 2 Law Enforcement 2 Power3 SCADA 3 Barbwire 3 Security Company 3 Spare Parts4 4 Lighting 4 45 5 5 56 6 6 67 7 7 78 8 8 89 9 9 910 10 10 101 Fence sensor 1 Fence 1 Utility staff 1 Pumps2 Motion sensor 2 Locks 2 Law Enforcement 2 Power3 SCADA 3 Barbwire 3 Security Company 3 Spare Parts4 4 Lighting 4 45 5 5 56 6 6 67 7 7 78 8 8 89 9 9 910 10 10 101 Fence sensor 1 Fence 1 Utility staff 1 Pumps2 Motion sensor 2 Locks 2 Law Enforcement 2 Power3 SCADA 3 Barbwire 3 Security Company 3 Spare Parts4 4 Lighting 4 45 5 5 56 6 6 67 7 7 78 8 8 89 9 9 910 10 10 10
Trea
tmen
tDi
strib
utio
n Sy
stem
Sour
ceIn Place Deterrents
DelayDetection Response Redundancy
10

V U L N E R A B I L I T Y A N A L Y S I S – D R I N K I N G W A T E R
Risk Assessment - Putting it All Together Calculating the risk equation.
he individual components of risk (R) have been discussed in previous chapters - the probability of a threat taking place (P), the consequences to the supply of water if the threat is carried out (C), and the effectiveness of any deterrents that would mitigate the threat (E). In order to compute the relative risk of each threat
at each asset, a simple equation for determining risk is employed. The equation is simply the product of the components P, C, and E:
R = P x C x E
It should be emphasized that R represents relative risk. In other words, the value of R allows for the ranking or prioritizing of risk. However, it is not appropriate to say that a computed risk value of 6 for Threat X represents twice as much risk as a value of 3 for Threat Y. The only conclusion that should be drawn is that Threat X represents more risk than Threat Y.
To simplify the process of computing risk, Table 6 is provided which addresses a set of threats for a broad set of assets – source, treatment and distribution. Depending on the complexity of a system, the owner may wish to determine risk for specific assets within these three broad sets of assets. For instance, specific distribution system assets may consist of designated pipes, valves and storage tanks. Table 7 can be used to determine the relative risks for additional threats or assets.
In completing a risk table, it is recommended that a group of individuals familiar with the system discuss the numeric factors that will be used for P, C and E. This may include operators, public works directors, board members and law enforcement personnel. Depending on their areas of expertise, the different individuals may see things differently when it comes to assigning numeric values. That is fine. The group can average the values selected by each individual.
Once the table is completed, each threat/asset combination will have a relative risk value. The highest values represent the greatest risk to the system and should be addressed first. The goal of risk management should be to balance risk across system by reducing the highest risk items first.
Chapter
5
T
11

V U L N E R A B I L I T Y A N A L Y S I S – D R I N K I N G W A T E R
How is risk reduced? By modifying the only component of risk the system owner has control over – the effectiveness of deterrents. The owner generally cannot control the probability of a threat, or the consequences of threat if carried out. The owner can control the effectiveness of deterrents, which in turn may lessen the probability of a threat or its consequences. Therefore, the owner should evaluate the highest risk threat/asset combination and determine what deterrents could be added to reduce the value of E. Reducing the value of E will, in turn lower the risk, R. The risk can then be recomputed. Table 5 (along with the use of information similar to that in Figure 4 and Table 4) can be used to determine a numerical value for E and to assess what additional deterrents could be added to the system. Appendix B shows how E can be determined for the well house with existing and additional deterrents and/or system changes.
In closing, it needs to be understood there will always be some degree of risk associated with every water supply system. If the system owner determines a particular level of risk is acceptable for a certain asset; that is fine. However, when it is determined that a particular risk is acceptable, the owner should be sure to address how that particular threat would be handled if it did take place. The system’s Emergency Management Plan (EMP) is the proper place to address how the threat would be handled if it did take place.
A more rigorous approach for risk determination is given in KDHE's Guidance for Developing an Emergency Water Supply Plan, which is a companion document to the State's Drinking Water Supply Emergency Plan. Both documents are available from the Water Supply Section of the Bureau of Water upon request.
12

V U L N E R A B I L I T Y A N A L Y S I S – D R I N K I N G W A T E R
Threat # Threat Name
Probability of Occurrence
(P)
Severity of Consequence
(C)
Effectiveness of Deterrents
(E)Relative Risk (R=PXCXE)
1 Spill - Source2 Power Loss - Source3 Vandalism - Source4 Sabotage - Source5 Terrorism - Source6 Tornado - Source7 Ice Storm - Source8 Flooding - Source9 Earthquake - Source10 Drought - Source11 Spill - Treatment12 Power Loss - Treatment13 Vandalism - Treatment14 Sabotage - Treatment15 Terrorism - Treatment16 Tornado - Treatment17 Ice Storm - Treatment18 Flooding - Treatment19 Earthquake - Treatment20 Drought - Treatment21 Spill - Distribution22 Power Loss - Distribution23 Vandalism - Distribution24 Sabotage - Distribution25 Terrorism - Distribution26 Tornado - Distribution27 Ice Storm - Distribution28 Flooding - Distribution29 Earthquake - Distribution30 Drought - Distribution3132333435
Suggested factors for P, E, and CProbability of Occurrence (P) Effectiveness of Deterrents (E)Threat exists - no other evidence 1 1Threat exists - target not identified 3 3Threat exists - target identified 5 5
Consequence of Action (C)Adequate supply of safe water 1Adequate supply of safe water to meet emergency needs 2Parts of system w/o water 3Contaminated water available for fire fighting, sanitary purposes 4No water available 5
Table 6 - Risk Assessment
Highly effectiveModerately effectiveIneffective
13

V U L N E R A B I L I T Y A N A L Y S I S – D R I N K I N G W A T E R
Threat # Threat Name
Probability of Occurrence
(P)
Severity of Consequence
(C)
Effectiveness of Deterrents
(E)Relative Risk (R=PXCXE)
1234567891011121314151617181920212223242526272829303132333435
Suggested factors for P, E, and CProbability of Occurrence (P) Effectiveness of Deterrents (E)Threat exists - no other evidence 1 1Threat exists - target not identified 3 3Threat exists - target identified 5 5
Consequence of Action (C)Adequate supply of safe water 1Adequate supply of safe water to meet emergency needs 2Parts of system w/o water 3Contaminated water available for fire fighting, sanitary purposes 4No water available 5
Table 7 - Risk Assessment
Highly effectiveModerately effectiveIneffective
14

V U L N E R A B I L I T Y A N A L Y S I S – D R I N K I N G W A T E R
KDHE Water System Security Brochure Simple system improvements.
Appendix
A
15

KANSAS DEPARTMENT OF HEALTH AND ENVIRONMENT
BUREAU OF WATER
1000 SW Jackson, Suite 420 • Topeka, Kansas 66612-1367 • 785.296.5500 March 22, 2002
WATER SYSTEM SECURITY
In the wake of recent terrorist attacks, concerns have been raised about the security of the nation’s drinking water supply. The Kansas Department of Health and Environment (KDHE) is working with other government agencies and water suppliers to review security measures for Kansas drinking water supplies. We have no information that would lead us to believe any Kansas drinking water facility is at risk at this time. We do, however, encourage all facility owners to review their “Emergency Water Supply Plan.” The emergency plan is a valuable tool to assist facility staff in times of terrorist attack or other natural disasters, such as flooding or tornadoes. In addition to the emergency plan, we recommend facility owners review current security measures in place throughout their system and assess the vulnerability of the system to terrorist attack or sabotage. Taking a commonsense approach to security can greatly increase the safety of any system with minimal capital cost. The following measures are recommended as an initial step.
SECURITY CHECKLIST
Establish a clear, written chain-of-command with appropriate telephone, cell phone,
and pager numbers. Incorporate the chain-of-command in the facility’s Emergency Water Supply Plan.
Ensure the existing Emergency Water Supply Plan is up-to-date, including emergency contact telephone numbers. Share the plan with local law enforcement agencies as well as city and county emergency management agencies.
At all facilities, make it a policy to lock all doors and set alarm systems. This is especially true for facilities where gaseous chlorine or dangerous chemicals are stored.
Limit routine access to employees only. Ensure that visitors are checked into facilities and provided with identification so that it is clear they are allowed on the premises.
Instruct employees to question strangers at all facilities. If strangers do not have requisite visitor identification, escort them to the facility manager.
Invite local law enforcement agencies to tour facilities and become familiar with the operations of the facilities.
Fence and lock all vulnerable areas such as well houses, potable water storage tanks, treatment facilities and chemical storage facilities.
Maintain up-to-date distribution system maps. Since it may be important to shut down selected portions of the distribution system in case of an emergency, it is vital to know where lines and valves are located.
If computer controls (including SCADA) are utilized and linked via the Internet: Increase user awareness of the potential for outside attack Update anti-virus software, and have it operational at all times Install email-filtering to identify infected email attachments Consider installing firewall software Establish procedures for responding to infected or crashed systems Backup all vital data files
16

SIMPLE SECURITY IMPROVEMENTS
Simple, low cost security improvements that you should consider implementing immediately include: • Complete background checks on potential employees KBI check is only $15, but limited to crimes committed in Kansas Commercial firms are more thorough, but more expensive - look in Yellow Pages under
“Investigators” • Use tamperproof padlocks • Talk to police Visit all public water supply system (PWSS) facilities Explain importance of PWSS to community Ask for security suggestions Ask to include PWSS facilities on routine patrols
• Place bars or grates on windows • Talk to residents near facilities Explain who should and should not be at the facilities Provide a 24-hour telephone number to call if suspicious activity is observed
• Post signs - “No Trespassing/Violators Will Be Prosecuted” Follow through and prosecute
• Work with chemical suppliers Get photo copies of DLs of drivers/salesmen before they show up Check photo copy against the DL of the driver or salesmen
• Keep security plans and measures secure Issues involving security not subject to Open Records Act (KSA 45-221)
17
V U L N E R A B I L I T Y A N A L Y S I S – D R I N K I N G W A T E R
Example Risk Evaluation for a Well House Simple system well house evaluation.
Appendix
B
18

Well House
xxxxxxxxxxxxxxxxxxxxxxxxxxxxxxxxxxxxxxxxxxxxxx
xxxxxxxxxxxxxxxxxxxxxxxxxxxxxxxxxxxxxxxxxxxxxxx
xxxxxxxxxxxxxxxxxxxxxxxxxxxxxxxxxxxxxxxxxxxxxxxxxxxx
xxxxxxxxxxxxx xxxxxxxxxxxxxxxx
Œ
Œ
ŒŒ Œ
Example Risk Evaluation for a Well House
The well house security system shown in Figure 4 (Page 8, and repeated here) will be used to illustrate the determination of risk associated with a water source facility using the risk equation discussed in Chapter 5. A complete risk evaluation would involve determinations for the source, treatment and distribution parts of a supply system.
The preparation of a diagram for the source facility along with an inventory of the security system deterrents similar to Table 5 (Page 10) help to identify the security measures, which exist for the water source. The listing of the individual deterrents of the security system helps to determine the role of each deterrent in terms of detection or delay for the asset. A modified version of Table 5 for the well system is shown in Table A-1.
The detection of a threat does not delay or prevent a threat. Detection is used to initiate a delay and/or other response to the threat. The two detection devices (outer door sensor and security camera are used to warn the utility that a potential threat exists to the supply. The delay devices, fencing, gates, locks, and grates serve only to deter the intentional efforts of vandals, saboteurs or terrorists.
Table A- 1: Inventory of Well House Deterrents
An appraisal must be made for each delay device to determine their effectiveness to these threats if a risk calculation is to be made. Table A-2 is a typical subjective appraisal using the scale given in Table 3 (Page 3).
1 - Perimeter Fence 2 - Perimeter Gate w/Lock 3 - Hatch w/Lock 4 - Window w/Grate
5 - Outer Door w/Lock & Sensor 6 - Inner Door w/Lock 7 - Exterior Light 8 - Security Camera
Y/# N NA Y/# N NA Y/# N NA Y/# N NA1 Fence sensor x 1 Fence 1 1 Utility staff 2 1 Pumps x2 Motion sensor x 2 Locks 4 2 Law Enforcement Y 2 Power x3 SCADA x 3 Barbwire x 3 Security Company x 3 Spare Parts x4 Camera 1 4 Lighting 1 4 45 5 5 5
In Place DeterrentsDelayDetection Response Redundancy
Well House Security
19

Table A-2: Effectiveness of Deterrents, E Values, for Intentional Threats in Risk Equation
Item Name Vandalism Sabotage Terrorism Perimeter fence 3 5 5 Perimeter gate w/lock 2 5 4 Hatch w/lock 2 5 4 Window w/grate 2 5 3 Outer door w/lock and sensor 1 5 2 Inner door w/lock 2 5 4
The calculation of risk (R) involves the selection of probability of occurrence (P) and severity of consequence (C) values for all the threats and effectiveness of deterrents (E) values.. The worst-case E values will be used for the intentional threats from Table 3 (Page 3). The selected values are shown in Table A-3 (a modified version of Table 6).
Table A-3: Risk Assessment for the Well Security System
Threat
Probability of Occurrence
P
Severity of Consequence
C
Effectiveness of Deterrents
E
Relative Risk R
Risk Rank
Spill-contamination 1 1 5 5 6 Power loss-lighting 5 3 5 75 1 Vandalism-destruction 1 1 3* 3 7 Sabotage-destruction 1 4 5* 20 5 Terrorism-contamination 1 5 5* 25 4 Terrorism-destruction 1 5 5* 25 4 Tornado-destruction 3 4 5 60 2 Ice Storm-power loss 3 2 5 30 3 Flooding-well loss 3 4 5 60 2 Earthquake-destruction 1 5 5 25 4 Drought 2 3 5 30 3
*Denotes the worse case values for each threat from Table A-2.
Table A-3 results indicate that the three greatest risks to the well facility are first from power loss and then from tornado or flooding. The next two risks are ice storm and drought. Since the goal of risk management is to balance the risks across the system by reducing the highest risks, the following revised system improvements (although not to the security system per se) are proposed: standby power system to offset power loss due to lighting (or ice storm, or tornado), another well to offset the effect of a tornado and raising the well head to offset flooding. The effect of these changes on the calculated risk values is shown in Table A-4. Note that the risk values are closer to each other or have less spread. This means we are closer to balancing risk across the system.
20

The top threats after taking the initial mitigating actions are drought, earthquake, terrorism, and flooding. The supplier will then have to make a determination as to whether it is practical to reduce the risk of these threats any further. If not, the supplier needs to ensure the supply’s Emergency Management Plan is sufficient to address the consequences of those threats.
Table A-4: Revised Risk Assessment for the Well Security System
Threat
Probability of Occurrence
P
Severity of Consequence
C
Effectiveness of Deterrents
E
Relative Risk R
Risk Rank
Spill-contamination 1 1 5 5 7 Power loss-lighting 2 3 1 6 6 Vandalism-destruction 1 1 3* 3 8 Sabotage-destruction 1 4 5* 20 4 Terrorism-contamination 1 5 5* 25 2 Terrorism-destruction 1 5 5* 25 2 Tornado-destruction 2 4 2 16 5 Ice Storm-power loss 1 2 1 2 9 Flooding-well loss 3 4 2 24 3 Earthquake-destruction 1 5 5 25 2 Drought 2 3 5 30 1
21