kansas board of regents
DESCRIPTION
Kansas Board of Regents. December 15, 2011. Kansas State Board of Education. General Supervision of Public K-12 Schools Accrediting K-12 schools Administering & distributing state & federal funds Certifying teachers, administrators & school specialists - PowerPoint PPT PresentationTRANSCRIPT

Kansas Board of Regents
December 15, 2011
1

2

Kansas State Board of Education General Supervision of Public K-12 Schools
◦ Accrediting K-12 schools◦ Administering & distributing state & federal funds◦ Certifying teachers, administrators & school
specialists◦ Developing, administering & monitoring state &
federal plans◦ Developing curricular standards◦ Evaluating & approving teacher education
programs◦ Public hearings: state plans, rules & regulations,
transfers of territory, due process appeals◦ Supervising KSSB & KSSD
3

State Board Strategic AgendaThrough December 2012
Delivery system
Effective educators
Effective, visionary leaders
Collaboration
Multi-tier system of support
Barriers to teacher licensure & renewal
Review/revise leader preparation programs
Align PreK-20 systems of support
Accreditation of schools
Teacher recruitment, support & retention
Leader recruitment, support & retention
Communication
Graduation requirements, graduation rates, dropout rates
Educator evaluation & compensation
Leader evaluation & compensation
Strategic partnerships
Career & technical education
Review/revise teacher preparation programs
Growth model
4

Kansas State Department of Education
Carries out policies of State Board
Assists schools in state & federal compliance
Assists in implementing best practices based on research
5

Number of students: 454,000 (FTE)
Number of school districts – 286
Number of schools – 1,380
Number of licensed educators – 41,000
Number of non-licensed personnel – 27,000
Kansas by the Numbers
Numbers are rounded for presentation purposes
6

By the NumbersOver 210,000 students
transported to and school from each day
Over 92,000 breakfast meals served daily
Over 350,000 lunches served daily
7

Kansas Student Population Trends(Percent of K-12, September Unaudited Enrollment,
Public Schools)
8
2000
2001
2002
2003
2004
2005
2006
2007
2008
2009
2010
2011
0
10
20
30
40
50
32.234.1
37.4 38.7 39.7
47.4
10.6 11.012.4 12.9 12.3 12.6
5.109403 5.5131247.725484
9.37
Free and Reduced Lunch
Students w/ Disabilities
ELL

$3 billion – state
$2 billion – local
$700 million - federal
Money
Numbers are rounded for presentation purposes
9

Classroom Level
School Level
State Level
National Level
How do we measure progress?
10

The level that matters most
11

265,298 Reading (Grades 3-8, HS)
266,742 Math (Grades 3-8, HS)
147,541 Science (Grades 4, 7, HS)
43,265 KELPA (Grades K-12 )
Subjects Assessed
12

2001 2002 2003 2004 2005 2006 2007 2008 2009 2010 20110
20
40
60
80
100
60.2 62.166.8
70.2 73.178
82.5 84.1 85.7 86.3 87.6
Kansas Reading, All Students
13

Percentage of students in the top three performance levels
2010 2011
3rd Grade 83.6 85.8
4th Grade 86.8 89.0
5th Grade 85.0 86.7
6th Grade 86.5 87.5
7th Grade 89.4 89.0
8th Grade 86.2 87.3
High School 86.9 88.3
Reading – Student Achievement by Grade
14

2001 2002 2003 2004 2005 2006 2007 2008 2009 2010 20110
20
40
60
80
100
54.5 56.259.8
65.3 68.172.5
80.1 81 82.8 83.1 84.7
Kansas Math, All Students
15

ACT Trends
16

SAT Trends
17

18

Closing the achievement gap• Students on paid lunch, reduced
lunch, free lunch• White, Hispanic, African-American
students
The Work Ahead
19

Kansas Reading Gap: 2000 – 2011(all grades, Report Card population)
2000 2001 2002 2003 2004 2005 2006 2007 2008 2009 2010 20110
20
40
60
80
100
65.3 66.5 66.271.7
75.578.5
87 87.890.8 92.2 93.3 93.9
51.2 52.2 52.2
59.463.9
67.9
75.579.2
8284.6 86.1 86.9
36.5 38.7 40.6
47.852.7
58.763.6
67.471.3
74.1 75.778.5
Paid-lunch
Reduced-lunch
Free-lunch
new assessmentsin 2006
20

2000 2001 2002 2003 2004 2005 2006 2007 2008 2009 2010 20110
20
40
60
80
100
65.2 65.8 64.969.5
73.576.6
84.687.2 89.1 90.4 90.7 91.6
32.9 32.2
38.6
48.752
58.6 59
65.568.8 71.3
7578
31.5 32.1 32.7
40.5
47.352.5
6063.4
67.1 69.1 70.673.9
WhitesHispanicsAfrican-Americans
new assessmentsin 2006
Reading Gap by Ethnicity: 2000 – 2011(all grades, Report Card population)
21
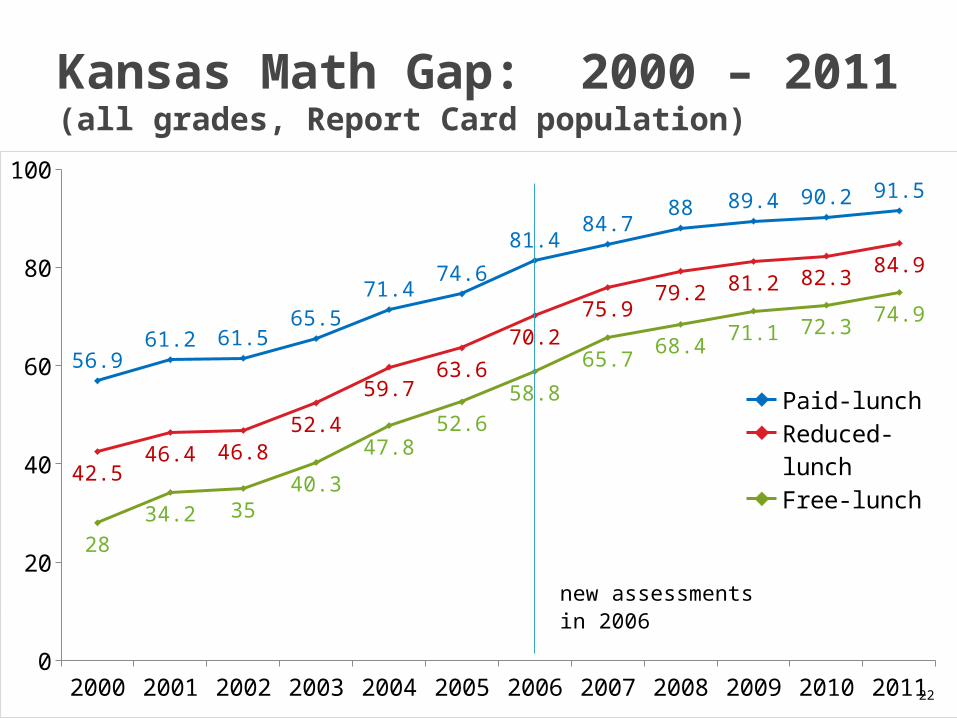
Kansas Math Gap: 2000 – 2011(all grades, Report Card population)
2000 2001 2002 2003 2004 2005 2006 2007 2008 2009 2010 20110
20
40
60
80
100
56.961.2 61.5
65.571.4
74.6
81.484.7
88 89.4 90.2 91.5
42.546.4 46.8
52.4
59.763.6
70.275.9
79.2 81.2 82.384.9
2834.2 35
40.3
47.852.6
58.8
65.768.4
71.1 72.374.9
Paid-lunch
Reduced-lunch
Free-lunch
new assessmentsin 2006
22

2000 2001 2002 2003 2004 2005 2006 2007 2008 2009 2010 20110
20
40
60
80
100
56.660.2 60.4
63.869.4
72.878.6
82.985.8 87.2 87.3 88.7
24.830.9 32
37
45.549.6
57.9
65.368.8 71 73.4
76.4
19.824.9 25.9
30.7
39.643
50.9
57.660.4
63.1 64.367
Whites
Hispanics
African-Americans
new assessmentsin 2006
Math Gap by Ethnicity: 2000 – 2011(all grades, Report Card population)
23

Closing the achievement gap
• Students on paid lunch, reduced lunch, free lunch
• White, Hispanic, African-American students
Elementary & Secondary Education Act (ESEA) flexibility waiver
The Work Ahead
24

51.2 51.257.3
63.4 63.469.5
75.679.7
83.787.8
91.995.9
100.0
44.0 44.051.0
58.0 58.065.0
72.076.7
81.386.0
90.795.3
100.0
0
10
20
30
40
50
60
70
80
90
100
2002 2003 2004 2005 2006 2007 2008 2009 2010 2011 2012 2013 2014
AYP - Reading
K-8 reading 9-12 reading
25

Specific target (AYP) will no longer exist Student achievement based on multiple
measures Teacher and leader evaluations based, in
part, on student achievement Due by February 21, 2012 If granted, will be in place until ESEA is
reauthorized
ESEA Flexibility Waiver
26
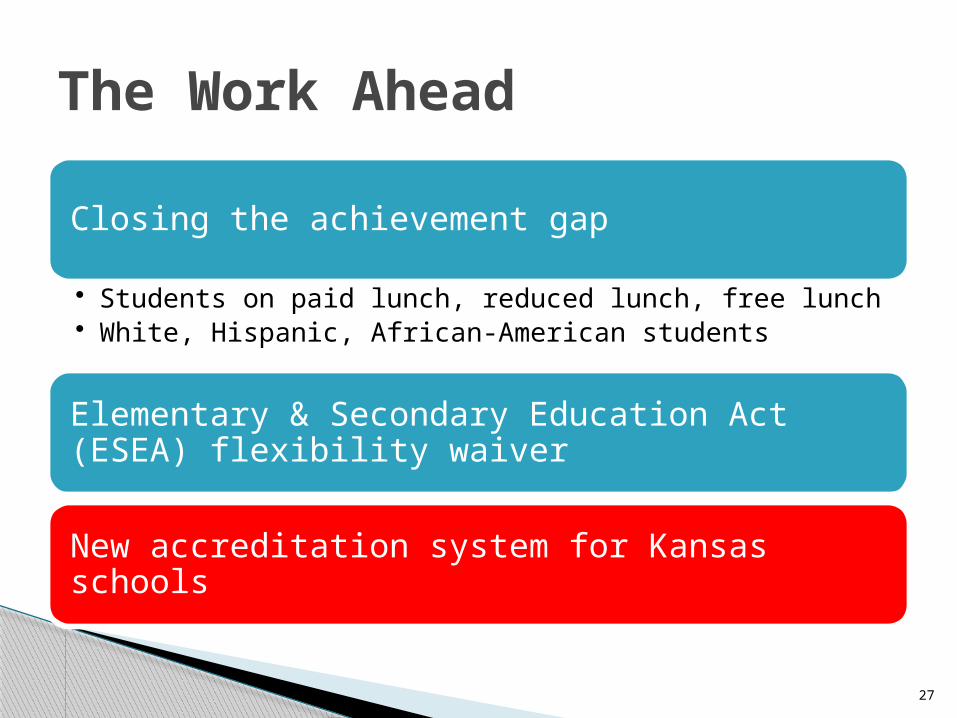
Closing the achievement gap
• Students on paid lunch, reduced lunch, free lunch• White, Hispanic, African-American students
Elementary & Secondary Education Act (ESEA) flexibility waiver
New accreditation system for Kansas schools
The Work Ahead
27

21st Century Accreditation
Relationships Relevance Rigor
ResultsResponsive
Culture
28

Closing the achievement gap
• Students on paid lunch, reduced lunch, free lunch• White, Hispanic, African-American students
Elementary & Secondary Education Act (ESEA) flexibility waiver
New accreditation system for Kansas schools
Possible new school finance formula
Transitioning to Common Core Standards in math and English language arts
Next generation of assessments
The Work Ahead
29

Next Generation of Assessments
30

Closing the achievement gap
• Students on paid lunch, reduced lunch, free lunch• White, Hispanic, African-American students
Elementary & Secondary Education Act (ESEA) flexibility waiver
New accreditation system for Kansas schools
Possible new school finance formula
Transitioning to Common Core Standards in math and English language arts
Next generation of assessments
Moving KSDE to a different location
The Work Ahead
31

Education Summits – Fall 2011
Work on next generation of assessments – KBOR representative on the Smarter/Balanced Consortium
Discussion with Governor’s office on bringing the Woodrow Wilson Fellows program to Kansas
Data sharing with Department of Labor
Discussion with Governor’s office on a change to Career and Technical Education funding
KSDE and KBOR Collaborative Efforts
32

Questions, Discussion
33