k40 - debunking climate denialism junk “science” and other claims
TRANSCRIPT
K40 - Debunking Climate Denialism
Junk “Science” and Other Claims


Claim: There is no consensus among climate scientists that global warming is caused by
human activities
• Why this Claim is wrong: Richard Lindzen is famous for this misrepresentation, in front of Congress, and in public pronouncements. More on him later.
• As data shows (next page) – the more deeply and actively informed you are on climate research, the more convinced you are that global warming is human-caused: 98%, and much higher than this if you divide between quantities of scientific journal papers for/against AGW instead of people themselves. (i.e. the ~half dozen “skeptics” get very few papers published – those few papers get a massive amount of “play” in the oil-financed media and blog-o-sphere
• AGW = Anthropogenic Global Warming – Useful Abbreviation for this powerpoint!
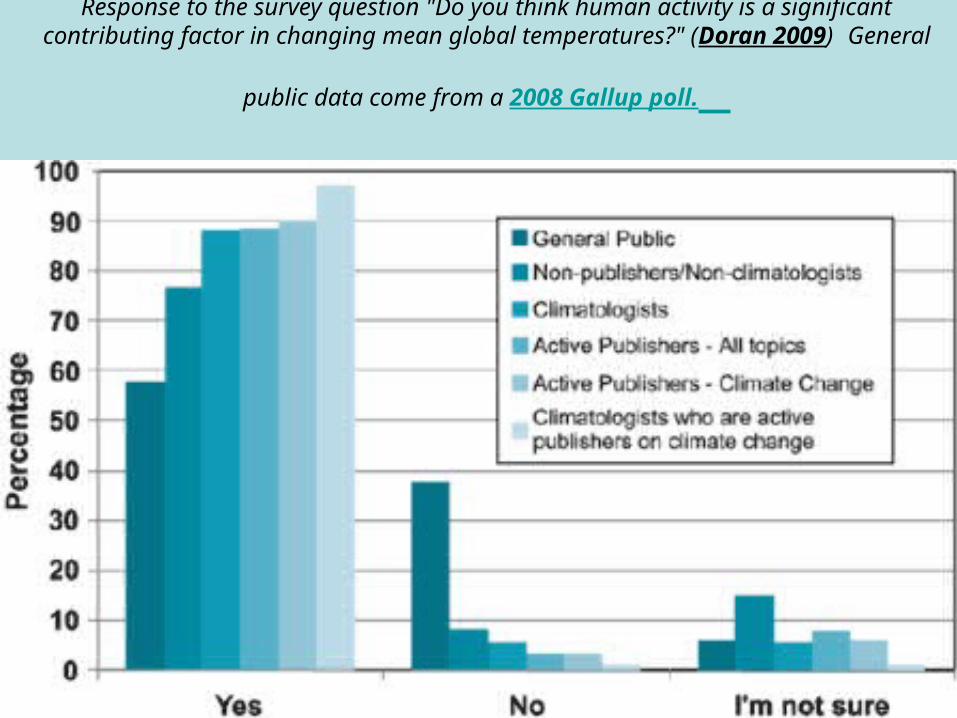
Response to the survey question "Do you think human activity is a significant contributing factor in changing mean global temperatures?" (Doran 2009) General
public data come from a 2008 Gallup poll.
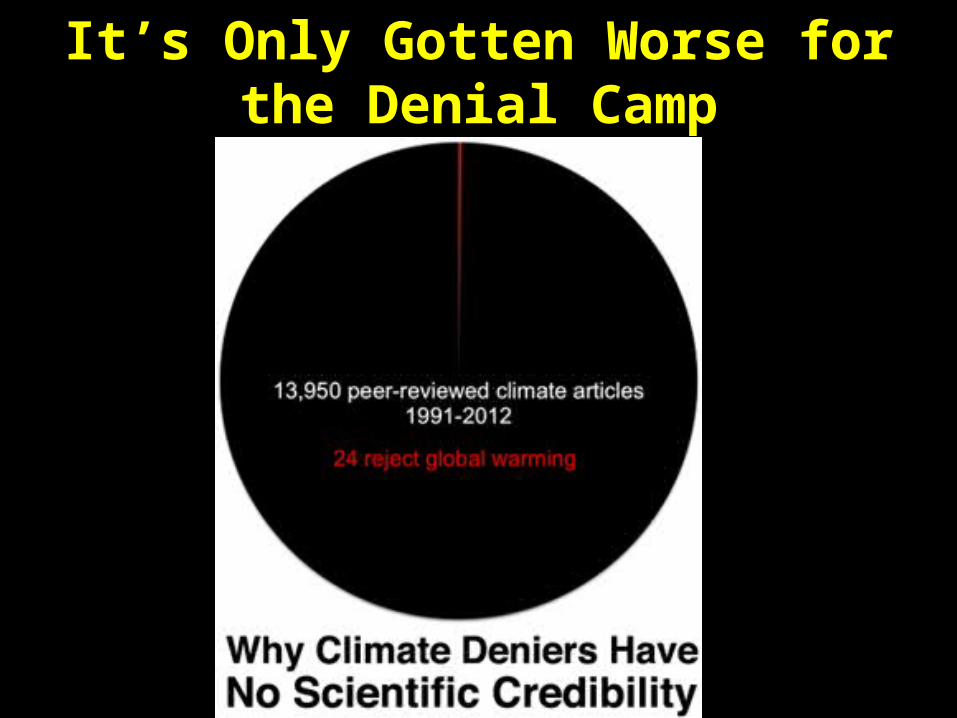
It’s Only Gotten Worse for the Denial Camp
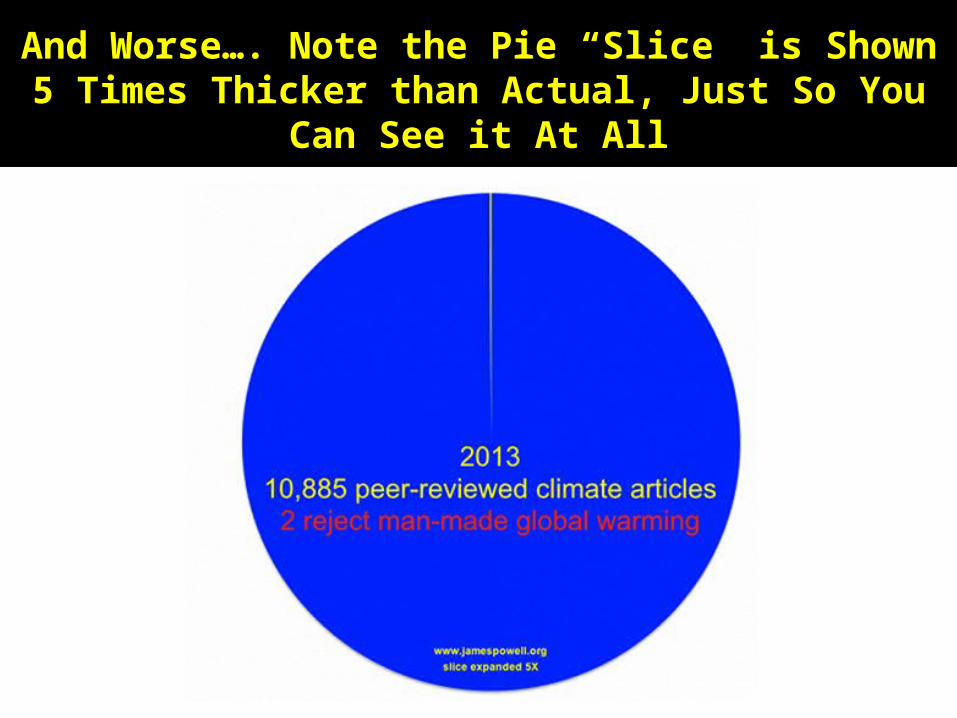
And Worse…. Note the Pie “Slice” is Shown 5 Times Thicker than Actual, Just So You
Can See it At All
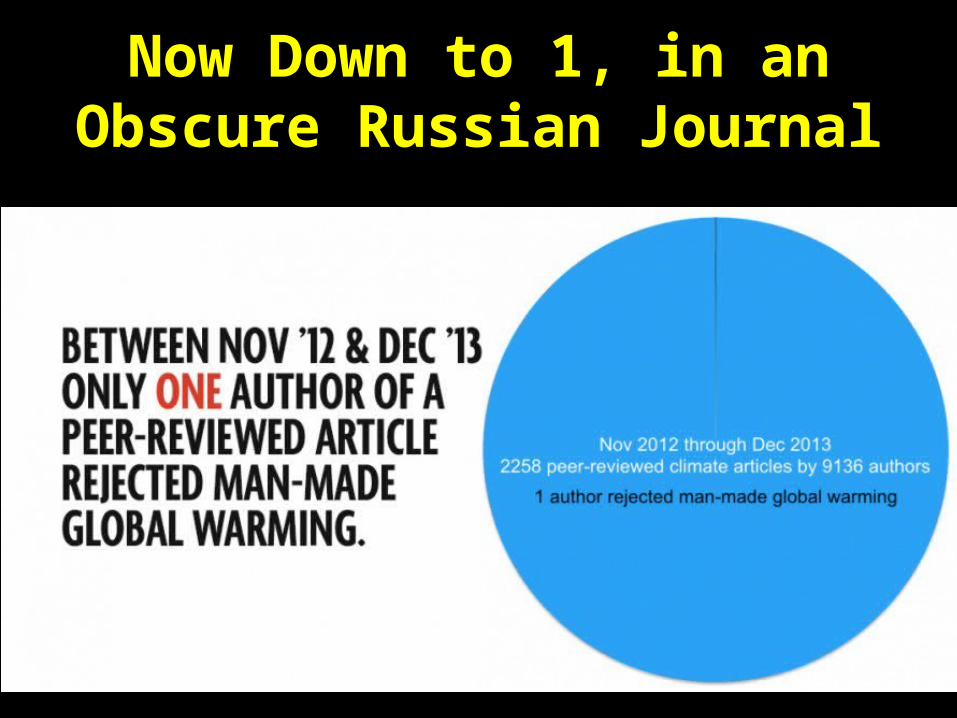
Now Down to 1, in an Obscure Russian Journal

Claim: "32,000 of the World's Leading Scientists" have signed a petition
rejecting the idea of anthropogenic global warming• Why this Claim is Wrong: The quotation marks above stated by Bob Lutz, CEO of GM, in a
well-remembered episode of "The Colbert Report". The infamous "Oregon Petition" arrived in the mail of tens of thousands of people including some scientists (circulated in 1999 and again in 2007 and signatures summed). It urged their signature rejecting AGW by using a paper by Robinson, Robinson and Soon (RRS 2007) which is junk science at its most extreme.
• A primary strategy of junk science promoters is to publish in outlets unable or unwilling to give proper expert review. Note that RRS is published in the Journal of Physicians and Surgeons (that's right - not a typo! To say the least, this medical journal is not known for having competent climate science referees!). The petition is not filled with the signatures of scientists - its definition of a scientist is: anyone who signed the petition (!) This is a petition whose layout only allows check marks for PhD, MS, and BS degrees, and who admits they did not check the authenticity of the signers. It's an oil and tobacco company sponsored petition carefully graphic designed to appear to be a scientific journal article, and whose ultimate signatures include an unknown number of real scientists.
• Here is a site collecting numerous debunkings of this claim. Climate scientists at RealClimate address the fraud. Only 39 of the 32,000 signers claim to be "climatologists", and by far the largest category are holders of only a BS "or equivalent", in some subject or other (the lowest educational check box option provided!). This "Climate Crock of the Week" video presentation covers the background of those behind the signature campaign. It's not pretty. Here's a collection of errors major and minor in the petition. In particular, this rebuttal by climate scientist Michael MacCracken is the most detailed, requiring 23 tightly written pages just to enumerate the distortions and falsehoods.
• On the other side, the National Academy of Science (NAS) is made up of the most accomplished scientists in the nation. Here is a letter signed by 250 NAS members condemning the attacks by political forces on science in general and climate science in particular.
• Another reason this is bogus – if you google “Richard Nolthenius”, you’ll find my name as one of the signers of this Petition! Apparently they just harvested names of scientists off the web or other public sources. Other scientists complain they too have been added w/o their approval.
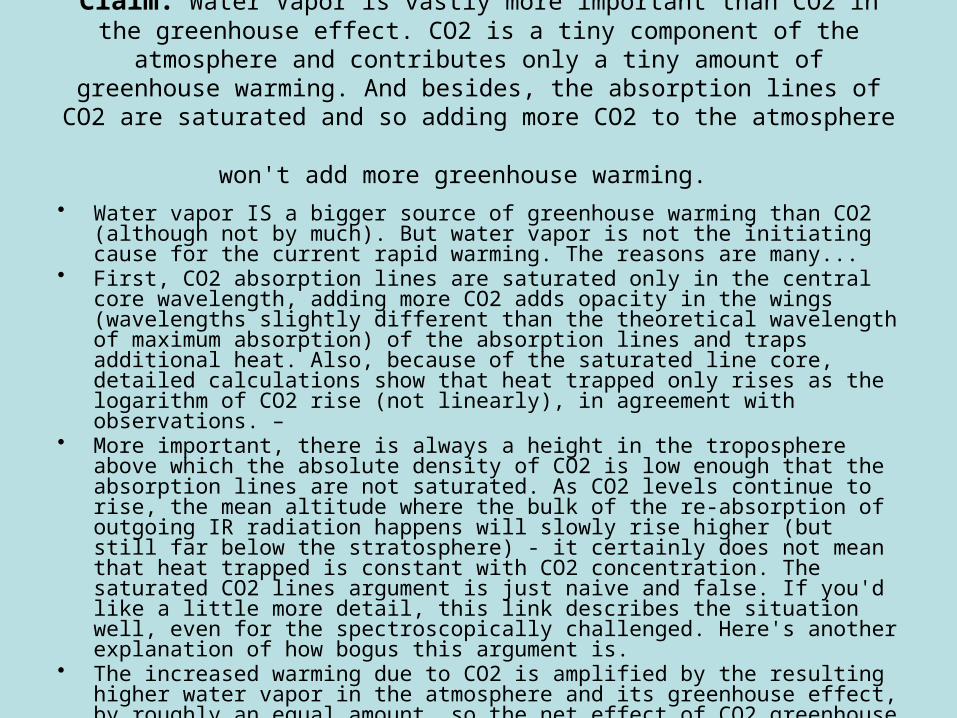
Claim: Water Vapor is vastly more important than CO2 in the greenhouse effect. CO2 is a tiny component of the atmosphere and
contributes only a tiny amount of greenhouse warming. And besides, the absorption lines of CO2 are saturated and so adding more CO2 to
the atmosphere won't add more greenhouse warming. • Water vapor IS a bigger source of greenhouse warming than CO2 (although not by
much). But water vapor is not the initiating cause for the current rapid warming. The reasons are many...
• First, CO2 absorption lines are saturated only in the central core wavelength, adding more CO2 adds opacity in the wings (wavelengths slightly different than the theoretical wavelength of maximum absorption) of the absorption lines and traps additional heat. Also, because of the saturated line core, detailed calculations show that heat trapped only rises as the logarithm of CO2 rise (not linearly), in agreement with observations. –
• More important, there is always a height in the troposphere above which the absolute density of CO2 is low enough that the absorption lines are not saturated. As CO2 levels continue to rise, the mean altitude where the bulk of the re-absorption of outgoing IR radiation happens will slowly rise higher (but still far below the stratosphere) - it certainly does not mean that heat trapped is constant with CO2 concentration. The saturated CO2 lines argument is just naive and false. If you'd like a little more detail, this link describes the situation well, even for the spectroscopically challenged. Here's another explanation of how bogus this argument is.
• The increased warming due to CO2 is amplified by the resulting higher water vapor in the atmosphere and its greenhouse effect, by roughly an equal amount, so the net effect of CO2 greenhouse warming is doubled by adding in the increased water vapor. In absolute terms, existing water vapor contributes 2.3 times more heating than does existing CO2 (Keihl 1997)
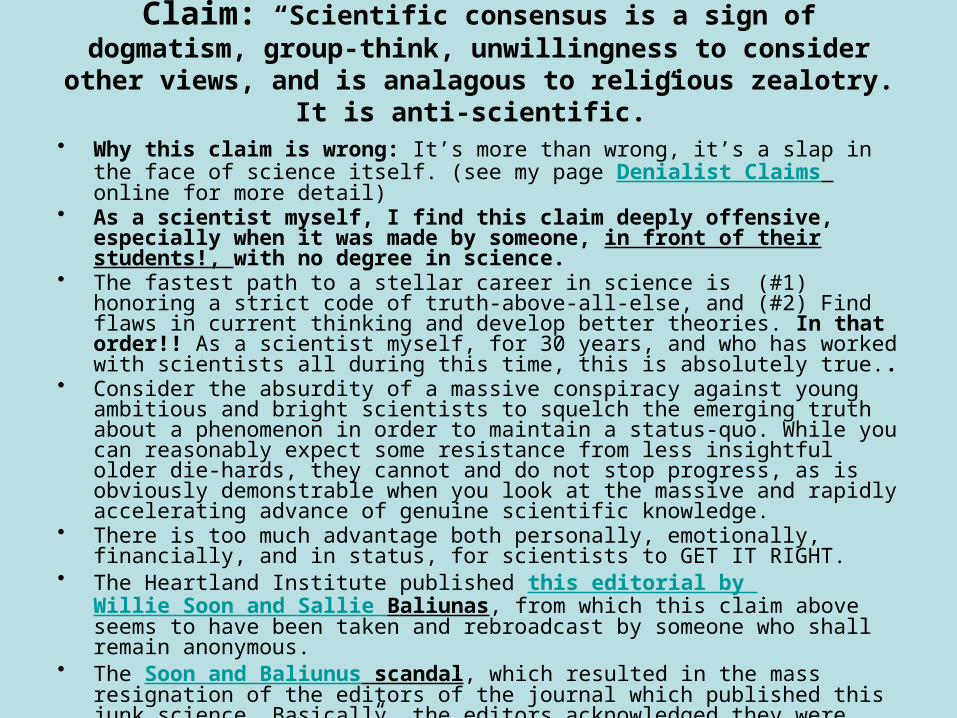
Claim: “Scientific consensus is a sign of dogmatism, group-think, unwillingness to consider other views, and is analagous to religious zealotry. It is anti-scientific.”
• Why this claim is wrong: It’s more than wrong, it’s a slap in the face of science itself. (see my page Denialist Claims online for more detail)
• As a scientist myself, I find this claim deeply offensive, especially when it was made by someone, in front of their students!, with no degree in science.
• The fastest path to a stellar career in science is (#1) honoring a strict code of truth-above-all-else, and (#2) Find flaws in current thinking and develop better theories. In that order!! As a scientist myself, for 30 years, and who has worked with scientists all during this time, this is absolutely true..
• Consider the absurdity of a massive conspiracy against young ambitious and bright scientists to squelch the emerging truth about a phenomenon in order to maintain a status-quo. While you can reasonably expect some resistance from less insightful older die-hards, they cannot and do not stop progress, as is obviously demonstrable when you look at the massive and rapidly accelerating advance of genuine scientific knowledge.
• There is too much advantage both personally, emotionally, financially, and in status, for scientists to GET IT RIGHT.
• The Heartland Institute published this editorial by Willie Soon and Sallie Baliunas, from which this claim above seems to have been taken and rebroadcast by someone who shall remain anonymous.
• The Soon and Baliunus scandal, which resulted in the mass resignation of the editors of the journal which published this junk science. Basically, the editors acknowledged they were “asleep at the switch” and did not do their job in seeing that this outrageously wrong paper got proper refereeing. Willie Soon was funded by the American Petroleum Institute, and acknowledges receiving over $1 million.

The Scientific Publication Process
• A researcher puzzles over an explanation for a set of observations, comes up with an idea, and tests it.
• He and co-workers take the results and give invited talks at other research institutions, where questions from fellow scientists can help refine their ideas
• When they feel they’ve got a strong piece of work, they write it up and send it to a quality scientific journal for publication (the better the journal, the better for their career)
• The editor reads the abstract, quick once-over of the paper, and sends it on to 2 or 3 referees. Referees are scientists whose area of expertise matches the subject of the paper.
• The referees give their time, unpaid, to critically read the paper and carefully write up a referee’s report which points out weaknesses and how to address them, or, if the paper is rock solid, an “all clear” to the editor recommending publication. In some cases, the paper is so poor that the recommendation is that the paper and the project needs to start over from scratch and it not be published at all. But this is rare; usually the paper is worthwhile and just needs some extra work in a few spots. Refereeing papers is viewed as a duty to science and your colleagues. Do it well, and you can hope your referees will do good work refereeing YOUR papers.
• The editor reads the referee reports, makes a judgment, usually following the referees and sends it back to the authors for re-work.
• The authors fix up the paper and resubmit, and it is published. If this is a prestigious journal (like the Astrophysical Journal), editors are very careful to protect the reputation of the journal and junk science almost never gets published.
• Scientific Journals: journals from professional scientific organizations, supported by dues-paying scientists. (e.g. the American Astronomical Society publishes several journals. I pay $150/yr as a member of the AAS. These organizations have an interest in making sure they publish high-quality science, and that includes ground-breaking new work which might significantly change the direction of a field – not sticking with stale status quo.
• This isn’t just a boiler plate advertisement. I’ve been a AAS member for 30 years, have had many papers refereed, and been a referee on many quality papers by Harvard professors, etc. I do a good job of refereeing, and referees have helped the quality of my own papers by their comments.

On the Other Side…• …are trade journals. These are NOT proper scientific journals. • These are “journals” published by corporate organizations. • The papers here reflect what is in the interests of the corporations,
which may or may not have anything to do with good science• “Energy and Environment” is the most notorious as far as
publishing nonsense about climate. “It is unclear whether E&E is peer-reviewed. The journal is not listed by the ISI Web of Knowledge, which provides "comprehensive coverage of the world's most important and influential journals". E&E has been described by climate scientist Gavin Schmidt as having “effectively dispensed with substantive peer review for any papers that follow the editor's political line”.
Claim: Fewer cosmic rays reach the lower atmosphere during solar maximum, producing fewer low clouds
because they act as nucleation sites for cloud droplets, and fewer low clouds lead to higher average ground temperatures (Svensmark 2007). This is an amplifier
for solar-caused warming of the Earth.• Why this Claim is Wrong: Unlike most claims, this one is not
absurd on its face. I can imagine having a sense of excitement on first considering this hypothesis and that it might be reasonable. It's worth a careful look.
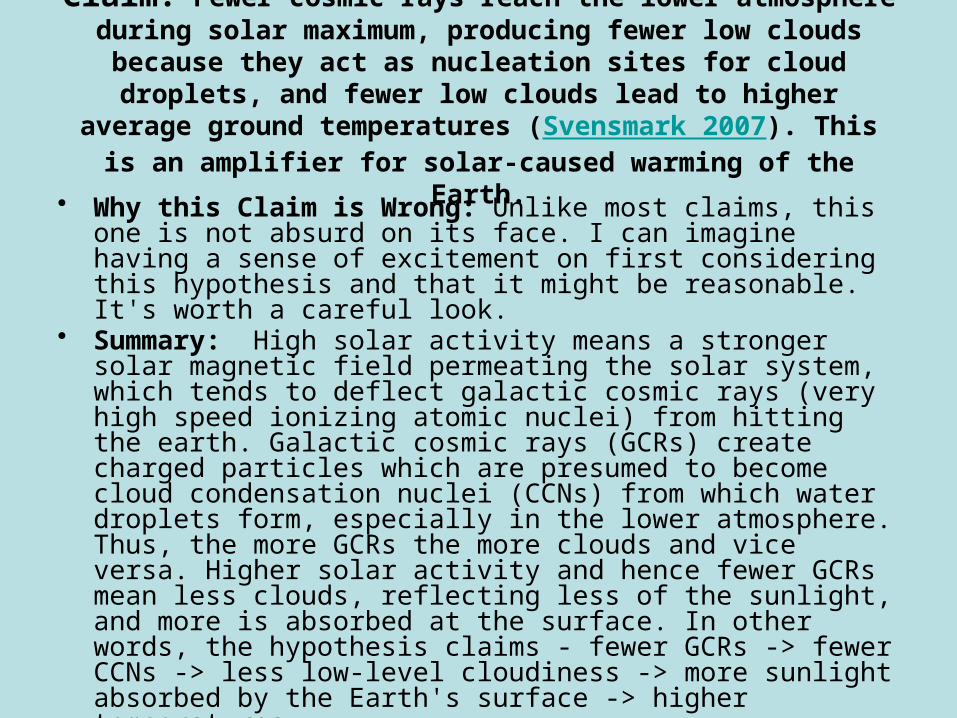
• Summary: High solar activity means a stronger solar magnetic field permeating the solar system, which tends to deflect galactic cosmic rays (very high speed ionizing atomic nuclei) from hitting the earth. Galactic cosmic rays (GCRs) create charged particles which are presumed to become cloud condensation nuclei (CCNs) from which water droplets form, especially in the lower atmosphere. Thus, the more GCRs the more clouds and vice versa. Higher solar activity and hence fewer GCRs mean less clouds, reflecting less of the sunlight, and more is absorbed at the surface. In other words, the hypothesis claims - fewer GCRs -> fewer CCNs -> less low-level cloudiness -> more sunlight absorbed by the Earth's surface -> higher temperatures.
Neutron arrival rate, generated by cosmic ray showers, for the past 60 years. Plotted with sunspot numbers; a good proxy for solar activity and global solar magnetic field intensity. The correlation is strong and compelling. Cosmic rays
are correlated with the sunspot cycle

Change in cosmic ray intensity between 1700 and the present day from four independent proxies. Intensities have been scaled to the 13-GeV cosmic ray data from Huancayo, Hawaii, and then normalized to the 1990–2001 mean.The plot shows deviations
from this mean. [from Carslaw et al. 2002]. Note that there is no trend after the solar maximum of 1957, when the 20th century
solar cycle intensities peaked. The 11-year solar cycle appears evident.
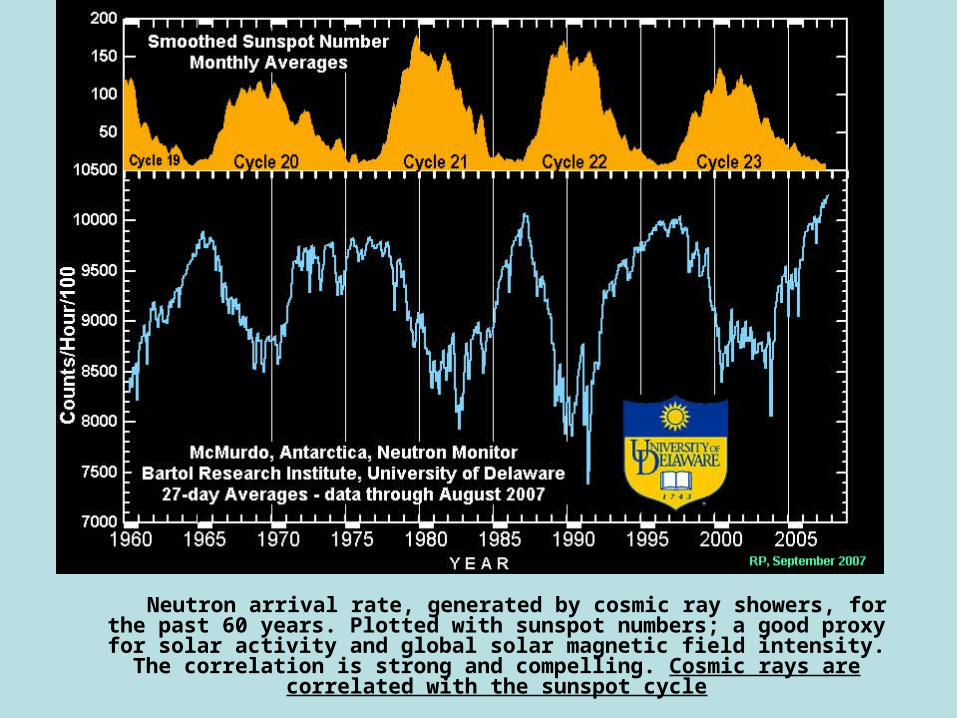
Global troposphere temps vs. cosmic ray flux. Note that before plotting they have taken OUT a secular temperature trend of 0.14K rise per decade - but this is the very temperature rise that argues FOR AGW! So while there does appear to be a correlation here, it is a red herring as far as being an argument against AGW. The short term temperature correlation has a much simpler interpretation….
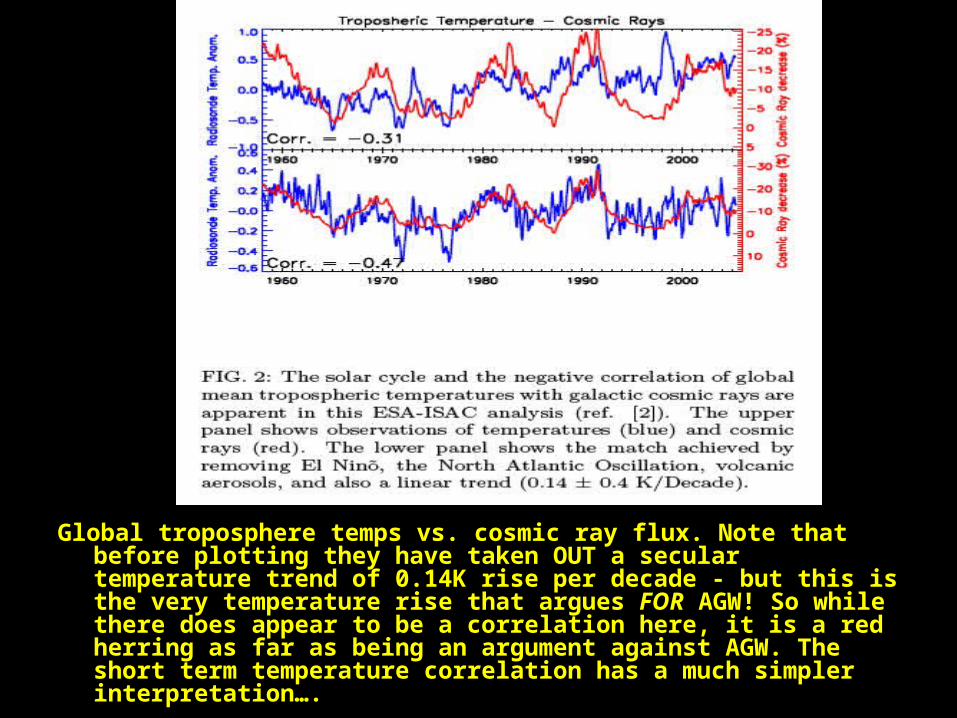
Svensmark's published correlation between cosmic ray intensity and low cloud cover, shown here, includes satellite
calibrations disavowed by the actual scientists who designed and operate the satellites

From Laut (2003), showing that Svensmark’s apparent correlation between cloud cover and
cosmic ray flux breaks down after ~1995
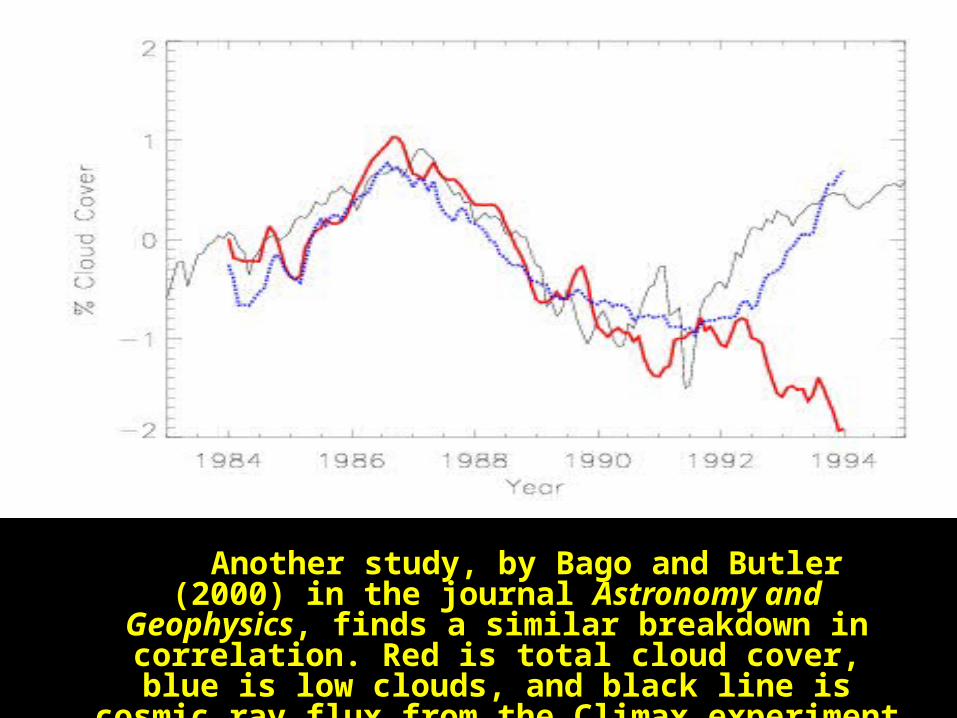
Another study, by Bago and Butler (2000) in the journal Astronomy and Geophysics, finds a similar breakdown in correlation. Red is total cloud cover, blue is low clouds, and black line is cosmic ray flux
from the Climax experiment
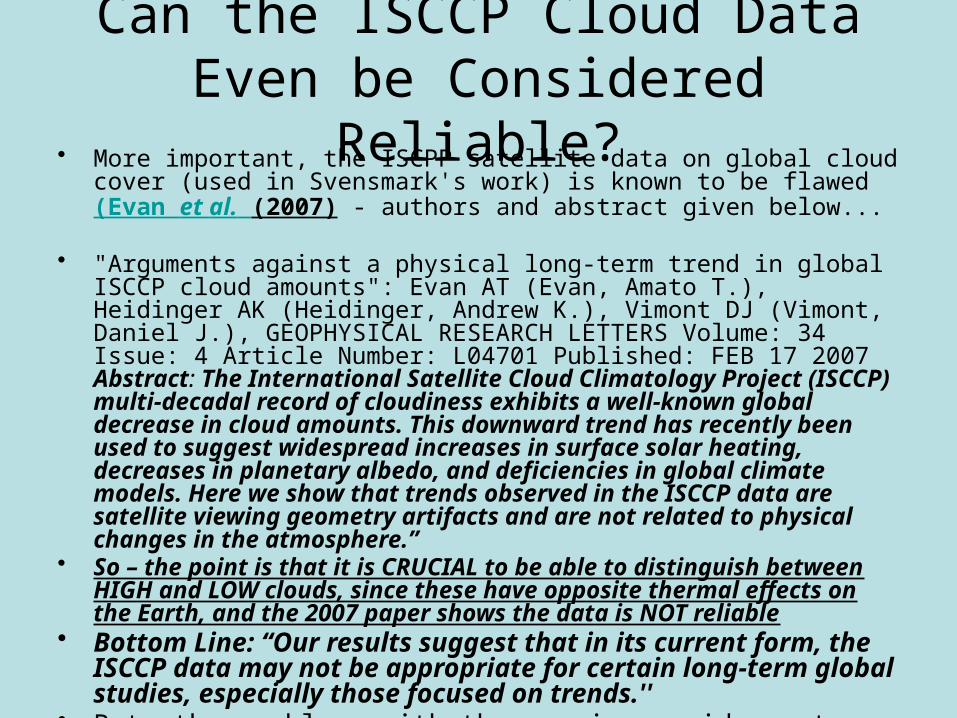
Can the ISCCP Cloud Data Even be Considered Reliable?
• More important, the ISCPP satellite data on global cloud cover (used in Svensmark's work) is known to be flawed (Evan et al. (2007) - authors and abstract given below...
• "Arguments against a physical long-term trend in global ISCCP cloud amounts": Evan AT (Evan, Amato T.), Heidinger AK (Heidinger, Andrew K.), Vimont DJ (Vimont, Daniel J.), GEOPHYSICAL RESEARCH LETTERS Volume: 34 Issue: 4 Article Number: L04701 Published: FEB 17 2007Abstract: The International Satellite Cloud Climatology Project (ISCCP) multi-decadal record of cloudiness exhibits a well-known global decrease in cloud amounts. This downward trend has recently been used to suggest widespread increases in surface solar heating, decreases in planetary albedo, and deficiencies in global climate models. Here we show that trends observed in the ISCCP data are satellite viewing geometry artifacts and are not related to physical changes in the atmosphere.”
• So – the point is that it is CRUCIAL to be able to distinguish between HIGH and LOW clouds, since these have opposite thermal effects on the Earth, and the 2007 paper shows the data is NOT reliable
• Bottom Line: “Our results suggest that in its current form, the ISCCP data may not be appropriate for certain long-term global studies, especially those focused on trends.''
• But, the problems with the cosmic ray idea get much worse…
There are already 1000 times more particles in the lower troposphere which can grow into cloud
condensation nuclei than cosmic rays can provide. Cloud formation is NOT limited by available particles!
• The cloud data itself is unfortunately not good enough to say much of anything about Svensmark's hypothesis, except that there is no support from the full data. There appear to be on-going problems with calibrations, with the inability of the ISCCP to differentiate between low, mid, and high clouds, view angle problems, and intra-satellite calibration problems. Since we're concerned with trends on the decadal time scale, it may be some time before this particular data is sorted out.
• While there probably is some correlation between cosmic rays and global temperatures, the simplest and best supported explanation is the already verified change in solar luminosity with solar cycle. Less radiation causes cooler temps, and this solar-cycle effect overlaps with Svensmark's unrelated and unsupported solar cycle hypothesis, since more cosmic rays arrive when the solar cycle is a minimum.
• Other work quite clearly shows that cloud formation is far more sensitive to other factors (99.9%) than to ionized particle availability (0.1%) created by cosmic rays. I discussed this with a personal friend who is also a leading professor of atmospheric science and who develops computer models of cloud formation, and he agrees.
• But wait – there’s still more problems for Svensmark…
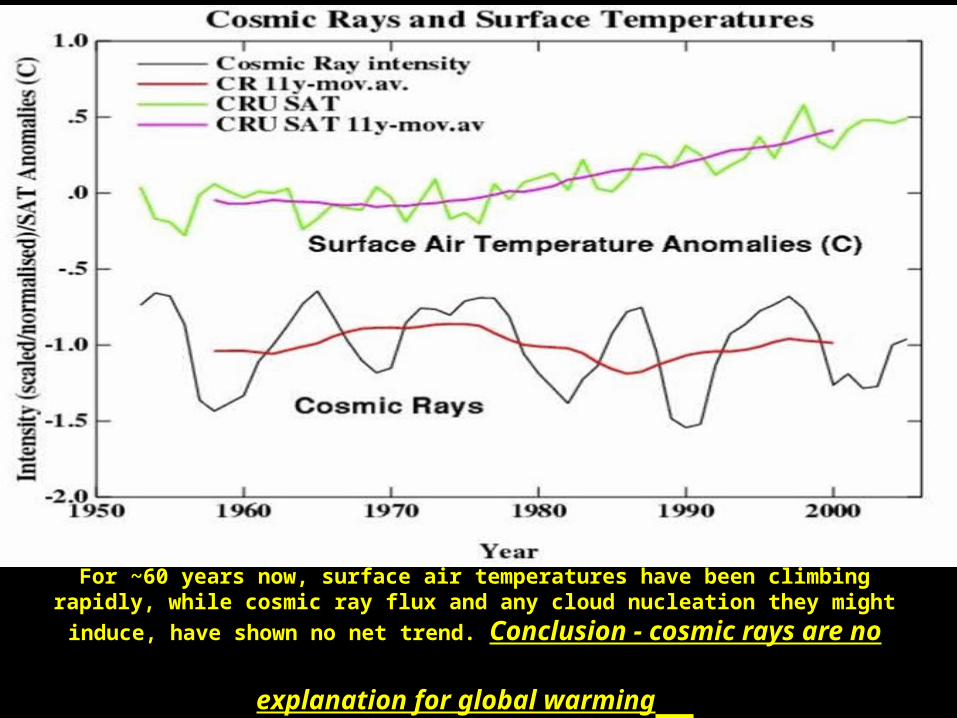
For ~60 years now, surface air temperatures have been climbing rapidly, while cosmic ray flux and any cloud nucleation they might induce, have
shown no net trend. Conclusion - cosmic rays are no
explanation for global warming
Alternatives to Human-Caused Global Warming – Fail on
Examination
• 10 min video looking at alternative explanations for global warming put forward early on by at least a few scientists (vs. obvious corporate/ideological shills), but which fail when better data became available
• The video includes criticism of the cosmic ray hypothesis, and more

Claim: It's the sun that is causing global warming.
• Why this claim is wrong: A large number of studies all show that the sun, whether by straightforward luminosity, or by UV flux, or by modulating cosmic rays, cannot account for more than a tiny fraction (if that) of global warming in the past 60 years.
• The sun's total luminosity does fluctuate slightly with the solar cycle, as magnetic field energy thermalizes and emerges as luminosity. However, it is weak, only 0.1% peak to trough. Since 1957, solar cycle maxima have been decreasing in strength, and the same for solar energy flux.
• And so too, all known variants of solar forcing show dimming or no trend. Meanwhile, this period of time shows the most rapid and accelerating global temperature rises, in lockstep with the rising and accelerating GHG emissions due to man's activities.
• Here's a good article with graphs and summaries of many published studies on the solar influence on climate.
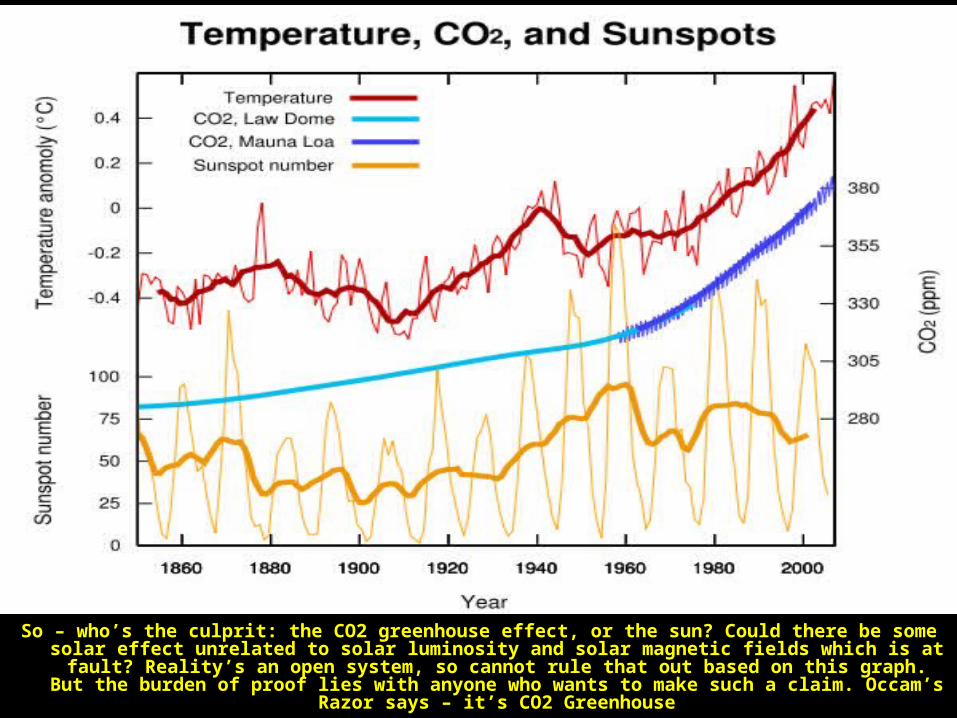
So – who’s the culprit: the CO2 greenhouse effect, or the sun? Could there be some solar effect unrelated to solar luminosity and solar magnetic fields which is at fault? Reality’s an open system, so cannot
rule that out based on this graph. But the burden of proof lies with anyone who wants to make such a claim. Occam’s Razor says – it’s CO2 Greenhouse
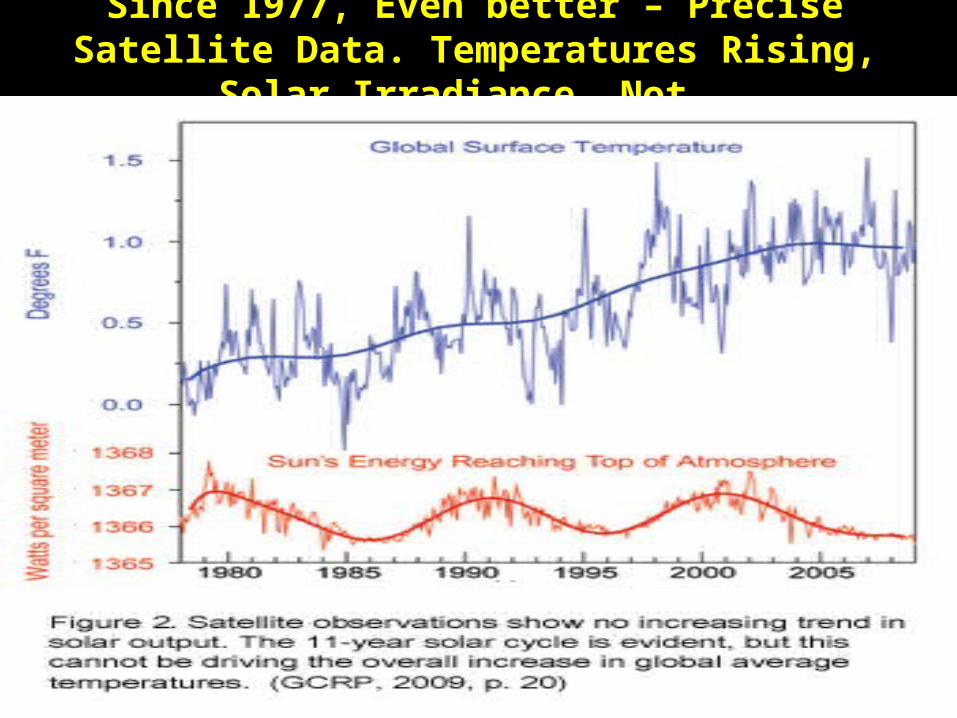
Since 1977, Even better – Precise Satellite Data. Temperatures Rising, Solar
Irradiance, Not.
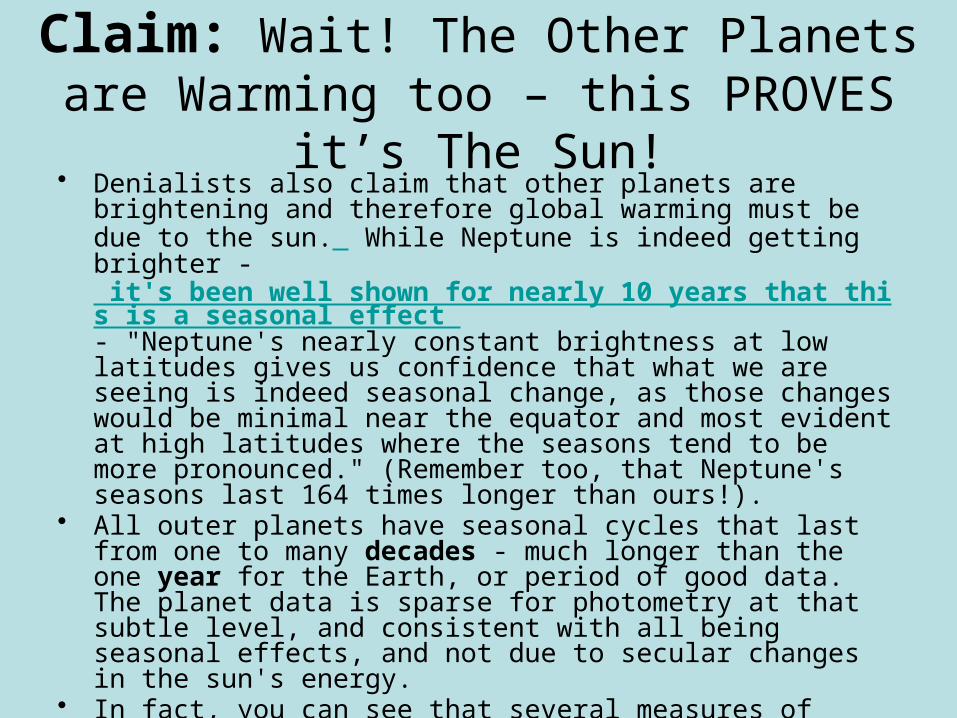
Claim: Wait! The Other Planets are Warming too – this PROVES it’s The
Sun!• Denialists also claim that other planets are brightening and therefore
global warming must be due to the sun. While Neptune is indeed getting brighter - it's been well shown for nearly 10 years that this is a seasonal effect - "Neptune's nearly constant brightness at low latitudes gives us confidence that what we are seeing is indeed seasonal change, as those changes would be minimal near the equator and most evident at high latitudes where the seasons tend to be more pronounced." (Remember too, that Neptune's seasons last 164 times longer than ours!).
• All outer planets have seasonal cycles that last from one to many decades - much longer than the one year for the Earth, or period of good data. The planet data is sparse for photometry at that subtle level, and consistent with all being seasonal effects, and not due to secular changes in the sun's energy.
• In fact, you can see that several measures of solar luminosity show only the solar cycle effect, and that the secular trend is actually slightly down, if anything (graph next page)


Claim: Global Warming is a Scam, Cooked up by Climate Scientists to Pump up Their
Research Grants• Really? - A global conspiracy by thousands of researchers falsifying
data, arm-twisting every new grad student and post-doc into the conspiracy, against the motivations of their own career (let alone their integrity)? Really?? Remember, there are thousands of professional climate scientists out there, and as many doctoral students and post-docs.
• A scientist’s career is boosted hugely by showing he is #1 Honest, and #2 Can devise new theories which overturn a field and yet satisfy solid observations. There is powerful career and financial motivation to NOT be a member of the consensus – UNLESS the CONSENSUS is CORRECT!
• The most charitable thing I can say is – this is made by corporate-paid people who show us every day that they consider sacrificing their integrity as just another cost of doing business; and they project this dishonesty on scientists with their gray-colored glasses
• On “it’s the sun, not humans!” claim; They provide no evidence, nor even any believable rationale, for this claim, only slander. By this kind of greedy logic, who would have more incentive than the Stanford Solar Center (where I worked for a time as a PhD student) to implicate the sun in global warming? Yet, see what they have to say here.

Claim: CO2 is Good for Plants, and More
CO2 is Good for the Earth
• Why this Claim is Wrong: This is another claim which only sounds plausible to a science-ignorant public (who are the target, of course).
• While CO2 is used by plants to make their own biomass, it is misleading to then try and sell the notion that human-caused rapid injection of CO2 into the atmosphere will be good for plant life. It is not true that today's rising CO2 levels are helping plants. Quite the contrary. CO2-induced climate change is stressing plants more than helping them.
• Agricultural scientists are pointing out that rising night-time temperatures, a signature of greenhouse gas-induced warming, are reducing crop yields in the major breadbaskets of the world, as well as stresses on animals grown for agriculture - see the testimony of agricultural scientist Dr. J. Hatfield in front of Congress.
• A new study, published in Nature - Climate Change and announced by the National Science Foundation, shows that after a short, initial growth spurt when CO2 levels rise, plants then become stunted.
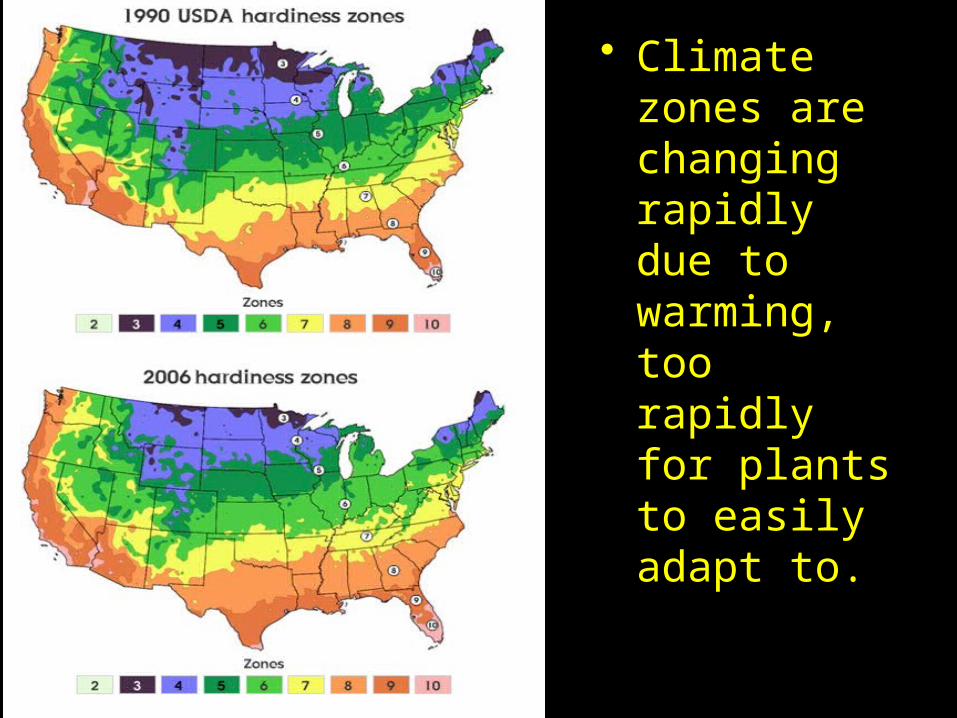
• Climate zones are changing rapidly due to warming, too rapidly for plants to easily adapt to.
There Are Exceptions…• Especially one known plant which does
indeed do much better under an enhanced CO2 Atmosphere…
• …Poison Oak/Poison Ivy (which becomes SuperPoison Ivy of the future, as termed here)
• Bottom Line: If you like poison oak, you’ll love the future…

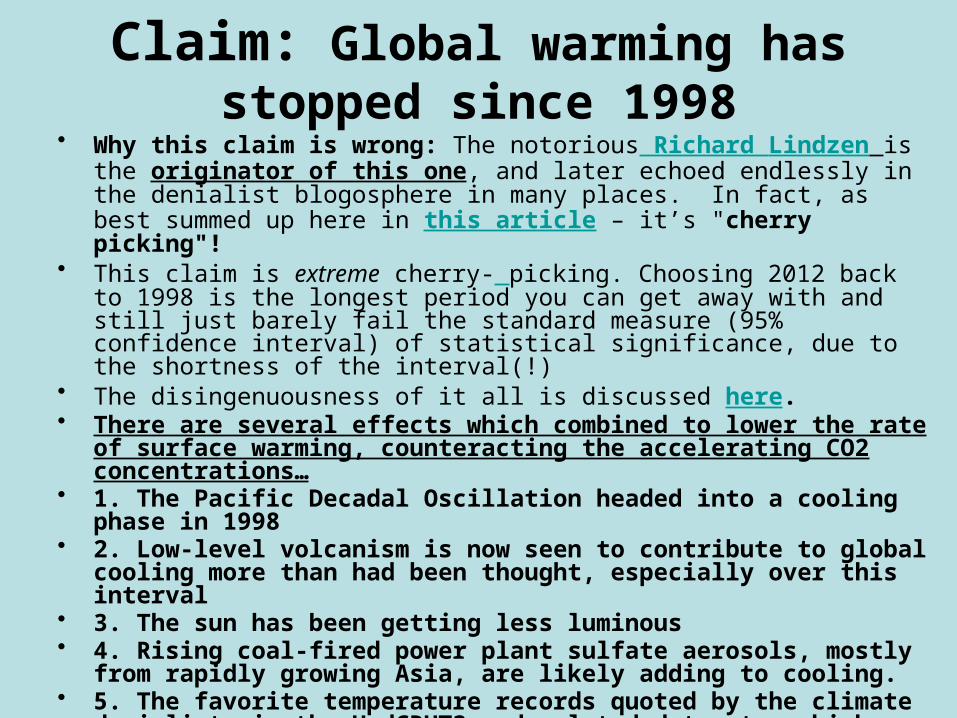
Claim: Global warming has stopped since 1998
• Why this claim is wrong: The notorious Richard Lindzen is the originator of this one, and later echoed endlessly in the denialist blogosphere in many places. In fact, as best summed up here in this article – it’s "cherry picking"!
• This claim is extreme cherry- picking. Choosing 2012 back to 1998 is the longest period you can get away with and still just barely fail the standard measure (95% confidence interval) of statistical significance, due to the shortness of the interval(!)
• The disingenuousness of it all is discussed here.• There are several effects which combined to lower the rate of surface
warming, counteracting the accelerating CO2 concentrations…• 1. The Pacific Decadal Oscillation headed into a cooling phase in 1998• 2. Low-level volcanism is now seen to contribute to global cooling more
than had been thought, especially over this interval• 3. The sun has been getting less luminous• 4. Rising coal-fired power plant sulfate aerosols, mostly from rapidly
growing Asia, are likely adding to cooling.• 5. The favorite temperature records quoted by the climate denialists is
the HadCRUT3 and related datasets, which make no correction for the fact that polar weather stations are missing from the data, yet we know the poles are warming at least twice as fast as elsewhere.
• When corrected for all these, there is NO CHANGE in the rate of warming!
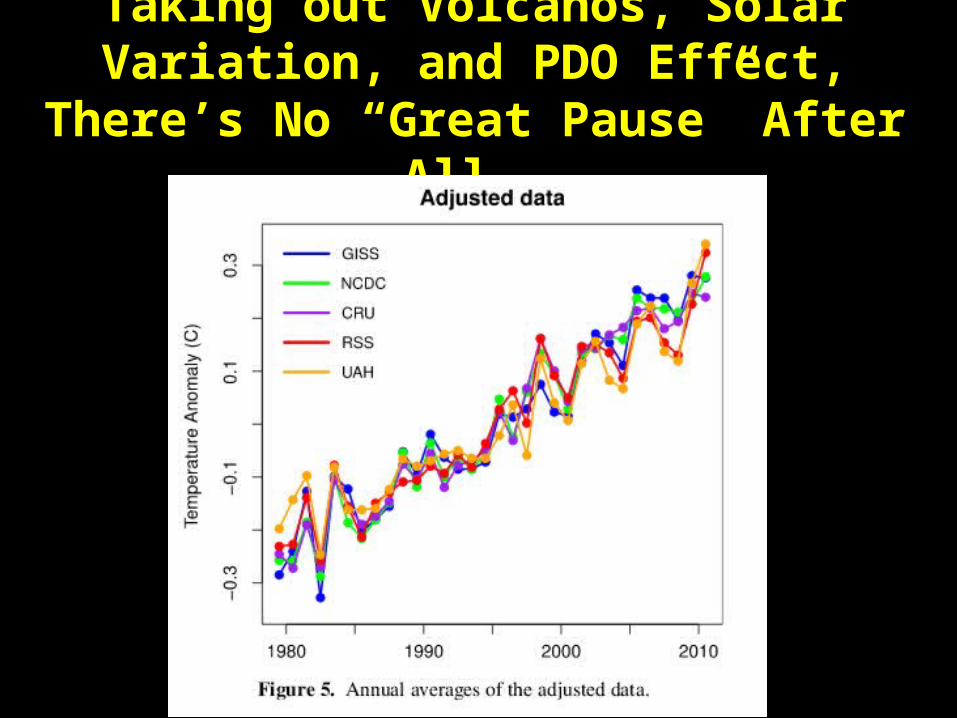
Taking out Volcanos, Solar Variation, and PDO Effect,
There’s No “Great Pause” After All.
Claim: Cloud feedbacks from enhanced warming are negative (i.e. cause a net cooling), so that climate is essentially
stable. • Why this claim is wrong: This is Richard Lindzen's "Iris Effect" hypothesis, proposed in 1990. His claimed is that higher water vapor in the warmed atmosphere rains out lower in the atmosphere, leading to fewer cirrus clouds (stratospheric cirrus clouds have a net heating effect by blocking outgoing IR radiation). The evidence and theory both point to cloud feedbacks actually trending towards increased warming, i.e a positive feedback. Observations show that increasing sea surface temperatures correlate with a decrease in "anvil" clouds and deep convective clouds. The question is, do these clouds heat, or cool the atmosphere?
• Brian Soden, a Princeton climate scientist, examined the tropical greenhouse effect in and out of El Nino conditions and finds that clouds behavior is opposite to that hypothesized by Lindzen (Soden 1997). And Lin (2002) finds "The observations show that the clouds have much higher albedos and moderately larger longwave fluxes than those assumed by Lindzen et al. As a result, decreases in these clouds would cause a significant but weak positive feedback to the climate system, instead of providing a strong negative feedback, opposite to Lindzen's hypothesis." This recent study again shows cloud feedback is positive (more CO2 warming leads to more cloud-cover induced warming), not negative. See more studies backing up this conclusion here and here, and Dessler (2011).
• The current incarnation of Lindzen's idea is in Lindzen and Choi (2009), claiming that the ERBE satellite data show increased outgoing radiation from Earth to space when sea surface temperatures rise. But this work has a number of major flaws which are fatal to the hypothesis, pointed out by Trenberth et.al. here. (The journal paper is here).
• Lindzen is reportedly reworking his claims yet again. Given his original incarnation was published now over 20 years ago, it seems like variants are going to be keep coming, regardless of how embarrassingly wrong they continue to be.
• Lindzen's ideas are quite outside what both theory and observations demonstrate. More disturbing, these studies above show Lindzen cherry-picking his time interval, cherry-picking his model heat flow parameters, and a deeply flawed portrayal of the relation of the tropical system to global climate (see in particular the Dessler (2011) study of tropical air/ocean/clouds study).

Update: 2012 on Lindzen’s Deeply Flawed Papers
• A 2012 New York Times newspaper article on Lindzen and clouds is a good read for the layman (refreshingly so! Imagine - a newspaper!). In it, Lindzen finally acknowledges "embarassing" and "stupid mistakes" he made in Lindzen and Choi 2009. But the bad science continues - Lindzen's re-worked Lindzen and Choi (2011), is just as deeply flawed as the earlier incarnations…
• Submitted to an obscure Korean journal after being rejected by the Proceedings of the National Academy of Sciences, reviewers noted that the paper is based on "fundamentally flawed assumptions about global climate sensitivity". A detailing of the flaws is here.
• This seems to be the twilight of the Lindzen story. He seems to be out of the limelight in the past few years

In Fact, Cloud Feedbacks So Far Seem to be Positive, Not
Negative• Sherwood et al. 2014 show that the
surface convective zone deepens under a warming climate, reducing the low clouds which cool climate
• Dessler (2010) also finds a positive feedback, confirmed by Zhou et al. (2013)

From Dessler (2010), Surface
temperature is positively correlated
with radiance from clouds
Claim: Climate scientist Michael Mann (of Penn State University) is guilty of misusing confidential data, engaged in
a conspiracy to withhold information, and manipulated or destroyed data to strengthen his case that human activity
was changing the global climate. • Why this claim is wrong: Michael Mann is principal author of the famous 1999 paper which first showed the
"hockey stick" graph of global temperature for the past one thousand years, ending in the upward "hockey blade" spike during the fossil fuel age. This was a centerpiece in Al Gore's "An Inconvenient Truth"
• It is natural that AGW denialists would go after the author of this work. These charges against Michael Mann are serious, enough to terminate a career if found true. One would hope the AGW denialists had evidence before making and distributing to the press such charges. In fact, the slander revolves around the meaning of the word "trick", found in emails stolen by the AGW denialists ("Climategate").
• Scientists and mathematicians often use the word "trick" to refer to a clever insight used to solve a difficult problem. As a scientist who hangs around other scientists, I can tell you this is absolutely true. Anyone who would base such serious slander on their ignorance of the meaning of the word "trick" clearly has no experience in science or mathematics (or perhaps they knew exactly what it meant, but yet found this a great opportunity to advance their agenda by making such slanderous charges in front of policitians and science-ignorant students, media, and the public).
• Having on your faculty a prominent scientist guilty of fraud and other misconduct would be a huge liability, and so even if the charges had no basis or evidence, Penn State University conducted an inquiry - and Mann was cleared of any wrong doing or bias. Here's the NY Times article on the inquiry and Mann's vindication, with embedded links. Note also that AGW denialist blogs charged him with witholding data and hiding or destroying data. This inquiry and a dozen others found NO BASIS for this charge.
• All data and codes legally able to be released were released at the time of his original paper. All data and codes subsequently were cleared by foreign countries to release, and have been released. It was those other countries whose data partially comprised the dataset analyzed. See this recent interview in "Discover" magazine. All relevant climate forcing data is available to anyone, here. Here is Mann's response to the political witch hunt against climate scientists, including himself. And a more recent response (Dec 2011) by Mann is here. I have personally heard these baseless charges against an honorable scientist made by someone quite close. Anyone who would repeat such slanderous charges - worst of all, to students, as if they were fact, as late as 2009, when they in fact have no basis, let alone provide any proof... what can you say about their own bias, their own objectivity, their own committment to telling the Truth?
• Outrageous slanders against Michael Mann aside, how do the data-based criticisms of the "Hockey Stick" temperature plot stand up? Here's an excellent study showing re-analyses even assuming the (mostly invalid) criticisms of the 1999 analysis. Bottom line: no significant change - it's still a temperature "Hockey Stick".

“Climategate”• "Climategate" was a fabricated smear campaign against climate scientists,
based on stolen emails from the correspondence between climate scientists, and timed to be released to the media shortly before the 2009 UN Copenhagen Climate Summit, no doubt to insure that no significant carbon taxes or other other carbon-limiting agreements would result.
• Denialists took naive or distorted meanings from out-of-context passages to appear to justify their charges in the media that global warming was a scientific fraud. Numerous investigations showed there was no fraud, no bad science, and no lies. Out of thousands of private emails, THIS is the best case they could make for conspiracy and fraud?.....“trick” is an honored word in scientists jargon, to mean a clever (and proper) way to get around a difficult problem. “Hide the decline” was referring not to decline in ACTUAL temperatures, but in the tree-ring proxy data, which clearly stopped working as a temperature proxy by the mid 20th century (probably because CO2 was now so far out of the typical range of the past 1000 years of calibration data, and tree ring width would be expected to correlate to not just temperature but CO2 as well.
• The real fraud is the behavior of AGW denialists who so easily slander the work and character of good scientists in the name of preserving "business as usual" corporate profits.
• The current (late 2011) state of this attack on climate scientists is well linked and summarized here.
• ALL raw temperature data used in these many analyses (except some from Poland) are available to anyone, including you!
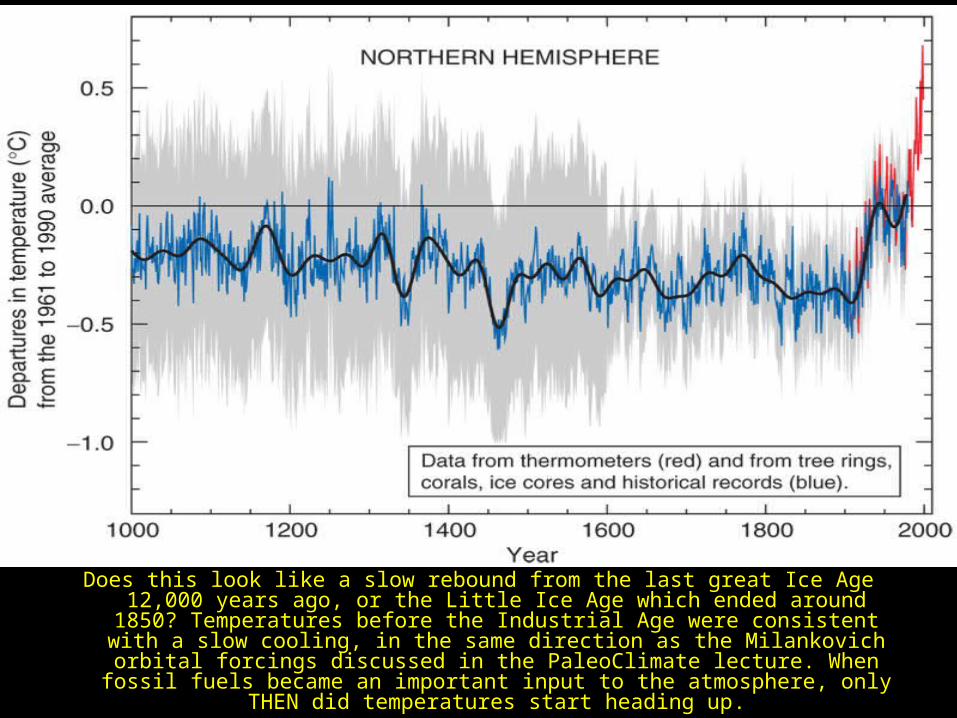
Does this look like a slow rebound from the last great Ice Age 12,000 years ago, or the Little Ice Age which ended around 1850? Temperatures before
the Industrial Age were consistent with a slow cooling, in the same direction as the Milankovich orbital forcings discussed in the PaleoClimate lecture. When fossil fuels became an important input to the atmosphere,
only THEN did temperatures start heading up.
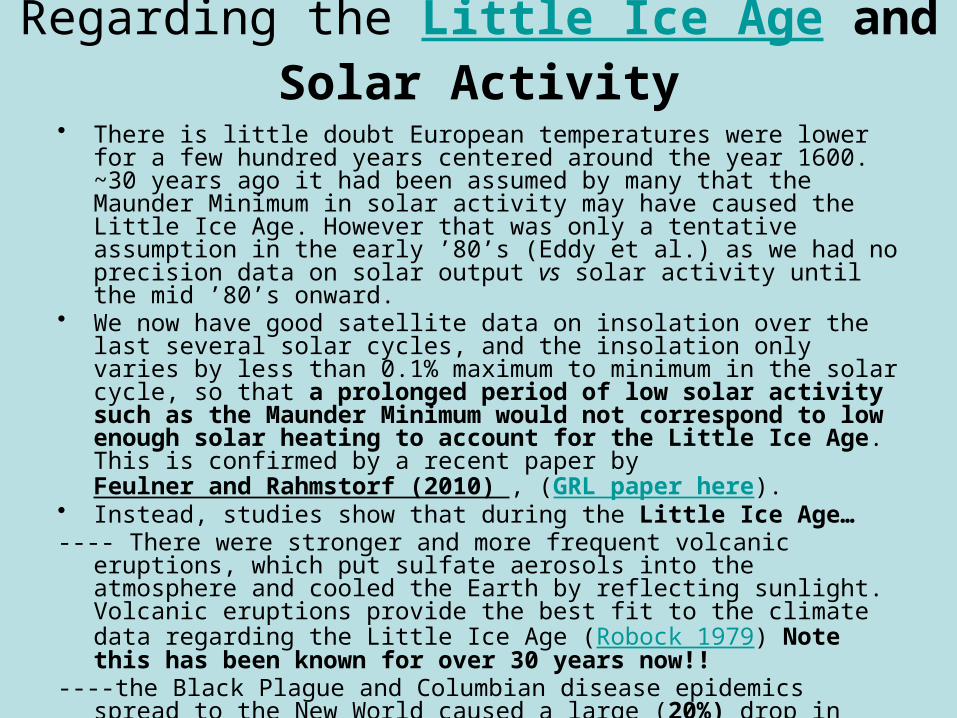
Regarding the Little Ice Age and Solar Activity
• There is little doubt European temperatures were lower for a few hundred years centered around the year 1600. ~30 years ago it had been assumed by many that the Maunder Minimum in solar activity may have caused the Little Ice Age. However that was only a tentative assumption in the early ’80’s (Eddy et al.) as we had no precision data on solar output vs solar activity until the mid ’80’s onward.
• We now have good satellite data on insolation over the last several solar cycles, and the insolation only varies by less than 0.1% maximum to minimum in the solar cycle, so that a prolonged period of low solar activity such as the Maunder Minimum would not correspond to low enough solar heating to account for the Little Ice Age. This is confirmed by a recent paper by Feulner and Rahmstorf (2010) , (GRL paper here).
• Instead, studies show that during the Little Ice Age…---- There were stronger and more frequent volcanic eruptions, which put
sulfate aerosols into the atmosphere and cooled the Earth by reflecting sunlight. Volcanic eruptions provide the best fit to the climate data regarding the Little Ice Age (Robock 1979) Note this has been known for over 30 years now!!
----the Black Plague and Columbian disease epidemics spread to the New World caused a large (20%) drop in total human population during the late middle ages, leading to cleared land undergoing reforestation which took up enough carbon to account for the 10 ppm of observed drop in CO2 levels associated with the Little Ice Age. This brief reference is interesting, though not a peer-reviewed paper.

Claim: Why should we believe climate scientists now? In the '70's they were predicting we were headed for an Ice
Age! • Why this claim is wrong: In fact, a look at the scientific literature from
1965 to 1979 finds only 7 papers warning of imminent cooling, compared to 44 warning of Global warming (Peterson et.al. 2008), or 14%
• Here's an entertaining and informative YouTube video summarizing the history of our understanding about climate change over the past 120 years, including just how many climate science journal articles supported the idea of an imminent cooling in the '70s (very few). Also, the original CAUSE of the concern for cooling was the levelling off of 20th century global warming during the 1940-'70 period, which we now know was due to the cooling effect of rapidly rising air pollution caused by the industrialization of the post-WWII world, and a cooling phase of the Pacific Decadal Oscillation, at a time when CO2 emissions were far below what they are today.
• Recall too that in the late '60's and early '70's computers were very primitive and climate modelling was similarly primitive. Even so, many climate scientists were predicting, even before temperatures resumed upward trends in the '70's, that CO2 greenhouse effect warming would soon overwhelm pollution effects and take over with a vengence (see here). Also, American Institute of Physics: publication on the history of the science of CO2 and climate.
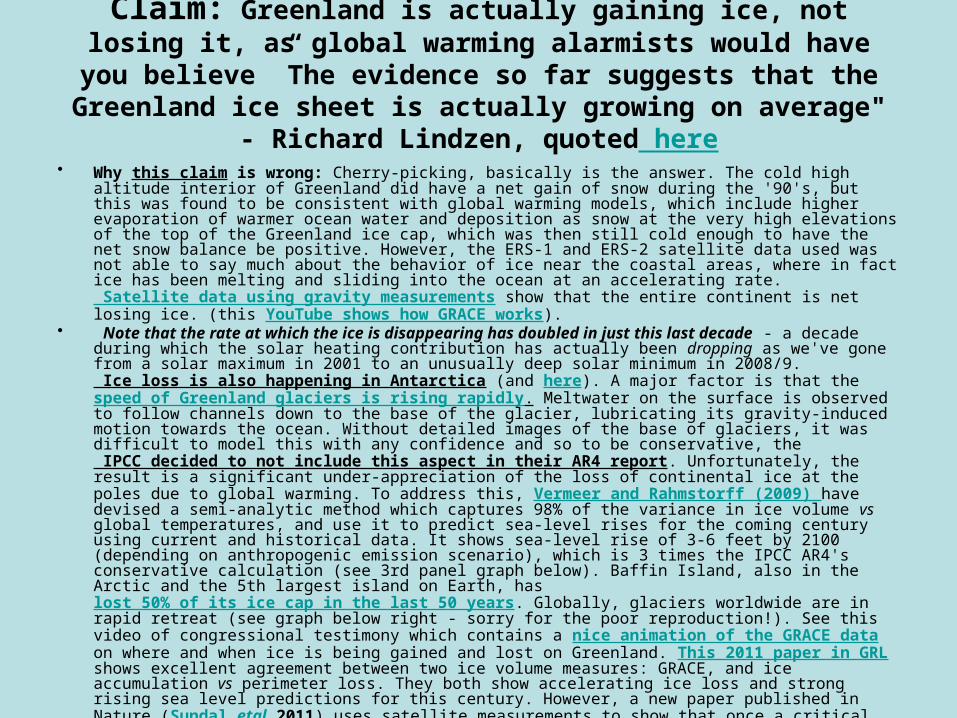
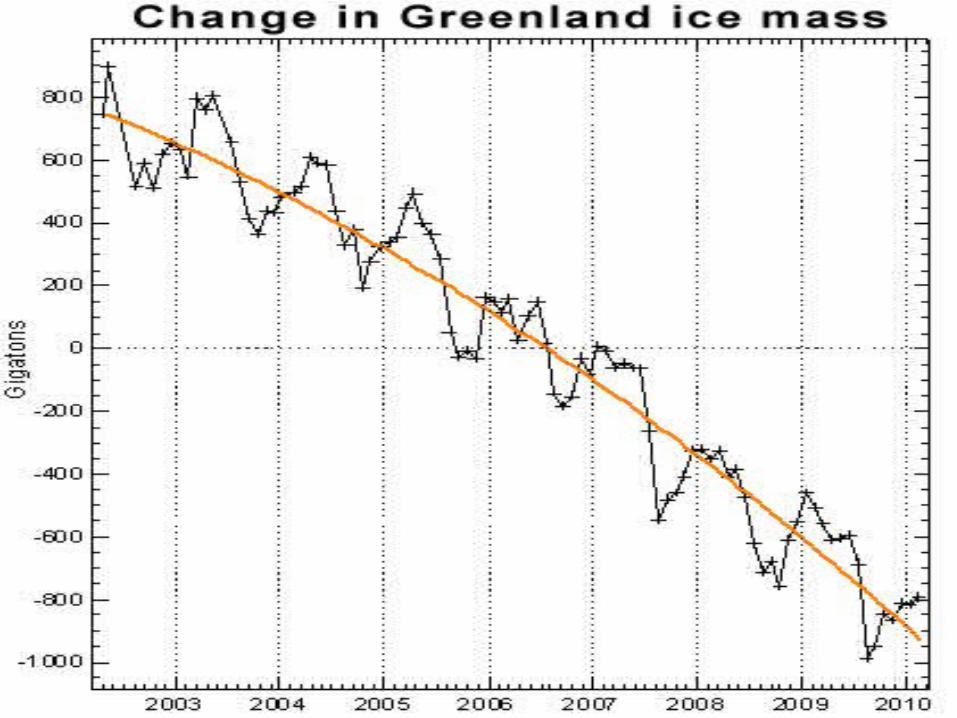
Claim: Greenland is actually gaining ice, not losing it, as global warming alarmists would have you believe ”The evidence so far suggests that the Greenland ice
sheet is actually growing on average" - Richard Lindzen, quoted here
• Why this claim is wrong: Cherry-picking, basically is the answer. The cold high altitude interior of Greenland did have a net gain of snow during the '90's, but this was found to be consistent with global warming models, which include higher evaporation of warmer ocean water and deposition as snow at the very high elevations of the top of the Greenland ice cap, which was then still cold enough to have the net snow balance be positive. However, the ERS-1 and ERS-2 satellite data used was not able to say much about the behavior of ice near the coastal areas, where in fact ice has been melting and sliding into the ocean at an accelerating rate. Satellite data using gravity measurements show that the entire continent is net losing ice. (this YouTube shows how GRACE works).
• Note that the rate at which the ice is disappearing has doubled in just this last decade - a decade during which the solar heating contribution has actually been dropping as we've gone from a solar maximum in 2001 to an unusually deep solar minimum in 2008/9. Ice loss is also happening in Antarctica (and here). A major factor is that the speed of Greenland glaciers is rising rapidly. Meltwater on the surface is observed to follow channels down to the base of the glacier, lubricating its gravity-induced motion towards the ocean. Without detailed images of the base of glaciers, it was difficult to model this with any confidence and so to be conservative, the IPCC decided to not include this aspect in their AR4 report. Unfortunately, the result is a significant under-appreciation of the loss of continental ice at the poles due to global warming. To address this, Vermeer and Rahmstorff (2009) have devised a semi-analytic method which captures 98% of the variance in ice volume vs global temperatures, and use it to predict sea-level rises for the coming century using current and historical data. It shows sea-level rise of 3-6 feet by 2100 (depending on anthropogenic emission scenario), which is 3 times the IPCC AR4's conservative calculation (see 3rd panel graph below). Baffin Island, also in the Arctic and the 5th largest island on Earth, has lost 50% of its ice cap in the last 50 years. Globally, glaciers worldwide are in rapid retreat (see graph below right - sorry for the poor reproduction!). See this video of congressional testimony which contains a nice animation of the GRACE data on where and when ice is being gained and lost on Greenland. This 2011 paper in GRL shows excellent agreement between two ice volume measures: GRACE, and ice accumulation vs perimeter loss. They both show accelerating ice loss and strong rising sea level predictions for this century. However, a new paper published in Nature (Sundal etal 2011) uses satellite measurements to show that once a critical level of melting is exceeded, the drainage under glaciers transitions to a more efficient mode and glacier speed slows. It will be interesting to see this new work included in future modelling of Greenland ice loss, as it is the major determiner of sealevel rise as global warming accelerates.
• The latest study, published in Nature: Climate Change in 2012, shows indeed that Greenland is more sensitive to losing it's entire ice cap than previously thought . We are already close to the temperature levels which, if sustained, will completely melt Greenland over the next centuries or millenia, even if CO2 levels are brought back down.

Claim: "How can you trust climate models, they don't even include clouds!“ and “Aerosols aren’t
even considered!” • Why these Claims are Wrong: Note quotation marks – Climate models have included clouds for
decades. It's a gross misrepresentation. As just one example from several years ago, see Hansen et.al. 2005, which includes both low and high level clouds in its climate modelling. That said, cloud modelling has been difficult and has been done by parameterizations based on observations. This is a good approach when the complex physics doesn't have sufficiently known boundary conditions or numerical resolution to model directly from first principles. It does not mean that the models are nonsense in what they produce. The evidence shows otherwise. Clouds are important to get right since about half of all insolation reflected back out to space is reflected by clouds. The IPCC AR4 identifies cloud modelling as one of the main contributers to the remaining spread in future temperature trends. But that spread is minor compared to the magnitude of the predictions, which are - severe warming.
• The situation has improved substantially in 2006 with the advent of the "A-Train" satellites observing coherently the same wide regions from space across a wide range of wavelengths in order to measure simultaneously aerosol content, spectroscopic identification of components, albedo, and droplet sizes from reflection properties.
• Published results show the pollution aerosols make for smaller water droplets and ice crystals and less rainfall from those clouds (Jiang et.al. GRL 35, L14804 (2008)). We've confirmed also what we've known since 1989; that large concentrations of sulfate aerosols (e.g. from fossil fuel burning) lead to smaller water droplets and brighter clouds (given the same water content), and that the smaller droplets inhibit precipitation and lead to longer lived clouds. So pollution adds a net cooling, on average. Since the industrialization of Asia has significantly net added to aerosols world wide, we expect a net cooling from this effect, yet clearly global temperature continue to rise despite this.
• Cloud feedbacks appear to be a positive feedback, meaning that CO2-induced warming alters cloud properties so that they accentuate the warming further. According to a study by Clement et.al. (2009) studying 55 years of COADS cloud data in the southeast Pacific, rising sea surface temperatures cause a decrease in low clouds and a further increase in low level temperatures
• The UK Met office's HADGem1 climate model closely matched the behavior of low clouds very well, and also is showing positive feedback. And finally, this paper (Dessler 2011) appeared recently, showing fatal flaws in the claims of Spencer and Lindzen that cloud cover changes are causing global warming, and that models, observations and theory all agree well when done self-consistently. The cloud modelling uncertainties are nowhere near large enough to change the important conclusion - that man-made GHG's are causing the observed global warming.
Claim: "CO2 Follows Temperature, Not
the Other Way Around" • Why this Claim is Shamefully Misleading: This was the most stunningly naive claim of all
(or deliberate red herring). Look at the logic this claim attempts to persuade with: Because many past instances in the paleoclimate record show temperatures rising from low levels, followed hundreds of years later with rising CO2 levels, this means that current CO2 rise cannot be causing global warming today. If your response is puzzlement and a struggle to grasp the logic, be reassured - there is no logic to grasp.
• This claim is a deliberate association of Ice Age causation with today’s climate change – when the two causes are obviously quite different. When temperature rises due to orbital change, the rising ocean temperature brings more CO2 out of solution and into the atmosphere (Callion et.al. 2003). The increased CO2 in the atmosphere then causes further temperature rise by the greenhouse Effect, which induces more CO2 out of the ocean, etc. This positive feedback, together with the ice albedo positive feedback effect, is sufficient to bring Earth out of an Ice Age into an interglacial. It takes many centuries for this process to happen as the CO2 transfers into and out of the ocean are quite slow because global deep ocean currents are very slow, and because the process proceeds through stages of quasi-equilibrium. (see here, and here.
• Today's global warming is happening not on the thousands of years time scales of the "CO2 Follows Temperature, Not the Other Way Around" cannard, but a few decades. And the record clearly shows CO2 rise is happening followed closely by temperature rises. The reason is simple - we're adding CO2 directly to the atmosphere, at a pace far in excess of what the ocean or land can absorb. Not even remotely in equilibrium.
• It's not at all like "CO2 follows temperature" examples in the pre-human record. 10,000 years ago, humans comprised about 0.1% of the land vertebrate biomass. Today, we comprise over 99%, and drastically altering the atmosphere as we dominate the planet.

Claim: Cities have grown during the 20th century and their asphalt, concrete and buildings absorb much more heat than vegetated countryside. This biases
temperature measurements - this "Urban Heat Island Effect" accounts for much or all of global warming, not
CO2. • Why This Claim is Wrong: This effect is and has been very well
understood and continues to be factored into studies of global temperatures. The denialist claim is disingenuous in the extreme and aims itself at the naive, who don't realize how obvious and for how long this effect has been understood by climate scientists.
• For example, the latest IPCC report in 2007 finds that urban heat island effects have been determined to have negligible influence (less than 0.0006 °C per decade over land and zero over oceans) on these measurements. Fox News TV weatherman Anthony Watts is obsessed with this “explanation” of global warming.
• There isn't, and never was, a "urban heat island" issue with the data. Here's the latest graph showing global temperatures using all data, and using only rural weather stations. For the entire 160 year period, there is no difference (with the exception of the Civil War- questionable data-taking in the heat of battle?) .
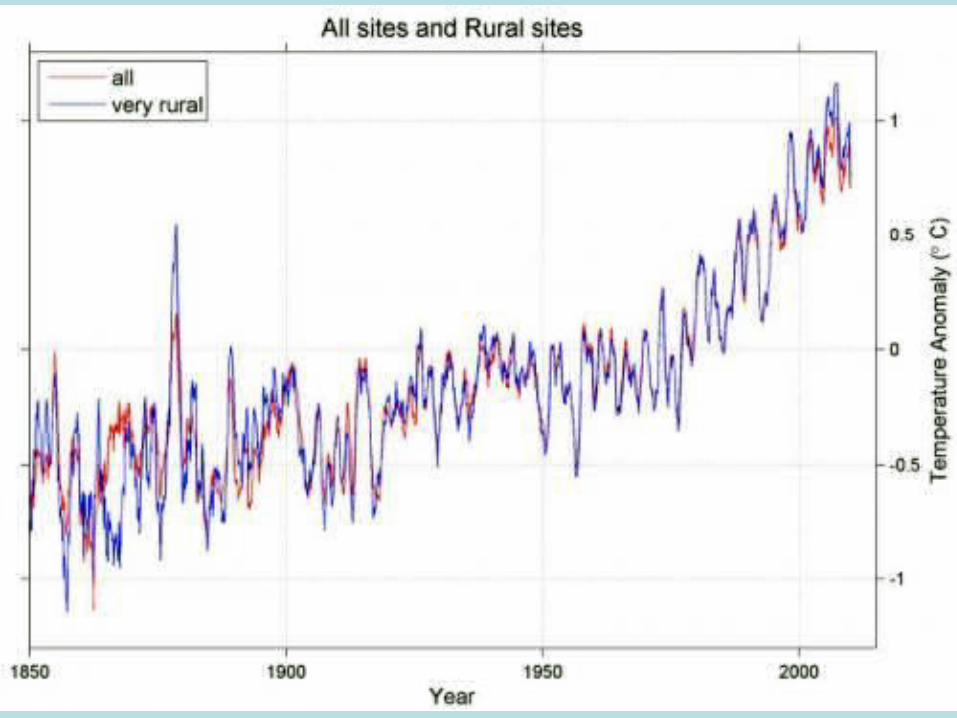
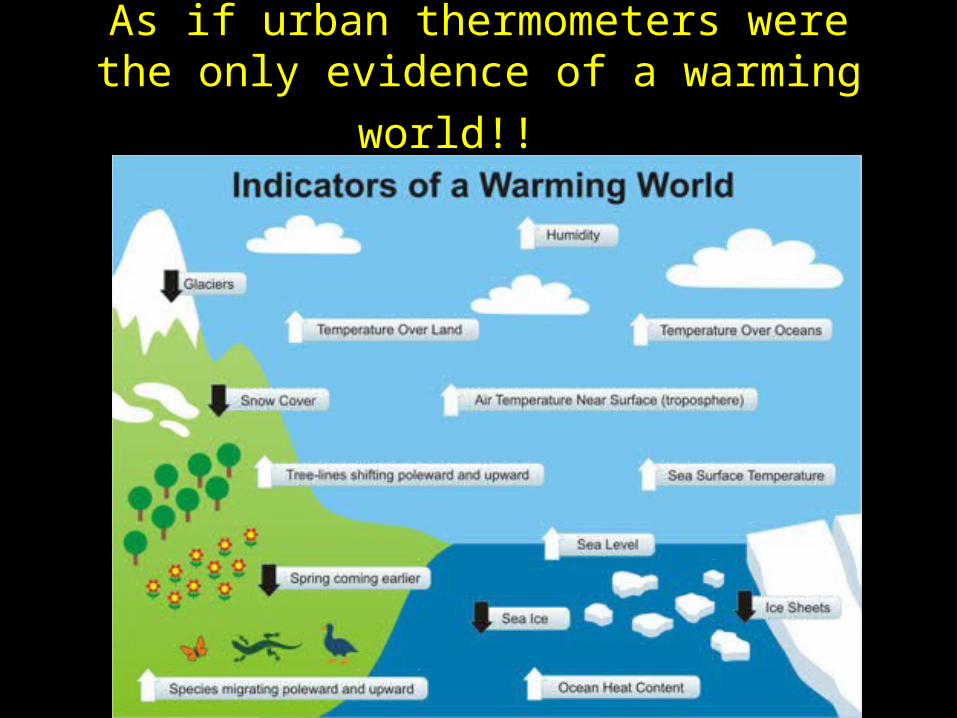
As if urban thermometers were the only evidence of a warming world!!
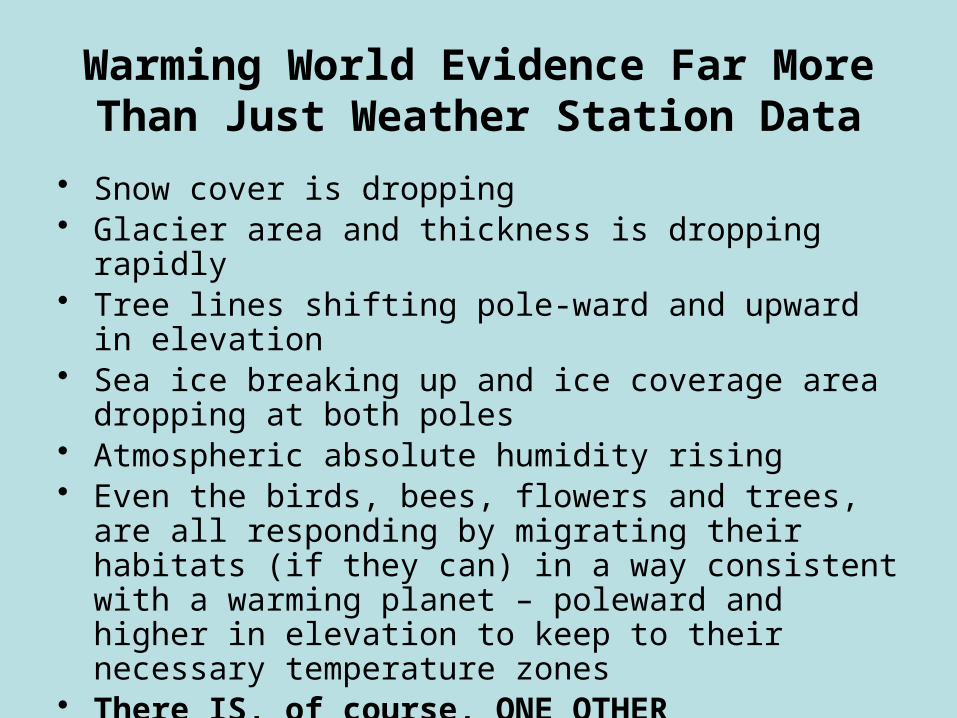
Warming World Evidence Far More Than Just Weather Station Data
• Snow cover is dropping• Glacier area and thickness is dropping rapidly• Tree lines shifting pole-ward and upward in elevation• Sea ice breaking up and ice coverage area dropping at
both poles• Atmospheric absolute humidity rising• Even the birds, bees, flowers and trees, are all
responding by migrating their habitats (if they can) in a way consistent with a warming planet – poleward and higher in elevation to keep to their necessary temperature zones
• There IS, of course, ONE OTHER EXPLANATION…

They’re IN on it!• The Massive Global Conspiracy to Hide
Data, Defraud You and Me, and complete the Communist One-World Hedgemony!!
• The Birds! The Bees! The Flowers! And The Trees!!
• They’re ALL…. IN….. !!

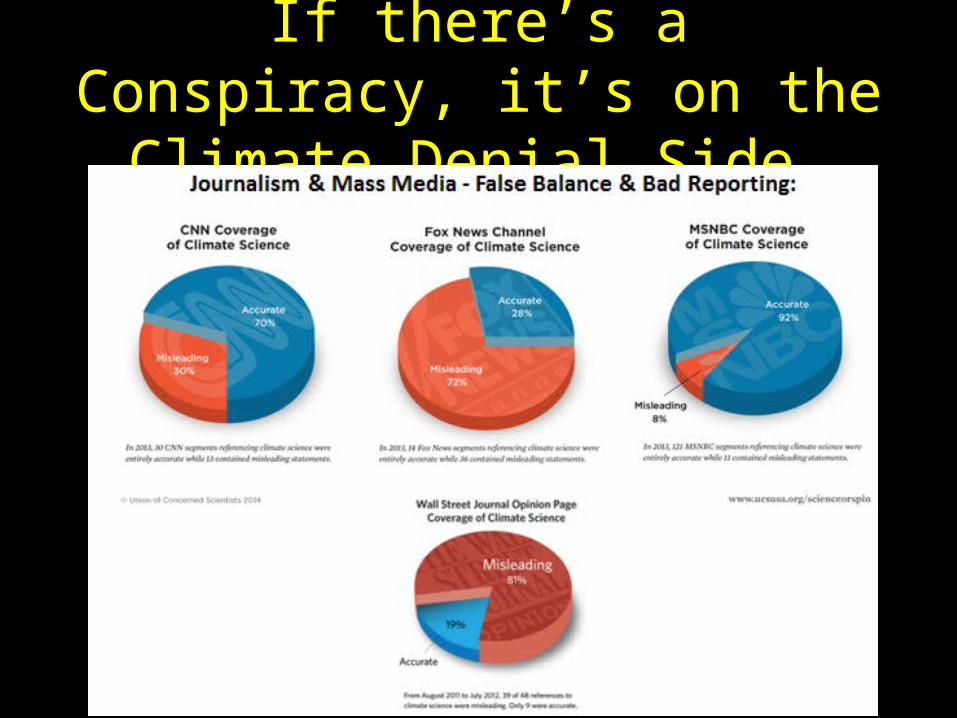
If there’s a Conspiracy, it’s on the Climate Denial Side…
Claim: Climate scientists who claim global warming will be a disaster are just alarmists trying to scare you for their own unsavory
purposes • Why This Claim is Wrong : Richard Lindzen is fond of repeating this theme (while
supplying no evidence) - that climate scientists are just trying to scare you, for their own nefarious purposes.
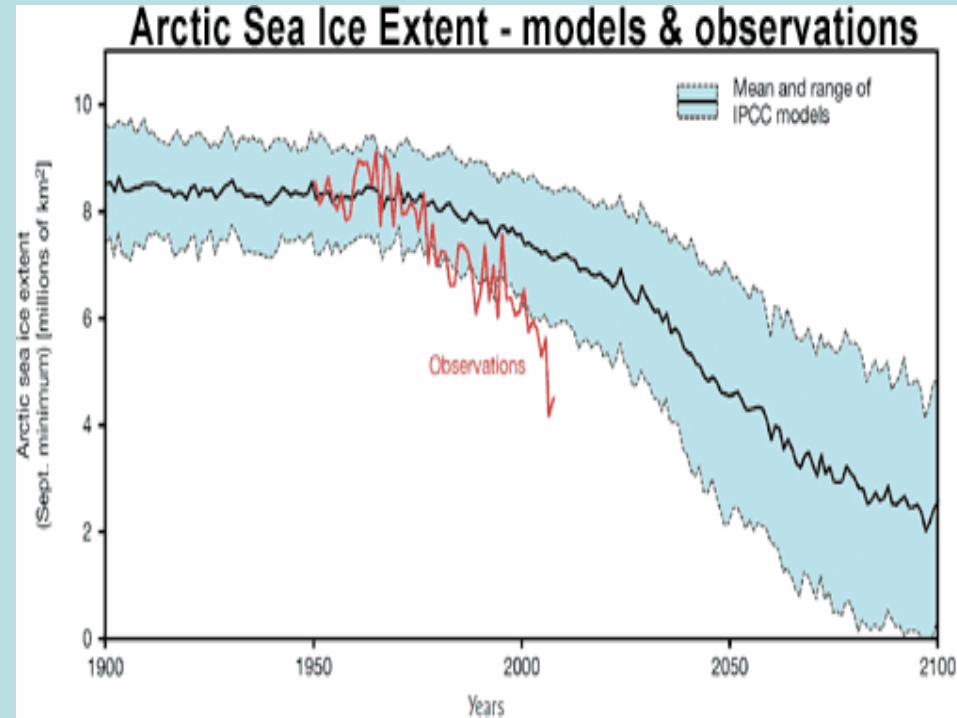
• Let's consider whether the predictions from the IPCC consensus documents are "alarmist" or not. This link concisely compares the IPCC AR3 (2001) and AR4 (2007) predictions with actual observations since publication. It shows CO2 emissions accelerating upward even faster than the most "alarmist" IPCC scenario, it shows sea level rising at a rate at the extreme upper end of the range of IPCC scenarios since 1990, and it shows arctic ice loss accelerating faster than even the most alarming IPCC AR4 models.
• Even the more recent IPCC AR4 issued in 2007 is actually too conservative and not "alarmist" enough in its predictions. The AR4 predicted that the Arctic would not become ice free in summer until near the end of the 21st century, but it did not include modelling the effects of breakage and movement of broken ice. Moving ice finds its way into the ocean currents that carry it out of the Arctic Ocean, where it melts rapidly (Rampal et.al 2011).
• It is not only the area of ice loss, but the thickness of the ice that does remain which is thinning rapidly, so the ice volume is shrinking even more rapidly. This MIT University study (2011) shows far more rapid ice loss predicted for the Arctic Ocean, and an ice-free Arctic is likely to happen by mid-century. Elsewhere here, I reference observations of ice loss due to glacier movement in Greenland, significantly worse than IPCC predictions because they were unable to model the glacier base/ground interface and so did not include it, yet observations clearly show that glacier movement is accelerating as the Earth warms, faster than the IPCC predictions.
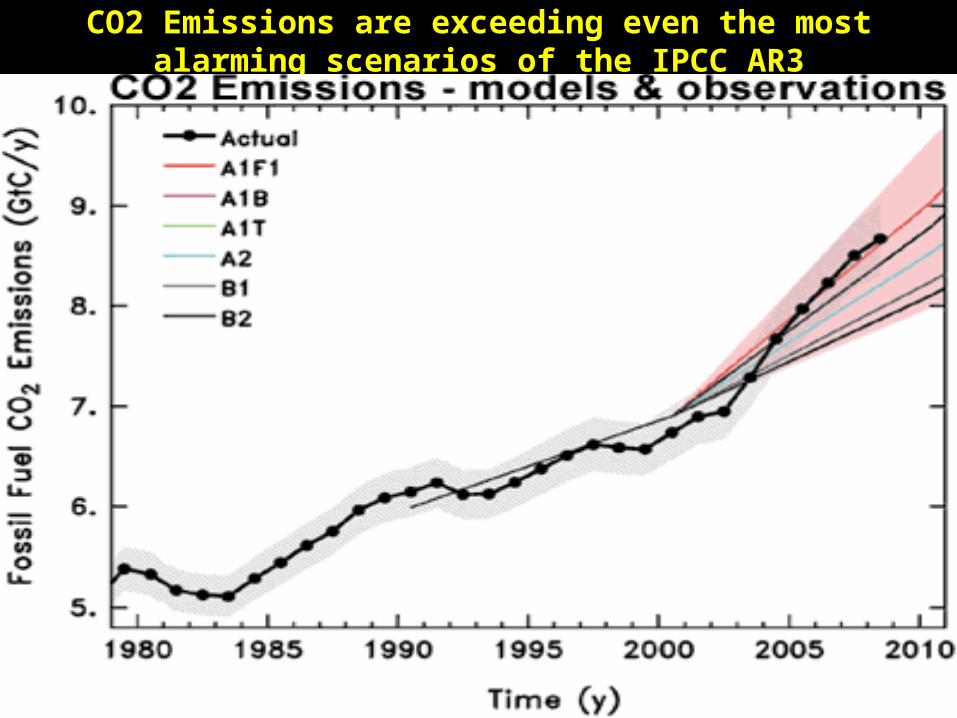
CO2 Emissions are exceeding even the most alarming scenarios of the IPCC AR3
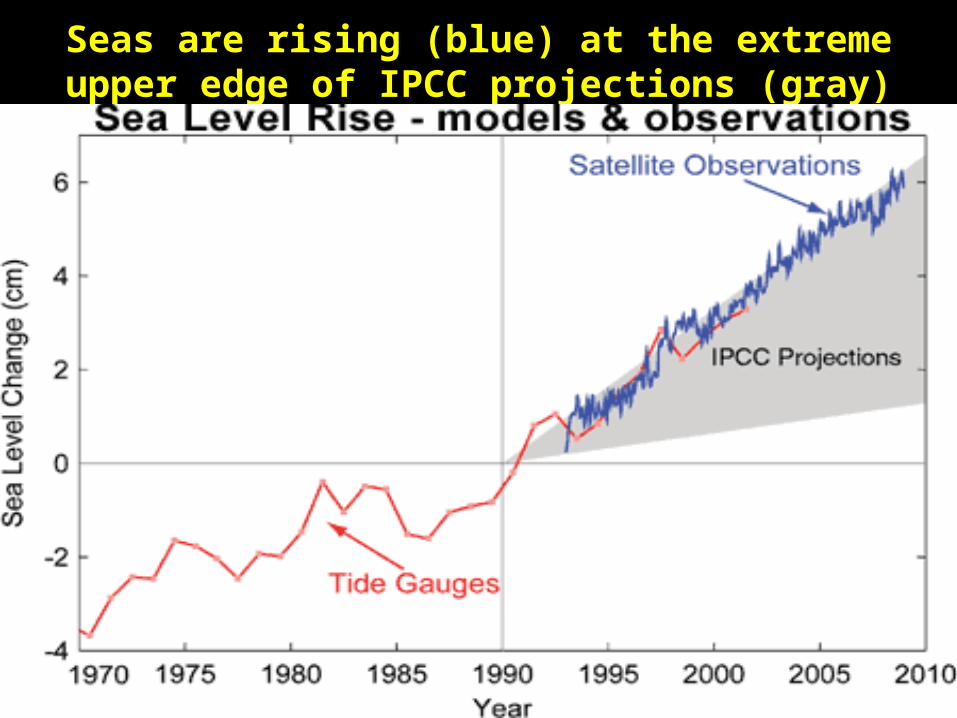
Seas are rising (blue) at the extreme upper edge of IPCC projections (gray)
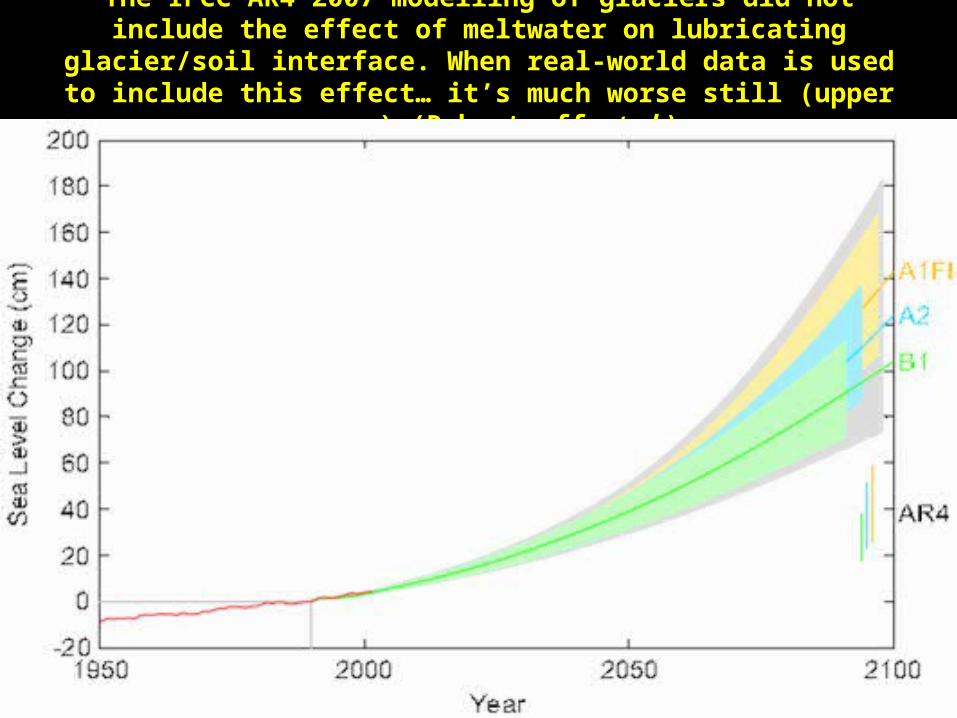
The IPCC AR4 2007 modelling of glaciers did not include the effect of meltwater on lubricating
glacier/soil interface. When real-world data is used to include this effect… it’s much worse still (upper curves)
(Rahmstorff et al.)

On Richard Lindzen • Richard Lindzen is the highest profile and considered the most prestigious (Sloan fellow at MIT)
of the AGW denialists. So it's disturbing that he uses his MIT position (earned by reputable work that was not AGW-denialist oriented way back when he was a young man) while making misrepresentations in the Wall Street Journal and other non-science journal outlets about climate science and the scientific evidence for global warming, without references, without support. Here is an account of his testimony in front of the UK's House of Lords and the outright falsehoods about the scientific consensus. A quote from this article: "when a panelist specifically asks ‘how far your view of the role of water vapour is shared by other scientists?’ (Q144), one cannot honestly answer ‘That is shared universally’ when no other scientist in the field has made a case for a negative water vapour feedback. This is probably the most egregious mis-statement in the whole testimony and is deeply misleading."
• Here are links to his conflicts of interest in taking money from Big Oil, and to his own grad students' testifying that Lindzen feels a strong emotional need to prove his status at the expense of others, bringing into further question his ability to be objective and truth-oriented: “If you want to prove yourself a brilliant scientist, you don’t always agree with the consensus,” said Daniel Kirk-Davidoff, a former student of Lindzen’s at MIT. “You show you’re right and everyone else is wrong. He certainly enjoys showing he’s right and everyone else is wrong,” Kirk-Davidoff continued. “If you have a ten minute conversation with him, you can tell that.”
• Response to Lindzen's Newsweek interview • Here's another good video on the junk science of the objections to AGW, the final few minutes
of which does a good summary of the poor science in Lindzen's "Iris" hypothesis. • A long and growing list of Lindzen quotes and comparisons with reality, is here. No responsible
person sincerely desiring to know the truth can afford to simply take his unsupported pronoucements and poor science on faith, just because he's an MIT professor. That is the classic logical fallacy of "the argument from authority".
• Update 2012: Despite having been called on his outrageously wrong statements time and again, he continues to make them - oblivious to answering those who point out how obvious are his errors. The latest in this long line of dis-informational talks is described here, and here. Lindzen has another (Aug 22, 2012) op/ed piece in the Wall Street Journal which continues to spread misinformation which is at odds with the evidence, as critically examined here.
Key Ideas: Debunking Denialist Claims• Popular denialist claims:--- “It’s the Sun” (no, for past 60 years solar luminosity constant) ---“Urban heat island effect” (shows actually no effect on temperatures, and was
understood in original papers anyway)---”It’s a conspiracy!” (career motivation of scientists is NOT to tow the part line,
but champion truth ESPECIALLY if it goes against consensus. Motivational logic is all wrong. Conspiracy much more motivationally aligned with climate denialism, not scientists)
--- There is powerful career and financial motivation even for a good scientist, to NOT be a member of the consensus – UNLESS the CONSENSUS is CORRECT!
---”IPCC is alarmist!” (their early e.g. 1995 and 2001 and even 2007 AR’s are in fact showing to be far too mild [sea level, glacier melt, Arctic ocean ice loss, etc] vs. subsequent data. And motivations of parent governments of individual scientists is to force it to be milder, since scientists predominately come from biggest CO2 emitting countries)
--- “Cosmic Rays cause low clouds, cooling climate. Lessening cosmic rays could be causing Global Warming”. No. No evidence CR’s nucleate any clouds, 1000x more CCN’s already so don’t need CR’s anyway. And CR’s have NOT increased or decreased over past 60 years.
--- “GW is just a rebound from last Ice Age, or the Little Ice Age”. No, temperatures were very slowly cooling right up to the sharp change to warming at beginning of 20th century. All of the rising of temps from end of last great Ice Age were obviously done by 8,000 years ago.
--- Trade journals published by corporate organizations, and clearly for corporate purposes. Genuine science journals published by scientific societies, supported by dues-paying scientists. Trade journals like “Energy and Environment” have a very poor reputation of publishing unbiased science.