k-12 policy the language of reform: english learners in...
TRANSCRIPT

k-1
2 p
oli
cy The Language of RefoRm:
engLish LeaRneRs in CaLifoRnia’s shifTing eduCaTion LandsCape
Se
pt
em
be
r 2
014
TO THE POINT:
Nearly 1 out of 4 students in california schools is learning english, and 85 percent of english learners live in low-income households. too often, they encounter insufficient academic supports, ill-prepared teachers, and less rigorous coursework.
A number of districts are breaking this pattern; we feature 11 with better achievement, language acquisition, and reclassification patterns. Some of these district leaders share practices that have contributed to positive results for their english learners.
District and state leaders can take action to better serve english learners by capitalizing on the opportunities afforded by the local control Funding Formula and the common core State Standards.
headline
2 THE EducaTION TrusT–WEsT | THE LaNguagE Of rEfOrm | sEPTEmbEr 2014
California is a state rich in linguistic and cultural diversity. nearly 45 percent of Californians speak a language other than english at home, and in our schools, nearly 1 out of 4 students is learning english. California’s diversity, economic strength, and geography have drawn families to the state for generations and have compelled them to make the golden state their home. These families and individuals have fueled California’s growth and have positioned the state as an economic powerhouse and world leader.
at the same time, California’s schools wrestle with how best to serve this diverse population. english learners often face ill-prepared teachers, less rigorous coursework, and insufficient academic supports. on top of the linguistic barriers they face, about 85 percent of California’s english learners live in low-income households.
students who are learning english when they enter California schools, particularly those who are also low income, are less likely to demonstrate proficiency on the state standards, are more likely to repeat grades, are less likely to enroll in college-preparatory coursework in high school, and are more likely to drop out of school. it is not uncommon for english learners to spend half a dozen years in California schools without being reclassified as english proficient.
But it doesn’t have to be this way. in this report, we highlight a number of California districts that are breaking this pattern. Through an analysis of unified district performance, we identify districts at the top of various peer groupings based on certain student demographic characteristics. We do so by considering performance relative to four indicators:
• the proficiency of English learners and students who are Reclassified-Fluent-English-Proficient (RFEP), across three grade levels, on the English Language Arts portion of the California Standards Tests
• annual progression on the California English Language Development Test (CELDT), which measures English fluency
• long-term English learner (LTEL) rates, which measure the percent of students who remain English learners for five years or more, drawing upon federal data
• reclassification rates at the elementary, middle, and high school levels
Our definitiOnsEnglish lEarnEr (El) A student who speaks a primary language other than english and who lacks certain english language skills
rEclassifiEd-fluEnt-English-ProficiEnt (rfEP) studEnt A student who was previously an english learner but who has met certain standards for english proficiency
“EvEr-English lEarnEr” studEnt A student who is currently an english learner or who was an english learner but has been reclassified as fluent-english-Proficient
long-tErm English lEarnEr (ltEl) A student who has been an english learner for five or more years
executive summAry
headline
THE EducaTION TrusT–WEsT | THE LaNguagE Of rEfOrm | sEPTEmbEr 2014 3
Through our analysis, we identified 11 districts that perform well on multiple indicators. We talked with educators and field experts to surface practices and strategies that have contributed to positive results for english learners. While there is no consistent formula for success across these districts, common themes have emerged. These districts:
• believe that students’ native languages are cultural and linguistic assets
• offer professional learning opportunities and collaboration time to ensure all teachers are equipped with the strategies and skills needed to support English learners
• offer English learners access to a full Common Core-aligned curriculum that includes rigorous expectations, frequent formative assessments, and college-preparatory courses
• engage parents and forge strong home-school connections
much work remains to ensure all english learners can access the supports and structures necessary for success in school and beyond. The following recommendations for district and state leaders help address potential barriers to english learners’ success:
1. ensure english learners have full access to rigorous content and college-preparatory coursework aligned with the Common Core, english Language development (eLd), and next generation science standards, including the “a-g” courses at the high school level that are necessary for acceptance into the state’s public universities.
2. Train teachers to support language development within the context of the core curriculum, not just in targeted eLd classes.
3. monitor early implementation of the new smarter Balanced formative and summative assessments to understand their impact on english learners.
4. When reporting test data on english learners’ achievement, disaggregate results for long-term english learners.
5. When reporting data on english learners’ achievement, focus on student growth, not just overall proficiency.
6.. ensure the needs of english learners are adequately addressed within Local Control and accountability plans (LCaps).
7. support biliteracy as a viable instructional program so that districts may provide a range of language instruction options for students and their families.
8. Create clearer, more uniform statewide reclassification standards and guidelines.
9. modify the Local Control funding formula to allow reclassified english learners to generate supplemental and concentration funds.
addressing these policy and implementation challenges will better equip California districts, schools, and classrooms to support students who are learning english. Coupled with the opportunities that Common Core and increased funding bring, we are optimistic that more districts will meet the academic and linguistic needs of english learners.
nEarly 45% of californians sPEak a languagE othEr than English at homE, and in our schools, nEarly 1 out of 4 studEnts is lEarning English.
4 THE EducaTION TrusT–WEsT | THE LaNguagE Of rEfOrm | sEPTEmbEr 2014
headline
California is a state rich in linguistic and cultural diversity. nearly 45 percent of Californians speak a language other than english at home, and in our schools, nearly 1 out of 4 students is learning english.1 although 85 percent of these students speak spanish as a first language, California’s english Learner (eL) students speak more than 60 different languages, including dozens of asian and pacific islander languages. California’s diversity, economic strength, and geography have drawn families to the state for generations and have compelled them to make the golden state their home. These families and individuals have fueled California’s growth and have positioned the state as an economic powerhouse and world leader.
at the same time, California’s schools have wrestled with how best to serve this diverse population. starting in the earliest grades, students who are learning english face obstacles that their english-proficient peers simply do not encounter. These students must master a new language and academic content at the same time. They are often taught by teachers unprepared to address their linguistic needs. in addition, school staff can be ill-equipped to engage and communicate with parents who don’t speak english,
particularly when doing so also means addressing cultural differences. as they progress through the grades, english learners may experience prolonged placement in courses designed specifically for eLs, denying them the opportunity to learn alongside their english-speaking peers. and, by high school, few eLs are offered access to rigorous coursework and college-going supports. on top of the linguistic barriers they face, about 85 percent of California’s english learners (more than 1 million students) live in low-income households.2
Taken together, these conditions have resulted in an education system that fails far too many english learners. students who are learning english when they enter California schools, particularly those who also come from low-income families, are less likely to demonstrate proficiency on the state standards, are more likely to repeat grades, are less likely to enroll in college-preparatory coursework in high school, and are more likely to drop out of school.3,4 Too often, english learners spend five years or longer in California schools without being reclassified as english proficient.5
But it doesn’t have to be this way. in this report, we highlight a number of California districts that are breaking this pattern. districts like selma unified, Calipatria unified, Los alamitos unified, and West Covina unified are posting english learner results that are better than other districts with similar student populations. We share data from these and other California districts that are successfully serving english learners, and we uncover the practices and strategies yielding those results.
These strategies for improving english learner outcomes provide models that districts may wish to learn from or build into their newly required Local Control and accountability plans. We conclude this report with a series of policy recommendations to help ensure that english learners truly have equal access to a high-quality education in California’s public schools.
the LAnguAge Of refOrm: engLish LeaRneRs in CaLifoRnia’s shifTing eduCaTion LandsCape
By carriE hahnEl, lEni Wolf, amBEr Banks, and JEannEttE lafors
Carrie Hahnel is the Director of Research and Policy Analysis, Leni Wolf is a Data and Policy Analyst, Amber Banks is a Practice Associate, and Jeannette LaFors, PhD, is the Director of Equity Initiatives at The Education Trust–West. In addition, Orville Jackson, PhD, Senior Research Analyst, provided invaluable support in conducting this research and preparing this report.
THE EducaTION TrusT–WEsT | THE LaNguagE Of rEfOrm | sEPTEmbEr 2014 5
headline
over the past five decades, a tapestry of laws and regulations have attempted to remedy the poor outcomes for english learners by requiring a range of services to ensure their equal participation in school. see the Legislative and Policy Timeline on pages 6-7. With these programs have come increased funding, oversight, and accountability. at the same time, California students and educators have also had to weather shifting public attitudes toward language diversity and english instruction. most notably, California voters, in a wave of hostility toward bilingualism in 1998, demanded that all schoolchildren learn english in a standard, immersion-based way. although attitudes have begun to shift, and research increasingly supports the benefits of bilingual instruction for educational outcomes, the law banning bilingual education remains in place.
more recent changes are also sure to affect how english learners are offered in California schools. in 2010, California adopted the Common Core state standards, followed in 2012 by updated english Language development (eLd) standards aligned to the Common Core. in 2014, the state approved an english Language arts (eLa) and eLd framework that serves as a blueprint for how to implement these two sets of standards. Compared with previous standards, these new standards and their accompanying assessments
demand that english learners engage with more complex content in both languages. They need to write answers to math and eLa questions — rather than just fill in bubbles. They also need to explain, both in writing and verbally, how they solved word problems and completed complex performance tasks.
on the heels of these instructional shifts, California lawmakers dramatically reformed the state’s school funding formula in 2013. The Local Control funding formula (LCff) offers school districts additional dollars for each student who is from a low-income family, learning english, or in foster care, along with increased flexibility regarding how to serve all students. in exchange, districts are held accountable for engaging communities in the development of academic goals and plans (called “Local Control and accountability plans,” or LCaps), spending money on targeted services for those three groups of students, and making progress toward academic targets. These extra dollars and accountability for english learners are in addition to the existing provisions of state and federal law governing services for english learners. The hope is that these new funding streams and their resulting services will boost the academic performance of english learners, putting them on a path toward high school graduation and college and career success.
stAte And nAtiOnAL POLicies Affecting engLish LeArners california English lEarnEr
studEnts sPEak morE than 60 diffErEnt languagEs. 85% of thEsE studEnts sPEak sPanish as a first languagE.
6 THE EducaTION TrusT–WEsT | THE LaNguagE Of rEfOrm | sEPTEmbEr 2014
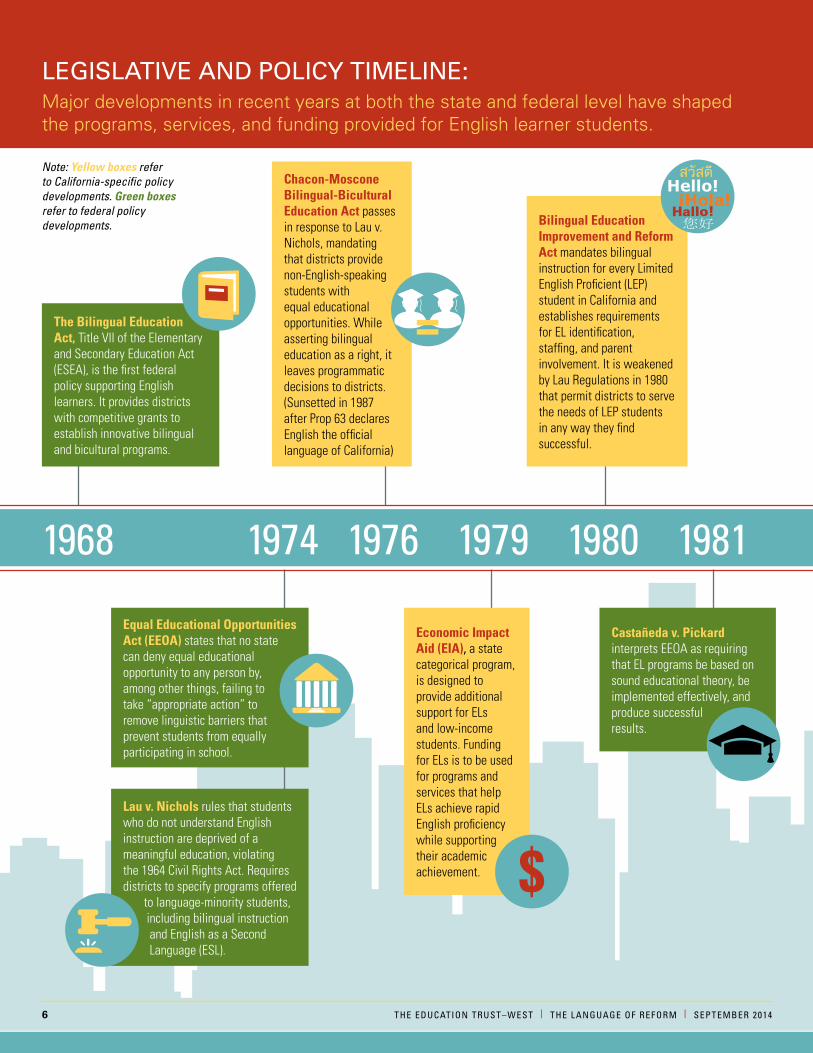
LegisLAtive And POLicy timeLine:major developments in recent years at both the state and federal level have shaped the programs, services, and funding provided for english learner students.
1968 1974 1976 1979 1980 1981
Equal Educational opportunities act (EEoa) states that no state can deny equal educational opportunity to any person by, among other things, failing to take “appropriate action” to remove linguistic barriers that prevent students from equally participating in school.
lau v. nichols rules that students who do not understand English instruction are deprived of a meaningful education, violating the 1964 Civil Rights Act. Requires districts to specify programs offered to language-minority students, including bilingual instruction and English as a Second
Language (ESL).
the Bilingual Education act, Title VII of the Elementary and Secondary Education Act (ESEA), is the first federal policy supporting English learners. It provides districts with competitive grants to establish innovative bilingual and bicultural programs.
castañeda v. Pickard interprets EEOA as requiring that EL programs be based on sound educational theory, be implemented effectively, and produce successful results.
chacon-moscone Bilingual-Bicultural Education act passes in response to Lau v. Nichols, mandating that districts provide non-English-speaking students with equal educational opportunities. While asserting bilingual education as a right, it leaves programmatic decisions to districts. (Sunsetted in 1987 after Prop 63 declares English the official language of California)
Bilingual Education improvement and reform act mandates bilingual instruction for every Limited English Proficient (LEP) student in California and establishes requirements for EL identification, staffing, and parent involvement. It is weakened by Lau Regulations in 1980 that permit districts to serve the needs of LEP students in any way they find successful.
Economic impact aid (Eia), a state categorical program, is designed to provide additional support for ELs and low-income students. Funding for ELs is to be used for programs and services that help ELs achieve rapid English proficiency while supporting their academic achievement.
Note: Yellow boxes refer to California-specific policy developments. Green boxes refer to federal policy developments.
$
=
Hallo!
THE EducaTION TrusT–WEsT | THE LaNguagE Of rEfOrm | sEPTEmbEr 2014 7
1997 1998 2001 2011 2012 2013 2014
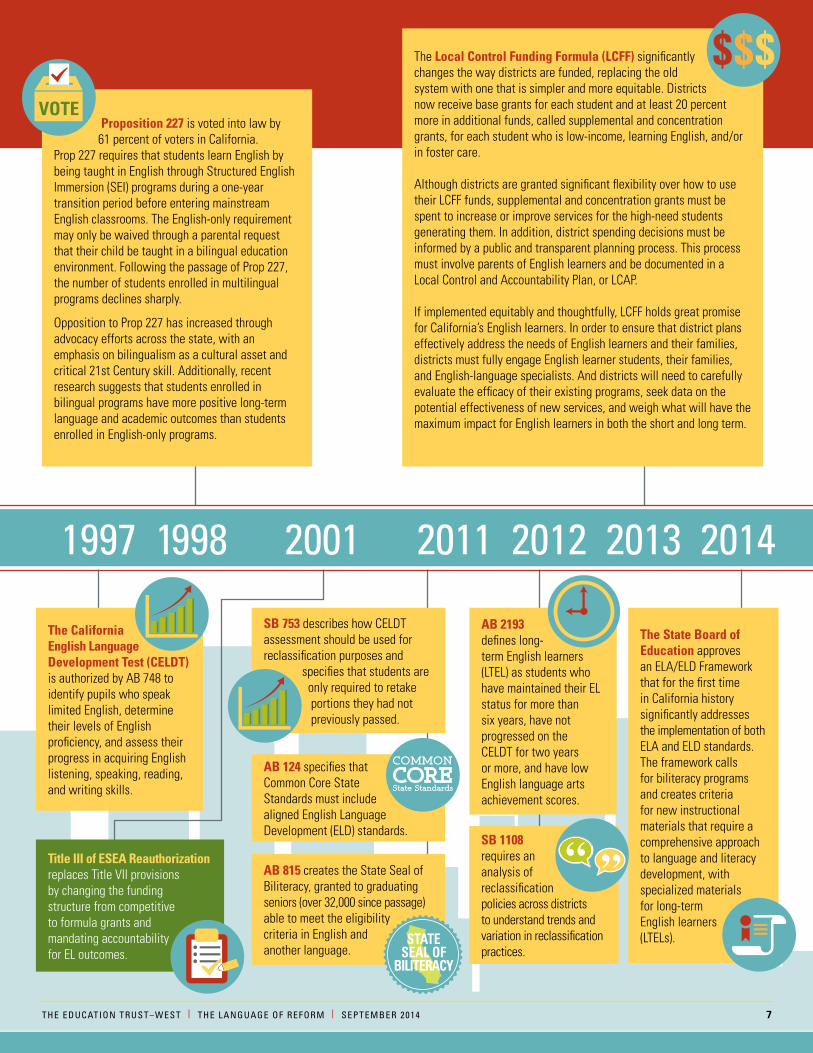
Proposition 227 is voted into law by 61 percent of voters in California. Prop 227 requires that students learn English by being taught in English through Structured English Immersion (SEI) programs during a one-year transition period before entering mainstream English classrooms. The English-only requirement may only be waived through a parental request that their child be taught in a bilingual education environment. Following the passage of Prop 227, the number of students enrolled in multilingual programs declines sharply.
Opposition to Prop 227 has increased through advocacy efforts across the state, with an emphasis on bilingualism as a cultural asset and critical 21st Century skill. Additionally, recent research suggests that students enrolled in bilingual programs have more positive long-term language and academic outcomes than students enrolled in English-only programs.
sB 753 describes how CELDT assessment should be used for reclassification purposes and specifies that students are only required to retake portions they had not previously passed.
aB 2193 defines long- term English learners (LTEL) as students who have maintained their EL status for more than six years, have not progressed on the CELDT for two years or more, and have low English language arts achievement scores.
the state Board of Education approves an ELA/ELD Framework that for the first time in California history significantly addresses the implementation of both ELA and ELD standards. The framework calls for biliteracy programs and creates criteria for new instructional materials that require a comprehensive approach to language and literacy development, with specialized materials for long-term English learners (LTELs).
sB 1108 requires an analysis of reclassification policies across districts to understand trends and variation in reclassification practices.
aB 124 specifies that Common Core State Standards must include aligned English Language Development (ELD) standards.
aB 815 creates the State Seal of Biliteracy, granted to graduating seniors (over 32,000 since passage) able to meet the eligibility criteria in English and another language.
The local control funding formula (lcff) significantly changes the way districts are funded, replacing the old system with one that is simpler and more equitable. Districts now receive base grants for each student and at least 20 percent more in additional funds, called supplemental and concentration grants, for each student who is low-income, learning English, and/or in foster care. Although districts are granted significant flexibility over how to use their LCFF funds, supplemental and concentration grants must be spent to increase or improve services for the high-need students generating them. In addition, district spending decisions must be informed by a public and transparent planning process. This process must involve parents of English learners and be documented in a Local Control and Accountability Plan, or LCAP. If implemented equitably and thoughtfully, LCFF holds great promise for California’s English learners. In order to ensure that district plans effectively address the needs of English learners and their families, districts must fully engage English learner students, their families, and English-language specialists. And districts will need to carefully evaluate the efficacy of their existing programs, seek data on the potential effectiveness of new services, and weigh what will have the maximum impact for English learners in both the short and long term.
title iii of EsEa reauthorization replaces Title VII provisions by changing the funding structure from competitive to formula grants and mandating accountability for EL outcomes.
$$$votE
Common
CoREState Standards
statE sEal of
BilitEracy
the california English language development test (cEldt) is authorized by AB 748 to identify pupils who speak limited English, determine their levels of English proficiency, and assess their progress in acquiring English listening, speaking, reading, and writing skills.
headline
8 THE EducaTION TrusT–WEsT | THE LaNguagE Of rEfOrm | sEPTEmbEr 2014
BEcoming an English lEarnErWhen students enroll in California schools, their parents must complete a survey that asks what language the children primarily speak at home. if that language is something other than english, students must take the California english Language development Test (CeLdT), the state test of english language proficiency, which assesses listening, speaking, reading, and writing skills in english. if students fall below the early advanced level, they are designated as english learners — a label that follows them until they can demonstrate english proficiency and receive the sign-off of educators in their district. however, if students score high enough on this initial CeLdT, they are labeled as initially fluent-english-proficient (ifep) and go on to participate in the regular academic program without receiving targeted language services.
students designated as eLs are assessed annually; those who achieve sufficient english language proficiency may earn Reclassified fluent-english-proficient (Rfep) status.6 districts must establish local reclassification policies and procedures based on CeLdT results, teacher evaluation of student progress, parental consultation, and student performance on a statewide assessment of basic skills in english language arts. While the state Board of education (sBe) provides
general guidelines regarding these four required reclassification criteria, districts vary in how they weigh specific criteria and what cut scores they set for reclassification.7 These differing local approaches may in part be responsible for the wide variation in rates of reclassification across California school districts.
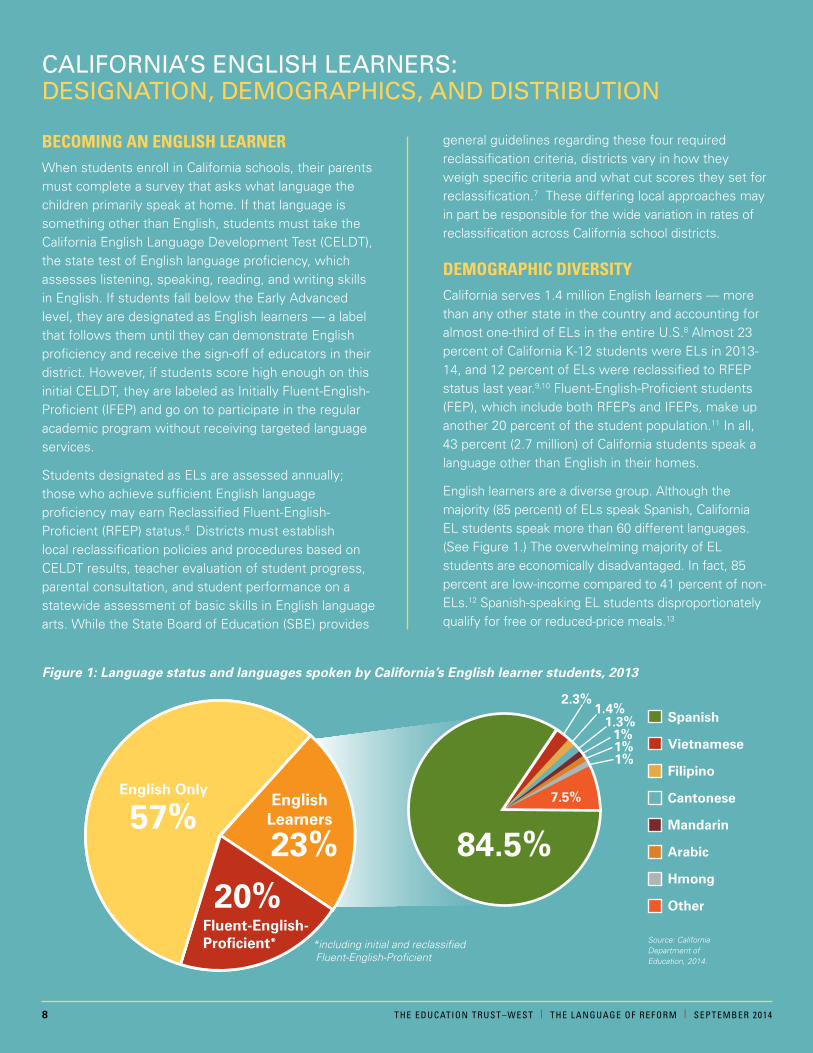
dEmograPhic divErsityCalifornia serves 1.4 million english learners — more than any other state in the country and accounting for almost one-third of eLs in the entire u.s.8 almost 23 percent of California K-12 students were eLs in 2013-14, and 12 percent of eLs were reclassified to Rfep status last year.9,10 fluent-english-proficient students (fep), which include both Rfeps and ifeps, make up another 20 percent of the student population.11 in all, 43 percent (2.7 million) of California students speak a language other than english in their homes.
english learners are a diverse group. although the majority (85 percent) of eLs speak spanish, California eL students speak more than 60 different languages. (see figure 1.) The overwhelming majority of eL students are economically disadvantaged. in fact, 85 percent are low-income compared to 41 percent of non-eLs.12 spanish-speaking eL students disproportionately qualify for free or reduced-price meals.13
cALifOrniA’s engLish LeArners: designAtiOn, demOgrAPhics, And distributiOn
*including initial and reclassified Fluent-English-Proficient
20%
23%
English Only
2.3%1.4%
1.3%1%1%1%
7.5%
Spanish
Vietnamese
Filipino
Cantonese
Mandarin
Arabic
Hmong
Other
EnglishLearners57%
84.5%
Fluent-English- Proficient*
Figure 1: Language status and languages spoken by California’s English learner students, 2013
Source: California Department of Education, 2014.
headline
THE EducaTION TrusT–WEsT | THE LaNguagE Of rEfOrm | sEPTEmbEr 2014 9
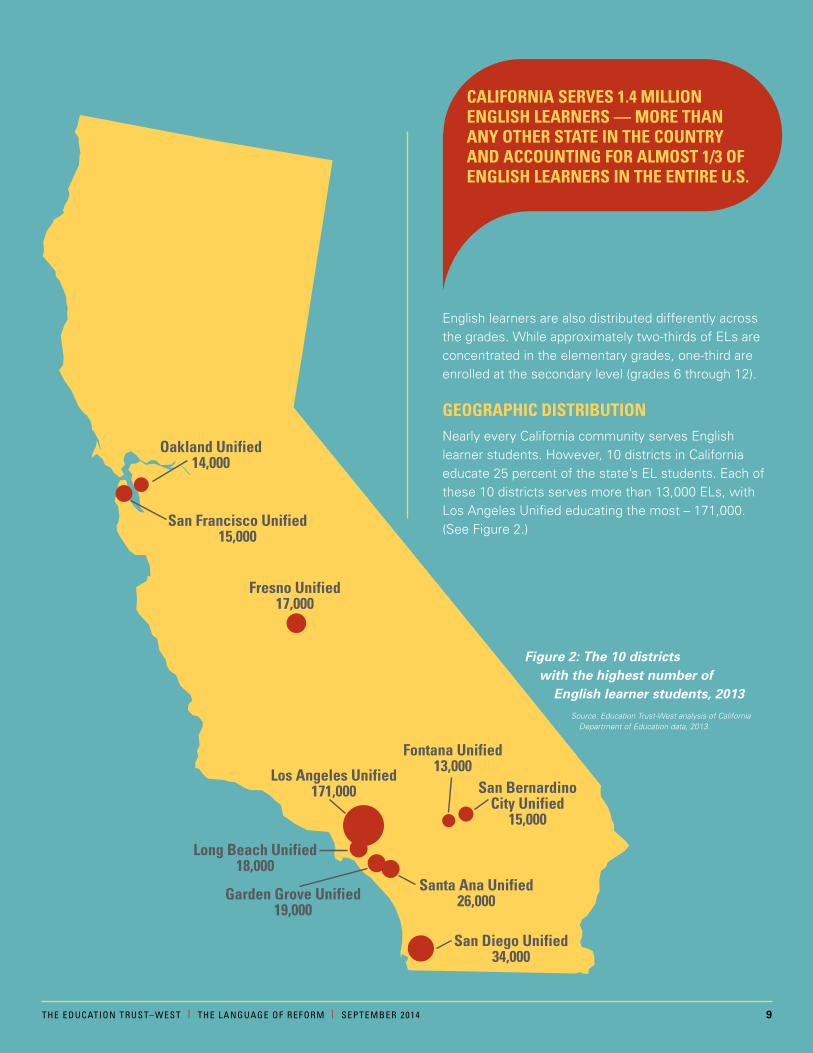
english learners are also distributed differently across the grades. While approximately two-thirds of eLs are concentrated in the elementary grades, one-third are enrolled at the secondary level (grades 6 through 12).
gEograPhic distriBution nearly every California community serves english learner students. however, 10 districts in California educate 25 percent of the state’s eL students. each of these 10 districts serves more than 13,000 eLs, with Los angeles unified educating the most – 171,000. (see figure 2.)
california sErvEs 1.4 million English lEarnErs — morE than any othEr statE in thE country and accounting for almost 1/3 of English lEarnErs in thE EntirE u.s.
Oakland Unified14,000
San Francisco Unified 15,000
Fresno Unified 17,000
Los Angeles Unified 171,000 San Bernardino
City Unified 15,000
Fontana Unified 13,000
Long Beach Unified 18,000
Garden Grove Unified 19,000
Santa Ana Unified 26,000
San Diego Unified 34,000
Figure 2: The 10 districts with the highest number of
English learner students, 2013Source: Education Trust-West analysis of California
Department of Education data, 2013.
10 THE EducaTION TrusT–WEsT | THE LaNguagE Of rEfOrm | sEPTEmbEr 2014
headline
as districts develop Local Control and accountability plans, they are being asked to analyze data in order to understand areas of need and success, set multiyear goals across eight priority areas, and identify the specific programs and services that will help them meet those goals. districts are required to consider english learner-related metrics as part of this process, including progression toward english proficiency and reclassification rates. This creates a fantastic opportunity for districts to reflect upon how well they serve english learners and how they might improve results across a range of indicators.
for our oWn analysis in this rEPort, WE havE usEd thE folloWing four mEasurEs:
proficiency rates on the california Standards test (cSt) english language Arts (elA) exam. Tests like the CsT offer a view into how well students are mastering academic content standards. By looking at the performance of english learners and reclassified students in one aggregated subgroup — which we call “ever-eL” — we can better understand the complicated relationship between reclassification policies and proficiency for these two subgroups of students. see A New Definition: “Ever-English Learner” Students on page 13.
Annual progression on the celDt exam. We examine the percentage of a district’s students who are making annual progress on the five-level CeLdT exam, where level four (early advanced) generally represents english-language proficiency. While the CsT (or a successor exam, like smarter Balanced) can tell us about academic proficiency, the CeLdT provides a view into english language acquisition.14
long-term english learner rates. We draw upon the u.s. department of education’s Title iii accountability data, which tell us how many students have been classified as english learners for five years or more. for purposes of our analysis, we consider those students to be “long-term english learners,” even though the state has a slightly different definition.15 interpreting this data can be tricky, because students may be long-term english learners for one of two primary and very different reasons. some districts design and offer high-quality supports and interventions to english learners over a longer period of time before reclassifying them. other districts, however, offer insufficient services and supports to help students learn english and achieve academic proficiency, resulting in large concentrations of LTeLs.
reclassification rates. We examine three-year average reclassification rates at the elementary, middle, and high school levels. Whether a student gets reclassified depends on both how well that student is acquiring english and on how the district approaches reclassification. That includes what the district’s policies, practices, and attitudes toward reclassification are. for example, some districts have lower reclassification standards and label students as english fluent as quickly as possible, whereas other districts have a higher standard for proficiency and/or prefer to provide english learners with supports for a longer period of time. Reclassification rates should always be considered in combination with other performance outcomes.
1 42
OutcOmes fOr cALifOrniA’s engLish LeArners
THE EducaTION TrusT–WEsT | THE LaNguagE Of rEfOrm | sEPTEmbEr 2014 11
headline
We analyzed district performance across these four indicators, allowing us to identify districts with top outcomes for english learners. in this report, we analyze the data for the 276 unified districts serving at least 100 eL students in 2012-13.16,17
aBout our analysisThe substantial district-to-district variability in english learner outcomes is partly explained by the diversity among english learners themselves. students’ language acquisition and academic needs are influenced by their home language, fluency in that home language, initial english proficiency level at school entry, length of time in u.s. schools, program placement, their family’s socioeconomic background, their family’s immigration status and circumstance, parents’ literacy rates, and a host of family and cultural factors.
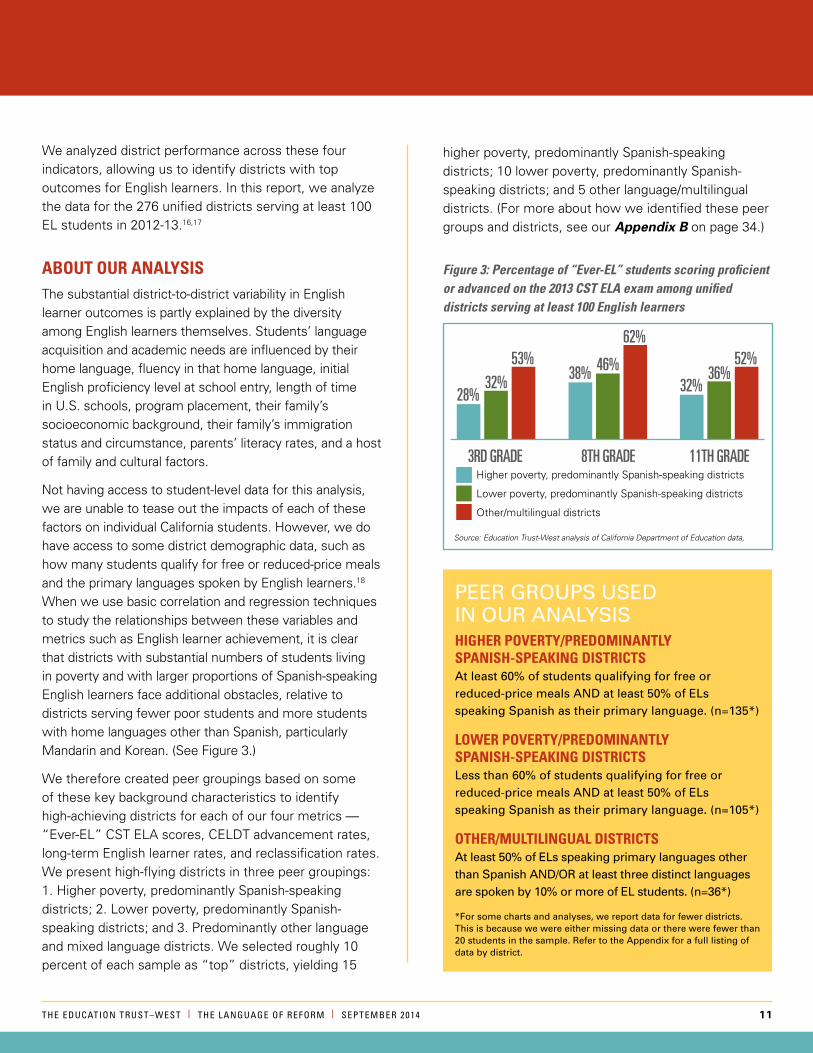
not having access to student-level data for this analysis, we are unable to tease out the impacts of each of these factors on individual California students. however, we do have access to some district demographic data, such as how many students qualify for free or reduced-price meals and the primary languages spoken by english learners.18 When we use basic correlation and regression techniques to study the relationships between these variables and metrics such as english learner achievement, it is clear that districts with substantial numbers of students living in poverty and with larger proportions of spanish-speaking english learners face additional obstacles, relative to districts serving fewer poor students and more students with home languages other than spanish, particularly mandarin and Korean. (see figure 3.)
We therefore created peer groupings based on some of these key background characteristics to identify high-achieving districts for each of our four metrics — “ever-eL” CsT eLa scores, CeLdT advancement rates, long-term english learner rates, and reclassification rates. We present high-flying districts in three peer groupings: 1. higher poverty, predominantly spanish-speaking districts; 2. Lower poverty, predominantly spanish-speaking districts; and 3. predominantly other language and mixed language districts. We selected roughly 10 percent of each sample as “top” districts, yielding 15
Peer grOuPs used in Our AnALysishighEr PovErty/PrEdominantly sPanish-sPEaking districtsAt least 60% of students qualifying for free or reduced-price meals And at least 50% of eLs speaking spanish as their primary language. (n=135*)
loWEr PovErty/PrEdominantly sPanish-sPEaking districts Less than 60% of students qualifying for free or reduced-price meals And at least 50% of eLs speaking spanish as their primary language. (n=105*)
othEr/multilingual districtsAt least 50% of eLs speaking primary languages other than spanish And/Or at least three distinct languages are spoken by 10% or more of eL students. (n=36*)
*for some charts and analyses, we report data for fewer districts. this is because we were either missing data or there were fewer than 20 students in the sample. refer to the Appendix for a full listing of data by district.
higher poverty, predominantly spanish-speaking districts; 10 lower poverty, predominantly spanish-speaking districts; and 5 other language/multilingual districts. (for more about how we identified these peer groups and districts, see our Appendix B on page 34.)
Figure 3: Percentage of “Ever-EL” students scoring proficient or advanced on the 2013 cst ELa exam among unified districts serving at least 100 English learners
28%38%
32%32%46% 36%
53%62%
52%
3rd Gradehigher poverty, predominantly spanish-speaking districts
Lower poverty, predominantly spanish-speaking districts
other/multilingual districts
8th Grade 11th Grade
Source: Education Trust-West analysis of California Department of Education data,
What PErcEntagE of “EvEr-English lEarnEr” studEnts arE ProficiEnt on thE california standards tEst in English languagE arts? We first examine the percentage of “ever-eL” students scoring proficient or advanced on the english Language arts (eLa) portion of the California standards Test (CsT) in third, eighth, and 11th grades. We selected these grades to include a representation of performance at the elementary, middle, and high school levels. Because third grade is the first tested grade, it provides the first measure of early literacy; eighth and 11th grade represent outcomes for the highest tested grade levels in the middle and high school grade spans.
We define “ever-eL” as a subgroup consisting of both eLs and Rfeps. While these groups’ results are typically reported separately, we combined them in this unique analysis for several reasons, as explained in A New Definition: “Ever-English Learner” Students on page 13.
for each of the three district peer groups, we identify the top districts in terms of their “ever-eL” performance in third grade, eighth grade, and 11th grade on the CsT.
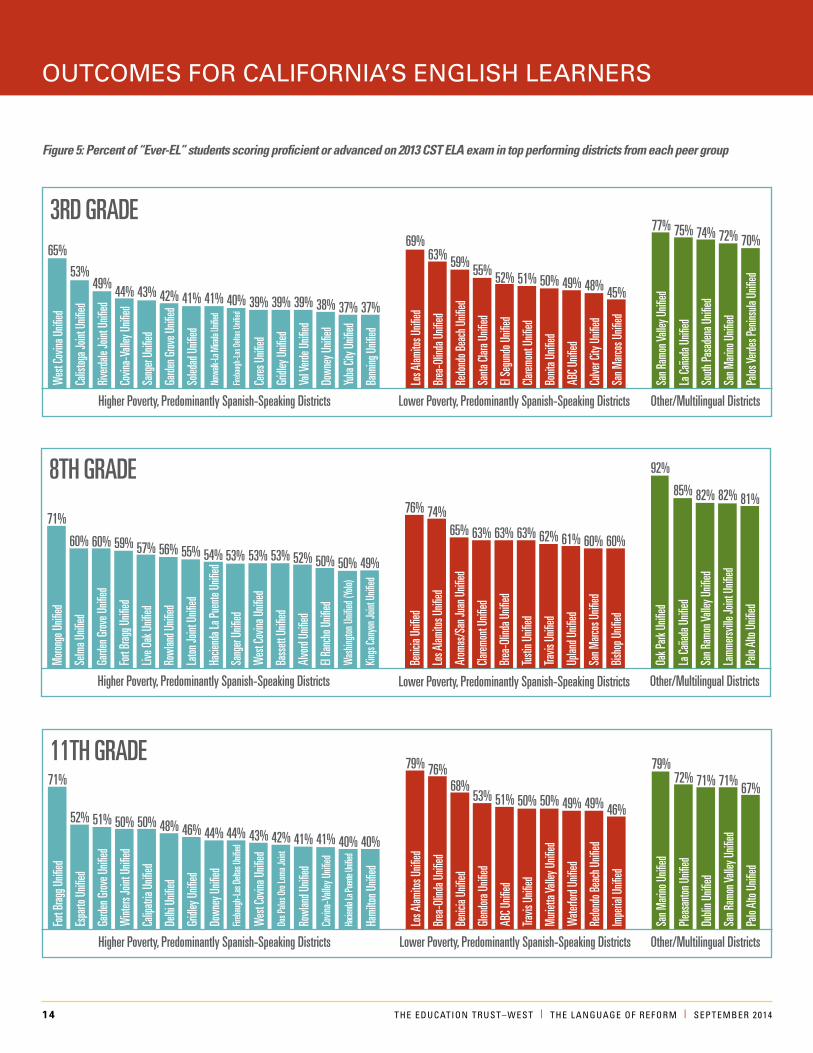
The range in performance among top districts varies significantly across the two predominantly spanish-speaking peer groups. The range of proficiency rates for other/multilingual districts is much narrower. each of the other/multilingual districts posts proficiency rates in the 70 – 77 percent range on the third-grade exam, in the 81 – 92 percent range on the eighth-grade test, and in the 67 – 79 percent range on the 11th-grade exam. performance in the other two peer groups, however, varies considerably from district to district. This variance results in a few outliers. for example, West
12 THE EducaTION TrusT–WEsT | THE LaNguagE Of rEfOrm | sEPTEmbEr 2014
1
OutcOmes fOr cALifOrniA’s engLish LeArners
Covina unified’s third-grade proficiency rate of 65 percent far exceeds the performance of other districts in the higher poverty, predominantly spanish-speaking peer group. and Los alamitos unified stands out at each grade level when compared with other lower poverty, predominantly spanish-speaking districts. its “ever-eL” proficiency rates, which range from 69 percent in third grade to 79 percent in 11th grade, are much higher than most other top districts in that peer grouping.
geographic diversity also varies across the top districts in these peer groupings: the higher poverty, predominantly spanish group contains districts across the entire state, while the other/multilingual peer group has a high concentration of districts in the Los angeles and san francisco Bay areas. (see figure 5.)
To learn more about the work happening in one of the top-performing districts on this indicator, see Promising Practices in Selma Unified School District on page 15.
THE EducaTION TrusT–WEsT | THE LaNguagE Of rEfOrm | sEPTEmbEr 2014 13
our analysis creates a unique subgroup of students we refer to as “ever-eL” that combines both the eL and reclassified (Rfep) student subgroups. in doing so, we build upon the research and recommendations of experts who have suggested this approach.19
first, Rfeps are, by definition, higher performing than their english learner peers. Recent research by the public policy institute of California finds that most districts, following state guidelines, require that students score in the Basic range on the CsT eLa in order to be reclassified, with nearly a third of districts requiring a score of proficient or higher.20
second, the eL and Rfep subgroups are unlike other more fixed subgroups (such as race) in that students may transition from the english learner to the Rfep subgroup. indeed, the expectation is that students are english learners for a limited period of time, after which they move permanently to the Rfep group. These subgroups should be considered together, as students cannot reverse the fact that they were ever english learners in a California school. Looking at this “ever-eL” group allows us to study the performance of a consistent group of students rather than examining the performance of shifting groups that are defined by their performance.
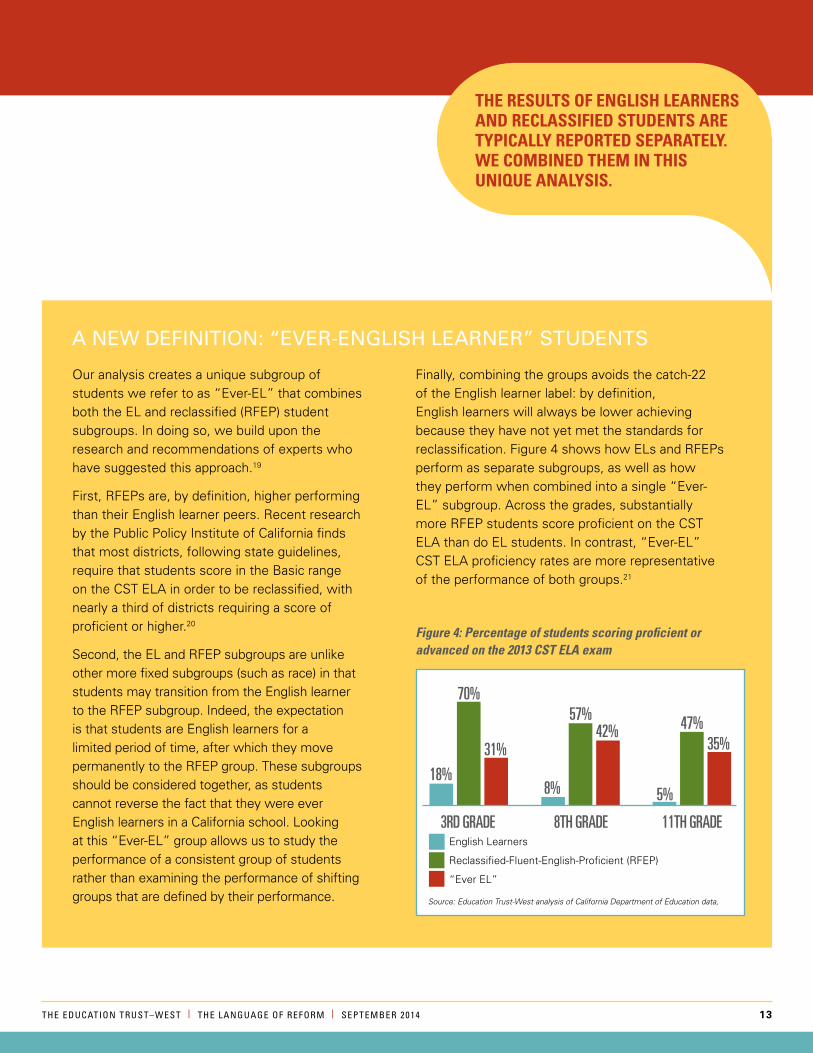
finally, combining the groups avoids the catch-22 of the english learner label: by definition, english learners will always be lower achieving because they have not yet met the standards for reclassification. figure 4 shows how eLs and Rfeps perform as separate subgroups, as well as how they perform when combined into a single “ever-eL” subgroup. across the grades, substantially more Rfep students score proficient on the CsT eLa than do eL students. in contrast, “ever-eL” CsT eLa proficiency rates are more representative of the performance of both groups.21
A new definitiOn: “ever-engLish LeArner” students
thE rEsults of English lEarnErs and rEclassifiEd studEnts arE tyPically rEPortEd sEParatEly. WE comBinEd thEm in this uniquE analysis.
18%8% 5%
70%57% 47%
31%42%
35%
3rd Gradeenglish Learners
Reclassified-fluent-english-proficient (Rfep)
“ever eL”
8th Grade 11th Grade
Figure 4: Percentage of students scoring proficient or advanced on the 2013 cst ELa exam
Source: Education Trust-West analysis of California Department of Education data,
14 THE EducaTION TrusT–WEsT | THE LaNguagE Of rEfOrm | sEPTEmbEr 2014
Figure 5: Percent of “Ever-EL” students scoring proficient or advanced on 2013 cst ELa exam in top performing districts from each peer group
Wes
t Cov
ina U
nified
65%Fir
ebau
gh-L
as d
eltas
Unifi
ed
40%
Culve
r City
Unifi
ed
48%
Sang
er Un
ified
43%
el Se
gund
o Unifi
ed
52%
down
ey U
nified
38%
La Ca
ñada
Unifi
ed
75%
riverd
ale Jo
int U
nified
49%
redo
ndo B
each
Unifi
ed
59%Gr
idley
Unifi
ed
39%
Soled
ad U
nified
41%
Bonit
a Unifi
ed
50%
Bann
ing U
nified
37%
San M
arino
Unifi
ed
72%
Calis
toga J
oint U
nified
53%
Brea
-Olin
da U
nified
63%Ce
res U
nified
39%
San M
arcos
Unifi
ed
45%
Garde
n Grov
e Unifi
ed
42%
Clarem
ont U
nified
51%
Yuba
City
Unifie
d
37%
South
Pasa
dena
Unifi
ed
74%
Covin
a-Va
lley U
nified
44%
Santa
Clara
Unifi
ed
55%
Val V
erde U
nified
39%
San r
amon
Valle
y Unifi
ed
77%No
rwalk
-La M
irada
Unifie
d
41%
aBC U
nified
49%
Los a
lamito
s Unifi
ed
69%
Palos
Verde
s Pen
insula
Unifi
ed
70%
higher Poverty, Predominantly Spanish-Speaking districts Lower Poverty, Predominantly Spanish-Speaking districts Other/Multilingual districts
3rd Grade
Moro
ngo U
nified
71%
Sang
er Un
ified
53%
San M
arcos
Unifi
ed
60%
Live O
ak U
nified
57%
Brea
-Olin
da U
nified
63%
el ra
ncho
Unifi
ed
50%
La Ca
ñada
Unifi
ed
85%
Garde
n Grov
e Unifi
ed
60%
arom
as/S
an Ju
an U
nified
65%
Bass
ett U
nified
53%
Laton
Joint
Unifi
ed
55%tra
vis U
nified
62%
King
s Can
yon J
oint U
nified
49%
Lamm
ersvil
le Jo
int U
nified
82%
Selm
a Unifi
ed
60%
Los a
lamito
s Unifi
ed
74%
Wes
t Cov
ina U
nified
53%
Bisho
p Unifi
ed
60%
rowl
and U
nified
56%
tusti
n Unifi
ed63%
Was
hingto
n Unifi
ed (Y
olo)
50%
San r
amon
Valle
y Unifi
ed
82%
Fort
Brag
g Unifi
ed
59%
Clarem
ont U
nified
63%
alvo
rd Un
ified
52%
Oak P
ark U
nified
92%
hacie
nda L
a Pue
nte U
nified
54%Up
land U
nified
61%
Benic
ia Un
ified
76%
Palo
alto
Unifie
d
81%
higher Poverty, Predominantly Spanish-Speaking districts Other/Multilingual districts
8th Grade
Fort
Brag
g Unifi
ed
71%
Fireb
augh
-Las
delt
as U
nified
44%
redo
ndo B
each
Unifi
ed
49%
Calip
atria
Unifie
d
50%
aBC U
nified
51%
Covin
a-Va
lley U
nified
41%
Pleas
anton
Unifi
ed
72%79%
Garde
n Grov
e Unifi
ed
51%
Benic
ia Un
ified
68%
dos P
alos O
ro Lo
ma Jo
int
42%
Gridl
ey U
nified
46%
Muri
etta V
alley
Unifi
ed
50%
hami
lton U
nified
40%
San r
amon
Valle
y Unifi
ed
71%
espa
rto U
nified
52%
Brea
-Olin
da U
nified
76%
Wes
t Cov
ina U
nified
43%
Impe
rial U
nified
46%
delhi
Unifi
ed
48%
travis
Unifi
ed
50%
hacie
nda L
a Pue
nte Un
ified
40%
dubli
n Unifi
ed
71%
Wint
ers Jo
int U
nified
50%
Glen
dora
Unifie
d
53%
rowl
and U
nified
41%
San M
arino
Unifi
ed
down
ey U
nified
44%
Wate
rford
Unifie
d
49%
Los a
lamito
s Unifi
ed
79%Pa
lo al
to Un
ified
67%
higher Poverty, Predominantly Spanish-Speaking districts Lower Poverty, Predominantly Spanish-Speaking districts Other/Multilingual districts
11th Grade
OutcOmes fOr cALifOrniA’s engLish LeArners
Lower Poverty, Predominantly Spanish-Speaking districts
THE EducaTION TrusT–WEsT | THE LaNguagE Of rEfOrm | sEPTEmbEr 2014 15
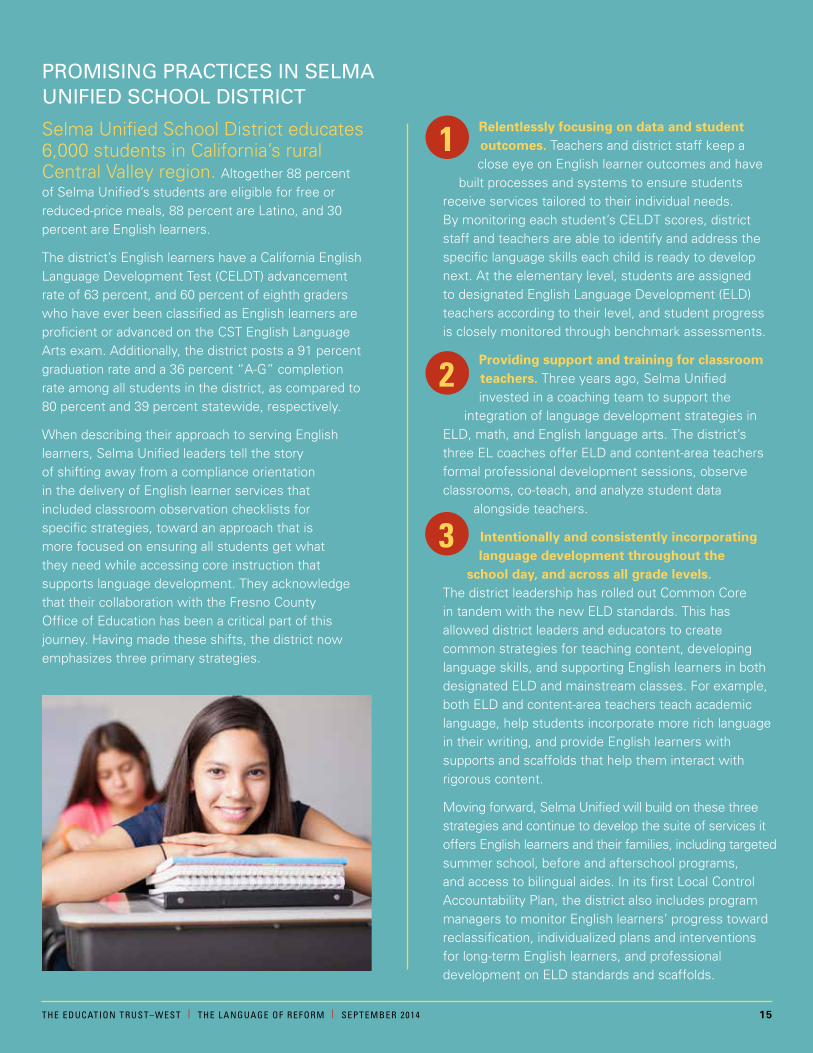
selma unified school district educates 6,000 students in California’s rural Central Valley region. altogether 88 percent of selma unified’s students are eligible for free or reduced-price meals, 88 percent are Latino, and 30 percent are english learners.
The district’s english learners have a California english Language development Test (CeLdT) advancement rate of 63 percent, and 60 percent of eighth graders who have ever been classified as english learners are proficient or advanced on the CsT english Language arts exam. additionally, the district posts a 91 percent graduation rate and a 36 percent “a-g” completion rate among all students in the district, as compared to 80 percent and 39 percent statewide, respectively.
When describing their approach to serving english learners, selma unified leaders tell the story of shifting away from a compliance orientation in the delivery of english learner services that included classroom observation checklists for specific strategies, toward an approach that is more focused on ensuring all students get what they need while accessing core instruction that supports language development. They acknowledge that their collaboration with the fresno County office of education has been a critical part of this journey. having made these shifts, the district now emphasizes three primary strategies.
relentlessly focusing on data and student outcomes. Teachers and district staff keep a close eye on english learner outcomes and have
built processes and systems to ensure students receive services tailored to their individual needs. By monitoring each student’s CeLdT scores, district staff and teachers are able to identify and address the specific language skills each child is ready to develop next. at the elementary level, students are assigned to designated english Language development (eLd) teachers according to their level, and student progress is closely monitored through benchmark assessments.
providing support and training for classroom teachers. Three years ago, selma unified invested in a coaching team to support the
integration of language development strategies in eLd, math, and english language arts. The district’s three eL coaches offer eLd and content-area teachers formal professional development sessions, observe classrooms, co-teach, and analyze student data
alongside teachers.
intentionally and consistently incorporating language development throughout the
school day, and across all grade levels. The district leadership has rolled out Common Core in tandem with the new eLd standards. This has allowed district leaders and educators to create common strategies for teaching content, developing language skills, and supporting english learners in both designated eLd and mainstream classes. for example, both eLd and content-area teachers teach academic language, help students incorporate more rich language in their writing, and provide english learners with supports and scaffolds that help them interact with rigorous content.
moving forward, selma unified will build on these three strategies and continue to develop the suite of services it offers english learners and their families, including targeted summer school, before and afterschool programs, and access to bilingual aides. in its first Local Control accountability plan, the district also includes program managers to monitor english learners’ progress toward reclassification, individualized plans and interventions for long-term english learners, and professional development on eLd standards and scaffolds.
PrOmising PrActices in seLmA unified schOOL district
1
2
3
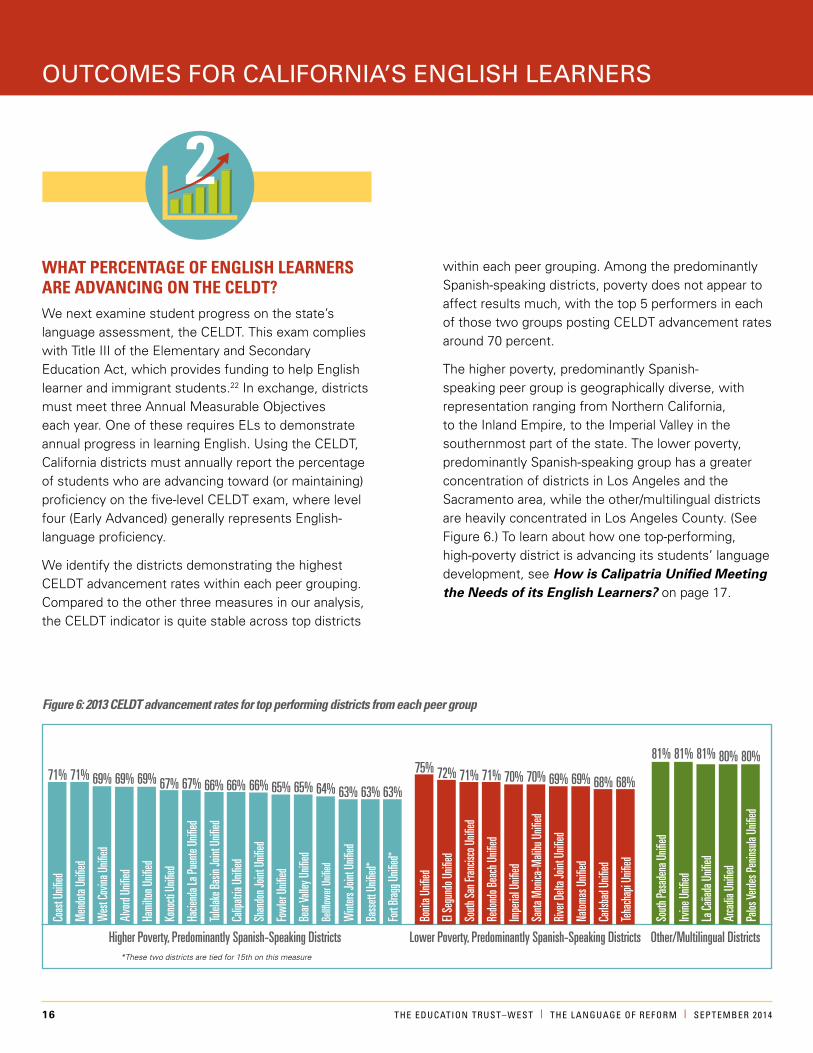
What PErcEntagE of English lEarnErs arE advancing on thE cEldt?We next examine student progress on the state’s language assessment, the CeLdT. This exam complies with Title iii of the elementary and secondary education act, which provides funding to help english learner and immigrant students.22 in exchange, districts must meet three annual measurable objectives each year. one of these requires eLs to demonstrate annual progress in learning english. using the CeLdT, California districts must annually report the percentage of students who are advancing toward (or maintaining) proficiency on the five-level CeLdT exam, where level four (early advanced) generally represents english-language proficiency.
We identify the districts demonstrating the highest CeLdT advancement rates within each peer grouping. Compared to the other three measures in our analysis, the CeLdT indicator is quite stable across top districts
16 THE EducaTION TrusT–WEsT | THE LaNguagE Of rEfOrm | sEPTEmbEr 2014
2within each peer grouping. among the predominantly spanish-speaking districts, poverty does not appear to affect results much, with the top 5 performers in each of those two groups posting CeLdT advancement rates around 70 percent.
The higher poverty, predominantly spanish-speaking peer group is geographically diverse, with representation ranging from northern California, to the inland empire, to the imperial Valley in the southernmost part of the state. The lower poverty, predominantly spanish-speaking group has a greater concentration of districts in Los angeles and the sacramento area, while the other/multilingual districts are heavily concentrated in Los angeles County. (see figure 6.) To learn about how one top-performing, high-poverty district is advancing its students’ language development, see How is Calipatria Unified Meeting the Needs of its English Learners? on page 17.
Coas
t Unifi
ed
71%
Calip
atria
Unifie
d
66%
Carls
bad U
nified
68%
hami
lton U
nified
69%
Impe
rial U
nified
70%
Bellfl
ower
Unifie
d
64%
Irvine
Unifi
ed
81%81%
Wes
t Cov
ina U
nified
69%
South
San F
rancis
co U
nified
71%
Fowl
er Un
ified
65%
hacie
nda L
a Pue
nte U
nified
67%
river
delta
Joint
Unifi
ed
69%
Bass
ett U
nified
*
Fort
Brag
g Unifi
ed*
63% 63%
arca
dia U
nified
80%
Men
dota
Unifie
d
71%
el Se
gund
o Unifi
ed
72%
Shan
don J
oint U
nified
66%
teha
chap
i Unifi
ed
68%
Kono
cti U
nified
67%
Santa
Mon
ica-M
alibu
Unifi
ed
70%
Wint
ers Jo
int U
nified
63%
La Ca
ñada
Unifi
ed
81%
alvo
rd Un
ified
69%
redo
ndo B
each
Unifi
ed
71%
Bear
Valle
y Unifi
ed
65%
South
Pasa
dena
Unifi
ed
tulel
ake B
asin
Joint
Unifi
ed
66%
Natom
as U
nified
69%
Bonit
a Unifi
ed
75%Pa
los Ve
rdes P
enins
ula U
nified
80%
higher Poverty, Predominantly Spanish-Speaking districts Lower Poverty, Predominantly Spanish-Speaking districts Other/Multilingual districts
Figure 6: 2013 cELDt advancement rates for top performing districts from each peer group
OutcOmes fOr cALifOrniA’s engLish LeArners
*These two districts are tied for 15th on this measure

Calipatria unified school district serves a rural, agricultural community in the southern California desert, about 34 miles from the California-mexico border. The district’s four schools educate approximately 1,200 students, 87 percent of whom are Latino, and more than 80 percent of whom are eligible for free or reduced-price meals. of these students, 35 percent are english learners, and nearly all speak spanish as their native language. The majority of english learners in Calipatria are second-generation, dual-language speakers who are fluent in spanish and possess varying levels of english fluency. There are a growing number of newcomer students in the district who speak exclusively spanish, but this population remains relatively small.
To advance their students’ english language acquisition, Calipatria leaders have invested in 1) an integrated academic program with carefully targeted supports, 2) close monitoring of data and academic outcomes, and 3) family engagement. each of these is discussed in the column on the right.
integration into core academic classes with targeted support. Calipatria unified is committed to maintaining small class sizes at
each grade level and ensuring english learners have access to a rigorous core curriculum. at the elementary level, most english learners are integrated into regular classrooms, with only those students requiring additional interventions receiving limited pullout for targeted english instruction. at the secondary level, eLs are enrolled in core academic courses in addition to a targeted english Language development (eLd) course. To support this model, all teachers in the district are trained in eLd strategies, and there is a districtwide focus on common reading and writing strategies that support students’ development of phonics and academic vocabulary.
emphasis on high levels of achievement. educators at every grade level are focused on student data and outcomes. Teachers are
expected to monitor all their english learners and reclassified students and maintain a keen awareness of their ongoing needs. This has allowed students to thrive academically both pre and post-reclassification.
english learner family engagement. Teachers and district leaders are committed to informing and engaging families of english learners. as
one district leader shared, “We want parents to feel welcome; we want them to feel heard.” When developing its Local Control and accountability plan, the district listened carefully to the requests of english learner parents and included more afterschool programs and instructional aides in classrooms. Calipatria unified is also funding a strategic academic vocabulary development initiative and is targeting beginning teachers for english learner-related professional development activities.
already teaching Common Core in kindergarten through fourth grade, the district will make the full districtwide transition to Common Core in 2014-15 and will build out additional services for its growing newcomer population. To support this work, the district has partnered with the imperial County office of education to provide professional development for teachers on the new standards, with a specific focus on strategies for accelerating reading and writing skills.
hOw is cALiPAtriA unified meeting the needs Of its engLish LeArners?
1
2
3
THE EducaTION TrusT–WEsT | THE LaNguagE Of rEfOrm | sEPTEmbEr 2014 17
OutcOmes fOr cALifOrniA’s engLish LeArners
What PErcEntagE of studEnts arE long-tErm English lEarnErs? english learner students who are not reclassified within five to six years may be denied access to rigorous college-preparatory courses, even if they are ready for increased academic challenges in school. in addition to district policies that may preclude access to core courses for eL students, districts may not always provide the services long-term english learners need to advance their linguistic and academic skills, or they may be inappropriately placed in intervention classes that fail to address their needs.23 some researchers and educators believe english learners should maintain english learner status for a longer period of time in order to receive language services and supports. others would prefer to see eLs reclassified as quickly as possible so they can more easily access mainstream curriculum and instruction, and to ensure that obstructive district policies and inappropriate placements do not prevent access to quality educational opportunities.
To be sure, long-term english learner (LTeL) rates are also a reflection of district reclassification policies: in districts with lower or fewer reclassification criteria,
18 THE EducaTION TrusT–WEsT | THE LaNguagE Of rEfOrm | sEPTEmbEr 2014
reclassification rates may be higher than in districts with more rigorous policies.24 and reclassification itself does not always lead to positive outcomes.25 Whatever the ideal timeline and reclassification policy, LTeL rates deserve attention because long-term classification can, in some cases, create barriers to opportunity.
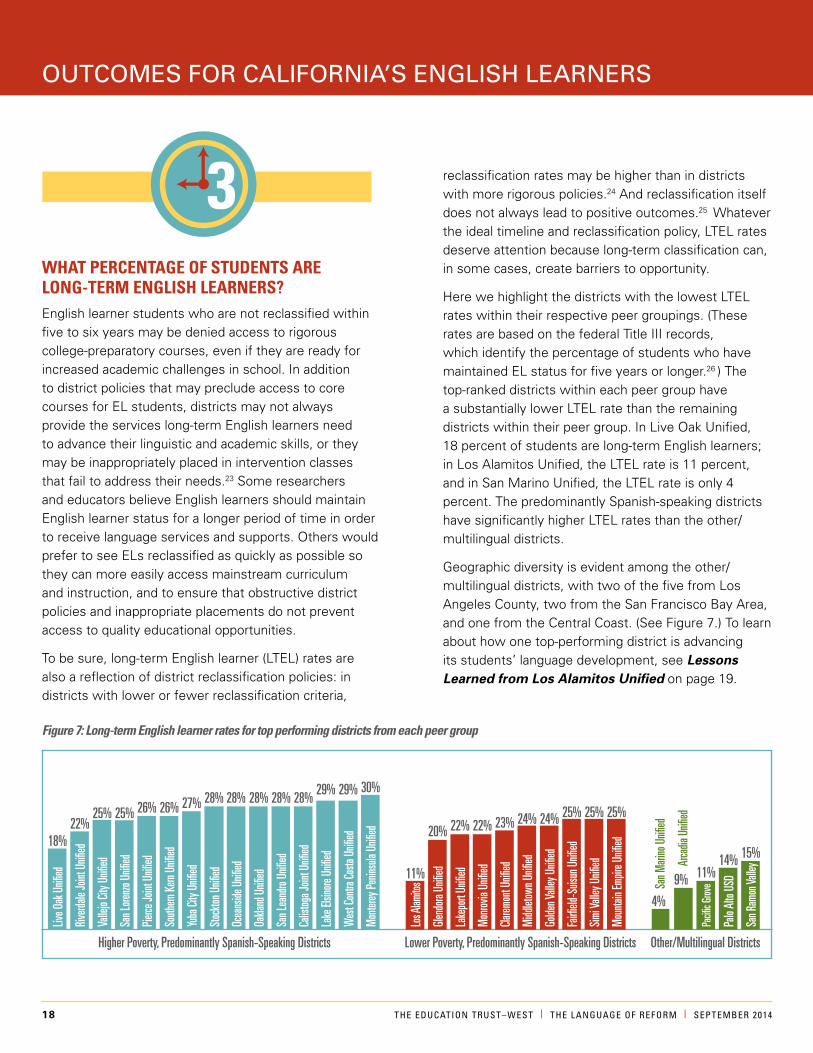
here we highlight the districts with the lowest LTeL rates within their respective peer groupings. (These rates are based on the federal Title iii records, which identify the percentage of students who have maintained eL status for five years or longer.26 ) The top-ranked districts within each peer group have a substantially lower LTeL rate than the remaining districts within their peer group. in Live oak unified, 18 percent of students are long-term english learners; in Los alamitos unified, the LTeL rate is 11 percent, and in san marino unified, the LTeL rate is only 4 percent. The predominantly spanish-speaking districts have significantly higher LTeL rates than the other/multilingual districts.
geographic diversity is evident among the other/multilingual districts, with two of the five from Los angeles County, two from the san francisco Bay area, and one from the Central Coast. (see figure 7.) To learn about how one top-performing district is advancing its students’ language development, see Lessons Learned from Los Alamitos Unified on page 19.
Figure 7: Long-term English learner rates for top performing districts from each peer group
Live O
ak U
nified
18%
Ocea
nside
Unifi
ed
28%
Simi V
alley
Unifi
ed
25%
Pierce
Joint
Unifi
ed
26%
Clarem
ont U
nified
23%
Lake
elsin
ore U
nified
29%
9%
4%
Valle
jo Cit
y Unifi
ed
25%
Lake
port
Unifie
d
22%
San L
eand
ro Un
ified
28%
Yuba
City
Unifie
d
27%
Golde
n Vall
ey U
nified
24%
Mon
terey
Penin
sula
Unifie
d
30%
Palo
alto
USd
14%
riverd
ale Jo
int U
nified
22%
Glen
dora
Unifie
d
20%
Oakla
nd U
nified
28%
Mou
ntain
empir
e Unifi
ed
25%
South
ern K
ern U
nified
26%
Midd
letow
n Unifi
ed
24%
Wes
t Con
tra Co
sta U
nified
29%
Pacifi
c Grov
e
11%
San L
orenz
o Unifi
ed
25%
Mon
rovia
Unifie
d
22%
Calis
toga J
oint U
nified
28%
Stoc
kton U
nified
28%
Fairfi
eld-S
uisun
Unifi
ed
25%
Los a
lamito
s
11%
San r
amon
Valle
y
15%
higher Poverty, Predominantly Spanish-Speaking districts Lower Poverty, Predominantly Spanish-Speaking districts Other/Multilingual districts
San M
arino
Unifi
ed
arca
dia U
nified
OutcOmes fOr cALifOrniA’s engLish LeArners
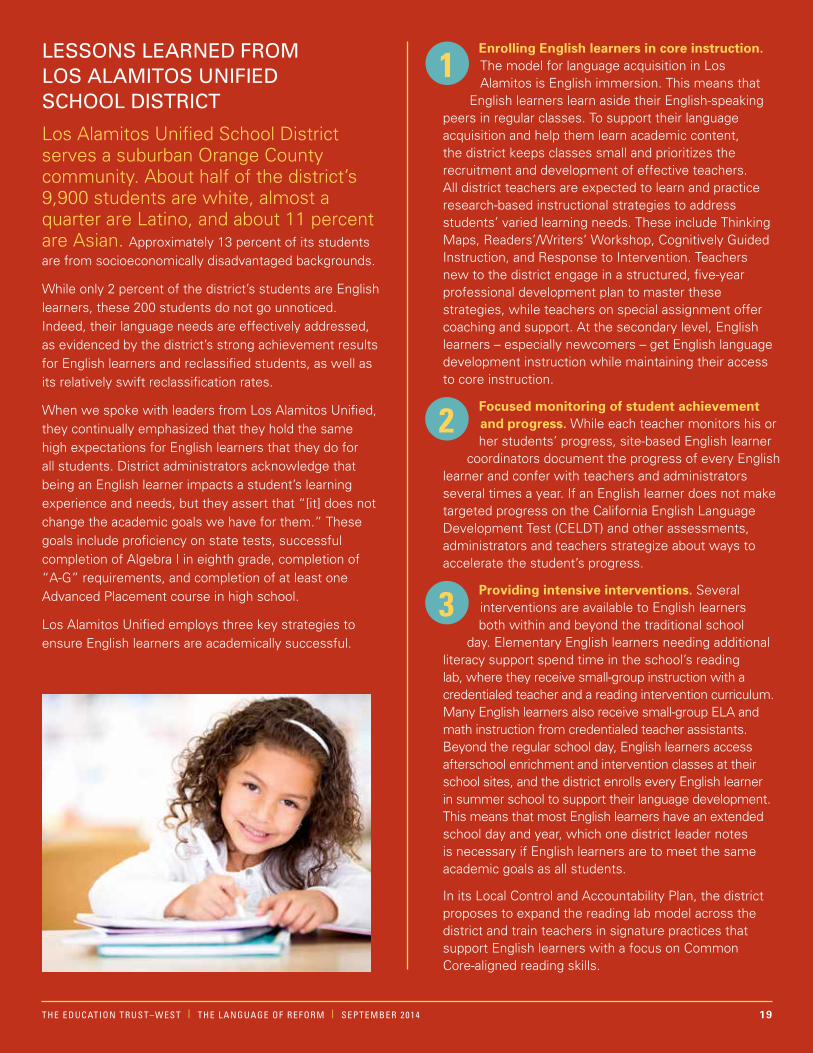
Los alamitos unified school district serves a suburban orange County community. about half of the district’s 9,900 students are white, almost a quarter are Latino, and about 11 percent are asian. approximately 13 percent of its students are from socioeconomically disadvantaged backgrounds.
While only 2 percent of the district’s students are english learners, these 200 students do not go unnoticed. indeed, their language needs are effectively addressed, as evidenced by the district’s strong achievement results for english learners and reclassified students, as well as its relatively swift reclassification rates.
When we spoke with leaders from Los alamitos unified, they continually emphasized that they hold the same high expectations for english learners that they do for all students. district administrators acknowledge that being an english learner impacts a student’s learning experience and needs, but they assert that “[it] does not change the academic goals we have for them.” These goals include proficiency on state tests, successful completion of algebra i in eighth grade, completion of “a-g” requirements, and completion of at least one advanced placement course in high school.
Los alamitos unified employs three key strategies to ensure english learners are academically successful.
enrolling english learners in core instruction. The model for language acquisition in Los alamitos is english immersion. This means that
english learners learn aside their english-speaking peers in regular classes. To support their language acquisition and help them learn academic content, the district keeps classes small and prioritizes the recruitment and development of effective teachers. all district teachers are expected to learn and practice research-based instructional strategies to address students’ varied learning needs. These include Thinking maps, Readers’/Writers’ Workshop, Cognitively guided instruction, and Response to intervention. Teachers new to the district engage in a structured, five-year professional development plan to master these strategies, while teachers on special assignment offer coaching and support. at the secondary level, english learners – especially newcomers – get english language development instruction while maintaining their access to core instruction.
Focused monitoring of student achievement and progress. While each teacher monitors his or her students’ progress, site-based english learner
coordinators document the progress of every english learner and confer with teachers and administrators several times a year. if an english learner does not make targeted progress on the California english Language development Test (CeLdT) and other assessments, administrators and teachers strategize about ways to accelerate the student’s progress.
providing intensive interventions. several interventions are available to english learners both within and beyond the traditional school
day. elementary english learners needing additional literacy support spend time in the school’s reading lab, where they receive small-group instruction with a credentialed teacher and a reading intervention curriculum. many english learners also receive small-group eLa and math instruction from credentialed teacher assistants. Beyond the regular school day, english learners access afterschool enrichment and intervention classes at their school sites, and the district enrolls every english learner in summer school to support their language development. This means that most english learners have an extended school day and year, which one district leader notes is necessary if english learners are to meet the same academic goals as all students.
in its Local Control and accountability plan, the district proposes to expand the reading lab model across the district and train teachers in signature practices that support english learners with a focus on Common Core-aligned reading skills.
LessOns LeArned frOm LOs ALAmitOs unified schOOL district
1
2
3
THE EducaTION TrusT–WEsT | THE LaNguagE Of rEfOrm | sEPTEmbEr 2014 19
OutcOmes fOr cALifOrniA’s engLish LeArners
What PErcEntagE of studEnts arE rEclassifiEd as English ProficiEnt Each yEar? Reclassification practices and policies vary considerably from district to district. for instance, as a recent public policy institute of California report outlines, some districts require that students demonstrate mastery in academic content areas beyond english language arts, such as math, in order to be reclassified. and some districts ask teachers to evaluate subjective dimensions such as student behavior and participation in class.27 a district’s low reclassification rate may mean that few students are acquiring english, or it may mean that the district has stringent reclassification standards. These higher standards may — or may not — be accompanied by strong instructional supports that lead to positive long-term language development and academic outcomes for “ever-eL” students.28 so we are left to question: do reclassification rates mostly measure the progress a district is making to help eLs acquire english proficiency, or do they mostly measure the reclassification policy itself?
There are competing theories about the importance of timing for reclassification. some educators and policymakers push for reclassification to occur as early as possible in a student’s academic career, believing that without the eL label, students are more likely to access rigorous courses and instruction. others support the notion that higher reclassification standards – especially in conjunction with high-quality supports for eLs in both eLd and core courses and district policies that allow eLs to access rigorous courses regardless of the eL designation – lead to better long-term outcomes for “ever-eL” students. english learner program placement may also affect timing to reclassification.
at The education Trust–West, we believe that all students, regardless of language status, should
OutcOmes fOr cALifOrniA’s engLish LeArners
20 THE EducaTION TrusT–WEsT | THE LaNguagE Of rEfOrm | sEPTEmbEr 2014
have access to rigorous coursework and high-quality instruction. many districts do this. however, the reality is that some districts exclude eLs from certain courses or offer insufficient academic and language supports to eLs. Reclassification alone won’t solve this problem. until this is changed, a student’s opportunities in these districts may hinge, in part, on rapid reclassification.
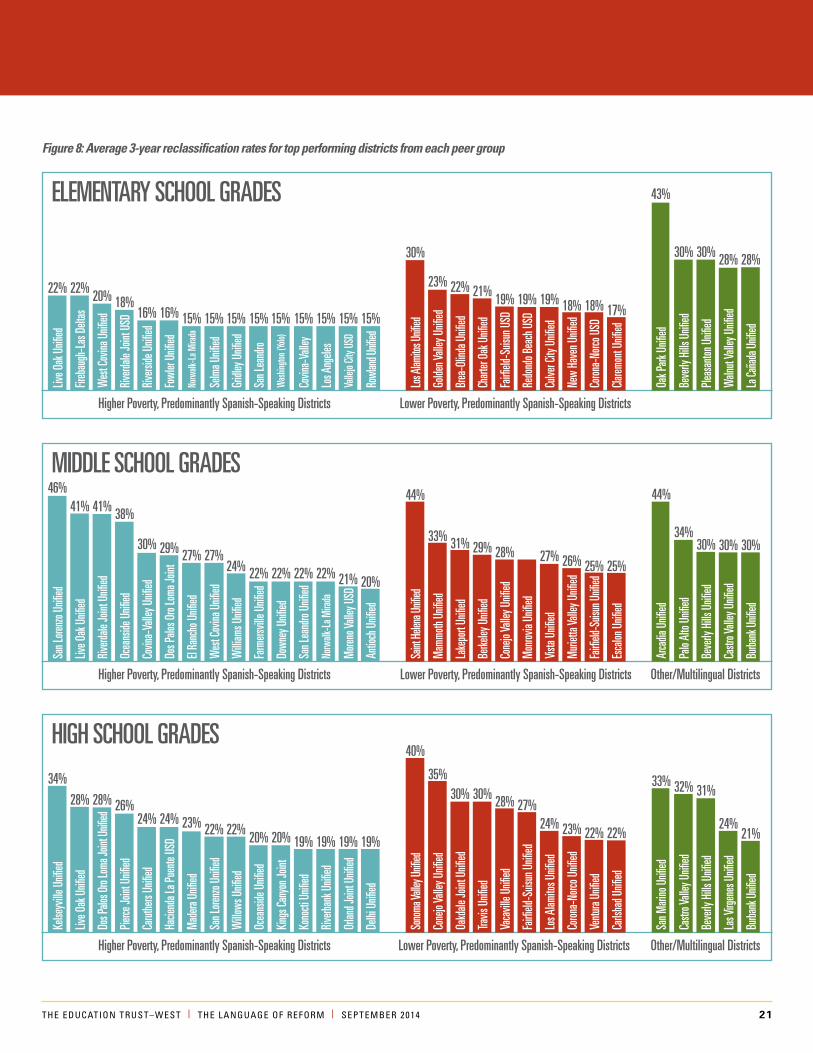
our analysis focuses on the three-year average reclassification rates because year-to-year variation is a reality for many districts, attributable in part to local revisions to reclassification policies. (Learn more about San Francisco Unified’s decision to revise its reclassification policies on page 22.) We also analyze reclassification rates for different grade spans, given that districts’ reclassification rates often vary across grades, with an average reclassification rate masking such variation.
a number of districts appear at the top for more than one grade span. (see figure 8.) This includes nine districts in the higher poverty, predominantly spanish-speaking group, four districts in the lower poverty, predominantly spanish-speaking group, and three districts in the other/multilingual group. The top predominantly spanish-speaking districts tend to post higher reclassification rates in the middle and high school grades than in the elementary grades. This may be an instance where language, immigration, and cultural factors play a role, with those factors — in combination with district policies — affecting the speed at which students are able to acquire language proficiency.
among the predominantly spanish-speaking districts, particularly the higher poverty ones, top-performing districts reclassify roughly 15 percent of their elementary students each year, with the very top-performing districts in the 20 percent range. Reclassification rates become much more variable at the middle and high school levels, though, with some districts reclassifying students much more quickly in these grades, while other districts maintain the same rates as at the elementary level. This variability is no doubt due to a host of factors, including but not limited to the age at which students enter the district and the consistency (or not) of language services and supports across school sites and grade spans.
4
OutcOmes fOr cALifOrniA’s engLish LeArners
THE EducaTION TrusT–WEsT | THE LaNguagE Of rEfOrm | sEPTEmbEr 2014 21
Figure 8: average 3-year reclassification rates for top performing districts from each peer group
Live O
ak U
nified
22%
Gridl
ey U
nified
15%
Coron
a-No
rco U
Sd
18%
rivers
ide U
nified
16%
Fairfi
eld-S
uisun
USd
19%
Valle
jo Cit
y USd
15%
Beve
rly h
ills U
nified
30%
43%
Wes
t Cov
ina U
nified
20%
Brea
-Olin
da U
nified
22%Co
vina-
Valle
y
Was
hingto
n (Yo
lo)
15%15%
Norw
alk-L
a Mira
da
15%
Culve
r City
Unifi
ed
19%
Waln
ut Va
lley U
nified
28%
Fireb
augh
-Las
delt
as
22%
Golde
n Vall
ey U
nified
23%
San L
eand
ro
15%
Clarem
ont U
nified
17%
Fowl
er Un
ified
16%
redo
ndo B
each
USd
19%
rowl
and U
nified
15%
Pleas
anton
Unifi
ed
30%
riverd
ale Jo
int U
Sd
18%
Chart
er Oa
k Unifi
ed
21%
Los a
ngele
s15%
Oak P
ark U
nified
Selm
a Unifi
ed
15%
New
have
n Unifi
ed
18%
Los a
lamito
s Unifi
ed
30%
La Ca
ñada
Unifi
ed
28%
higher Poverty, Predominantly Spanish-Speaking districts Lower Poverty, Predominantly Spanish-Speaking districts
eLeMeNtarY SChOOL GradeS
San L
orenz
o Unifi
ed
46%
Willi
ams U
nified
24%
Fairfi
eld-S
uisun
Unifi
ed
25%
Covin
a-Va
lley U
nified
30%
Cone
jo Va
lley U
nified
28%
Norw
alk-L
a Mira
da
22%
Palo
alto
Unifie
d
34%
44%
riverd
ale Jo
int U
nified
41%
Lake
port
Unifie
d
31%
down
ey U
nified
22%
el ra
ncho
Unifi
ed
27%Vis
ta Un
ified
27%
antio
ch U
nified
20%
Castr
o Vall
ey U
nified
30%
Live O
ak U
nified
41%
Mam
moth
Unifie
d
33%
Farm
ersvil
le Un
ified
22%
esca
lon U
nified
25%
dos P
alos O
ro Lo
ma Jo
int
29%
Mon
rovia
Unifie
d
More
no Va
lley U
Sd
21%
Beve
rly h
ills U
nified
30%
Ocea
nside
Unifi
ed
38%
Berke
ley U
nified
29%
San L
eand
ro Un
ified
22%
arca
dia U
nified
Wes
t Cov
ina U
nified
27%M
uriett
a Vall
ey U
nified
26%
Saint
helen
a Unifi
ed
44%
Burba
nk U
nified
30%
higher Poverty, Predominantly Spanish-Speaking districts Lower Poverty, Predominantly Spanish-Speaking districts Other/Multilingual districts
MIddLe SChOOL GradeS
Kelse
yville
Unifi
ed
34%
Willo
ws U
nified
22%
Ventu
ra Un
ified
22%
Carut
hers
Unifie
d
24%
Vaca
ville
Unifie
d
28%
riverb
ank U
nified
19%
Castr
o Vall
ey U
nified
32%33%
dos P
alos O
ro Lo
ma Jo
int U
nified
28%
Oakd
ale Jo
int U
nified
30%
King
s Can
yon J
oint
20%
Mad
era U
nified
23%
Los a
lamito
s Unifi
ed
24%
delhi
Unifi
ed
19%
Las V
irgen
es U
nified
24%
Live O
ak U
nified
28%
Cone
jo Va
lley U
nified
35%
Ocea
nside
Unifi
ed
20%
Carls
bad U
nified
22%
hacie
nda L
a Pue
nte U
Sd
24%
Fairfi
eld-S
uisun
Unifi
ed
27%
Orlan
d Join
t Unifi
ed
19%
Beve
rly h
ills U
nified
31%
Pierce
Joint
Unifi
ed
26%
travis
Unifi
ed
30%
Kono
cti U
nified
19%
San M
arino
Unifi
ed
San L
orenz
o Unifi
ed
22%
Coron
a-No
rco U
nified
23%
Sono
ma Va
lley U
nified
40%Bu
rbank
Unifi
ed
21%
higher Poverty, Predominantly Spanish-Speaking districts Lower Poverty, Predominantly Spanish-Speaking districts Other/Multilingual districts
hIGh SChOOL GradeS
22 THE EducaTION TrusT–WEsT | THE LaNguagE Of rEfOrm | sEPTEmbEr 2014
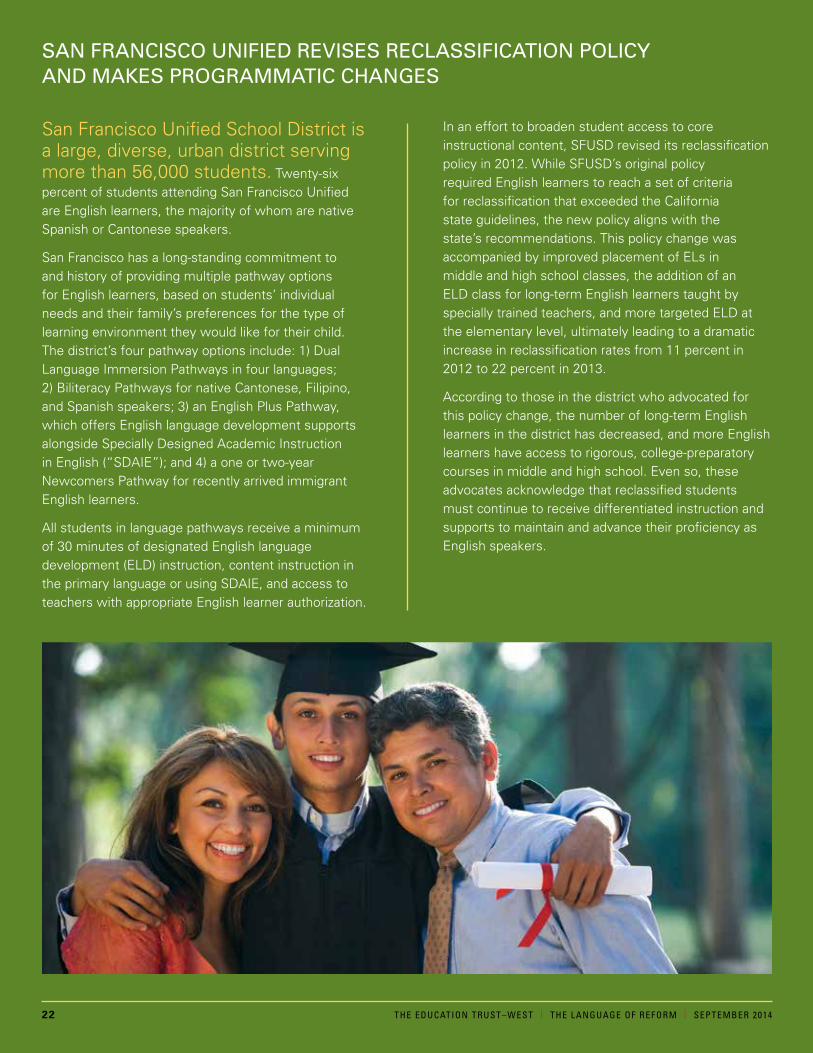
san francisco unified school district is a large, diverse, urban district serving more than 56,000 students. Twenty-six percent of students attending san francisco unified are english learners, the majority of whom are native spanish or Cantonese speakers.
san francisco has a long-standing commitment to and history of providing multiple pathway options for english learners, based on students’ individual needs and their family’s preferences for the type of learning environment they would like for their child. The district’s four pathway options include: 1) dual Language immersion pathways in four languages; 2) Biliteracy pathways for native Cantonese, filipino, and spanish speakers; 3) an english plus pathway, which offers english language development supports alongside specially designed academic instruction in english (“sdaie”); and 4) a one or two-year newcomers pathway for recently arrived immigrant english learners.
all students in language pathways receive a minimum of 30 minutes of designated english language development (eLd) instruction, content instruction in the primary language or using sdaie, and access to teachers with appropriate english learner authorization.
in an effort to broaden student access to core instructional content, sfusd revised its reclassification policy in 2012. While sfusd’s original policy required english learners to reach a set of criteria for reclassification that exceeded the California state guidelines, the new policy aligns with the state’s recommendations. This policy change was accompanied by improved placement of eLs in middle and high school classes, the addition of an eLd class for long-term english learners taught by specially trained teachers, and more targeted eLd at the elementary level, ultimately leading to a dramatic increase in reclassification rates from 11 percent in 2012 to 22 percent in 2013.
according to those in the district who advocated for this policy change, the number of long-term english learners in the district has decreased, and more english learners have access to rigorous, college-preparatory courses in middle and high school. even so, these advocates acknowledge that reclassified students must continue to receive differentiated instruction and supports to maintain and advance their proficiency as english speakers.
sAn frAnciscO unified revises recLAssificAtiOn POLicy And mAkes PrOgrAmmAtic chAnges
THE EducaTION TrusT–WEsT | THE LaNguagE Of rEfOrm | sEPTEmbEr 2014 23
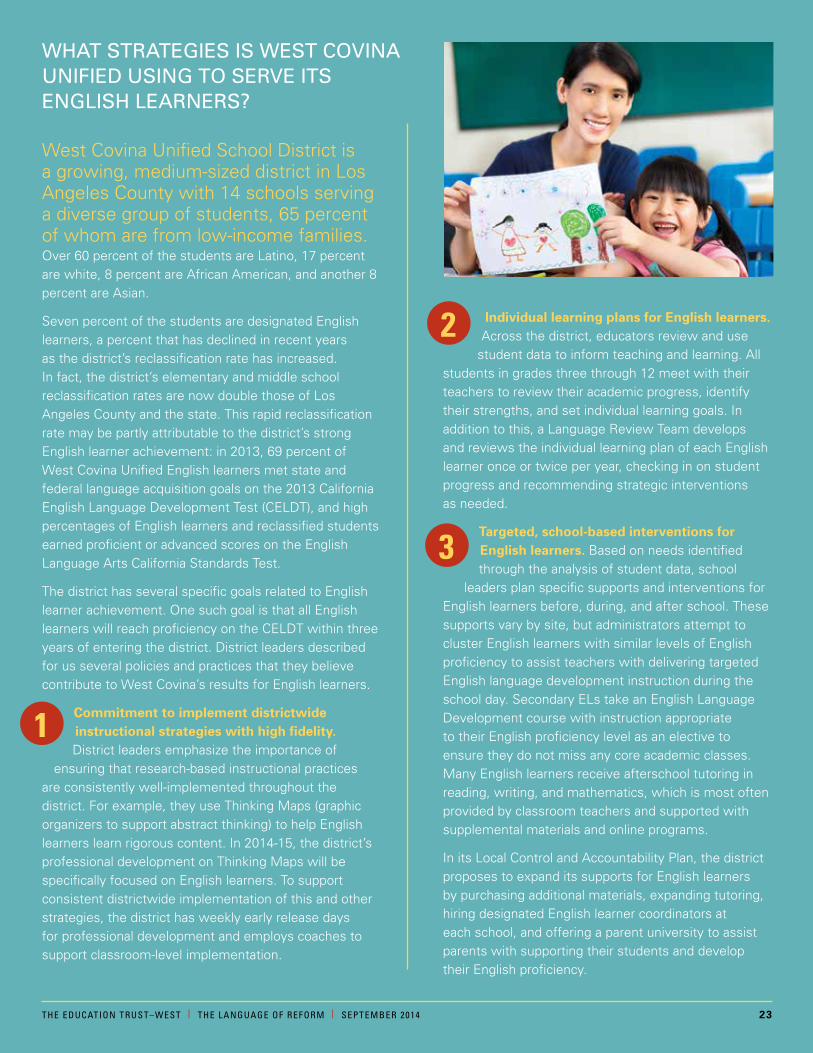
West Covina unified school district is a growing, medium-sized district in Los angeles County with 14 schools serving a diverse group of students, 65 percent of whom are from low-income families. over 60 percent of the students are Latino, 17 percent are white, 8 percent are african american, and another 8 percent are asian.
seven percent of the students are designated english learners, a percent that has declined in recent years as the district’s reclassification rate has increased. in fact, the district’s elementary and middle school reclassification rates are now double those of Los angeles County and the state. This rapid reclassification rate may be partly attributable to the district’s strong english learner achievement: in 2013, 69 percent of West Covina unified english learners met state and federal language acquisition goals on the 2013 California english Language development Test (CeLdT), and high percentages of english learners and reclassified students earned proficient or advanced scores on the english Language arts California standards Test.
The district has several specific goals related to english learner achievement. one such goal is that all english learners will reach proficiency on the CeLdT within three years of entering the district. district leaders described for us several policies and practices that they believe contribute to West Covina’s results for english learners.
commitment to implement districtwide instructional strategies with high fidelity. district leaders emphasize the importance of
ensuring that research-based instructional practices are consistently well-implemented throughout the district. for example, they use Thinking maps (graphic organizers to support abstract thinking) to help english learners learn rigorous content. in 2014-15, the district’s professional development on Thinking maps will be specifically focused on english learners. To support consistent districtwide implementation of this and other strategies, the district has weekly early release days for professional development and employs coaches to support classroom-level implementation.
individual learning plans for english learners. across the district, educators review and use
student data to inform teaching and learning. all students in grades three through 12 meet with their teachers to review their academic progress, identify their strengths, and set individual learning goals. in addition to this, a Language Review Team develops and reviews the individual learning plan of each english learner once or twice per year, checking in on student progress and recommending strategic interventions as needed.
targeted, school-based interventions for english learners. Based on needs identified through the analysis of student data, school
leaders plan specific supports and interventions for english learners before, during, and after school. These supports vary by site, but administrators attempt to cluster english learners with similar levels of english proficiency to assist teachers with delivering targeted english language development instruction during the school day. secondary eLs take an english Language development course with instruction appropriate to their english proficiency level as an elective to ensure they do not miss any core academic classes. many english learners receive afterschool tutoring in reading, writing, and mathematics, which is most often provided by classroom teachers and supported with supplemental materials and online programs.
in its Local Control and accountability plan, the district proposes to expand its supports for english learners by purchasing additional materials, expanding tutoring, hiring designated english learner coordinators at each school, and offering a parent university to assist parents with supporting their students and develop their english proficiency.
1
2
3
whAt strAtegies is west cOvinA unified using tO serve its engLish LeArners?
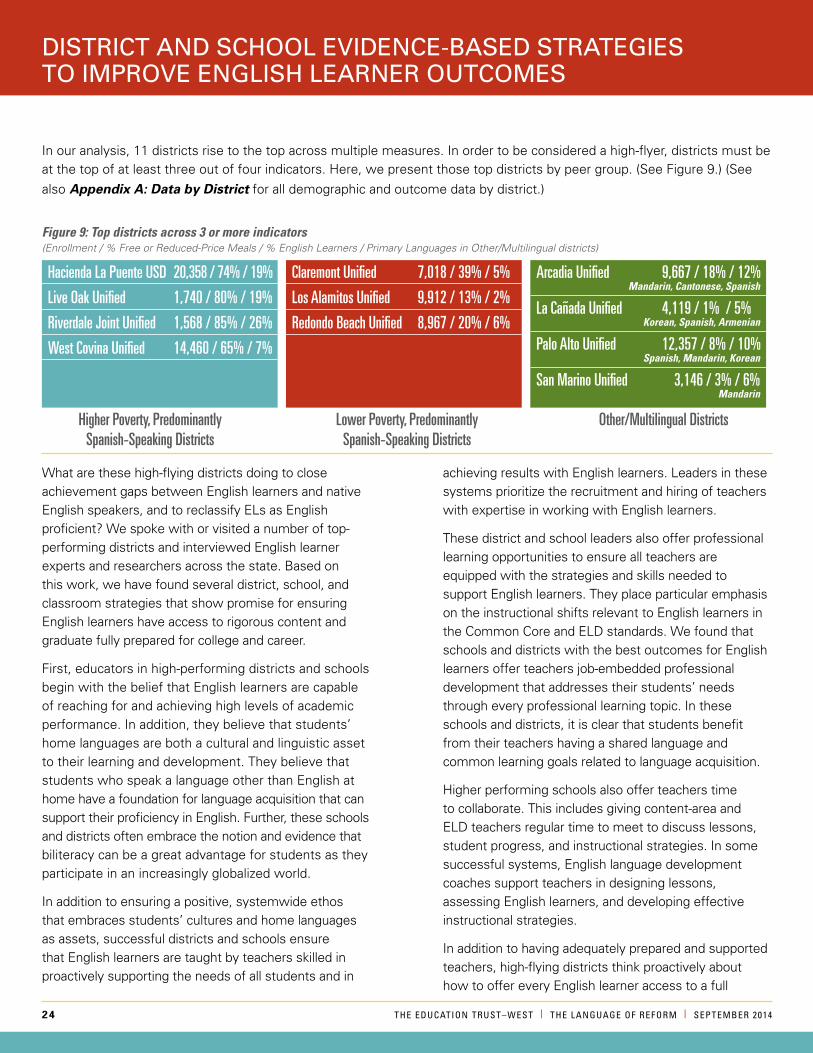
24 THE EducaTION TrusT–WEsT | THE LaNguagE Of rEfOrm | sEPTEmbEr 2014
What are these high-flying districts doing to close achievement gaps between english learners and native english speakers, and to reclassify eLs as english proficient? We spoke with or visited a number of top-performing districts and interviewed english learner experts and researchers across the state. Based on this work, we have found several district, school, and classroom strategies that show promise for ensuring english learners have access to rigorous content and graduate fully prepared for college and career.
first, educators in high-performing districts and schools begin with the belief that english learners are capable of reaching for and achieving high levels of academic performance. in addition, they believe that students’ home languages are both a cultural and linguistic asset to their learning and development. They believe that students who speak a language other than english at home have a foundation for language acquisition that can support their proficiency in english. further, these schools and districts often embrace the notion and evidence that biliteracy can be a great advantage for students as they participate in an increasingly globalized world.
in addition to ensuring a positive, systemwide ethos that embraces students’ cultures and home languages as assets, successful districts and schools ensure that english learners are taught by teachers skilled in proactively supporting the needs of all students and in
achieving results with english learners. Leaders in these systems prioritize the recruitment and hiring of teachers with expertise in working with english learners.
These district and school leaders also offer professional learning opportunities to ensure all teachers are equipped with the strategies and skills needed to support english learners. They place particular emphasis on the instructional shifts relevant to english learners in the Common Core and eLd standards. We found that schools and districts with the best outcomes for english learners offer teachers job-embedded professional development that addresses their students’ needs through every professional learning topic. in these schools and districts, it is clear that students benefit from their teachers having a shared language and common learning goals related to language acquisition.
higher performing schools also offer teachers time to collaborate. This includes giving content-area and eLd teachers regular time to meet to discuss lessons, student progress, and instructional strategies. in some successful systems, english language development coaches support teachers in designing lessons, assessing english learners, and developing effective instructional strategies.
in addition to having adequately prepared and supported teachers, high-flying districts think proactively about how to offer every english learner access to a full
district And schOOL evidence-bAsed strAtegies tO imPrOve engLish LeArner OutcOmes
in our analysis, 11 districts rise to the top across multiple measures. in order to be considered a high-flyer, districts must be at the top of at least three out of four indicators. here, we present those top districts by peer group. (see figure 9.) (see
also Appendix A: Data by District for all demographic and outcome data by district.)
Figure 9: top districts across 3 or more indicators (Enrollment / % Free or Reduced-Price Meals / % English Learners / Primary Languages in Other/Multilingual districts)
hacienda La Puente USd 20,358 / 74% / 19%
Live Oak Unified 1,740 / 80% / 19%
riverdale Joint Unified 1,568 / 85% / 26%
West Covina Unified 14,460 / 65% / 7%
Claremont Unified 7,018 / 39% / 5%
Los alamitos Unified 9,912 / 13% / 2%
redondo Beach Unified 8,967 / 20% / 6%
arcadia Unified 9,667 / 18% / 12% Mandarin, cantonese, spanish
La Cañada Unified 4,119 / 1% / 5%Korean, spanish, armenian
Palo alto Unified 12,357 / 8% / 10%spanish, Mandarin, Korean
San Marino Unified 3,146 / 3% / 6% Mandarin
higher Poverty, Predominantly Spanish-Speaking districts
Lower Poverty, Predominantly Spanish-Speaking districts
Other/Multilingual districts
THE EducaTION TrusT–WEsT | THE LaNguagE Of rEfOrm | sEPTEmbEr 2014 25
Common Core-aligned curriculum that includes rigorous expectations, frequent formative assessments, and college-preparatory courses, including the “a-g” courses required for acceptance to a four-year state university in California. These districts avoid the mistake of oversimplifying their instruction and materials with the intent of helping english learners. They instead maintain high expectations and offer supports that include allowing students to help one another, using audio-visual aids, and providing language supports such as writing templates.
other promising instructional strategies include previewing and reviewing academic vocabulary that is essential for accessing content, providing daily content and language objectives for each subject, and ensuring that opportunities for students to read, write, and speak to each other are incorporated into each lesson. These experiences are critical as students engage with increasingly complex readings and word problems and collaborate with peers throughout the school day.
skilled teachers know how to provide these types of differentiated supports for english learners and native english speakers alike for both instruction and assessments. The new smarter Balanced state assessments include accommodations for english learners that teachers might replicate during in-class formative assessments as well. for example, the new assessments have instructions translated into students’ home languages, and bilingual dictionaries are embedded in the tests.
systems and schools that obtain excellent results with english learners also consistently inform and engage parents regarding their rights and options. This can take the form of parent newsletters, workshops, presentations, school and district advisory committees, or one-on-one meetings with parents to inform them of the programming options available for their child. This engagement ensures that parents are aware of their children’s progress and the resources that are available for english learners in their school and district.
oPPortunitiEs crEatEd By thE local control funding formulaunder California’s new funding formula, we expect to see targeted, strategic, and evidence-based english learner supports outlined in each district’s Local Control and accountability plan. as argued by researchers from uCLa’s Civil Rights project in their recommendations for the use of LCff funds for eLs, “instruction and school-related services for eLs need to go beyond established
practices or simply improving compliance with the existing education code.” instead, they contend, this new funding formula creates an opportunity for schools, districts, and teachers to “innovate and implement research-based best practices.”29
Researchers and advocates agree that these investments should provide a range of programs and services that are differentiated based on each district’s unique context, as well as the needs of their english learners and their families. investments might include:
• Extending learning time by offering before and afterschool programs or longer class periods
• Providing individualized linguistic and academic supports in the form of tutoring or small-group instruction
• Offering incentives to attract highly effective bilingual teachers and teachers with eL expertise
• Providing teachers with professional development on the Common Core and eLd standards
• Increasing high-quality, early-learning opportunities such as preschool and kindergarten
• Expanding access to rigorous academic content, including college-preparatory coursework, and offering students the linguistic supports they need to excel in these courses
• Offering high-quality bilingual programs
• Building strategies for engaging the parents of English learners, including increasing bilingual school support staff and family liaisons or offering parent advocacy programs
• Investing in student wellness and school connectedness, including adding staff and programs to address physical and mental health needs – because many english learners also experience racial segregation, linguistic isolation, and poverty
• Increasing opportunities for English learners to participate in programs that engage them in school and with peers, including sports, arts, clubs, service activities, and afterschool programs
The section A Review of Local Control and Accountability Plans on page 26 provides examples of how some of our high-flying districts plan to invest their Local Control funding formula funds in programs and services for eL students.
26 THE EducaTION TrusT–WEsT | THE LaNguagE Of rEfOrm | sEPTEmbEr 2014
A review Of LOcAL cOntrOL And AccOuntAbiLity PLAns: hOw dO tOP districts PLAn tO serve engLish LeArners?
We reviewed the Local Control and accountability plans (LCaps) from our 11 top-performing districts to uncover the programs and services they plan to offer english learners. a future, deeper review of LCaps should focus on assessing whether the proposed actions are likely to be effective in improving outcomes for english learners. for this cursory review, we focused on how districts presented information and what they propose to offer english learners. We did not evaluate whether those services are high quality or the most effective use of funds. so what did we find?
some of these LCaps offer a satisfying level of detail on the programs and services proposed for english learners, while others offer frustratingly little information. for example, La Cañada unified provides relatively specific detail when it states: “K-6 classroom teachers will continue to have primary responsibility for delivering eLd instructional services, but this will now be supplemented by a .6 fTe certificated teacher in eLd at each elementary site.” in addition, the district will “provide collaboration time for the eLd teacher specialist to monitor eL student progress and confer with the general education teachers.” in contrast, another district describes goals and activities using vague, general language. for example, its one goal related to eLd states that “100% of teachers will be trained in basics of CCss (math, eLa, eLd, ngss),” and its primary activity related to eLd is “provide professional development and collaboration for eLd staff needs focused on student achievement and good instruction.”
often, it is difficult to know how much LCff funding is supporting these programs, since many districts list a variety of funding sources, including Title iii. While it is helpful to see additional revenue streams, LCff’s supplemental and concentration grants are intended to be used to “increase or improve services” for low-income students, english learners, and foster youth. Without transparency regarding where these grants are used, it is very difficult to tell how the new funding formula supports english learners. and beyond the expenditure information, it is often unclear what will be “increased or improved” for english learners, either compared with prior years or compared with the core program offered to all district students.
in most cases, it is difficult to tell how much districts plan to spend on individual actions and services. often these are bundled into larger expenditures. for example, one district proposes to offer professional development on the eLd standards and instructional strategies for english learner students, but this item is just one of a package of expenditures for Common Core implementation costing $1.08 million per year.
although the state adopted new eLd standards in 2012, not all of the districts mention them in their LCaps. on the other hand, some districts not only mention them, but also include goals for implementation. san marino unified and hacienda La puente unified are two districts that include clear, measurable, annual goals for implementation of the eLd standards. still other districts propose eLd implementation activities, including professional development and the purchase of new instructional materials, while listing relatively little funding to support these activities.
Three of the districts reference an existing master plan for english learners and describe programs and services that will support this plan. These plans tend to address the district’s approach to identifying, assessing, instructing, monitoring, and reclassifying english learners. La Cañada unified proposes to review and update its master plan. however, the two
THE EducaTION TrusT–WEsT | THE LaNguagE Of rEfOrm | sEPTEmbEr 2014 27
other districts that cite a master plan make no such reference, although their plans are at least four years old and include no mention of the Common Core standards, California’s new assessments, or the state’s new eLd standards. a fourth district proposes to develop a master plan.
despite these substantial differences from district to district, we were able to identify some common themes. The investments these districts most commonly propose include:
• Increased professional development, including professional learning communities, instructional coaches, and additional professional development hours. hacienda La puente unified proposes to offer professional development to all administrators and teachers of english learners on the eLd standards and instructional strategies for english learners and LTeLs. and Los alamitos unified plans to implement part one of a five-year professional development and coaching plan, which includes training all K-2 teachers in signature practices for teaching english learners, including a focus on reading aligned to Common Core.
• Additional bilingual aides in classrooms. Live oak unified proposes to add bilingual instructional aides to help high school students access core content classes, and West Covina unified proposes to continue and expand bilingual aide support services. hacienda La puente unified plans to provide a dual-immersion program to ensure student achievement in dual-language content. Besides this example, though, we saw little mention in the LCaps of districts expanding bilingual or dual-language programs or pathways.
• Extended learning opportunities. Los alamitos unified and Live oak unified state that they will offer summer school programs to english learners, and Redondo Beach unified plans to provide extended learning time for english learners at the intermediate and early intermediate CeLdT levels.
• Parent services such as translation and education programs. Riverdale unified plans to create language development opportunities for parents and hire bilingual staff at school sites to assist with parent outreach. While many of these 11 districts propose to use supplemental funding for translation services, in most cases districts are already legally obligated to provide families with materials translated into their home languages.
• Programs to expand access to rigorous academic, college, and career-ready opportunities for english learners. hacienda La puente unified plans to train counselors and administrators to ensure equitable access to electives, advanced coursework, and appropriate placement into eLd courses.
• Interventions and supports to help English learners academically and with language acquisition. West Covina unified proposes to use teachers on special assignment to offer small groups of students targeted interventions to meet their assessed needs in english language arts and english acquisition. many of these 11 districts propose to use programs like Response to intervention. La Cañada unified plans to offer ipads to each elementary-level english learner in CeLdT levels 1-3 and load these devices with eLd software.
WE havE found sEvEral district, school, and classroom stratEgiEs that EnsurE English lEarnErs havE accEss to rigorous contEnt and Will graduatE fully PrEParEd for collEgE and a carEEr.
28 THE EducaTION TrusT–WEsT | THE LaNguagE Of rEfOrm | sEPTEmbEr 2014
California’s education landscape has experienced seismic shifts in the past several years. The historic shake-up of the school funding formula has driven more money to districts serving high proportions of english learners, while also creating mechanisms for engaging their parents and shedding light on how districts intend to serve them. at the same time, the state is implementing the new Common Core state standards, next generation science standards, and english Language development standards, accompanied by new, more rigorous assessments to measure whether students are learning those standards. finally, the state is revamping its accountability system to monitor districts’ progress toward meeting state targets as well as the goals outlined in their Local Control and accountability plans. all of these changes are good for California’s education system and the 6 million students it serves. But in order to ensure these reforms result in positive outcomes and progress for english learners, we urge state policymakers to be attentive to implementation questions and challenges that continue to arise. our research on english learner outcomes and practices, in combination with our history of advocacy in this area, leads us to the following recommendations:
Ensure English learners have full access to rigorous content and college-preparatory coursework aligned with the Common Core,
English Language Development (ELD), and Next Generation Science standards, including “A-G” courses at the high school level. Districts should monitor English learners’ access to courses and ensure the EL label does not prevent full access to rigorous, grade-appropriate coursework. When providing districts with resources to support Common Core implementation, offering guidance on Common Core professional development, and approving instructional materials, state policymakers and the California Department of Education must treat English learner needs as an integral part of the work.
Train teachers to support language development within the context of the core curriculum, not just in targeted English
language development classes. This is particularly true in California, where nearly every classroom includes English learners or reclassified ELs. Doing so requires investments in both ongoing teacher training and collaborative release time for ELD and content-area teachers. The ELD standards should be presented simultaneously with the Common Core standards to help teachers understand how to make the content accessible. Finally, teacher preparation programs should make sure all new teachers can demonstrate basic strategies for supporting English learners in the classroom.
Monitor early implementation of the new Smarter Balanced formative and summative assessments to understand their impact on
English learners. It is essential that linguistic barriers related to testing are identified and addressed before high stakes are attached to test results. In addition, make sure teachers receive adequate training on how to administer available accommodations for English learners on the new assessments.
When reporting test data on English learner achievement, disaggregate results for long-term English learners. As of 2012, California
requires that LTEL students be identified and that information about who they are be shared with school districts. However, additional legislation is needed to ensure their results are disaggregated as a distinct subgroup within the public data reporting and accountability system in order to increase awareness of long-term English learner outcomes and allow for comparability across districts.
When reporting data on English learner achievement, focus on student growth, not just overall proficiency. When revamping the
accountability system, the state should ensure that student assessment data is reported in terms of students’ year-to-year growth. This will allow schools and districts to more easily monitor progress.
Our recOmmendAtiOns
1
2
3
5
4

THE EducaTION TrusT–WEsT | THE LaNguagE Of rEfOrm | sEPTEmbEr 2014 29
Ensure the needs of English learners are adequately addressed within Local Control and Accountability Plans. When supporting
districts and reviewing LCAPs, county offices of education should ensure districts are setting goals specific to English learners, including goals for academic achievement, English acquisition, and reclassification. LCAPs should include clear metrics that monitor the progress of ELs, such as those outlined in this report. Further, districts should describe their plans for implementing the new English language development standards and building teacher comfort and proficiency with supporting the linguistic needs of English learners across the subject areas. Finally, districts and counties should ensure that adequate funding is allocated to these programs and services, so that the intent of the Local Control Funding Formula — addressing the distinct needs of all students, and underserved students in particular — is carried out.
Support biliteracy as a viable instructional program so that districts may provide a range of language instruction options for
students and their families. Research finds that dual-language proficiency is associated with improved academic outcomes overall, including more sustained academic growth.30 The state should repeal the ban on bilingual education and create programs and structures that incentivize and recognize bilingual programs and dual language proficiency.
Create clearer, more uniform statewide reclassification standards and guidelines. Given that the EL label can sometimes be a
barrier to rigorous coursework and a college-going pathway, the state should standardize reclassification policies to ensure that all English learners have the same opportunity to be reclassified in a timely manner. This will also make it easier to compare reclassification rates and student achievement across districts.
Modify the Local Control Funding Formula to allow reclassified English
learners to generate supplemental and concentration funds. To ensure districts do not face perverse incentives for keeping students classified as English learners longer than necessary, the state should alter the Local Control Funding Formula to allow reclassified students to generate supplemental and concentration grants for their districts for up to two years after being reclassified. This will also ensure that RFEPs get the supports they may need even after being reclassified to further their academic growth and language development.
By addressing these policy and implementation challenges, California can more confidently claim that it is offering every child an equal opportunity to succeed in our public schools. in a state that serves more english learners than any other, we cannot afford to ignore the obstacles currently preventing english learners from accessing the highest quality educational opportunities they deserve.
as districts such as selma unified, Calipatria unified, Los alamitos unified, and West Covina unified demonstrate, it is possible for english learners to achieve at high levels. Those districts and schools have not treated the linguistic needs of their students and families as add-ons. Rather, they have consciously and deliberately built high-quality english language development programs, have trained their teachers to meet the needs of english learners within the core content areas, have used data to diagnose and address the learning needs of all students, and have provided english learners with additional academic and language supports to help them advance. most importantly, educators and leaders in these districts and schools have an unwavering belief that all children can learn and excel. With the exciting opportunities presented by the new standards and our redesigned funding system, we are optimistic that we will see more districts like these beating the odds and, indeed, recasting the die for California’s english learners.
6
7
8
9
in ordEr to EnsurE california’s many rEforms rEsult in PositivE outcomEs for English lEarnErs, WE urgE statE PolicymakErs to BE attEntivE to imPlEmEntation challEngEs as thEy arisE.
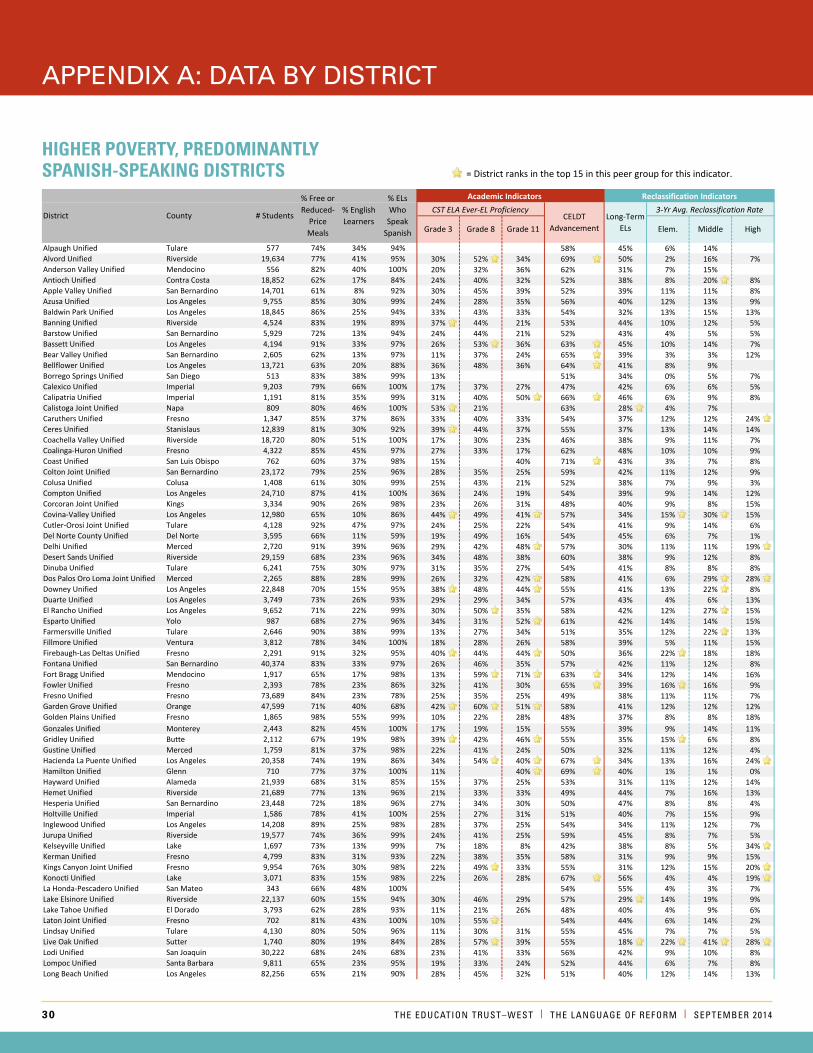
30 THE EducaTION TrusT–WEsT | THE LaNguagE Of rEfOrm | sEPTEmbEr 2014
APPendix A: dAtA by district
Higher Poverty, Predominantly Spanish-Speaking Districts
Alpaugh Unified Tulare 577 74% 34% 94% 58% 45% 6% 14%Alvord Unified Riverside 19,634 77% 41% 95% 30% 52% 34% 69% 50% 2% 16% 7%Anderson Valley Unified Mendocino 556 82% 40% 100% 20% 32% 36% 62% 31% 7% 15%Antioch Unified Contra Costa 18,852 62% 17% 84% 24% 40% 32% 52% 38% 8% 20% 8%Apple Valley Unified San Bernardino 14,701 61% 8% 92% 30% 45% 39% 52% 39% 11% 11% 8%Azusa Unified Los Angeles 9,755 85% 30% 99% 24% 28% 35% 56% 40% 12% 13% 9%Baldwin Park Unified Los Angeles 18,845 86% 25% 94% 33% 43% 33% 54% 32% 13% 15% 13%Banning Unified Riverside 4,524 83% 19% 89% 37% 44% 21% 53% 44% 10% 12% 5%Barstow Unified San Bernardino 5,929 72% 13% 94% 24% 44% 21% 52% 43% 4% 5% 5%Bassett Unified Los Angeles 4,194 91% 33% 97% 26% 53% 36% 63% 45% 10% 14% 7%Bear Valley Unified San Bernardino 2,605 62% 13% 97% 11% 37% 24% 65% 39% 3% 3% 12%Bellflower Unified Los Angeles 13,721 63% 20% 88% 36% 48% 36% 64% 41% 8% 9%Borrego Springs Unified San Diego 513 83% 38% 99% 13% 51% 34% 0% 5% 7%Calexico Unified Imperial 9,203 79% 66% 100% 17% 37% 27% 47% 42% 6% 6% 5%Calipatria Unified Imperial 1,191 81% 35% 99% 31% 40% 50% 66% 46% 6% 9% 8%Calistoga Joint Unified Napa 809 80% 46% 100% 53% 21% 63% 28% 4% 7%Caruthers Unified Fresno 1,347 85% 37% 86% 33% 40% 33% 54% 37% 12% 12% 24%Ceres Unified Stanislaus 12,839 81% 30% 92% 39% 44% 37% 55% 37% 13% 14% 14%Coachella Valley Unified Riverside 18,720 80% 51% 100% 17% 30% 23% 46% 38% 9% 11% 7%Coalinga-Huron Unified Fresno 4,322 85% 45% 97% 27% 33% 17% 62% 48% 10% 10% 9%Coast Unified San Luis Obispo 762 60% 37% 98% 15% 40% 71% 43% 3% 7% 8%Colton Joint Unified San Bernardino 23,172 79% 25% 96% 28% 35% 25% 59% 42% 11% 12% 9%Colusa Unified Colusa 1,408 61% 30% 99% 25% 43% 21% 52% 38% 7% 9% 3%Compton Unified Los Angeles 24,710 87% 41% 100% 36% 24% 19% 54% 39% 9% 14% 12%Corcoran Joint Unified Kings 3,334 90% 26% 98% 23% 26% 31% 48% 40% 9% 8% 15%Covina-Valley Unified Los Angeles 12,980 65% 10% 86% 44% 49% 41% 57% 34% 15% 30% 15%Cutler-Orosi Joint Unified Tulare 4,128 92% 47% 97% 24% 25% 22% 54% 41% 9% 14% 6%Del Norte County Unified Del Norte 3,595 66% 11% 59% 19% 49% 16% 54% 45% 6% 7% 1%Delhi Unified Merced 2,720 91% 39% 96% 29% 42% 48% 57% 30% 11% 11% 19%Desert Sands Unified Riverside 29,159 68% 23% 96% 34% 48% 38% 60% 38% 9% 12% 8%Dinuba Unified Tulare 6,241 75% 30% 97% 31% 35% 27% 54% 41% 8% 8% 8%Dos Palos Oro Loma Joint Unified Merced 2,265 88% 28% 99% 26% 32% 42% 58% 41% 6% 29% 28%Downey Unified Los Angeles 22,848 70% 15% 95% 38% 48% 44% 55% 41% 13% 22% 8%Duarte Unified Los Angeles 3,749 73% 26% 93% 29% 29% 34% 57% 43% 4% 6% 13%El Rancho Unified Los Angeles 9,652 71% 22% 99% 30% 50% 35% 58% 42% 12% 27% 15%Esparto Unified Yolo 987 68% 27% 96% 34% 31% 52% 61% 42% 14% 14% 15%Farmersville Unified Tulare 2,646 90% 38% 99% 13% 27% 34% 51% 35% 12% 22% 13%Fillmore Unified Ventura 3,812 78% 34% 100% 18% 28% 26% 58% 39% 5% 11% 15%Firebaugh-Las Deltas Unified Fresno 2,291 91% 32% 95% 40% 44% 44% 50% 36% 22% 18% 18%Fontana Unified San Bernardino 40,374 83% 33% 97% 26% 46% 35% 57% 42% 11% 12% 8%Fort Bragg Unified Mendocino 1,917 65% 17% 98% 13% 59% 71% 63% 34% 12% 14% 16%Fowler Unified Fresno 2,393 78% 23% 86% 32% 41% 30% 65% 39% 16% 16% 9%Fresno Unified Fresno 73,689 84% 23% 78% 25% 35% 25% 49% 38% 11% 11% 7%Garden Grove Unified Orange 47,599 71% 40% 68% 42% 60% 51% 58% 41% 12% 12% 12%Golden Plains Unified Fresno 1,865 98% 55% 99% 10% 22% 28% 48% 37% 8% 8% 18%
= District ranks in the top 15 in this peer group for this indicator.
District County # Students
% Free or Reduced-
Price Meals
% English Learners
% ELs Who
Speak Spanish
Academic Indicators Reclassification IndicatorsCST ELA Ever-EL Proficiency
CELDT Advancement
Long-Term ELs
3-Yr Avg. Reclassification Rate
Grade 3 Grade 8 Grade 11 Elem. Middle High
District County # Students
% Free or Reduced-
Price Meals
% English Learners
% ELs Who
Speak Spanish
Academic Indicators Reclassification IndicatorsCST ELA Ever-EL Proficiency
CELDT Advancement
Long-Term ELs
3-Yr Avg. Reclassification Rate
Grade 3 Grade 8 Grade 11 Elem. Middle High
Gonzales Unified Monterey 2,443 82% 45% 100% 17% 19% 15% 55% 39% 9% 14% 11%Gridley Unified Butte 2,112 67% 19% 98% 39% 42% 46% 55% 35% 15% 6% 8%Gustine Unified Merced 1,759 81% 37% 98% 22% 41% 24% 50% 32% 11% 12% 4%Hacienda La Puente Unified Los Angeles 20,358 74% 19% 86% 34% 54% 40% 67% 34% 13% 16% 24%Hamilton Unified Glenn 710 77% 37% 100% 11% 40% 69% 40% 1% 1% 0%Hayward Unified Alameda 21,939 68% 31% 85% 15% 37% 25% 53% 31% 11% 12% 14%Hemet Unified Riverside 21,689 77% 13% 96% 21% 33% 33% 49% 44% 7% 16% 13%Hesperia Unified San Bernardino 23,448 72% 18% 96% 27% 34% 30% 50% 47% 8% 8% 4%Holtville Unified Imperial 1,586 78% 41% 100% 25% 27% 31% 51% 40% 7% 15% 9%Inglewood Unified Los Angeles 14,208 89% 25% 98% 28% 37% 25% 54% 34% 11% 12% 7%Jurupa Unified Riverside 19,577 74% 36% 99% 24% 41% 25% 59% 45% 8% 7% 5%Kelseyville Unified Lake 1,697 73% 13% 99% 7% 18% 8% 42% 38% 8% 5% 34%Kerman Unified Fresno 4,799 83% 31% 93% 22% 38% 35% 58% 31% 9% 9% 15%Kings Canyon Joint Unified Fresno 9,954 76% 30% 98% 22% 49% 33% 55% 31% 12% 15% 20%Konocti Unified Lake 3,071 83% 15% 98% 22% 26% 28% 67% 56% 4% 4% 19%La Honda-Pescadero Unified San Mateo 343 66% 48% 100% 54% 55% 4% 3% 7%Lake Elsinore Unified Riverside 22,137 60% 15% 94% 30% 46% 29% 57% 29% 14% 19% 9%Lake Tahoe Unified El Dorado 3,793 62% 28% 93% 11% 21% 26% 48% 40% 4% 9% 6%Laton Joint Unified Fresno 702 81% 43% 100% 10% 55% 54% 44% 6% 14% 2%Lindsay Unified Tulare 4,130 80% 50% 96% 11% 30% 31% 55% 45% 7% 7% 5%Live Oak Unified Sutter 1,740 80% 19% 84% 28% 57% 39% 55% 18% 22% 41% 28%Lodi Unified San Joaquin 30,222 68% 24% 68% 23% 41% 33% 56% 42% 9% 10% 8%Lompoc Unified Santa Barbara 9,811 65% 23% 95% 19% 33% 24% 52% 44% 6% 7% 8%Long Beach Unified Los Angeles 82,256 65% 21% 90% 28% 45% 32% 51% 40% 12% 14% 13%Los Angeles Unified Los Angeles 655,494 75% 26% 94% 28% 33% 34% 53% 33% 15% 15% 10%Los Banos Unified Merced 9,892 78% 28% 98% 29% 29% 34% 55% 39% 10% 10% 11%Lynwood Unified Los Angeles 15,029 92% 36% 100% 27% 27% 27% 44% 39% 14% 13% 9%Madera Unified Madera 19,984 84% 32% 97% 22% 29% 24% 55% 35% 13% 13% 23%Marysville Joint Unified Yuba 9,815 70% 22% 76% 35% 37% 22% 56% 42% 7% 8% 10%McFarland Unified Kern 3,306 91% 46% 99% 19% 28% 29% 47% 36% 9% 12% 10%Mendota Unified Fresno 2,978 97% 70% 99% 25% 39% 27% 71% 50% 6% 8% 3%Mojave Unified Kern 2,691 76% 13% 97% 3% 34% 32% 44% 42% 8% 11% 5%Montebello Unified Los Angeles 30,564 87% 30% 98% 21% 38% 30% 49% 38% 10% 9% 7%Monterey Peninsula Unified Monterey 10,730 72% 30% 86% 23% 30% 36% 60% 30% 8% 16% 11%Moreno Valley Unified Riverside 34,924 81% 22% 95% 28% 43% 33% 53% 39% 11% 21% 15%Morongo Unified San Bernardino 8,905 67% 5% 83% 11% 71% 25% 55% 35% 8% 10% 9%Newman-Crows Landing Unified Stanislaus 2,867 73% 36% 98% 30% 25% 28% 53% 44% 5% 12% 8%North Monterey County Unified Monterey 4,284 80% 41% 96% 10% 25% 21% 51% 35% 4% 6% 12%Norwalk-La Mirada Unified Los Angeles 19,770 74% 16% 93% 41% 45% 31% 56% 41% 15% 22% 13%Oakland Unified Alameda 46,486 73% 31% 76% 26% 29% 25% 57% 28% 11% 13% 8%Oceanside Unified San Diego 21,215 62% 16% 95% 22% 35% 29% 54% 28% 14% 38% 20%Orland Joint Unified Glenn 2,163 69% 25% 95% 19% 24% 21% 48% 34% 10% 15% 19%Pajaro Valley Unified Santa Cruz 20,001 75% 44% 96% 13% 35% 26% 53% 35% 8% 11% 5%Palm Springs Unified Riverside 23,575 83% 30% 97% 28% 40% 32% 56% 38% 8% 12% 10%Palo Verde Unified Riverside 3,448 66% 11% 95% 13% 31% 20% 48% 41% 6% 5% 4%Paramount Unified Los Angeles 15,864 95% 33% 99% 31% 49% 32% 58% 42% 11% 14% 10%Parlier Unified Fresno 3,320 88% 58% 99% 18% 28% 20% 49% 45% 4% 6% 2%Pasadena Unified Los Angeles 19,540 65% 20% 89% 29% 28% 28% 53% 32% 14% 14% 16%
highEr PovErty, PrEdominantly sPanish-sPEaking districts
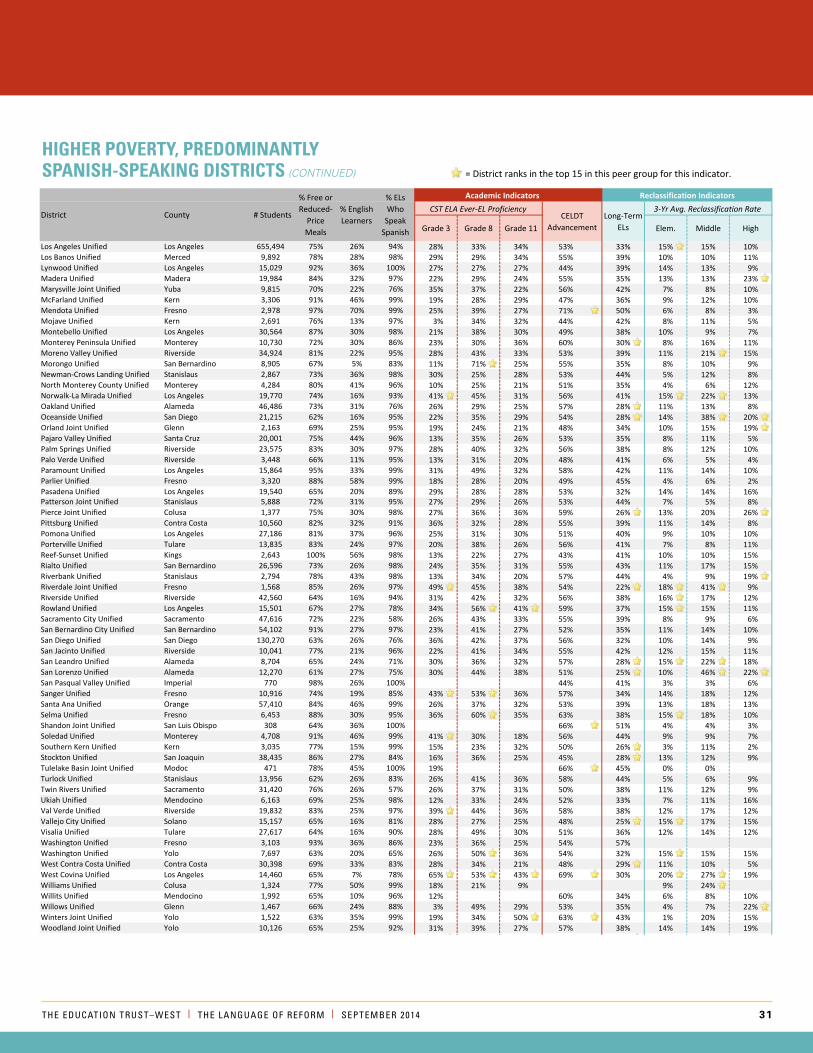
THE EducaTION TrusT–WEsT | THE LaNguagE Of rEfOrm | sEPTEmbEr 2014 31
APPendix A: dAtA by district
District County # Students
% Free or Reduced-
Price Meals
% English Learners
% ELs Who
Speak Spanish
Academic Indicators Reclassification IndicatorsCST ELA Ever-EL Proficiency
CELDT Advancement
Long-Term ELs
3-Yr Avg. Reclassification Rate
Grade 3 Grade 8 Grade 11 Elem. Middle High
Gonzales Unified Monterey 2,443 82% 45% 100% 17% 19% 15% 55% 39% 9% 14% 11%Gridley Unified Butte 2,112 67% 19% 98% 39% 42% 46% 55% 35% 15% 6% 8%Gustine Unified Merced 1,759 81% 37% 98% 22% 41% 24% 50% 32% 11% 12% 4%Hacienda La Puente Unified Los Angeles 20,358 74% 19% 86% 34% 54% 40% 67% 34% 13% 16% 24%Hamilton Unified Glenn 710 77% 37% 100% 11% 40% 69% 40% 1% 1% 0%Hayward Unified Alameda 21,939 68% 31% 85% 15% 37% 25% 53% 31% 11% 12% 14%Hemet Unified Riverside 21,689 77% 13% 96% 21% 33% 33% 49% 44% 7% 16% 13%Hesperia Unified San Bernardino 23,448 72% 18% 96% 27% 34% 30% 50% 47% 8% 8% 4%Holtville Unified Imperial 1,586 78% 41% 100% 25% 27% 31% 51% 40% 7% 15% 9%Inglewood Unified Los Angeles 14,208 89% 25% 98% 28% 37% 25% 54% 34% 11% 12% 7%Jurupa Unified Riverside 19,577 74% 36% 99% 24% 41% 25% 59% 45% 8% 7% 5%Kelseyville Unified Lake 1,697 73% 13% 99% 7% 18% 8% 42% 38% 8% 5% 34%Kerman Unified Fresno 4,799 83% 31% 93% 22% 38% 35% 58% 31% 9% 9% 15%Kings Canyon Joint Unified Fresno 9,954 76% 30% 98% 22% 49% 33% 55% 31% 12% 15% 20%Konocti Unified Lake 3,071 83% 15% 98% 22% 26% 28% 67% 56% 4% 4% 19%La Honda-Pescadero Unified San Mateo 343 66% 48% 100% 54% 55% 4% 3% 7%Lake Elsinore Unified Riverside 22,137 60% 15% 94% 30% 46% 29% 57% 29% 14% 19% 9%Lake Tahoe Unified El Dorado 3,793 62% 28% 93% 11% 21% 26% 48% 40% 4% 9% 6%Laton Joint Unified Fresno 702 81% 43% 100% 10% 55% 54% 44% 6% 14% 2%Lindsay Unified Tulare 4,130 80% 50% 96% 11% 30% 31% 55% 45% 7% 7% 5%Live Oak Unified Sutter 1,740 80% 19% 84% 28% 57% 39% 55% 18% 22% 41% 28%Lodi Unified San Joaquin 30,222 68% 24% 68% 23% 41% 33% 56% 42% 9% 10% 8%Lompoc Unified Santa Barbara 9,811 65% 23% 95% 19% 33% 24% 52% 44% 6% 7% 8%Long Beach Unified Los Angeles 82,256 65% 21% 90% 28% 45% 32% 51% 40% 12% 14% 13%Los Angeles Unified Los Angeles 655,494 75% 26% 94% 28% 33% 34% 53% 33% 15% 15% 10%Los Banos Unified Merced 9,892 78% 28% 98% 29% 29% 34% 55% 39% 10% 10% 11%Lynwood Unified Los Angeles 15,029 92% 36% 100% 27% 27% 27% 44% 39% 14% 13% 9%Madera Unified Madera 19,984 84% 32% 97% 22% 29% 24% 55% 35% 13% 13% 23%Marysville Joint Unified Yuba 9,815 70% 22% 76% 35% 37% 22% 56% 42% 7% 8% 10%McFarland Unified Kern 3,306 91% 46% 99% 19% 28% 29% 47% 36% 9% 12% 10%Mendota Unified Fresno 2,978 97% 70% 99% 25% 39% 27% 71% 50% 6% 8% 3%Mojave Unified Kern 2,691 76% 13% 97% 3% 34% 32% 44% 42% 8% 11% 5%Montebello Unified Los Angeles 30,564 87% 30% 98% 21% 38% 30% 49% 38% 10% 9% 7%Monterey Peninsula Unified Monterey 10,730 72% 30% 86% 23% 30% 36% 60% 30% 8% 16% 11%Moreno Valley Unified Riverside 34,924 81% 22% 95% 28% 43% 33% 53% 39% 11% 21% 15%Morongo Unified San Bernardino 8,905 67% 5% 83% 11% 71% 25% 55% 35% 8% 10% 9%Newman-Crows Landing Unified Stanislaus 2,867 73% 36% 98% 30% 25% 28% 53% 44% 5% 12% 8%North Monterey County Unified Monterey 4,284 80% 41% 96% 10% 25% 21% 51% 35% 4% 6% 12%Norwalk-La Mirada Unified Los Angeles 19,770 74% 16% 93% 41% 45% 31% 56% 41% 15% 22% 13%Oakland Unified Alameda 46,486 73% 31% 76% 26% 29% 25% 57% 28% 11% 13% 8%Oceanside Unified San Diego 21,215 62% 16% 95% 22% 35% 29% 54% 28% 14% 38% 20%Orland Joint Unified Glenn 2,163 69% 25% 95% 19% 24% 21% 48% 34% 10% 15% 19%Pajaro Valley Unified Santa Cruz 20,001 75% 44% 96% 13% 35% 26% 53% 35% 8% 11% 5%Palm Springs Unified Riverside 23,575 83% 30% 97% 28% 40% 32% 56% 38% 8% 12% 10%Palo Verde Unified Riverside 3,448 66% 11% 95% 13% 31% 20% 48% 41% 6% 5% 4%Paramount Unified Los Angeles 15,864 95% 33% 99% 31% 49% 32% 58% 42% 11% 14% 10%Parlier Unified Fresno 3,320 88% 58% 99% 18% 28% 20% 49% 45% 4% 6% 2%Pasadena Unified Los Angeles 19,540 65% 20% 89% 29% 28% 28% 53% 32% 14% 14% 16%
District County # Students
% Free or Reduced-
Price Meals
% English Learners
% ELs Who
Speak Spanish
Academic Indicators Reclassification IndicatorsCST ELA Ever-EL Proficiency
CELDT Advancement
Long-Term ELs
3-Yr Avg. Reclassification Rate
Grade 3 Grade 8 Grade 11 Elem. Middle High
Patterson Joint Unified Stanislaus 5,888 72% 31% 95% 27% 29% 26% 53% 44% 7% 5% 8%Pierce Joint Unified Colusa 1,377 75% 30% 98% 27% 36% 36% 59% 26% 13% 20% 26%Pittsburg Unified Contra Costa 10,560 82% 32% 91% 36% 32% 28% 55% 39% 11% 14% 8%Pomona Unified Los Angeles 27,186 81% 37% 96% 25% 31% 30% 51% 40% 9% 10% 10%Porterville Unified Tulare 13,835 83% 24% 97% 20% 38% 26% 56% 41% 7% 8% 11%Reef-Sunset Unified Kings 2,643 100% 56% 98% 13% 22% 27% 43% 41% 10% 10% 15%Rialto Unified San Bernardino 26,596 73% 26% 98% 24% 35% 31% 55% 43% 11% 17% 15%Riverbank Unified Stanislaus 2,794 78% 43% 98% 13% 34% 20% 57% 44% 4% 9% 19%Riverdale Joint Unified Fresno 1,568 85% 26% 97% 49% 45% 38% 54% 22% 18% 41% 9%Riverside Unified Riverside 42,560 64% 16% 94% 31% 42% 32% 56% 38% 16% 17% 12%Rowland Unified Los Angeles 15,501 67% 27% 78% 34% 56% 41% 59% 37% 15% 15% 11%Sacramento City Unified Sacramento 47,616 72% 22% 58% 26% 43% 33% 55% 39% 8% 9% 6%San Bernardino City Unified San Bernardino 54,102 91% 27% 97% 23% 41% 27% 52% 35% 11% 14% 10%San Diego Unified San Diego 130,270 63% 26% 76% 36% 42% 37% 56% 32% 10% 14% 9%San Jacinto Unified Riverside 10,041 77% 21% 96% 22% 41% 34% 55% 42% 12% 15% 11%San Leandro Unified Alameda 8,704 65% 24% 71% 30% 36% 32% 57% 28% 15% 22% 18%San Lorenzo Unified Alameda 12,270 61% 27% 75% 30% 44% 38% 51% 25% 10% 46% 22%San Pasqual Valley Unified Imperial 770 98% 26% 100% 44% 41% 3% 3% 6%Sanger Unified Fresno 10,916 74% 19% 85% 43% 53% 36% 57% 34% 14% 18% 12%Santa Ana Unified Orange 57,410 84% 46% 99% 26% 37% 32% 53% 39% 13% 18% 13%Selma Unified Fresno 6,453 88% 30% 95% 36% 60% 35% 63% 38% 15% 18% 10%Shandon Joint Unified San Luis Obispo 308 64% 36% 100% 66% 51% 4% 4% 3%Soledad Unified Monterey 4,708 91% 46% 99% 41% 30% 18% 56% 44% 9% 9% 7%Southern Kern Unified Kern 3,035 77% 15% 99% 15% 23% 32% 50% 26% 3% 11% 2%Stockton Unified San Joaquin 38,435 86% 27% 84% 16% 36% 25% 45% 28% 13% 12% 9%Tulelake Basin Joint Unified Modoc 471 78% 45% 100% 19% 66% 45% 0% 0%Turlock Unified Stanislaus 13,956 62% 26% 83% 26% 41% 36% 58% 44% 5% 6% 9%Twin Rivers Unified Sacramento 31,420 76% 26% 57% 26% 37% 31% 50% 38% 11% 12% 9%Ukiah Unified Mendocino 6,163 69% 25% 98% 12% 33% 24% 52% 33% 7% 11% 16%Val Verde Unified Riverside 19,832 83% 25% 97% 39% 44% 36% 58% 38% 12% 17% 12%Vallejo City Unified Solano 15,157 65% 16% 81% 28% 27% 25% 48% 25% 15% 17% 15%Visalia Unified Tulare 27,617 64% 16% 90% 28% 49% 30% 51% 36% 12% 14% 12%Washington Unified Fresno 3,103 93% 36% 86% 23% 36% 25% 54% 57%Washington Unified Yolo 7,697 63% 20% 65% 26% 50% 36% 54% 32% 15% 15% 15%West Contra Costa Unified Contra Costa 30,398 69% 33% 83% 28% 34% 21% 48% 29% 11% 10% 5%West Covina Unified Los Angeles 14,460 65% 7% 78% 65% 53% 43% 69% 30% 20% 27% 19%Williams Unified Colusa 1,324 77% 50% 99% 18% 21% 9% 9% 24%Willits Unified Mendocino 1,992 65% 10% 96% 12% 60% 34% 6% 8% 10%Willows Unified Glenn 1,467 66% 24% 88% 3% 49% 29% 53% 35% 4% 7% 22%Winters Joint Unified Yolo 1,522 63% 35% 99% 19% 34% 50% 63% 43% 1% 20% 15%Woodland Joint Unified Yolo 10,126 65% 25% 92% 31% 39% 27% 57% 38% 14% 14% 19%Yuba City Unified Sutter 13,298 67% 19% 69% 37% 47% 31% 60% 27% 12% 18% 18%
Lower Poverty, Predominately Spanish-Speaking DistrictsABC Unified Los Angeles 20,845 52% 20% 69% 49% 54% 51% 67% 39% 11% 12% 12%Acton-Agua Dulce Unified Los Angeles 1,542 34% 13% 96% 63% 40% 2% 0% 2%Aromas/San Juan Unified San Benito 1,170 57% 29% 96% 25% 65% 59% 27% 2% 2% 1%
= District ranks in the top 10 in this peer group for this indicator.
Higher Poverty, Predominantly Spanish-Speaking Districts
Alpaugh Unified Tulare 577 74% 34% 94% 58% 45% 6% 14%Alvord Unified Riverside 19,634 77% 41% 95% 30% 52% 34% 69% 50% 2% 16% 7%Anderson Valley Unified Mendocino 556 82% 40% 100% 20% 32% 36% 62% 31% 7% 15%Antioch Unified Contra Costa 18,852 62% 17% 84% 24% 40% 32% 52% 38% 8% 20% 8%Apple Valley Unified San Bernardino 14,701 61% 8% 92% 30% 45% 39% 52% 39% 11% 11% 8%Azusa Unified Los Angeles 9,755 85% 30% 99% 24% 28% 35% 56% 40% 12% 13% 9%Baldwin Park Unified Los Angeles 18,845 86% 25% 94% 33% 43% 33% 54% 32% 13% 15% 13%Banning Unified Riverside 4,524 83% 19% 89% 37% 44% 21% 53% 44% 10% 12% 5%Barstow Unified San Bernardino 5,929 72% 13% 94% 24% 44% 21% 52% 43% 4% 5% 5%Bassett Unified Los Angeles 4,194 91% 33% 97% 26% 53% 36% 63% 45% 10% 14% 7%Bear Valley Unified San Bernardino 2,605 62% 13% 97% 11% 37% 24% 65% 39% 3% 3% 12%Bellflower Unified Los Angeles 13,721 63% 20% 88% 36% 48% 36% 64% 41% 8% 9%Borrego Springs Unified San Diego 513 83% 38% 99% 13% 51% 34% 0% 5% 7%Calexico Unified Imperial 9,203 79% 66% 100% 17% 37% 27% 47% 42% 6% 6% 5%Calipatria Unified Imperial 1,191 81% 35% 99% 31% 40% 50% 66% 46% 6% 9% 8%Calistoga Joint Unified Napa 809 80% 46% 100% 53% 21% 63% 28% 4% 7%Caruthers Unified Fresno 1,347 85% 37% 86% 33% 40% 33% 54% 37% 12% 12% 24%Ceres Unified Stanislaus 12,839 81% 30% 92% 39% 44% 37% 55% 37% 13% 14% 14%Coachella Valley Unified Riverside 18,720 80% 51% 100% 17% 30% 23% 46% 38% 9% 11% 7%Coalinga-Huron Unified Fresno 4,322 85% 45% 97% 27% 33% 17% 62% 48% 10% 10% 9%Coast Unified San Luis Obispo 762 60% 37% 98% 15% 40% 71% 43% 3% 7% 8%Colton Joint Unified San Bernardino 23,172 79% 25% 96% 28% 35% 25% 59% 42% 11% 12% 9%Colusa Unified Colusa 1,408 61% 30% 99% 25% 43% 21% 52% 38% 7% 9% 3%Compton Unified Los Angeles 24,710 87% 41% 100% 36% 24% 19% 54% 39% 9% 14% 12%Corcoran Joint Unified Kings 3,334 90% 26% 98% 23% 26% 31% 48% 40% 9% 8% 15%Covina-Valley Unified Los Angeles 12,980 65% 10% 86% 44% 49% 41% 57% 34% 15% 30% 15%Cutler-Orosi Joint Unified Tulare 4,128 92% 47% 97% 24% 25% 22% 54% 41% 9% 14% 6%Del Norte County Unified Del Norte 3,595 66% 11% 59% 19% 49% 16% 54% 45% 6% 7% 1%Delhi Unified Merced 2,720 91% 39% 96% 29% 42% 48% 57% 30% 11% 11% 19%Desert Sands Unified Riverside 29,159 68% 23% 96% 34% 48% 38% 60% 38% 9% 12% 8%Dinuba Unified Tulare 6,241 75% 30% 97% 31% 35% 27% 54% 41% 8% 8% 8%Dos Palos Oro Loma Joint Unified Merced 2,265 88% 28% 99% 26% 32% 42% 58% 41% 6% 29% 28%Downey Unified Los Angeles 22,848 70% 15% 95% 38% 48% 44% 55% 41% 13% 22% 8%Duarte Unified Los Angeles 3,749 73% 26% 93% 29% 29% 34% 57% 43% 4% 6% 13%El Rancho Unified Los Angeles 9,652 71% 22% 99% 30% 50% 35% 58% 42% 12% 27% 15%Esparto Unified Yolo 987 68% 27% 96% 34% 31% 52% 61% 42% 14% 14% 15%Farmersville Unified Tulare 2,646 90% 38% 99% 13% 27% 34% 51% 35% 12% 22% 13%Fillmore Unified Ventura 3,812 78% 34% 100% 18% 28% 26% 58% 39% 5% 11% 15%Firebaugh-Las Deltas Unified Fresno 2,291 91% 32% 95% 40% 44% 44% 50% 36% 22% 18% 18%Fontana Unified San Bernardino 40,374 83% 33% 97% 26% 46% 35% 57% 42% 11% 12% 8%Fort Bragg Unified Mendocino 1,917 65% 17% 98% 13% 59% 71% 63% 34% 12% 14% 16%Fowler Unified Fresno 2,393 78% 23% 86% 32% 41% 30% 65% 39% 16% 16% 9%Fresno Unified Fresno 73,689 84% 23% 78% 25% 35% 25% 49% 38% 11% 11% 7%Garden Grove Unified Orange 47,599 71% 40% 68% 42% 60% 51% 58% 41% 12% 12% 12%Golden Plains Unified Fresno 1,865 98% 55% 99% 10% 22% 28% 48% 37% 8% 8% 18%
= District ranks in the top 15 in this peer group for this indicator.
District County # Students
% Free or Reduced-
Price Meals
% English Learners
% ELs Who
Speak Spanish
Academic Indicators Reclassification IndicatorsCST ELA Ever-EL Proficiency
CELDT Advancement
Long-Term ELs
3-Yr Avg. Reclassification Rate
Grade 3 Grade 8 Grade 11 Elem. Middle High
highEr PovErty, PrEdominantly sPanish-sPEaking districts (COnTInuED)
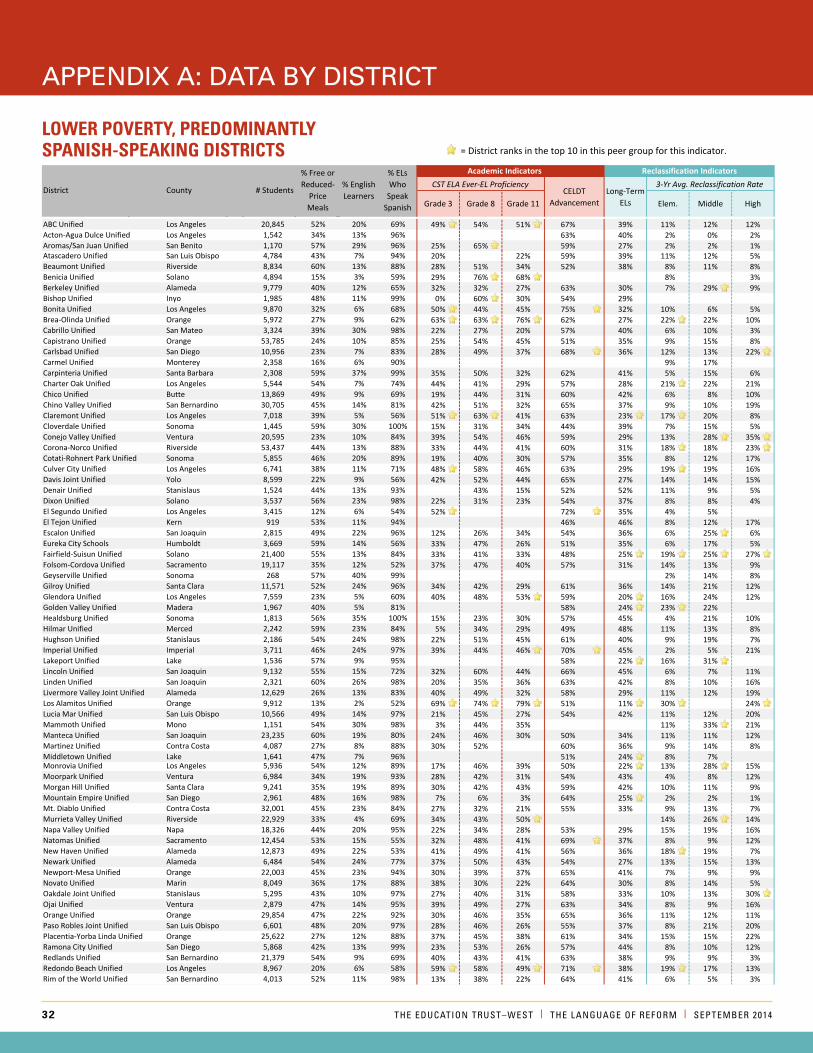
32 THE EducaTION TrusT–WEsT | THE LaNguagE Of rEfOrm | sEPTEmbEr 2014
APPendix A: dAtA by district
District County # Students
% Free or Reduced-
Price Meals
% English Learners
% ELs Who
Speak Spanish
Academic Indicators Reclassification IndicatorsCST ELA Ever-EL Proficiency
CELDT Advancement
Long-Term ELs
3-Yr Avg. Reclassification Rate
Grade 3 Grade 8 Grade 11 Elem. Middle High
Patterson Joint Unified Stanislaus 5,888 72% 31% 95% 27% 29% 26% 53% 44% 7% 5% 8%Pierce Joint Unified Colusa 1,377 75% 30% 98% 27% 36% 36% 59% 26% 13% 20% 26%Pittsburg Unified Contra Costa 10,560 82% 32% 91% 36% 32% 28% 55% 39% 11% 14% 8%Pomona Unified Los Angeles 27,186 81% 37% 96% 25% 31% 30% 51% 40% 9% 10% 10%Porterville Unified Tulare 13,835 83% 24% 97% 20% 38% 26% 56% 41% 7% 8% 11%Reef-Sunset Unified Kings 2,643 100% 56% 98% 13% 22% 27% 43% 41% 10% 10% 15%Rialto Unified San Bernardino 26,596 73% 26% 98% 24% 35% 31% 55% 43% 11% 17% 15%Riverbank Unified Stanislaus 2,794 78% 43% 98% 13% 34% 20% 57% 44% 4% 9% 19%Riverdale Joint Unified Fresno 1,568 85% 26% 97% 49% 45% 38% 54% 22% 18% 41% 9%Riverside Unified Riverside 42,560 64% 16% 94% 31% 42% 32% 56% 38% 16% 17% 12%Rowland Unified Los Angeles 15,501 67% 27% 78% 34% 56% 41% 59% 37% 15% 15% 11%Sacramento City Unified Sacramento 47,616 72% 22% 58% 26% 43% 33% 55% 39% 8% 9% 6%San Bernardino City Unified San Bernardino 54,102 91% 27% 97% 23% 41% 27% 52% 35% 11% 14% 10%San Diego Unified San Diego 130,270 63% 26% 76% 36% 42% 37% 56% 32% 10% 14% 9%San Jacinto Unified Riverside 10,041 77% 21% 96% 22% 41% 34% 55% 42% 12% 15% 11%San Leandro Unified Alameda 8,704 65% 24% 71% 30% 36% 32% 57% 28% 15% 22% 18%San Lorenzo Unified Alameda 12,270 61% 27% 75% 30% 44% 38% 51% 25% 10% 46% 22%San Pasqual Valley Unified Imperial 770 98% 26% 100% 44% 41% 3% 3% 6%Sanger Unified Fresno 10,916 74% 19% 85% 43% 53% 36% 57% 34% 14% 18% 12%Santa Ana Unified Orange 57,410 84% 46% 99% 26% 37% 32% 53% 39% 13% 18% 13%Selma Unified Fresno 6,453 88% 30% 95% 36% 60% 35% 63% 38% 15% 18% 10%Shandon Joint Unified San Luis Obispo 308 64% 36% 100% 66% 51% 4% 4% 3%Soledad Unified Monterey 4,708 91% 46% 99% 41% 30% 18% 56% 44% 9% 9% 7%Southern Kern Unified Kern 3,035 77% 15% 99% 15% 23% 32% 50% 26% 3% 11% 2%Stockton Unified San Joaquin 38,435 86% 27% 84% 16% 36% 25% 45% 28% 13% 12% 9%Tulelake Basin Joint Unified Modoc 471 78% 45% 100% 19% 66% 45% 0% 0%Turlock Unified Stanislaus 13,956 62% 26% 83% 26% 41% 36% 58% 44% 5% 6% 9%Twin Rivers Unified Sacramento 31,420 76% 26% 57% 26% 37% 31% 50% 38% 11% 12% 9%Ukiah Unified Mendocino 6,163 69% 25% 98% 12% 33% 24% 52% 33% 7% 11% 16%Val Verde Unified Riverside 19,832 83% 25% 97% 39% 44% 36% 58% 38% 12% 17% 12%Vallejo City Unified Solano 15,157 65% 16% 81% 28% 27% 25% 48% 25% 15% 17% 15%Visalia Unified Tulare 27,617 64% 16% 90% 28% 49% 30% 51% 36% 12% 14% 12%Washington Unified Fresno 3,103 93% 36% 86% 23% 36% 25% 54% 57%Washington Unified Yolo 7,697 63% 20% 65% 26% 50% 36% 54% 32% 15% 15% 15%West Contra Costa Unified Contra Costa 30,398 69% 33% 83% 28% 34% 21% 48% 29% 11% 10% 5%West Covina Unified Los Angeles 14,460 65% 7% 78% 65% 53% 43% 69% 30% 20% 27% 19%Williams Unified Colusa 1,324 77% 50% 99% 18% 21% 9% 9% 24%Willits Unified Mendocino 1,992 65% 10% 96% 12% 60% 34% 6% 8% 10%Willows Unified Glenn 1,467 66% 24% 88% 3% 49% 29% 53% 35% 4% 7% 22%Winters Joint Unified Yolo 1,522 63% 35% 99% 19% 34% 50% 63% 43% 1% 20% 15%Woodland Joint Unified Yolo 10,126 65% 25% 92% 31% 39% 27% 57% 38% 14% 14% 19%Yuba City Unified Sutter 13,298 67% 19% 69% 37% 47% 31% 60% 27% 12% 18% 18%
Lower Poverty, Predominately Spanish-Speaking DistrictsABC Unified Los Angeles 20,845 52% 20% 69% 49% 54% 51% 67% 39% 11% 12% 12%Acton-Agua Dulce Unified Los Angeles 1,542 34% 13% 96% 63% 40% 2% 0% 2%Aromas/San Juan Unified San Benito 1,170 57% 29% 96% 25% 65% 59% 27% 2% 2% 1%
= District ranks in the top 10 in this peer group for this indicator.
District County # Students
% Free or Reduced-
Price Meals
% English Learners
% ELs Who
Speak Spanish
Academic Indicators Reclassification IndicatorsCST ELA Ever-EL Proficiency
CELDT Advancement
Long-Term ELs
3-Yr Avg. Reclassification Rate
Grade 3 Grade 8 Grade 11 Elem. Middle High
Atascadero Unified San Luis Obispo 4,784 43% 7% 94% 20% 22% 59% 39% 11% 12% 5%Beaumont Unified Riverside 8,834 60% 13% 88% 28% 51% 34% 52% 38% 8% 11% 8%Benicia Unified Solano 4,894 15% 3% 59% 29% 76% 68% 8% 3%Berkeley Unified Alameda 9,779 40% 12% 65% 32% 32% 27% 63% 30% 7% 29% 9%Bishop Unified Inyo 1,985 48% 11% 99% 0% 60% 30% 54% 29%Bonita Unified Los Angeles 9,870 32% 6% 68% 50% 44% 45% 75% 32% 10% 6% 5%Brea-Olinda Unified Orange 5,972 27% 9% 62% 63% 63% 76% 62% 27% 22% 22% 10%Cabrillo Unified San Mateo 3,324 39% 30% 98% 22% 27% 20% 57% 40% 6% 10% 3%Capistrano Unified Orange 53,785 24% 10% 85% 25% 54% 45% 51% 35% 9% 15% 8%Carlsbad Unified San Diego 10,956 23% 7% 83% 28% 49% 37% 68% 36% 12% 13% 22%Carmel Unified Monterey 2,358 16% 6% 90% 9% 17%Carpinteria Unified Santa Barbara 2,308 59% 37% 99% 35% 50% 32% 62% 41% 5% 15% 6%Charter Oak Unified Los Angeles 5,544 54% 7% 74% 44% 41% 29% 57% 28% 21% 22% 21%Chico Unified Butte 13,869 49% 9% 69% 19% 44% 31% 60% 42% 6% 8% 10%Chino Valley Unified San Bernardino 30,705 45% 14% 81% 42% 51% 32% 65% 37% 9% 10% 19%Claremont Unified Los Angeles 7,018 39% 5% 56% 51% 63% 41% 63% 23% 17% 20% 8%Cloverdale Unified Sonoma 1,445 59% 30% 100% 15% 31% 34% 44% 39% 7% 15% 5%Conejo Valley Unified Ventura 20,595 23% 10% 84% 39% 54% 46% 59% 29% 13% 28% 35%Corona-Norco Unified Riverside 53,437 44% 13% 88% 33% 44% 41% 60% 31% 18% 18% 23%Cotati-Rohnert Park Unified Sonoma 5,855 46% 20% 89% 19% 40% 30% 57% 35% 8% 12% 17%Culver City Unified Los Angeles 6,741 38% 11% 71% 48% 58% 46% 63% 29% 19% 19% 16%Davis Joint Unified Yolo 8,599 22% 9% 56% 42% 52% 44% 65% 27% 14% 14% 15%Denair Unified Stanislaus 1,524 44% 13% 93% 43% 15% 52% 52% 11% 9% 5%Dixon Unified Solano 3,537 56% 23% 98% 22% 31% 23% 54% 37% 8% 8% 4%El Segundo Unified Los Angeles 3,415 12% 6% 54% 52% 72% 35% 4% 5%El Tejon Unified Kern 919 53% 11% 94% 46% 46% 8% 12% 17%Escalon Unified San Joaquin 2,815 49% 22% 96% 12% 26% 34% 54% 36% 6% 25% 6%Eureka City Schools Humboldt 3,669 59% 14% 56% 33% 47% 26% 51% 35% 6% 17% 5%Fairfield-Suisun Unified Solano 21,400 55% 13% 84% 33% 41% 33% 48% 25% 19% 25% 27%Folsom-Cordova Unified Sacramento 19,117 35% 12% 52% 37% 47% 40% 57% 31% 14% 13% 9%Geyserville Unified Sonoma 268 57% 40% 99% 2% 14% 8%Gilroy Unified Santa Clara 11,571 52% 24% 96% 34% 42% 29% 61% 36% 14% 21% 12%Glendora Unified Los Angeles 7,559 23% 5% 60% 40% 48% 53% 59% 20% 16% 24% 12%Golden Valley Unified Madera 1,967 40% 5% 81% 58% 24% 23% 22%Healdsburg Unified Sonoma 1,813 56% 35% 100% 15% 23% 30% 57% 45% 4% 21% 10%Hilmar Unified Merced 2,242 59% 23% 84% 5% 34% 29% 49% 48% 11% 13% 8%Hughson Unified Stanislaus 2,186 54% 24% 98% 22% 51% 45% 61% 40% 9% 19% 7%Imperial Unified Imperial 3,711 46% 24% 97% 39% 44% 46% 70% 45% 2% 5% 21%Lakeport Unified Lake 1,536 57% 9% 95% 58% 22% 16% 31%Lincoln Unified San Joaquin 9,132 55% 15% 72% 32% 60% 44% 66% 45% 6% 7% 11%Linden Unified San Joaquin 2,321 60% 26% 98% 20% 35% 36% 63% 42% 8% 10% 16%Livermore Valley Joint Unified Alameda 12,629 26% 13% 83% 40% 49% 32% 58% 29% 11% 12% 19%Los Alamitos Unified Orange 9,912 13% 2% 52% 69% 74% 79% 51% 11% 30% 24%Lucia Mar Unified San Luis Obispo 10,566 49% 14% 97% 21% 45% 27% 54% 42% 11% 12% 20%Mammoth Unified Mono 1,151 54% 30% 98% 3% 44% 35% 11% 33% 21%Manteca Unified San Joaquin 23,235 60% 19% 80% 24% 46% 30% 50% 34% 11% 11% 12%Martinez Unified Contra Costa 4,087 27% 8% 88% 30% 52% 60% 36% 9% 14% 8%Middletown Unified Lake 1,641 47% 7% 96% 51% 24% 8% 7%
District County # Students
% Free or Reduced-
Price Meals
% English Learners
% ELs Who
Speak Spanish
Academic Indicators Reclassification IndicatorsCST ELA Ever-EL Proficiency
CELDT Advancement
Long-Term ELs
3-Yr Avg. Reclassification Rate
Grade 3 Grade 8 Grade 11 Elem. Middle High
Monrovia Unified Los Angeles 5,936 54% 12% 89% 17% 46% 39% 50% 22% 13% 28% 15%Moorpark Unified Ventura 6,984 34% 19% 93% 28% 42% 31% 54% 43% 4% 8% 12%Morgan Hill Unified Santa Clara 9,241 35% 19% 89% 30% 42% 43% 59% 42% 10% 11% 9%Mountain Empire Unified San Diego 2,961 48% 16% 98% 7% 6% 3% 64% 25% 2% 2% 1%Mt. Diablo Unified Contra Costa 32,001 45% 23% 84% 27% 32% 21% 55% 33% 9% 13% 7%Murrieta Valley Unified Riverside 22,929 33% 4% 69% 34% 43% 50% 14% 26% 14%Napa Valley Unified Napa 18,326 44% 20% 95% 22% 34% 28% 53% 29% 15% 19% 16%Natomas Unified Sacramento 12,454 53% 15% 55% 32% 48% 41% 69% 37% 8% 9% 12%New Haven Unified Alameda 12,873 49% 22% 53% 41% 49% 41% 56% 36% 18% 19% 7%Newark Unified Alameda 6,484 54% 24% 77% 37% 50% 43% 54% 27% 13% 15% 13%Newport-Mesa Unified Orange 22,003 45% 23% 94% 30% 39% 37% 65% 41% 7% 9% 9%Novato Unified Marin 8,049 36% 17% 88% 38% 30% 22% 64% 30% 8% 14% 5%Oakdale Joint Unified Stanislaus 5,295 43% 10% 97% 27% 40% 31% 58% 33% 10% 13% 30%Ojai Unified Ventura 2,879 47% 14% 95% 39% 49% 27% 63% 34% 8% 9% 16%Orange Unified Orange 29,854 47% 22% 92% 30% 46% 35% 65% 36% 11% 12% 11%Paso Robles Joint Unified San Luis Obispo 6,601 48% 20% 97% 28% 46% 26% 55% 37% 8% 21% 20%Placentia-Yorba Linda Unified Orange 25,622 27% 12% 88% 37% 45% 38% 61% 34% 15% 15% 22%Ramona City Unified San Diego 5,868 42% 13% 99% 23% 53% 26% 57% 44% 8% 10% 12%Redlands Unified San Bernardino 21,379 54% 9% 69% 40% 43% 41% 63% 38% 9% 9% 3%Redondo Beach Unified Los Angeles 8,967 20% 6% 58% 59% 58% 49% 71% 38% 19% 17% 13%Rim of the World Unified San Bernardino 4,013 52% 11% 98% 13% 38% 22% 64% 41% 6% 5% 3%Ripon Unified San Joaquin 3,238 38% 13% 93% 29% 57% 37% 67% 45% 5% 5% 1%River Delta Joint Unified Sacramento 2,323 50% 26% 98% 32% 32% 27% 69% 42% 9% 9% 11%Saddleback Valley Unified Orange 30,355 26% 14% 84% 34% 52% 39% 59% 35% 9% 11% 11%Saint Helena Unified Napa 1,295 43% 18% 94% 20% 43% 41% 54% 27% 12% 44% 15%San Jose Unified Santa Clara 33,184 44% 23% 86% 32% 39% 34% 48% 32% 12% 14% 13%San Juan Unified Sacramento 47,752 47% 10% 59% 19% 43% 27% 53% 33% 11% 13% 10%San Luis Coastal Unified San Luis Obispo 7,535 37% 14% 87% 27% 33% 23% 58% 37% 4% 6% 5%San Marcos Unified San Diego 19,617 46% 18% 92% 45% 60% 39% 61% 32% 12% 21% 11%Santa Barbara Unified Santa Barbara 15,489 52% 31% 97% 27% 42% 33% 64% 49%Santa Clara Unified Santa Clara 15,151 44% 29% 53% 55% 60% 44% 58% 28% 11% 17% 10%Santa Monica-Malibu Unified Los Angeles 11,417 28% 9% 69% 37% 56% 39% 70% 31% 8% 13% 15%Shoreline Unified Marin 554 53% 35% 99% 21% 64% 40% 5% 6% 6%Sierra Sands Unified Kern 5,008 50% 7% 87% 29% 42% 34% 54% 39% 12% 11% 11%Simi Valley Unified Ventura 18,857 28% 9% 83% 38% 38% 38% 54% 25% 10% 11% 18%Snowline Joint Unified San Bernardino 8,071 57% 12% 93% 29% 57% 40% 54% 39% 2% 20% 9%Sonoma Valley Unified Sonoma 4,670 55% 29% 98% 5% 28% 22% 48% 32% 9% 18% 40%South San Francisco Unified San Mateo 9,265 45% 27% 71% 37% 51% 40% 71% 27% 5% 22% 5%Tahoe-Truckee Unified Placer 3,917 40% 21% 99% 15% 26% 10% 58% 38% 9% 21% 11%Tehachapi Unified Kern 4,446 38% 8% 95% 6% 45% 35% 68% 35% 4% 22% 16%Temecula Valley Unified Riverside 30,337 20% 5% 72% 44% 59% 46% 55% 33% 15% 24% 11%Templeton Unified San Luis Obispo 2,360 20% 5% 96% 2%Tracy Joint Unified San Joaquin 17,405 45% 23% 78% 28% 43% 36% 59% 40% 8% 11% 16%Travis Unified Solano 5,466 24% 4% 51% 62% 50% 16% 17% 30%Tustin Unified Orange 23,771 42% 21% 88% 33% 63% 43% 64% 39% 12% 17% 9%Upland Unified San Bernardino 11,908 52% 13% 83% 38% 61% 43% 61% 43% 13% 13% 5%Vacaville Unified Solano 12,657 37% 9% 93% 27% 20% 14% 49% 27% 12% 13% 28%Valley Center-Pauma Unified San Diego 4,154 51% 21% 99% 23% 37% 33% 50% 37% 9% 13% 13%
loWEr PovErty, PrEdominantly sPanish-sPEaking districts
District County # Students
% Free or Reduced-
Price Meals
% English Learners
% ELs Who
Speak Spanish
Academic Indicators Reclassification IndicatorsCST ELA Ever-EL Proficiency
CELDT Advancement
Long-Term ELs
3-Yr Avg. Reclassification Rate
Grade 3 Grade 8 Grade 11 Elem. Middle High
Patterson Joint Unified Stanislaus 5,888 72% 31% 95% 27% 29% 26% 53% 44% 7% 5% 8%Pierce Joint Unified Colusa 1,377 75% 30% 98% 27% 36% 36% 59% 26% 13% 20% 26%Pittsburg Unified Contra Costa 10,560 82% 32% 91% 36% 32% 28% 55% 39% 11% 14% 8%Pomona Unified Los Angeles 27,186 81% 37% 96% 25% 31% 30% 51% 40% 9% 10% 10%Porterville Unified Tulare 13,835 83% 24% 97% 20% 38% 26% 56% 41% 7% 8% 11%Reef-Sunset Unified Kings 2,643 100% 56% 98% 13% 22% 27% 43% 41% 10% 10% 15%Rialto Unified San Bernardino 26,596 73% 26% 98% 24% 35% 31% 55% 43% 11% 17% 15%Riverbank Unified Stanislaus 2,794 78% 43% 98% 13% 34% 20% 57% 44% 4% 9% 19%Riverdale Joint Unified Fresno 1,568 85% 26% 97% 49% 45% 38% 54% 22% 18% 41% 9%Riverside Unified Riverside 42,560 64% 16% 94% 31% 42% 32% 56% 38% 16% 17% 12%Rowland Unified Los Angeles 15,501 67% 27% 78% 34% 56% 41% 59% 37% 15% 15% 11%Sacramento City Unified Sacramento 47,616 72% 22% 58% 26% 43% 33% 55% 39% 8% 9% 6%San Bernardino City Unified San Bernardino 54,102 91% 27% 97% 23% 41% 27% 52% 35% 11% 14% 10%San Diego Unified San Diego 130,270 63% 26% 76% 36% 42% 37% 56% 32% 10% 14% 9%San Jacinto Unified Riverside 10,041 77% 21% 96% 22% 41% 34% 55% 42% 12% 15% 11%San Leandro Unified Alameda 8,704 65% 24% 71% 30% 36% 32% 57% 28% 15% 22% 18%San Lorenzo Unified Alameda 12,270 61% 27% 75% 30% 44% 38% 51% 25% 10% 46% 22%San Pasqual Valley Unified Imperial 770 98% 26% 100% 44% 41% 3% 3% 6%Sanger Unified Fresno 10,916 74% 19% 85% 43% 53% 36% 57% 34% 14% 18% 12%Santa Ana Unified Orange 57,410 84% 46% 99% 26% 37% 32% 53% 39% 13% 18% 13%Selma Unified Fresno 6,453 88% 30% 95% 36% 60% 35% 63% 38% 15% 18% 10%Shandon Joint Unified San Luis Obispo 308 64% 36% 100% 66% 51% 4% 4% 3%Soledad Unified Monterey 4,708 91% 46% 99% 41% 30% 18% 56% 44% 9% 9% 7%Southern Kern Unified Kern 3,035 77% 15% 99% 15% 23% 32% 50% 26% 3% 11% 2%Stockton Unified San Joaquin 38,435 86% 27% 84% 16% 36% 25% 45% 28% 13% 12% 9%Tulelake Basin Joint Unified Modoc 471 78% 45% 100% 19% 66% 45% 0% 0%Turlock Unified Stanislaus 13,956 62% 26% 83% 26% 41% 36% 58% 44% 5% 6% 9%Twin Rivers Unified Sacramento 31,420 76% 26% 57% 26% 37% 31% 50% 38% 11% 12% 9%Ukiah Unified Mendocino 6,163 69% 25% 98% 12% 33% 24% 52% 33% 7% 11% 16%Val Verde Unified Riverside 19,832 83% 25% 97% 39% 44% 36% 58% 38% 12% 17% 12%Vallejo City Unified Solano 15,157 65% 16% 81% 28% 27% 25% 48% 25% 15% 17% 15%Visalia Unified Tulare 27,617 64% 16% 90% 28% 49% 30% 51% 36% 12% 14% 12%Washington Unified Fresno 3,103 93% 36% 86% 23% 36% 25% 54% 57%Washington Unified Yolo 7,697 63% 20% 65% 26% 50% 36% 54% 32% 15% 15% 15%West Contra Costa Unified Contra Costa 30,398 69% 33% 83% 28% 34% 21% 48% 29% 11% 10% 5%West Covina Unified Los Angeles 14,460 65% 7% 78% 65% 53% 43% 69% 30% 20% 27% 19%Williams Unified Colusa 1,324 77% 50% 99% 18% 21% 9% 9% 24%Willits Unified Mendocino 1,992 65% 10% 96% 12% 60% 34% 6% 8% 10%Willows Unified Glenn 1,467 66% 24% 88% 3% 49% 29% 53% 35% 4% 7% 22%Winters Joint Unified Yolo 1,522 63% 35% 99% 19% 34% 50% 63% 43% 1% 20% 15%Woodland Joint Unified Yolo 10,126 65% 25% 92% 31% 39% 27% 57% 38% 14% 14% 19%Yuba City Unified Sutter 13,298 67% 19% 69% 37% 47% 31% 60% 27% 12% 18% 18%
Lower Poverty, Predominately Spanish-Speaking DistrictsABC Unified Los Angeles 20,845 52% 20% 69% 49% 54% 51% 67% 39% 11% 12% 12%Acton-Agua Dulce Unified Los Angeles 1,542 34% 13% 96% 63% 40% 2% 0% 2%Aromas/San Juan Unified San Benito 1,170 57% 29% 96% 25% 65% 59% 27% 2% 2% 1%
= District ranks in the top 10 in this peer group for this indicator.
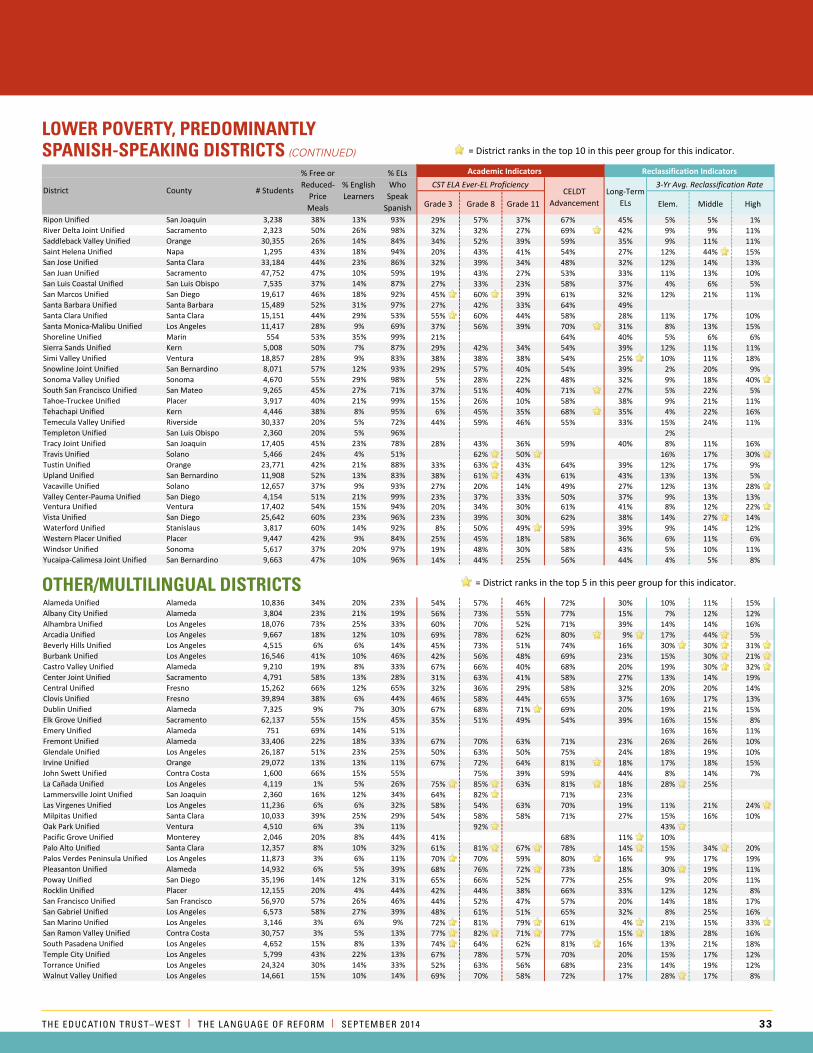
THE EducaTION TrusT–WEsT | THE LaNguagE Of rEfOrm | sEPTEmbEr 2014 33
APPendix A: dAtA by district
District County # Students
% Free or Reduced-
Price Meals
% English Learners
% ELs Who
Speak Spanish
Academic Indicators Reclassification IndicatorsCST ELA Ever-EL Proficiency
CELDT Advancement
Long-Term ELs
3-Yr Avg. Reclassification Rate
Grade 3 Grade 8 Grade 11 Elem. Middle High
Ventura Unified Ventura 17,402 54% 15% 94% 20% 34% 30% 61% 41% 8% 12% 22%Vista Unified San Diego 25,642 60% 23% 96% 23% 39% 30% 62% 38% 14% 27% 14%Waterford Unified Stanislaus 3,817 60% 14% 92% 8% 50% 49% 59% 39% 9% 14% 12%Western Placer Unified Placer 9,447 42% 9% 84% 25% 45% 18% 58% 36% 6% 11% 6%Windsor Unified Sonoma 5,617 37% 20% 97% 19% 48% 30% 58% 43% 5% 10% 11%Yucaipa-Calimesa Joint Unified San Bernardino 9,663 47% 10% 96% 14% 44% 25% 56% 44% 4% 5% 8%
Other/Multilingual DistrictsAlameda Unified Alameda 10,836 34% 20% 23% 54% 57% 46% 72% 30% 10% 11% 15%Albany City Unified Alameda 3,804 23% 21% 19% 56% 73% 55% 77% 15% 7% 12% 12%Alhambra Unified Los Angeles 18,076 73% 25% 33% 60% 70% 52% 71% 39% 14% 14% 16%Arcadia Unified Los Angeles 9,667 18% 12% 10% 69% 78% 62% 80% 9% 17% 44% 5%Beverly Hills Unified Los Angeles 4,515 6% 6% 14% 45% 73% 51% 74% 16% 30% 30% 31%Burbank Unified Los Angeles 16,546 41% 10% 46% 42% 56% 48% 69% 23% 15% 30% 21%Castro Valley Unified Alameda 9,210 19% 8% 33% 67% 66% 40% 68% 20% 19% 30% 32%Center Joint Unified Sacramento 4,791 58% 13% 28% 31% 63% 41% 58% 27% 13% 14% 19%Central Unified Fresno 15,262 66% 12% 65% 32% 36% 29% 58% 32% 20% 20% 14%Clovis Unified Fresno 39,894 38% 6% 44% 46% 58% 44% 65% 37% 16% 17% 13%Dublin Unified Alameda 7,325 9% 7% 30% 67% 68% 71% 69% 20% 19% 21% 15%Elk Grove Unified Sacramento 62,137 55% 15% 45% 35% 51% 49% 54% 39% 16% 15% 8%Emery Unified Alameda 751 69% 14% 51% 16% 16% 11%Fremont Unified Alameda 33,406 22% 18% 33% 67% 70% 63% 71% 23% 26% 26% 10%Glendale Unified Los Angeles 26,187 51% 23% 25% 50% 63% 50% 75% 24% 18% 19% 10%Irvine Unified Orange 29,072 13% 13% 11% 67% 72% 64% 81% 18% 17% 18% 15%John Swett Unified Contra Costa 1,600 66% 15% 55% 75% 39% 59% 44% 8% 14% 7%La Cañada Unified Los Angeles 4,119 1% 5% 26% 75% 85% 63% 81% 18% 28% 25%Lammersville Joint Unified San Joaquin 2,360 16% 12% 34% 64% 82% 71% 23%Las Virgenes Unified Los Angeles 11,236 6% 6% 32% 58% 54% 63% 70% 19% 11% 21% 24%Milpitas Unified Santa Clara 10,033 39% 25% 29% 54% 58% 58% 71% 27% 15% 16% 10%Oak Park Unified Ventura 4,510 6% 3% 11% 92% 43%Pacific Grove Unified Monterey 2,046 20% 8% 44% 41% 68% 11% 10%Palo Alto Unified Santa Clara 12,357 8% 10% 32% 61% 81% 67% 78% 14% 15% 34% 20%Palos Verdes Peninsula Unified Los Angeles 11,873 3% 6% 11% 70% 70% 59% 80% 16% 9% 17% 19%Pleasanton Unified Alameda 14,932 6% 5% 39% 68% 76% 72% 73% 18% 30% 19% 11%Poway Unified San Diego 35,196 14% 12% 31% 65% 66% 52% 77% 25% 9% 20% 11%Rocklin Unified Placer 12,155 20% 4% 44% 42% 44% 38% 66% 33% 12% 12% 8%San Francisco Unified San Francisco 56,970 57% 26% 46% 44% 52% 47% 57% 20% 14% 18% 17%San Gabriel Unified Los Angeles 6,573 58% 27% 39% 48% 61% 51% 65% 32% 8% 25% 16%San Marino Unified Los Angeles 3,146 3% 6% 9% 72% 81% 79% 61% 4% 21% 15% 33%San Ramon Valley Unified Contra Costa 30,757 3% 5% 13% 77% 82% 71% 77% 15% 18% 28% 16%South Pasadena Unified Los Angeles 4,652 15% 8% 13% 74% 64% 62% 81% 16% 13% 21% 18%Temple City Unified Los Angeles 5,799 43% 22% 13% 67% 78% 57% 70% 20% 15% 17% 12%Torrance Unified Los Angeles 24,324 30% 14% 33% 52% 63% 56% 68% 23% 14% 19% 12%Walnut Valley Unified Los Angeles 14,661 15% 10% 14% 69% 70% 58% 72% 17% 28% 17% 8%
= District ranks in the top 5 in this peer group for this indicator.
District County # Students
% Free or Reduced-
Price Meals
% English Learners
% ELs Who
Speak Spanish
Academic Indicators Reclassification IndicatorsCST ELA Ever-EL Proficiency
CELDT Advancement
Long-Term ELs
3-Yr Avg. Reclassification Rate
Grade 3 Grade 8 Grade 11 Elem. Middle High
Monrovia Unified Los Angeles 5,936 54% 12% 89% 17% 46% 39% 50% 22% 13% 28% 15%Moorpark Unified Ventura 6,984 34% 19% 93% 28% 42% 31% 54% 43% 4% 8% 12%Morgan Hill Unified Santa Clara 9,241 35% 19% 89% 30% 42% 43% 59% 42% 10% 11% 9%Mountain Empire Unified San Diego 2,961 48% 16% 98% 7% 6% 3% 64% 25% 2% 2% 1%Mt. Diablo Unified Contra Costa 32,001 45% 23% 84% 27% 32% 21% 55% 33% 9% 13% 7%Murrieta Valley Unified Riverside 22,929 33% 4% 69% 34% 43% 50% 14% 26% 14%Napa Valley Unified Napa 18,326 44% 20% 95% 22% 34% 28% 53% 29% 15% 19% 16%Natomas Unified Sacramento 12,454 53% 15% 55% 32% 48% 41% 69% 37% 8% 9% 12%New Haven Unified Alameda 12,873 49% 22% 53% 41% 49% 41% 56% 36% 18% 19% 7%Newark Unified Alameda 6,484 54% 24% 77% 37% 50% 43% 54% 27% 13% 15% 13%Newport-Mesa Unified Orange 22,003 45% 23% 94% 30% 39% 37% 65% 41% 7% 9% 9%Novato Unified Marin 8,049 36% 17% 88% 38% 30% 22% 64% 30% 8% 14% 5%Oakdale Joint Unified Stanislaus 5,295 43% 10% 97% 27% 40% 31% 58% 33% 10% 13% 30%Ojai Unified Ventura 2,879 47% 14% 95% 39% 49% 27% 63% 34% 8% 9% 16%Orange Unified Orange 29,854 47% 22% 92% 30% 46% 35% 65% 36% 11% 12% 11%Paso Robles Joint Unified San Luis Obispo 6,601 48% 20% 97% 28% 46% 26% 55% 37% 8% 21% 20%Placentia-Yorba Linda Unified Orange 25,622 27% 12% 88% 37% 45% 38% 61% 34% 15% 15% 22%Ramona City Unified San Diego 5,868 42% 13% 99% 23% 53% 26% 57% 44% 8% 10% 12%Redlands Unified San Bernardino 21,379 54% 9% 69% 40% 43% 41% 63% 38% 9% 9% 3%Redondo Beach Unified Los Angeles 8,967 20% 6% 58% 59% 58% 49% 71% 38% 19% 17% 13%Rim of the World Unified San Bernardino 4,013 52% 11% 98% 13% 38% 22% 64% 41% 6% 5% 3%Ripon Unified San Joaquin 3,238 38% 13% 93% 29% 57% 37% 67% 45% 5% 5% 1%River Delta Joint Unified Sacramento 2,323 50% 26% 98% 32% 32% 27% 69% 42% 9% 9% 11%Saddleback Valley Unified Orange 30,355 26% 14% 84% 34% 52% 39% 59% 35% 9% 11% 11%Saint Helena Unified Napa 1,295 43% 18% 94% 20% 43% 41% 54% 27% 12% 44% 15%San Jose Unified Santa Clara 33,184 44% 23% 86% 32% 39% 34% 48% 32% 12% 14% 13%San Juan Unified Sacramento 47,752 47% 10% 59% 19% 43% 27% 53% 33% 11% 13% 10%San Luis Coastal Unified San Luis Obispo 7,535 37% 14% 87% 27% 33% 23% 58% 37% 4% 6% 5%San Marcos Unified San Diego 19,617 46% 18% 92% 45% 60% 39% 61% 32% 12% 21% 11%Santa Barbara Unified Santa Barbara 15,489 52% 31% 97% 27% 42% 33% 64% 49%Santa Clara Unified Santa Clara 15,151 44% 29% 53% 55% 60% 44% 58% 28% 11% 17% 10%Santa Monica-Malibu Unified Los Angeles 11,417 28% 9% 69% 37% 56% 39% 70% 31% 8% 13% 15%Shoreline Unified Marin 554 53% 35% 99% 21% 64% 40% 5% 6% 6%Sierra Sands Unified Kern 5,008 50% 7% 87% 29% 42% 34% 54% 39% 12% 11% 11%Simi Valley Unified Ventura 18,857 28% 9% 83% 38% 38% 38% 54% 25% 10% 11% 18%Snowline Joint Unified San Bernardino 8,071 57% 12% 93% 29% 57% 40% 54% 39% 2% 20% 9%Sonoma Valley Unified Sonoma 4,670 55% 29% 98% 5% 28% 22% 48% 32% 9% 18% 40%South San Francisco Unified San Mateo 9,265 45% 27% 71% 37% 51% 40% 71% 27% 5% 22% 5%Tahoe-Truckee Unified Placer 3,917 40% 21% 99% 15% 26% 10% 58% 38% 9% 21% 11%Tehachapi Unified Kern 4,446 38% 8% 95% 6% 45% 35% 68% 35% 4% 22% 16%Temecula Valley Unified Riverside 30,337 20% 5% 72% 44% 59% 46% 55% 33% 15% 24% 11%Templeton Unified San Luis Obispo 2,360 20% 5% 96% 2%Tracy Joint Unified San Joaquin 17,405 45% 23% 78% 28% 43% 36% 59% 40% 8% 11% 16%Travis Unified Solano 5,466 24% 4% 51% 62% 50% 16% 17% 30%Tustin Unified Orange 23,771 42% 21% 88% 33% 63% 43% 64% 39% 12% 17% 9%Upland Unified San Bernardino 11,908 52% 13% 83% 38% 61% 43% 61% 43% 13% 13% 5%Vacaville Unified Solano 12,657 37% 9% 93% 27% 20% 14% 49% 27% 12% 13% 28%Valley Center-Pauma Unified San Diego 4,154 51% 21% 99% 23% 37% 33% 50% 37% 9% 13% 13%
othEr/multilingual districts
loWEr PovErty, PrEdominantly sPanish-sPEaking districts (COnTInuED)
District County # Students
% Free or Reduced-
Price Meals
% English Learners
% ELs Who
Speak Spanish
Academic Indicators Reclassification IndicatorsCST ELA Ever-EL Proficiency
CELDT Advancement
Long-Term ELs
3-Yr Avg. Reclassification Rate
Grade 3 Grade 8 Grade 11 Elem. Middle High
Patterson Joint Unified Stanislaus 5,888 72% 31% 95% 27% 29% 26% 53% 44% 7% 5% 8%Pierce Joint Unified Colusa 1,377 75% 30% 98% 27% 36% 36% 59% 26% 13% 20% 26%Pittsburg Unified Contra Costa 10,560 82% 32% 91% 36% 32% 28% 55% 39% 11% 14% 8%Pomona Unified Los Angeles 27,186 81% 37% 96% 25% 31% 30% 51% 40% 9% 10% 10%Porterville Unified Tulare 13,835 83% 24% 97% 20% 38% 26% 56% 41% 7% 8% 11%Reef-Sunset Unified Kings 2,643 100% 56% 98% 13% 22% 27% 43% 41% 10% 10% 15%Rialto Unified San Bernardino 26,596 73% 26% 98% 24% 35% 31% 55% 43% 11% 17% 15%Riverbank Unified Stanislaus 2,794 78% 43% 98% 13% 34% 20% 57% 44% 4% 9% 19%Riverdale Joint Unified Fresno 1,568 85% 26% 97% 49% 45% 38% 54% 22% 18% 41% 9%Riverside Unified Riverside 42,560 64% 16% 94% 31% 42% 32% 56% 38% 16% 17% 12%Rowland Unified Los Angeles 15,501 67% 27% 78% 34% 56% 41% 59% 37% 15% 15% 11%Sacramento City Unified Sacramento 47,616 72% 22% 58% 26% 43% 33% 55% 39% 8% 9% 6%San Bernardino City Unified San Bernardino 54,102 91% 27% 97% 23% 41% 27% 52% 35% 11% 14% 10%San Diego Unified San Diego 130,270 63% 26% 76% 36% 42% 37% 56% 32% 10% 14% 9%San Jacinto Unified Riverside 10,041 77% 21% 96% 22% 41% 34% 55% 42% 12% 15% 11%San Leandro Unified Alameda 8,704 65% 24% 71% 30% 36% 32% 57% 28% 15% 22% 18%San Lorenzo Unified Alameda 12,270 61% 27% 75% 30% 44% 38% 51% 25% 10% 46% 22%San Pasqual Valley Unified Imperial 770 98% 26% 100% 44% 41% 3% 3% 6%Sanger Unified Fresno 10,916 74% 19% 85% 43% 53% 36% 57% 34% 14% 18% 12%Santa Ana Unified Orange 57,410 84% 46% 99% 26% 37% 32% 53% 39% 13% 18% 13%Selma Unified Fresno 6,453 88% 30% 95% 36% 60% 35% 63% 38% 15% 18% 10%Shandon Joint Unified San Luis Obispo 308 64% 36% 100% 66% 51% 4% 4% 3%Soledad Unified Monterey 4,708 91% 46% 99% 41% 30% 18% 56% 44% 9% 9% 7%Southern Kern Unified Kern 3,035 77% 15% 99% 15% 23% 32% 50% 26% 3% 11% 2%Stockton Unified San Joaquin 38,435 86% 27% 84% 16% 36% 25% 45% 28% 13% 12% 9%Tulelake Basin Joint Unified Modoc 471 78% 45% 100% 19% 66% 45% 0% 0%Turlock Unified Stanislaus 13,956 62% 26% 83% 26% 41% 36% 58% 44% 5% 6% 9%Twin Rivers Unified Sacramento 31,420 76% 26% 57% 26% 37% 31% 50% 38% 11% 12% 9%Ukiah Unified Mendocino 6,163 69% 25% 98% 12% 33% 24% 52% 33% 7% 11% 16%Val Verde Unified Riverside 19,832 83% 25% 97% 39% 44% 36% 58% 38% 12% 17% 12%Vallejo City Unified Solano 15,157 65% 16% 81% 28% 27% 25% 48% 25% 15% 17% 15%Visalia Unified Tulare 27,617 64% 16% 90% 28% 49% 30% 51% 36% 12% 14% 12%Washington Unified Fresno 3,103 93% 36% 86% 23% 36% 25% 54% 57%Washington Unified Yolo 7,697 63% 20% 65% 26% 50% 36% 54% 32% 15% 15% 15%West Contra Costa Unified Contra Costa 30,398 69% 33% 83% 28% 34% 21% 48% 29% 11% 10% 5%West Covina Unified Los Angeles 14,460 65% 7% 78% 65% 53% 43% 69% 30% 20% 27% 19%Williams Unified Colusa 1,324 77% 50% 99% 18% 21% 9% 9% 24%Willits Unified Mendocino 1,992 65% 10% 96% 12% 60% 34% 6% 8% 10%Willows Unified Glenn 1,467 66% 24% 88% 3% 49% 29% 53% 35% 4% 7% 22%Winters Joint Unified Yolo 1,522 63% 35% 99% 19% 34% 50% 63% 43% 1% 20% 15%Woodland Joint Unified Yolo 10,126 65% 25% 92% 31% 39% 27% 57% 38% 14% 14% 19%Yuba City Unified Sutter 13,298 67% 19% 69% 37% 47% 31% 60% 27% 12% 18% 18%
Lower Poverty, Predominately Spanish-Speaking DistrictsABC Unified Los Angeles 20,845 52% 20% 69% 49% 54% 51% 67% 39% 11% 12% 12%Acton-Agua Dulce Unified Los Angeles 1,542 34% 13% 96% 63% 40% 2% 0% 2%Aromas/San Juan Unified San Benito 1,170 57% 29% 96% 25% 65% 59% 27% 2% 2% 1%
= District ranks in the top 10 in this peer group for this indicator.
District County # Students
% Free or Reduced-
Price Meals
% English Learners
% ELs Who
Speak Spanish
Academic Indicators Reclassification IndicatorsCST ELA Ever-EL Proficiency
CELDT Advancement
Long-Term ELs
3-Yr Avg. Reclassification Rate
Grade 3 Grade 8 Grade 11 Elem. Middle High
Ventura Unified Ventura 17,402 54% 15% 94% 20% 34% 30% 61% 41% 8% 12% 22%Vista Unified San Diego 25,642 60% 23% 96% 23% 39% 30% 62% 38% 14% 27% 14%Waterford Unified Stanislaus 3,817 60% 14% 92% 8% 50% 49% 59% 39% 9% 14% 12%Western Placer Unified Placer 9,447 42% 9% 84% 25% 45% 18% 58% 36% 6% 11% 6%Windsor Unified Sonoma 5,617 37% 20% 97% 19% 48% 30% 58% 43% 5% 10% 11%Yucaipa-Calimesa Joint Unified San Bernardino 9,663 47% 10% 96% 14% 44% 25% 56% 44% 4% 5% 8%
Other/Multilingual DistrictsAlameda Unified Alameda 10,836 34% 20% 23% 54% 57% 46% 72% 30% 10% 11% 15%Albany City Unified Alameda 3,804 23% 21% 19% 56% 73% 55% 77% 15% 7% 12% 12%Alhambra Unified Los Angeles 18,076 73% 25% 33% 60% 70% 52% 71% 39% 14% 14% 16%Arcadia Unified Los Angeles 9,667 18% 12% 10% 69% 78% 62% 80% 9% 17% 44% 5%Beverly Hills Unified Los Angeles 4,515 6% 6% 14% 45% 73% 51% 74% 16% 30% 30% 31%Burbank Unified Los Angeles 16,546 41% 10% 46% 42% 56% 48% 69% 23% 15% 30% 21%Castro Valley Unified Alameda 9,210 19% 8% 33% 67% 66% 40% 68% 20% 19% 30% 32%Center Joint Unified Sacramento 4,791 58% 13% 28% 31% 63% 41% 58% 27% 13% 14% 19%Central Unified Fresno 15,262 66% 12% 65% 32% 36% 29% 58% 32% 20% 20% 14%Clovis Unified Fresno 39,894 38% 6% 44% 46% 58% 44% 65% 37% 16% 17% 13%Dublin Unified Alameda 7,325 9% 7% 30% 67% 68% 71% 69% 20% 19% 21% 15%Elk Grove Unified Sacramento 62,137 55% 15% 45% 35% 51% 49% 54% 39% 16% 15% 8%Emery Unified Alameda 751 69% 14% 51% 16% 16% 11%Fremont Unified Alameda 33,406 22% 18% 33% 67% 70% 63% 71% 23% 26% 26% 10%Glendale Unified Los Angeles 26,187 51% 23% 25% 50% 63% 50% 75% 24% 18% 19% 10%Irvine Unified Orange 29,072 13% 13% 11% 67% 72% 64% 81% 18% 17% 18% 15%John Swett Unified Contra Costa 1,600 66% 15% 55% 75% 39% 59% 44% 8% 14% 7%La Cañada Unified Los Angeles 4,119 1% 5% 26% 75% 85% 63% 81% 18% 28% 25%Lammersville Joint Unified San Joaquin 2,360 16% 12% 34% 64% 82% 71% 23%Las Virgenes Unified Los Angeles 11,236 6% 6% 32% 58% 54% 63% 70% 19% 11% 21% 24%Milpitas Unified Santa Clara 10,033 39% 25% 29% 54% 58% 58% 71% 27% 15% 16% 10%Oak Park Unified Ventura 4,510 6% 3% 11% 92% 43%Pacific Grove Unified Monterey 2,046 20% 8% 44% 41% 68% 11% 10%Palo Alto Unified Santa Clara 12,357 8% 10% 32% 61% 81% 67% 78% 14% 15% 34% 20%Palos Verdes Peninsula Unified Los Angeles 11,873 3% 6% 11% 70% 70% 59% 80% 16% 9% 17% 19%Pleasanton Unified Alameda 14,932 6% 5% 39% 68% 76% 72% 73% 18% 30% 19% 11%Poway Unified San Diego 35,196 14% 12% 31% 65% 66% 52% 77% 25% 9% 20% 11%Rocklin Unified Placer 12,155 20% 4% 44% 42% 44% 38% 66% 33% 12% 12% 8%San Francisco Unified San Francisco 56,970 57% 26% 46% 44% 52% 47% 57% 20% 14% 18% 17%San Gabriel Unified Los Angeles 6,573 58% 27% 39% 48% 61% 51% 65% 32% 8% 25% 16%San Marino Unified Los Angeles 3,146 3% 6% 9% 72% 81% 79% 61% 4% 21% 15% 33%San Ramon Valley Unified Contra Costa 30,757 3% 5% 13% 77% 82% 71% 77% 15% 18% 28% 16%South Pasadena Unified Los Angeles 4,652 15% 8% 13% 74% 64% 62% 81% 16% 13% 21% 18%Temple City Unified Los Angeles 5,799 43% 22% 13% 67% 78% 57% 70% 20% 15% 17% 12%Torrance Unified Los Angeles 24,324 30% 14% 33% 52% 63% 56% 68% 23% 14% 19% 12%Walnut Valley Unified Los Angeles 14,661 15% 10% 14% 69% 70% 58% 72% 17% 28% 17% 8%
= District ranks in the top 5 in this peer group for this indicator.
34 THE EducaTION TrusT–WEsT | THE LaNguagE Of rEfOrm | sEPTEmbEr 2014
mEthodologyTo create our sample, we selected unified districts that enrolled at least 100 english learner students in the 2012-13 academic year. This yielded a total of 276 districts.
PEEr grouPingsWe used basic correlation and regression analyses to examine the relationships between certain demographic characteristics and metrics such as english learner academic achievement. This analysis revealed that districts with substantial numbers of students living in poverty and with larger proportions of spanish-speaking english learners face additional obstacles to achievement. in recognition of the relationship between performance, poverty, and the concentration of spanish-speaking students, we separated all districts in our sample into three distinct peer groupings.
1. Higher poverty, predominantly Spanish-speaking: This group includes 135 districts offering at least 60 percent students eligible for free or reduced-price meals (fRpm) and at least 50 percent (that is, the majority) english learners speaking spanish as their primary language. We selected 60 percent as the fRpm cutoff because of its proximity to the state average of 59 percent.
2. lower poverty, predominantly Spanish-speaking: This group includes 105 districts offering less than 60 percent students eligible for free or reduced-price meals and with at least 50 percent of english learners speaking spanish as their primary language.
3. other/multilingual: This group includes 36 districts in which a) at least 50 percent of english learners speak a primary language other than spanish; and/or b) at least three distinct languages are spoken by 10 percent or more of english learner students. (see the explanation of multilingual districts in the right-hand column for additional details.) Three predominantly spanish-speaking districts that also meet the multilingual criteria – emery unified, John swett unified, and Central unified – are included here to ensure each district falls into only one peer group.
We selected roughly 10 percent of each sample as “top” districts, yielding 15 higher poverty, predominately spanish-speaking districts, 10 lower poverty, predominately spanish-speaking districts, and 5 other language/multilingual districts.
data sourcEs and calculations Data Used to create peer Groupings
School Districts: We downloaded the public schools database file on 9/20/13 from the California department of education (Cde) website at http://www.cde.ca.gov/ds/si/ds/pubschls.asp. from this file, we identified all active, unified school districts.
percent Free or reduced-price meals (Frpm): We downloaded the 2012-13 unduplicated student poverty – free or Reduced-price meals data file on 11/11/13 from the Cde website at http://www.cde.ca.gov/ds/sd/sd/filessp.asp. We aggregated school-level counts of students eligible for fRpm to the district level. We then divided this figure by the district’s total K-12 enrollment in order to arrive at the percent fRpm students in each district.
percent english learners by language: We downloaded the 2012-13 english Learners by grade and Language file on 4/18/14 from the Cde website at http://www.cde.ca.gov/ds/sd/sd/fileselsch.asp. We then aggregated the school-level data to the district level in order to arrive at the number of english learner students speaking each language in a district. We calculated the percent of english learners speaking each language by dividing the number of students for each language in a district by the total english learner count. We used the same method to calculate the percent of english learners speaking each of the other district languages.
multilingual districts: after calculating the percent of english learners that speak each language from the english Learners by grade and Language file, we counted the number of languages that are spoken by at least 10 percent of the english learner students. We considered districts to be multilingual if three or more languages are spoken by 10 percent or more of their english learners.
APPendix b: dAtA sOurces And methOdOLOgy
THE EducaTION TrusT–WEsT | THE LaNguagE Of rEfOrm | sEPTEmbEr 2014 35
data usEd to crEatE outcomE mEtricscSt elA “ever-el” proficiency: We downloaded the 2013 sTaR Test Results file on 4/24/14 from the Cde website at http://star.cde.ca.gov/star2013/index.aspx. We filtered the file to include the percentage of students proficient or advanced on the CsT english Language arts exam, by unified district, by subgroup (eL, Rfep), and by grade level (3, 8, 11). for each grade level, we then summed the number of english learners and Rfeps who were proficient or advanced, dividing this figure by the total number of english learners and Rfeps with scores. This yielded the percentage of third, eighth, and 11th grade “ever-eL” students who, respectively, scored proficient or advanced. (for districts that had fewer than 11 students in either the english learner or Rfep subgroup and whose count of students proficient/advanced was therefore not large enough to be reported by Cde, we only included the subgroup having a sufficient n size as counting toward “ever-eL” proficiency. further, “ever-eL” proficiency rates were only included for districts that had at least 20 students in the Rfep subgroup within each respective grade in grades 3, 8, and 11 in the 2012-13 year.)
celDt Advancement: We downloaded the 2012-13 federal Title iii file on 7/3/14 from the Cde website at http://www.cde.ca.gov/ta/ac/t3/t3datafiles.asp. The file includes the percent of english learners that met the amao i objective (defined as the percent of english learners making annual progress in learning english, as measured by the CeLdT) for those districts receiving Title iii funds.
long-term english learner (ltel) rate: We downloaded the 2012-13 federal Title iii file on 7/3/14 from the Cde website at http://www.cde.ca.gov/ta/ac/t3/t3datafiles.asp. for each district, we divided the number of english learners in the cohort for five or more years by the sum of the number of english learners in the cohort for fewer than five years and the number of english learners in the cohort for five years or longer. This yielded the percent of LTeL students by district.
three-year reclassification rates: We downloaded the 2009-10 and 2010-11 eL services, Reclassification, & Waivers files and the 2011-12 and 2012-13 eL
Reclassification data files on 3/31/14 from the Cde websites at http://www.cde.ca.gov/ds/sd/sd/fileslcp234.asp and http://www.cde.ca.gov/ds/sd/sd/filesreclass.asp. from these files, we calculated three-year average reclassification rates by district and grade span. first, we divided the number of english learners reclassified in a given year at the school level by the total number of english learners from the prior year file (because this denominator is not contained in the current year file). To calculate the grade-span reclassification rates, we utilized the 2012-13 public schools database file to pull the grades offered for each school. We then coded each school as either elementary, middle, or high school, with schools offering grades K-5 coded as elementary, schools offering grades 6-8 coded as middle, and schools offering grades 9-12 as high. schools spanning more than one school category were counted in multiple samples. We then merged the school-level information from the reclassification files with these codes and summed the student counts to the district level. finally, we averaged the percentage of students reclassified across 2010-11, 2011-12, and 2012-13 by grade-level spans. Three-year average reclassification rates by grade span were included for all districts having an average of at least 20 english learner students within each respective grade span in each of the three years.
data includEd in aPPEndix a: data By districtNumber of Students: We downloaded the 2012-13 enrollment by school file on 1/29/14 from the Cde website at http://www.cde.ca.gov/ds/sd/sd/filesenr.asp. We aggregated school-level enrollment figures to the district level in order to arrive at total enrollment counts for each district.
percent english learners: To calculate the number of english learners in each district, we downloaded the 2012-13 english Learners by grade and Language file on 4/18/14 from the Cde website at http://www.cde.ca.gov/ds/sd/sd/fileselsch.asp. We aggregated the school-level data to the district level in order to arrive at the total english learner count. english learner rates were calculated by dividing the total number of english learners by the total district enrollment (from the enrollment by school file) for each district.
APPendix b: dAtA sOurces And methOdOLOgy
36 THE EducaTION TrusT–WEsT | THE LaNguagE Of rEfOrm | sEPTEmbEr 2014
1. Camille Ryan, u.s. department of Commerce, u.s.
Census Bureau, “Language use in the united states:
2011” (aCs-22) (Washington, d.C.: u.s. Census Bureau,
2013): 10. California department of education, dataQuest,
2013-14 “english Learner students by grade and
Language,” available at http://data1.cde.ca.gov/dataquest/
searchname.asp?rbTimeframe=oneyear&rYear=2013-
14&Topic=LC&Level=state&submit1=submit.
2. California Legislative analyst’s office, “analysis of the
2007-2008 Budget Bill: education” (sacramento, Ca:
Legislative analyst’s office, 2007): 122.
3. California department of education, dataQuest, 2012-13
“sTaR Test Results,” available at http://data1.cde.ca.gov/
dataquest/searchname.asp?rbTimeframe=oneyear&rYe
ar=2012-13&Topic=sTaR&Level=state&submit1=subm
it. only 18 percent of english learners scored proficient
or advanced on the third grade CsT eLa exam in 2013,
compared to 54 percent of english-only students; the
2013 cohort dropout rate for english learners was 22
percent, while the statewide average was 12 percent.
4. Laura hill, margaret Weston, and Joseph hayes,
“Reclassification of english Learner students in
California” (sacramento, Ca: public policy institute of
California, 2014).This study found that 74 percent of
english learners made on-time grade progression by
advancing one grade per school year, compared to 80
percent of english-only students.
5. California department of education, “Title iii
accountability data files,” available at http://www.cde.
ca.gov/ta/ac/t3/t3datafiles.asp. according to the 2012-13
federal Title iii file, 35 percent of english learners remain
in status for five years or more.
6. California education Code, section 313.
7. California department of education, “California english
Language development Test (CeLdT): 2012-13 CeLdT
information guide” (sacramento, Ca: California
department of education, 2012).
8. u.s. department of education, national Center for
education statistics, “The Condition of education: english
Language Learners” (Washington, d.C.: national Center
for education statistics, 2014).
9. California department of education, dataQuest, 2013-14
“number of english Learners,” available at http://data1.
cde.ca.gov/dataquest/lc/numberelstate.asp?Level=state
&TheYear=2013-14.
10. California department of education, dataQuest, 2013-
14 “number and percent of students Redesignated to
fep,” available at http://data1.cde.ca.gov/dataquest/Cbed
s1asp?enroll=on&pcteL=on&pctfep=on&pctRe=on&cC
hoice=statprof1&cYear=2013-14.
11. California department of education, dataQuest,
2013-14 “number of fluent-english-proficient (fep)
by Language,” available at http://data1.cde.ca.gov/
dataquest/searchname.asp?rbTimeframe=oneyear&rYe
ar=2013-14&Topic=LC&Level=state&submit1=submit.
12. California Legislative analyst’s office, “analysis of the
2007-2008 Budget Bill: education” (sacramento, Ca:
Legislative analyst’s office, 2007): 122.
13. California department of education, dataQuest, 2013-14
“number of english Learners by Language,” available at
http://data1.cde.ca.gov/dataquest/searchname.asp?rbTi
meframe=oneyear&rYear=2013-14&Topic=LC&Level=st
ate&submit1=submit.
14. assembly Bill (aB) 484, signed into law in october
2013, suspended the CsTs and ushered in the smarter
Balanced assessments. These new tests were field
tested in 2013-14 and will be fully implemented in
the 2014-15 school year in an effort to create greater
alignment with Common Core.
15. in 2012, the governor signed assembly Bill (aB) 2193,
which creates a state definition for long-term english
Learners. These are students who are in the sixth grade
or above, have been in u.s. schools for more than six
years, have remained at the same english proficiency
level for two or more years in a row, and score below
basic on the state english language arts test. While
districts have access to recently released data for their
own students, those data were not available statewide
when this report went to press. Therefore, for this
report, we have looked at the u.s. department of
education’s Title iii accountability data, which tell us how
many students have been classified as english learners
for five years or more.
endnOtes
THE EducaTION TrusT–WEsT | THE LaNguagE Of rEfOrm | sEPTEmbEr 2014 37
16. We included only unified districts in our analysis for a
number of reasons. first, it is important for comparison
purposes to analyze districts with common grade levels.
We also found that unified districts capture the majority
(approximately 70 percent) of english learners and all
students in California public schools. additionally, in
serving K-12 students, unified districts are exposed to a
broad spectrum of issues, such as reclassification, that
are related to serving english learners.
17. We chose to include districts that serve at least 100
english learner students to highlight districts with a
sizable english learner population.
18. We define “primary languages” as those languages
spoken by at least 10 percent of a district’s english learner
population.
19. other researchers have called for this type of analysis,
including: megan hopkins, Karen Thompson, Robert
Linquanti, Kenji hakuta, and diane august. “fully
accounting for english Learner performance: a Key issue
in esea Reauthorization,” educational Researcher 42, no.
2 (march 2013): 101-108; and William saunders and david
marcelletti, “The gap that Can’t go away: The Catch-22
of Reclassification in monitoring the progress of english
Learners,” educational evaluation and policy analysis 35,
no. 2 (June 2013): 139-156.
20. Laura hill, margaret Weston, and Joseph hayes.
“Reclassification of english Learner students in
California” (sacramento, Ca: public policy institute of
California, 2014).
21. William saunders and david marcelletti, “The gap that
Can’t go away: The Catch-22 of Reclassification in
monitoring the progress of english Learners,” educational
evaluation and policy analysis 35, no. 2 (June 2013): 139-
156.
22. Because not all districts in California receive Title iii
funds, 10 districts in our analysis do not have data for this
indicator.
23. Laurie olsen, “Reparable harm: fulfilling the unkept
promise of educational opportunity for California’s Long
Term english Learners” (Long Beach, Ca: Californians
Together, 2010). This study of 175,000 english learners
in grades 6-12 demonstrated that 59 percent had been
in California schools for six or more years. The most
common placement for these students was mainstream
core classes with no additional support for students’
language development or instruction. additionally,
LTeLs were over-represented in intervention classes not
designed for english learners, thereby keeping them out
of core courses.
24. Long-term english learner (LTeL) rates may also be a
partial reflection of a district’s special education rate, as
a disproportionate share of LTeLs also qualify for special
education services. many districts are concerned with
how to appropriately identify english learners for special
education while also ensuring students’ needs are met.
25. see, for example: Joseph Robinson, “evaluating Criteria
for english Learner Reclassification: a Causal-effects
approach using a Binding-score Regression discontinuity
design with instrumental Variables,” educational evaluation
and policy analysis 33, no. 3 (september 2011): 267-292.
26. This differs from the state definition. Because statewide
long-term english learner data were not yet available at
the time of release of this report, we use data from the
federal Title iii file where district-level information about
LTeLs is housed. This figure tells us how many students
have been classified as english learners for five years or
more.
27. Laura hill, margaret Weston, and Joseph hayes.
“Reclassification of english Learner students in
California” (sacramento, Ca: public policy institute of
California, 2014).
28. ibid. This study found that districts applying stricter
standards for reclassification than outlined in state
guidelines is associated with slightly better outcomes for
students after they are reclassified.
29. patricia gándara and maria estela Zárate, “seizing the
opportunity to narrow the achievement gap for english
Learners” (Los angeles: The Civil Rights project, 2014).
30. ilana umansky and sean Reardon, “Reclassification
patterns among Latino english Learner students in
Bilingual, dual immersion, and english immersion
Classrooms,” american educational Research Journal
(august 2014); 1-34.
38 THE EducaTION TrusT–WEsT | THE LaNguagE Of rEfOrm | sEPTEmbEr 2014
We are grateful to the researchers, advocates, and other experts who shared their insights, expertise, and experiences along the way. They include susan Baker, associate professor of education at sacramento state university; Karen Cadiero-Kaplan, professor, san diego state university, and current director of the english Learner support division at the California department of education; martha Castellón, executive director of understanding Language at stanford university; patricia gándara, professor of education at university of California, Los angeles; Jan gustafson-Corea, Chief executive officer of the California association for Bilingual education; Kenji hakuta, professor of education and Co-chair of the understanding Language initiative at stanford university; magaly Lavadenz, professor and director at the Center for equity for english Learners at Loyola marymount university; Robert Linquanti, project director for english Learner evaluation and accountability support and senior Research associate for the California Comprehensive Center at Wested; Jan mayer, Curriculum specialist for english Learners at the sacramento County office of education; Laurie olsen, director of the sobrato early academic Literacy initiative; sean Reardon, professor of education at stanford university; shelly spiegel-Coleman, executive director of Californians Together; pamela spycher, senior Research associate at Wested; Karen Thompson, assistant professor at
oregon state university; ilana umansky, assistant professor at the university or oregon; Rachel Valentino, Researcher, Center for education policy analysis at stanford university; aida Walqui, director of Teacher professional development program and senior Research associate at Wested; martha Zaragoza-diaz, Legislative Lobbyist for California association for Bilingual education and Californians Together; and Jeff Zwiers, senior Researcher for the understanding Language initiative at stanford university and Co-director of the academic Language development network.
We also offer a special thanks to the California practitioners who generously shared their time, perspectives, stories, and experiences with us. They include educators and administrators from: Baldwin park unified school district, Calipatria unified school district, Camino nuevo Charter academy, downey unified, galt Joint union elementary school district, Laurel street elementary school, Los alamitos unified school district, oakland international high school, Riverdale Joint unified school district, san francisco unified school district, san francisco international high school, selma unified school district, and West Covina unified school district.
The education Trust–West acknowledges the Bill & melinda gates foundation for their generous support of this work.
AcknOwLedgements


1814 franklin street, suite 220 | oakland, California 94612 | 510.465.6444
www.edtrustwest.org
our missionThe education Trust–West works for
the high academic achievement of all students
at all levels, pre-k through college. We expose
opportunity and achievement gaps that separate
students of color and low-income students from
other youth, and we identify and advocate for the
strategies that will forever close those gaps.