k-12 it leadership survey report - cosn · cosn 2017 k-12 it leadership survey 3 overview...
TRANSCRIPT
2017 K-12 IT Leadership
Survey Report
Sponsored by:
In partnership with:
CoSN 2017 K-12 IT Leadership Survey 2
Table of Contents
Overview...................................................................................................3Introduction ......................................................................................... 3 Top 10 Findings .................................................................................... 4
AbouttheSchoolSystems.........................................................................5Demographics ...................................................................................... 5
ITLeaderProfiles.......................................................................................6Education ............................................................................................ 6 Professional Background ........................................................................ 8 Experience ........................................................................................... 9 Diversity ............................................................................................ 10
TechnologyLeadershipinSchoolSystems...............................................11Titles ................................................................................................. 11 Responsibilities ................................................................................... 12 Purchasing involvement ....................................................................... 13 Salaries ............................................................................................. 14
DistrictInitiatives....................................................................................15Top Priorities ...................................................................................... 15 Privacy & Security ............................................................................... 16 Bring Your Own Device (BYOD) ............................................................. 17 Open Educational Resources (OER) ........................................................ 18 Interoperability ................................................................................... 20
AboutTechnology...................................................................................22
AboutBudgets.........................................................................................24
AboutStaffing.........................................................................................27
AboutProfessionalDevelopment............................................................29
InClosing.................................................................................................32Summary ........................................................................................... 32 About CoSN ....................................................................................... 32 CoSN Resources ................................................................................. 33 About Our Partner ............................................................................... 34 About Our Sponsor .............................................................................. 34
CoSN 2017 K-12 IT Leadership Survey 3
Overview
Introduction
This is the 5th anniversary of the IT Leadership Survey. Since it launched in 2013, CoSN has
worked to get a better understanding of those responsible for managing IT in our K-12
institutions. Who are they? What are their priorities? What are their challenges? In order to
answer these and other questions, CoSN partners with MDR to deploy the survey to 120,000
U.S. school system technology leaders. This year’s report is based on 495 surveys completed in
January and February of 2017 and is produced with support from SchoolDude.
CoSN collected profile data such as backgrounds, job titles, and salaries, gaining insight into
how IT Leadership characteristics have changed over the past five years. Since 2015,
demographic data about race, ethnicity, and sex has been collected. This additional layer of
data continues to shed light on diversity and equity issues otherwise not apparent.
To enable year-over-year comparisons, CoSN tries to ensure consistency in the survey
questions. However, in the five-year span of the survey, revisions have been made to reflect
changing IT initiatives. There are major differences from the 2013 IT landscape. Questions
about the use of Facebook and Twitter, for example, have been replaced by questions on more
timely topics such as outsourcing and the use of OER. This year’s survey includes new
questions about personal use of online courses, peer-to-peer technology reviews, and
interoperability. From the personal to the technical, CoSN seeks to get a fuller picture of K-12
IT Leaders and the world in which they work. With this report, CoSN is able to share the most
significant findings.
CoSN 2017 K-12 IT Leadership Survey 4
Top 10 Findings
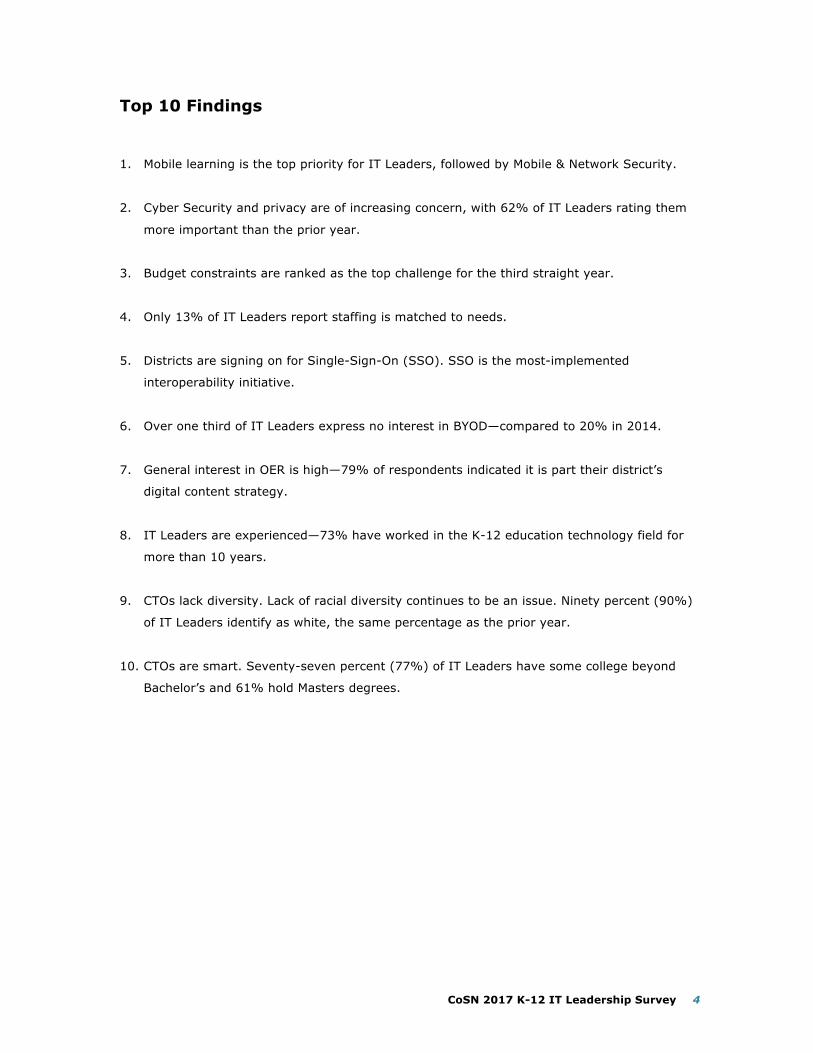
1. Mobile learning is the top priority for IT Leaders, followed by Mobile & Network Security.
2. Cyber Security and privacy are of increasing concern, with 62% of IT Leaders rating them
more important than the prior year.
3. Budget constraints are ranked as the top challenge for the third straight year.
4. Only 13% of IT Leaders report staffing is matched to needs.
5. Districts are signing on for Single-Sign-On (SSO). SSO is the most-implemented
interoperability initiative.
6. Over one third of IT Leaders express no interest in BYOD—compared to 20% in 2014.
7. General interest in OER is high—79% of respondents indicated it is part their district’s
digital content strategy.
8. IT Leaders are experienced—73% have worked in the K-12 education technology field for
more than 10 years.
9. CTOs lack diversity. Lack of racial diversity continues to be an issue. Ninety percent (90%)
of IT Leaders identify as white, the same percentage as the prior year.
10. CTOs are smart. Seventy-seven percent (77%) of IT Leaders have some college beyond
Bachelor’s and 61% hold Masters degrees.
CoSN 2017 K-12 IT Leadership Survey 5
About the School Systems
Demographics
The overwhelming majority of responses from this year’s survey are from IT Leaders working in
the public school system. This has been a consistent result for the five years the survey has
been conducted. The percentage of this year’s responses from public schools is 88%,
essentially matching last year’s public school percentage of 86%. Also closely matching prior
year response rates is Private/Independent Schools with 5% and Religious/Parochial Schools
with 4%. Making up the balance were charter schools, educational service agencies (ESAs) and
state educational agencies (SEAs), each comprising 1% of the responses.
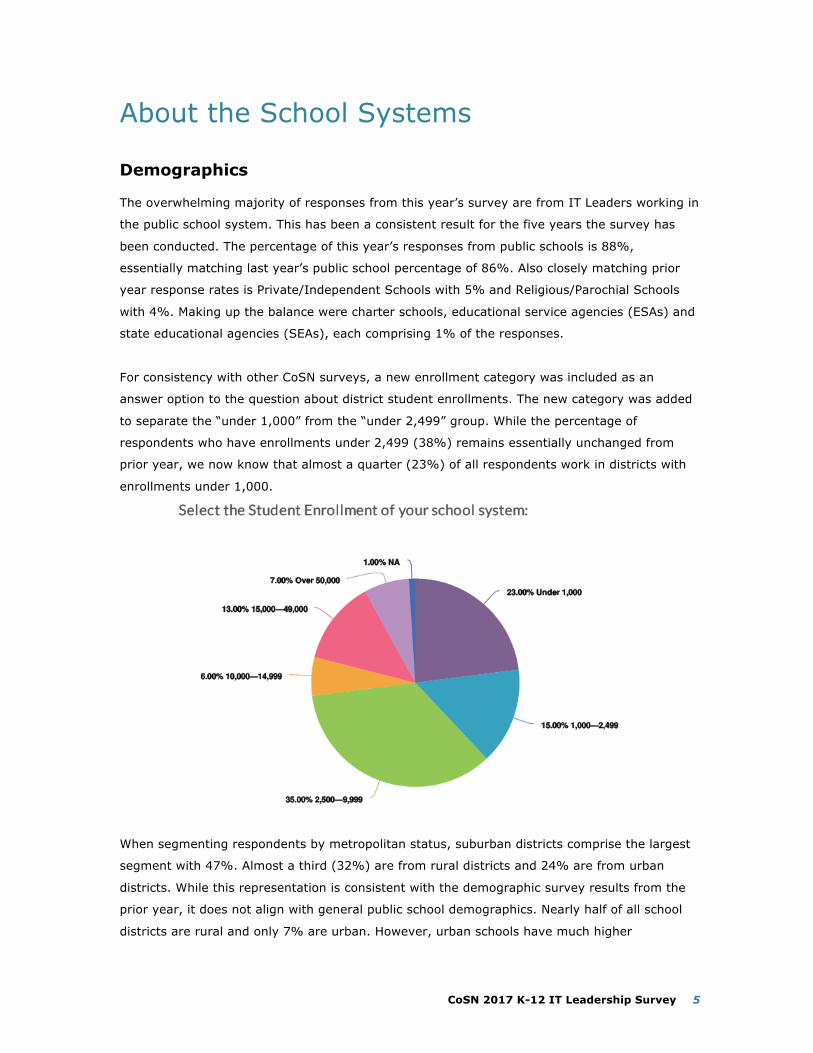
For consistency with other CoSN surveys, a new enrollment category was included as an
answer option to the question about district student enrollments. The new category was added
to separate the “under 1,000” from the “under 2,499” group. While the percentage of
respondents who have enrollments under 2,499 (38%) remains essentially unchanged from
prior year, we now know that almost a quarter (23%) of all respondents work in districts with
enrollments under 1,000.
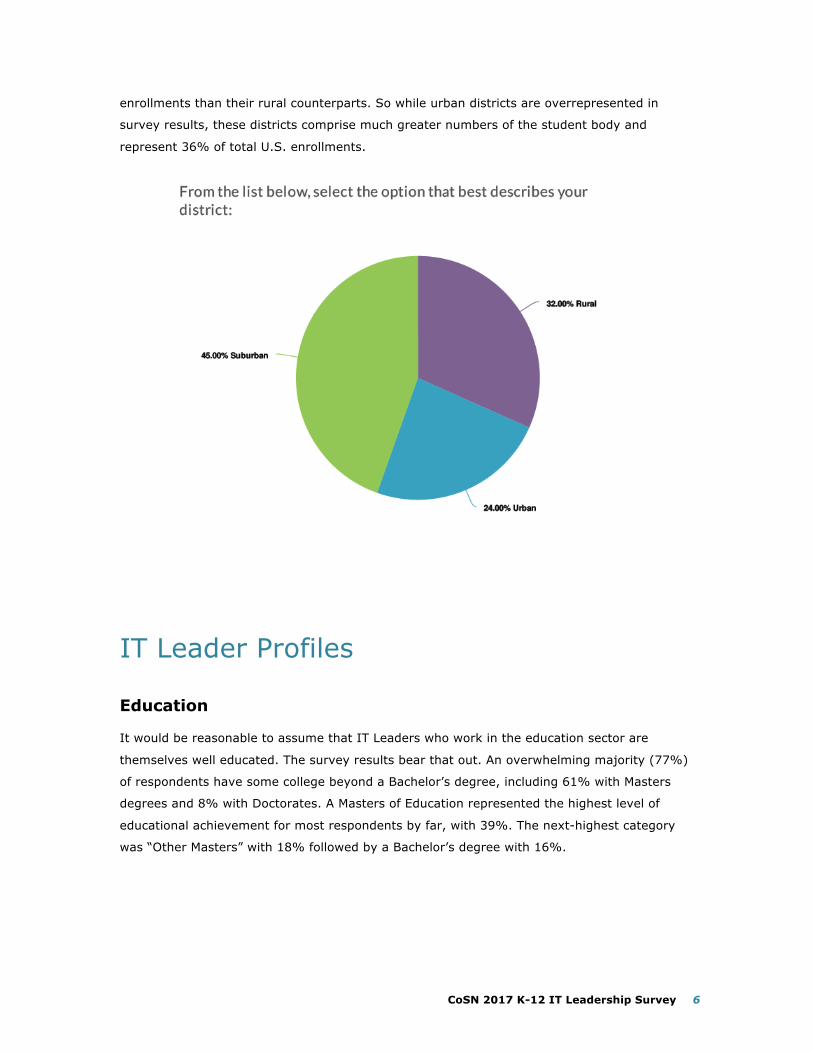
When segmenting respondents by metropolitan status, suburban districts comprise the largest
segment with 47%. Almost a third (32%) are from rural districts and 24% are from urban
districts. While this representation is consistent with the demographic survey results from the
prior year, it does not align with general public school demographics. Nearly half of all school
districts are rural and only 7% are urban. However, urban schools have much higher
CoSN 2017 K-12 IT Leadership Survey 6
enrollments than their rural counterparts. So while urban districts are overrepresented in
survey results, these districts comprise much greater numbers of the student body and
represent 36% of total U.S. enrollments.
IT Leader Profiles
Education
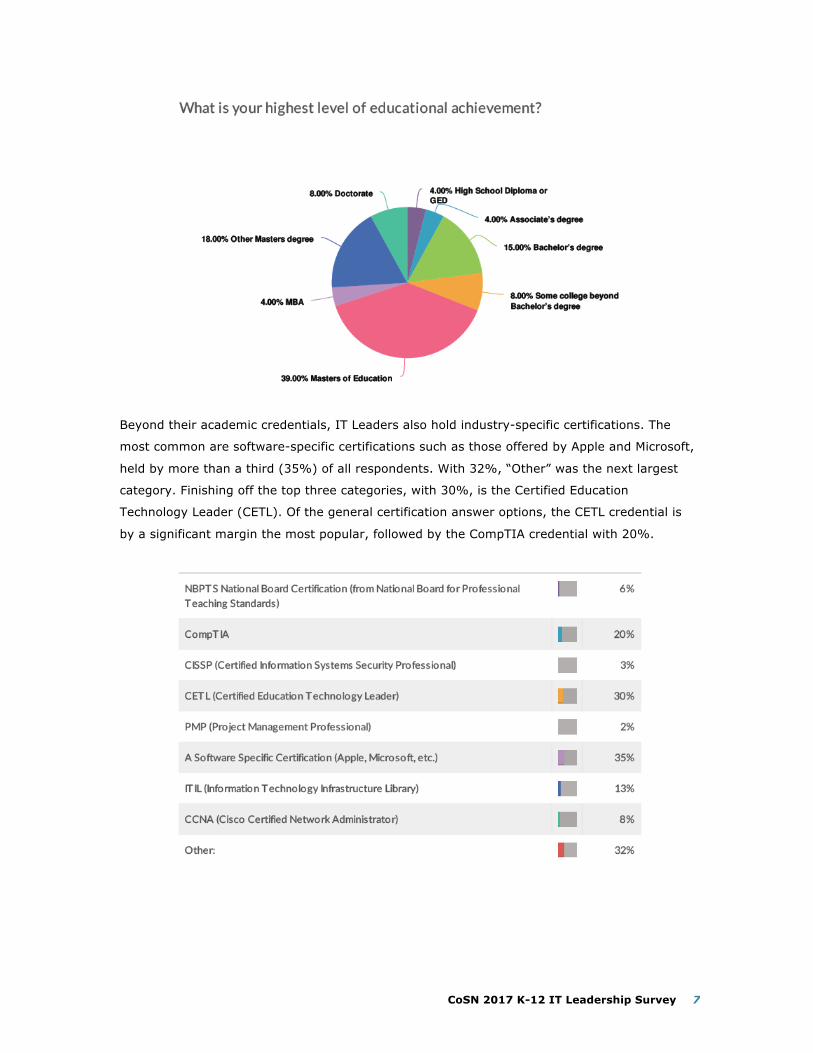
It would be reasonable to assume that IT Leaders who work in the education sector are
themselves well educated. The survey results bear that out. An overwhelming majority (77%)
of respondents have some college beyond a Bachelor’s degree, including 61% with Masters
degrees and 8% with Doctorates. A Masters of Education represented the highest level of
educational achievement for most respondents by far, with 39%. The next-highest category
was “Other Masters” with 18% followed by a Bachelor’s degree with 16%.
CoSN 2017 K-12 IT Leadership Survey 7
Beyond their academic credentials, IT Leaders also hold industry-specific certifications. The
most common are software-specific certifications such as those offered by Apple and Microsoft,
held by more than a third (35%) of all respondents. With 32%, “Other” was the next largest
category. Finishing off the top three categories, with 30%, is the Certified Education
Technology Leader (CETL). Of the general certification answer options, the CETL credential is
by a significant margin the most popular, followed by the CompTIA credential with 20%.
CoSN 2017 K-12 IT Leadership Survey 8
Professional Background
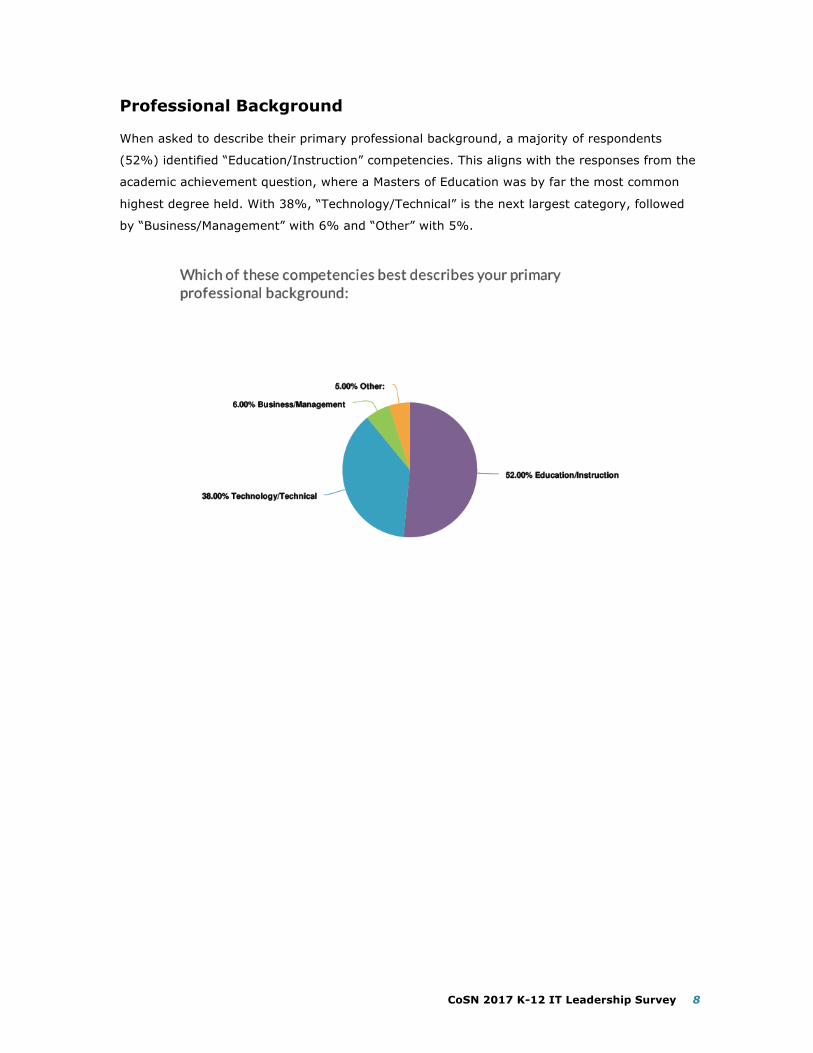
When asked to describe their primary professional background, a majority of respondents
(52%) identified “Education/Instruction” competencies. This aligns with the responses from the
academic achievement question, where a Masters of Education was by far the most common
highest degree held. With 38%, “Technology/Technical” is the next largest category, followed
by “Business/Management” with 6% and “Other” with 5%.
CoSN 2017 K-12 IT Leadership Survey 9
Experience
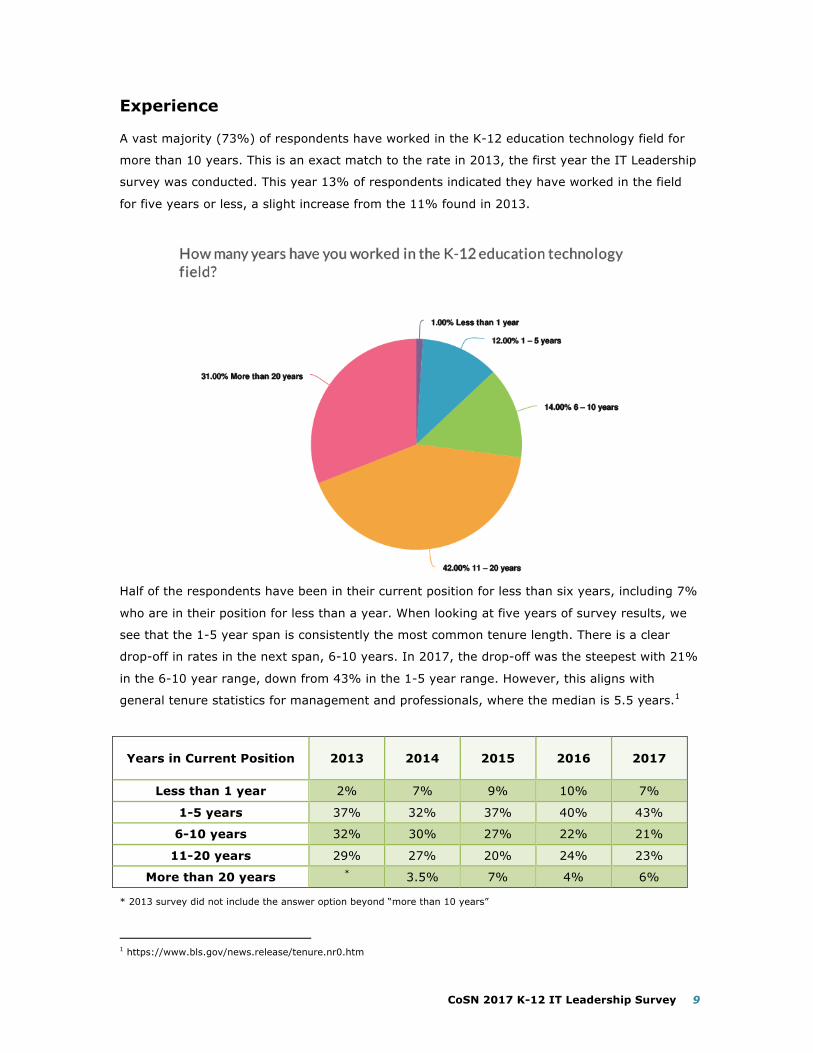
A vast majority (73%) of respondents have worked in the K-12 education technology field for
more than 10 years. This is an exact match to the rate in 2013, the first year the IT Leadership
survey was conducted. This year 13% of respondents indicated they have worked in the field
for five years or less, a slight increase from the 11% found in 2013.
Half of the respondents have been in their current position for less than six years, including 7%
who are in their position for less than a year. When looking at five years of survey results, we
see that the 1-5 year span is consistently the most common tenure length. There is a clear
drop-off in rates in the next span, 6-10 years. In 2017, the drop-off was the steepest with 21%
in the 6-10 year range, down from 43% in the 1-5 year range. However, this aligns with
general tenure statistics for management and professionals, where the median is 5.5 years.1
Years in Current Position 2013 2014 2015 2016 2017
Less than 1 year 2% 7% 9% 10% 7%
1-5 years 37% 32% 37% 40% 43%
6-10 years 32% 30% 27% 22% 21%
11-20 years 29% 27% 20% 24% 23%
More than 20 years * 3.5% 7% 4% 6%
* 2013 survey did not include the answer option beyond “more than 10 years”
1 https://www.bls.gov/news.release/tenure.nr0.htm
CoSN 2017 K-12 IT Leadership Survey 10
Diversity
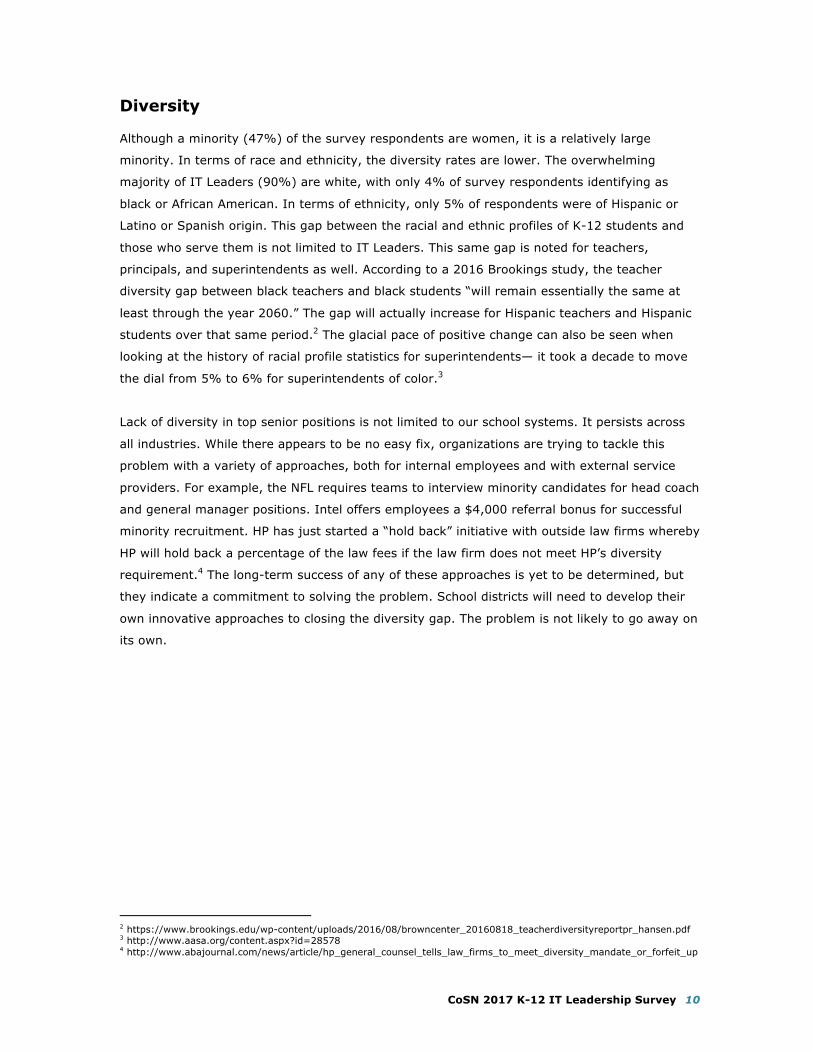
Although a minority (47%) of the survey respondents are women, it is a relatively large
minority. In terms of race and ethnicity, the diversity rates are lower. The overwhelming
majority of IT Leaders (90%) are white, with only 4% of survey respondents identifying as
black or African American. In terms of ethnicity, only 5% of respondents were of Hispanic or
Latino or Spanish origin. This gap between the racial and ethnic profiles of K-12 students and
those who serve them is not limited to IT Leaders. This same gap is noted for teachers,
principals, and superintendents as well. According to a 2016 Brookings study, the teacher
diversity gap between black teachers and black students “will remain essentially the same at
least through the year 2060.” The gap will actually increase for Hispanic teachers and Hispanic
students over that same period.2 The glacial pace of positive change can also be seen when
looking at the history of racial profile statistics for superintendents— it took a decade to move
the dial from 5% to 6% for superintendents of color.3
Lack of diversity in top senior positions is not limited to our school systems. It persists across
all industries. While there appears to be no easy fix, organizations are trying to tackle this
problem with a variety of approaches, both for internal employees and with external service
providers. For example, the NFL requires teams to interview minority candidates for head coach
and general manager positions. Intel offers employees a $4,000 referral bonus for successful
minority recruitment. HP has just started a “hold back” initiative with outside law firms whereby
HP will hold back a percentage of the law fees if the law firm does not meet HP’s diversity
requirement.4 The long-term success of any of these approaches is yet to be determined, but
they indicate a commitment to solving the problem. School districts will need to develop their
own innovative approaches to closing the diversity gap. The problem is not likely to go away on
its own.
2 https://www.brookings.edu/wp-content/uploads/2016/08/browncenter_20160818_teacherdiversityreportpr_hansen.pdf 3 http://www.aasa.org/content.aspx?id=28578 4 http://www.abajournal.com/news/article/hp_general_counsel_tells_law_firms_to_meet_diversity_mandate_or_forfeit_up
CoSN 2017 K-12 IT Leadership Survey 11
Technology Leadership in School Systems
Titles
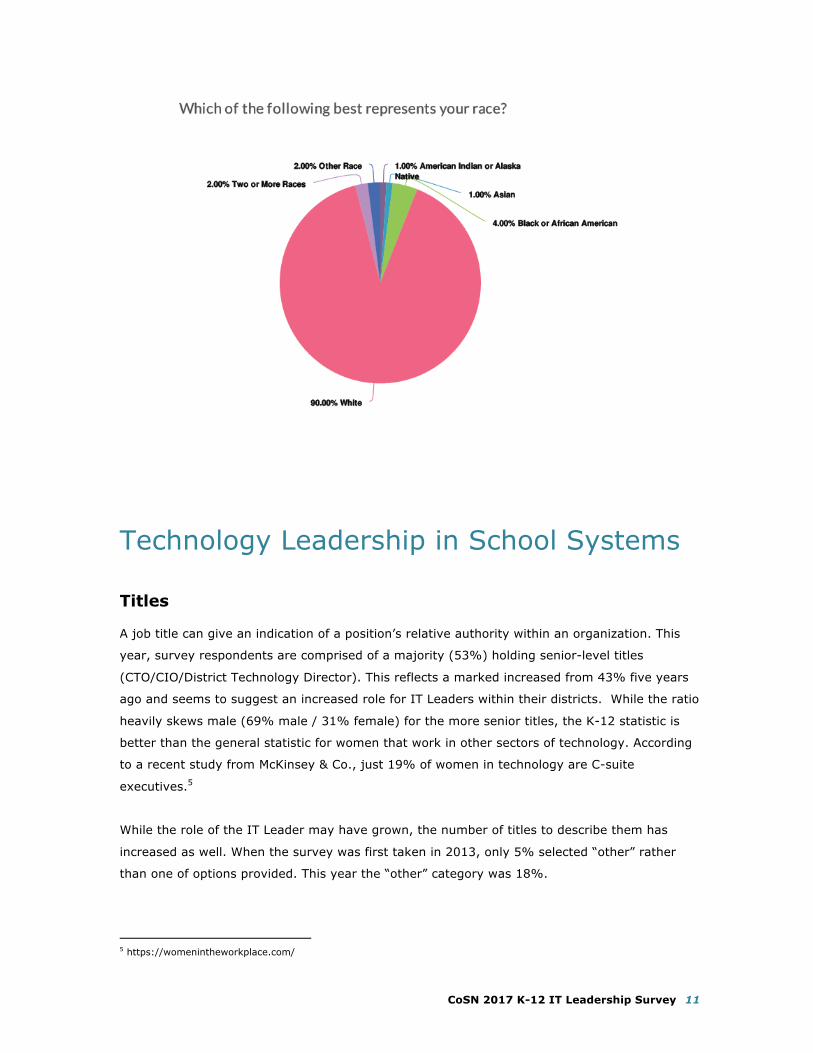
A job title can give an indication of a position’s relative authority within an organization. This
year, survey respondents are comprised of a majority (53%) holding senior-level titles
(CTO/CIO/District Technology Director). This reflects a marked increased from 43% five years
ago and seems to suggest an increased role for IT Leaders within their districts. While the ratio
heavily skews male (69% male / 31% female) for the more senior titles, the K-12 statistic is
better than the general statistic for women that work in other sectors of technology. According
to a recent study from McKinsey & Co., just 19% of women in technology are C-suite
executives.5
While the role of the IT Leader may have grown, the number of titles to describe them has
increased as well. When the survey was first taken in 2013, only 5% selected “other” rather
than one of options provided. This year the “other” category was 18%.
5 https://womenintheworkplace.com/
CoSN 2017 K-12 IT Leadership Survey 12
Responsibilities
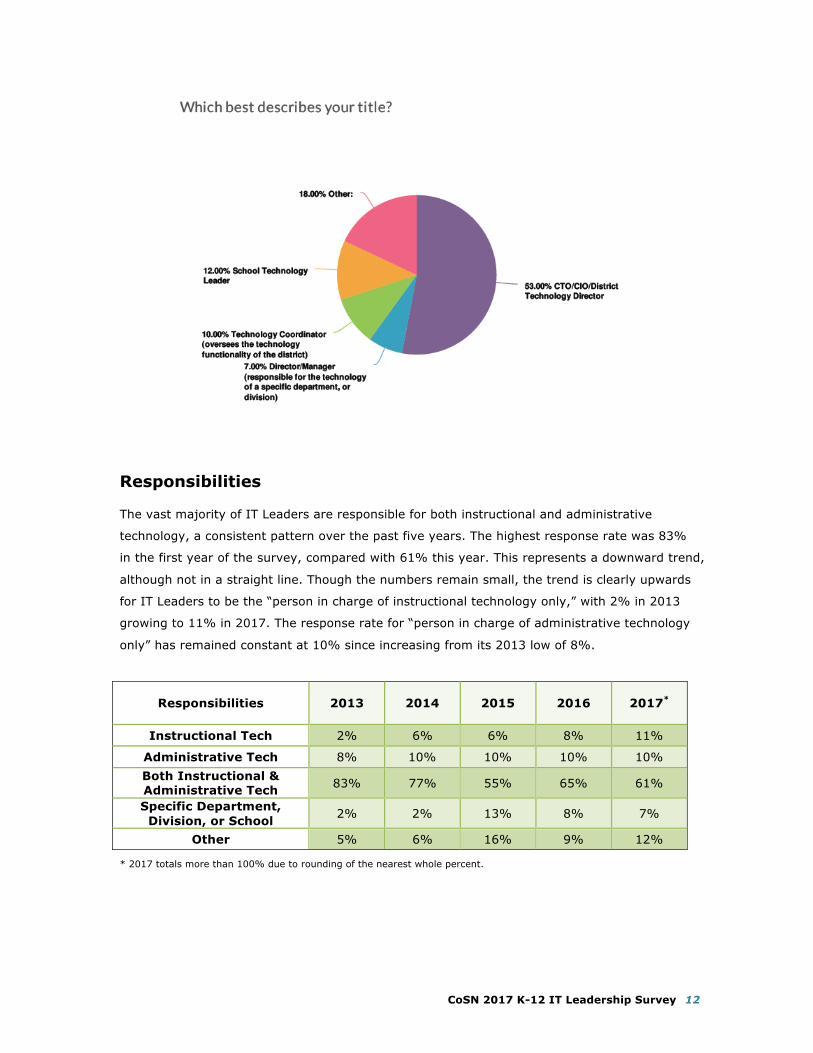
The vast majority of IT Leaders are responsible for both instructional and administrative
technology, a consistent pattern over the past five years. The highest response rate was 83%
in the first year of the survey, compared with 61% this year. This represents a downward trend,
although not in a straight line. Though the numbers remain small, the trend is clearly upwards
for IT Leaders to be the “person in charge of instructional technology only,” with 2% in 2013
growing to 11% in 2017. The response rate for “person in charge of administrative technology
only” has remained constant at 10% since increasing from its 2013 low of 8%.
Responsibilities 2013 2014 2015 2016 2017*
Instructional Tech 2% 6% 6% 8% 11%
Administrative Tech 8% 10% 10% 10% 10% Both Instructional & Administrative Tech 83% 77% 55% 65% 61%
Specific Department, Division, or School 2% 2% 13% 8% 7%
Other 5% 6% 16% 9% 12%
* 2017 totals more than 100% due to rounding of the nearest whole percent.
CoSN 2017 K-12 IT Leadership Survey 13
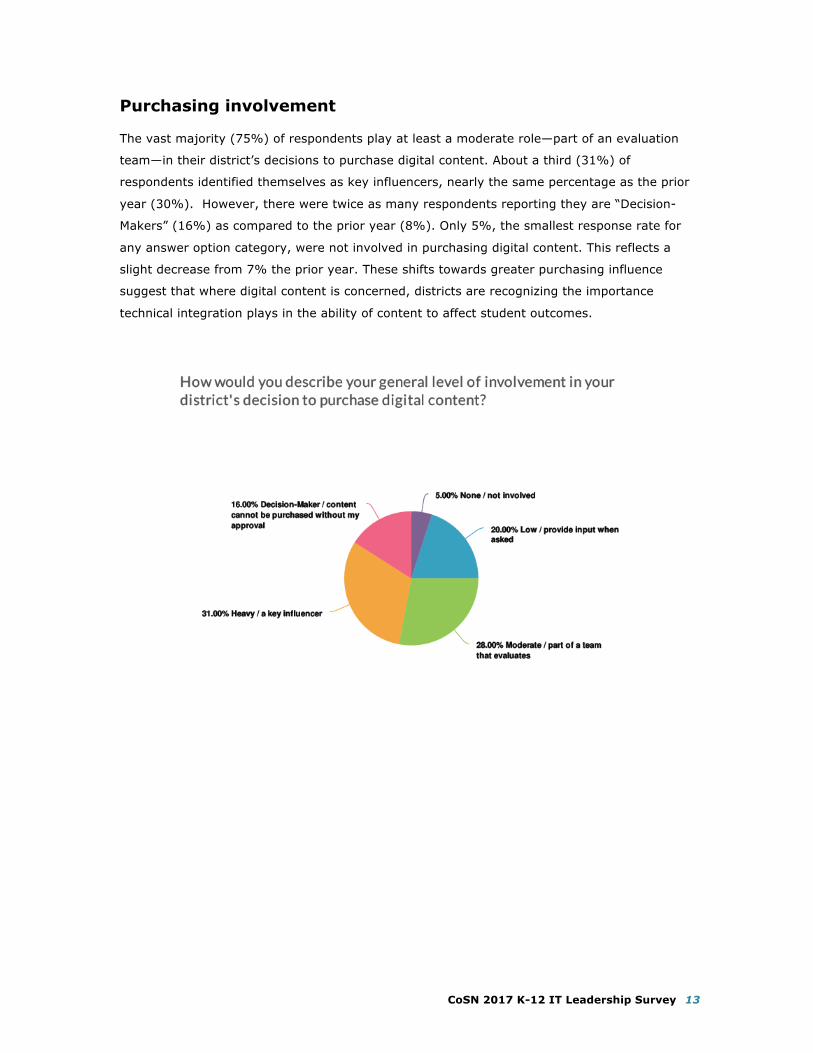
Purchasing involvement
The vast majority (75%) of respondents play at least a moderate role—part of an evaluation
team—in their district’s decisions to purchase digital content. About a third (31%) of
respondents identified themselves as key influencers, nearly the same percentage as the prior
year (30%). However, there were twice as many respondents reporting they are “Decision-
Makers” (16%) as compared to the prior year (8%). Only 5%, the smallest response rate for
any answer option category, were not involved in purchasing digital content. This reflects a
slight decrease from 7% the prior year. These shifts towards greater purchasing influence
suggest that where digital content is concerned, districts are recognizing the importance
technical integration plays in the ability of content to affect student outcomes.
CoSN 2017 K-12 IT Leadership Survey 14
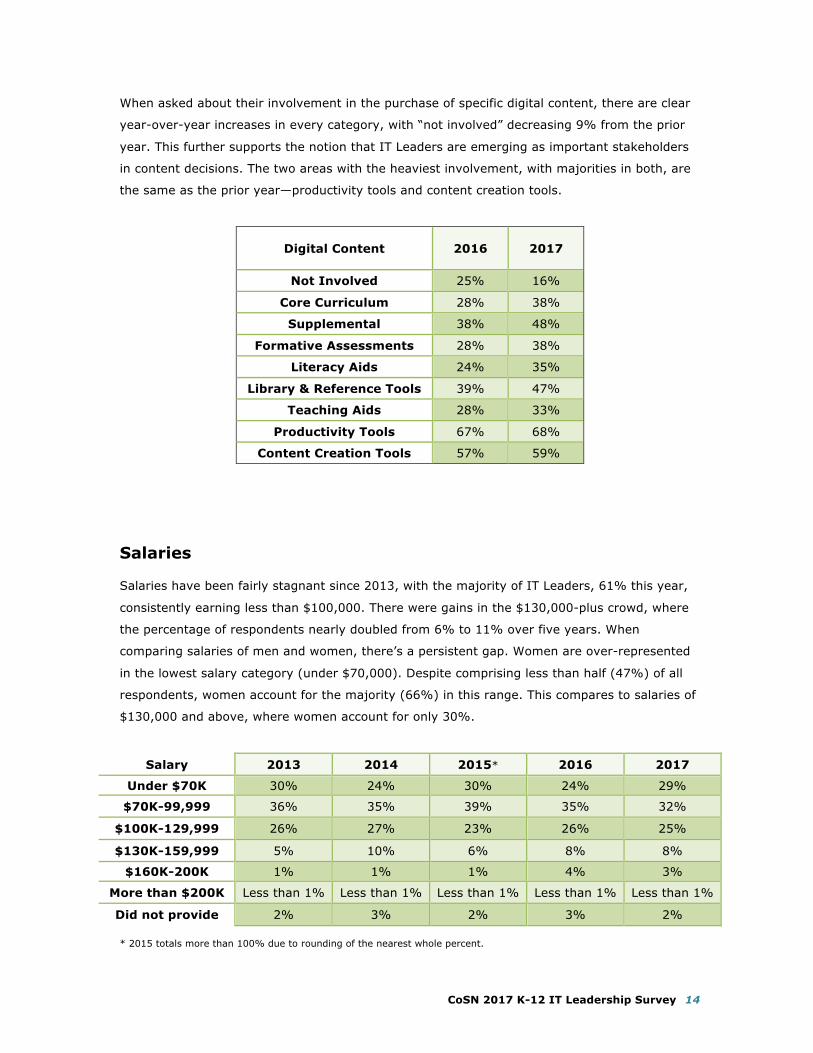
When asked about their involvement in the purchase of specific digital content, there are clear
year-over-year increases in every category, with “not involved” decreasing 9% from the prior
year. This further supports the notion that IT Leaders are emerging as important stakeholders
in content decisions. The two areas with the heaviest involvement, with majorities in both, are
the same as the prior year—productivity tools and content creation tools.
Digital Content 2016 2017
Not Involved 25% 16%
Core Curriculum 28% 38%
Supplemental 38% 48%
Formative Assessments 28% 38%
Literacy Aids 24% 35%
Library & Reference Tools 39% 47%
Teaching Aids 28% 33%
Productivity Tools 67% 68%
Content Creation Tools 57% 59%
Salaries
Salaries have been fairly stagnant since 2013, with the majority of IT Leaders, 61% this year,
consistently earning less than $100,000. There were gains in the $130,000-plus crowd, where
the percentage of respondents nearly doubled from 6% to 11% over five years. When
comparing salaries of men and women, there’s a persistent gap. Women are over-represented
in the lowest salary category (under $70,000). Despite comprising less than half (47%) of all
respondents, women account for the majority (66%) in this range. This compares to salaries of
$130,000 and above, where women account for only 30%.
Salary 2013 2014 2015* 2016 2017
Under $70K 30% 24% 30% 24% 29%
$70K-99,999 36% 35% 39% 35% 32%
$100K-129,999 26% 27% 23% 26% 25%
$130K-159,999 5% 10% 6% 8% 8%
$160K-200K 1% 1% 1% 4% 3%
More than $200K Less than 1% Less than 1% Less than 1% Less than 1% Less than 1%
Did not provide 2% 3% 2% 3% 2% * 2015 totals more than 100% due to rounding of the nearest whole percent.
CoSN 2017 K-12 IT Leadership Survey 15
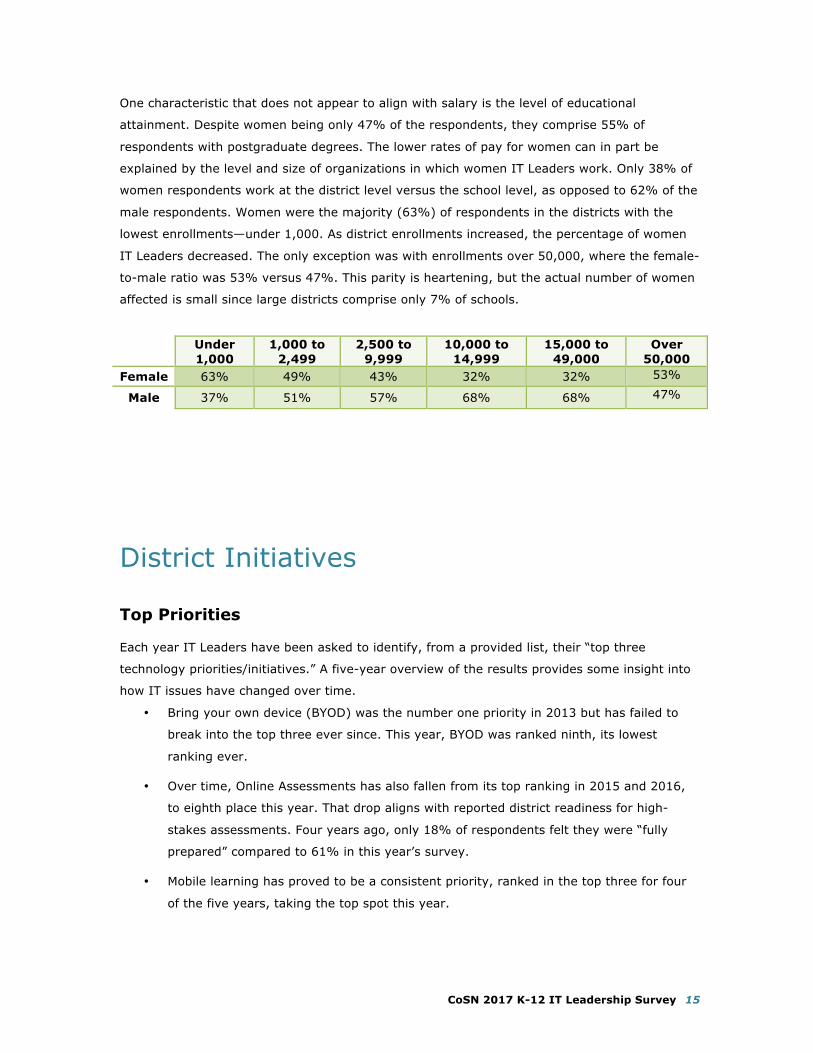
One characteristic that does not appear to align with salary is the level of educational
attainment. Despite women being only 47% of the respondents, they comprise 55% of
respondents with postgraduate degrees. The lower rates of pay for women can in part be
explained by the level and size of organizations in which women IT Leaders work. Only 38% of
women respondents work at the district level versus the school level, as opposed to 62% of the
male respondents. Women were the majority (63%) of respondents in the districts with the
lowest enrollments—under 1,000. As district enrollments increased, the percentage of women
IT Leaders decreased. The only exception was with enrollments over 50,000, where the female-
to-male ratio was 53% versus 47%. This parity is heartening, but the actual number of women
affected is small since large districts comprise only 7% of schools.
Under 1,000
1,000 to 2,499
2,500 to 9,999
10,000 to 14,999
15,000 to 49,000
Over 50,000
Female 63% 49% 43% 32% 32% 53%
Male 37% 51% 57% 68% 68% 47%
District Initiatives
Top Priorities
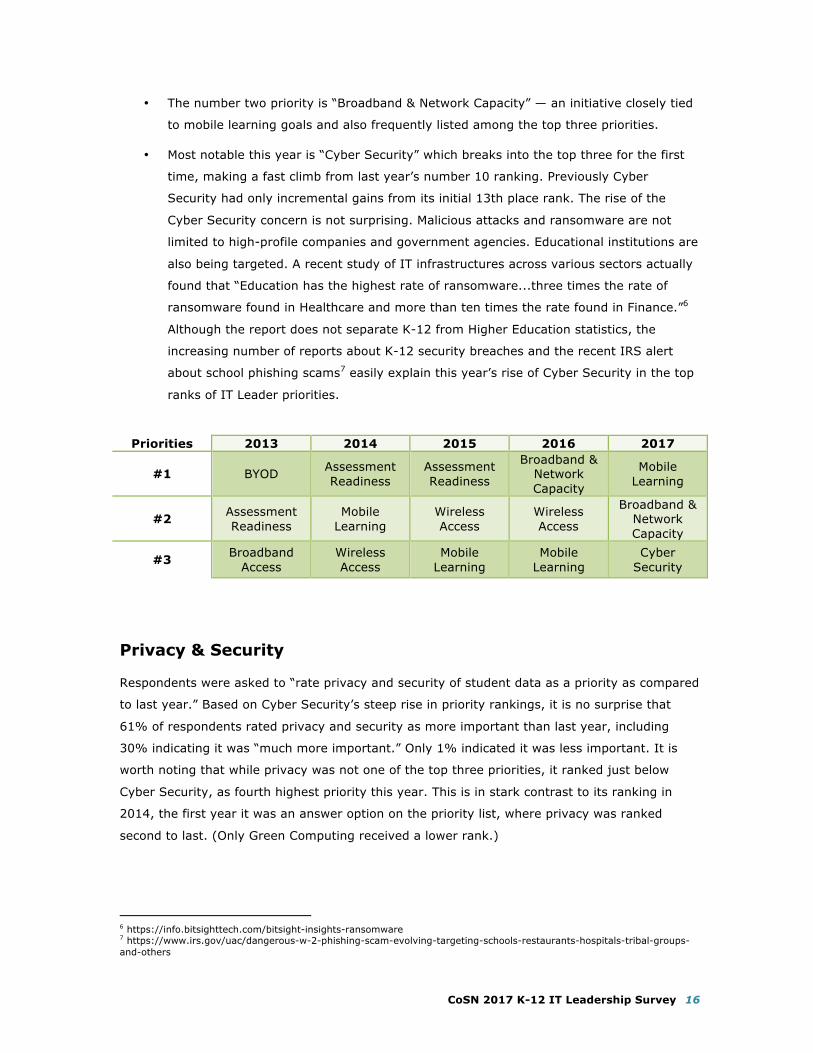
Each year IT Leaders have been asked to identify, from a provided list, their “top three
technology priorities/initiatives.” A five-year overview of the results provides some insight into
how IT issues have changed over time.
• Bring your own device (BYOD) was the number one priority in 2013 but has failed to
break into the top three ever since. This year, BYOD was ranked ninth, its lowest
ranking ever.
• Over time, Online Assessments has also fallen from its top ranking in 2015 and 2016,
to eighth place this year. That drop aligns with reported district readiness for high-
stakes assessments. Four years ago, only 18% of respondents felt they were “fully
prepared” compared to 61% in this year’s survey.
• Mobile learning has proved to be a consistent priority, ranked in the top three for four
of the five years, taking the top spot this year.
CoSN 2017 K-12 IT Leadership Survey 16
• The number two priority is “Broadband & Network Capacity” — an initiative closely tied
to mobile learning goals and also frequently listed among the top three priorities.
• Most notable this year is “Cyber Security” which breaks into the top three for the first
time, making a fast climb from last year’s number 10 ranking. Previously Cyber
Security had only incremental gains from its initial 13th place rank. The rise of the
Cyber Security concern is not surprising. Malicious attacks and ransomware are not
limited to high-profile companies and government agencies. Educational institutions are
also being targeted. A recent study of IT infrastructures across various sectors actually
found that “Education has the highest rate of ransomware...three times the rate of
ransomware found in Healthcare and more than ten times the rate found in Finance.”6
Although the report does not separate K-12 from Higher Education statistics, the
increasing number of reports about K-12 security breaches and the recent IRS alert
about school phishing scams7 easily explain this year’s rise of Cyber Security in the top
ranks of IT Leader priorities.
Priorities 2013 2014 2015 2016 2017
#1 BYOD Assessment Readiness
Assessment Readiness
Broadband & Network Capacity
Mobile Learning
#2 Assessment Readiness
Mobile Learning
Wireless Access
Wireless Access
Broadband & Network Capacity
#3 Broadband Access
Wireless Access
Mobile Learning
Mobile Learning
Cyber Security
Privacy & Security
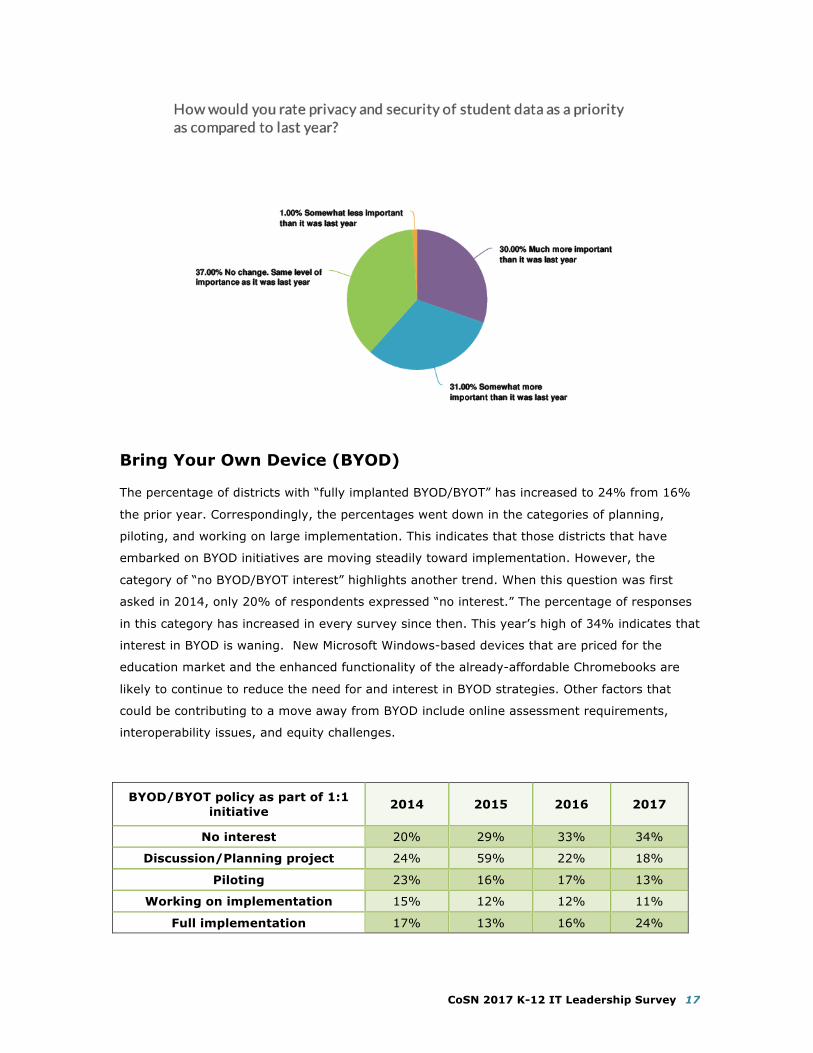
Respondents were asked to “rate privacy and security of student data as a priority as compared
to last year.” Based on Cyber Security’s steep rise in priority rankings, it is no surprise that
61% of respondents rated privacy and security as more important than last year, including
30% indicating it was “much more important.” Only 1% indicated it was less important. It is
worth noting that while privacy was not one of the top three priorities, it ranked just below
Cyber Security, as fourth highest priority this year. This is in stark contrast to its ranking in
2014, the first year it was an answer option on the priority list, where privacy was ranked
second to last. (Only Green Computing received a lower rank.)
6 https://info.bitsighttech.com/bitsight-insights-ransomware 7 https://www.irs.gov/uac/dangerous-w-2-phishing-scam-evolving-targeting-schools-restaurants-hospitals-tribal-groups-and-others
CoSN 2017 K-12 IT Leadership Survey 17
Bring Your Own Device (BYOD)
The percentage of districts with “fully implanted BYOD/BYOT” has increased to 24% from 16%
the prior year. Correspondingly, the percentages went down in the categories of planning,
piloting, and working on large implementation. This indicates that those districts that have
embarked on BYOD initiatives are moving steadily toward implementation. However, the
category of “no BYOD/BYOT interest” highlights another trend. When this question was first
asked in 2014, only 20% of respondents expressed “no interest.” The percentage of responses
in this category has increased in every survey since then. This year’s high of 34% indicates that
interest in BYOD is waning. New Microsoft Windows-based devices that are priced for the
education market and the enhanced functionality of the already-affordable Chromebooks are
likely to continue to reduce the need for and interest in BYOD strategies. Other factors that
could be contributing to a move away from BYOD include online assessment requirements,
interoperability issues, and equity challenges.
BYOD/BYOT policy as part of 1:1 initiative 2014 2015 2016 2017
No interest 20% 29% 33% 34%
Discussion/Planning project 24% 59% 22% 18%
Piloting 23% 16% 17% 13%
Working on implementation 15% 12% 12% 11%
Full implementation 17% 13% 16% 24%
CoSN 2017 K-12 IT Leadership Survey 18
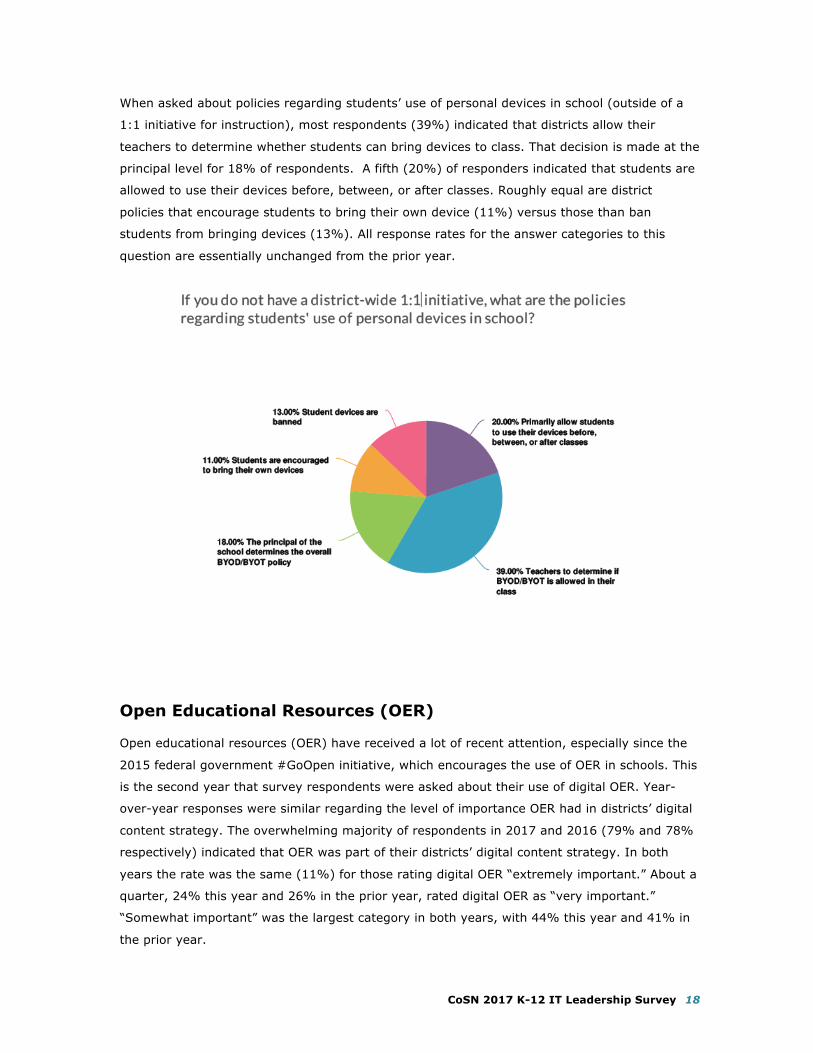
When asked about policies regarding students’ use of personal devices in school (outside of a
1:1 initiative for instruction), most respondents (39%) indicated that districts allow their
teachers to determine whether students can bring devices to class. That decision is made at the
principal level for 18% of respondents. A fifth (20%) of responders indicated that students are
allowed to use their devices before, between, or after classes. Roughly equal are district
policies that encourage students to bring their own device (11%) versus those than ban
students from bringing devices (13%). All response rates for the answer categories to this
question are essentially unchanged from the prior year.
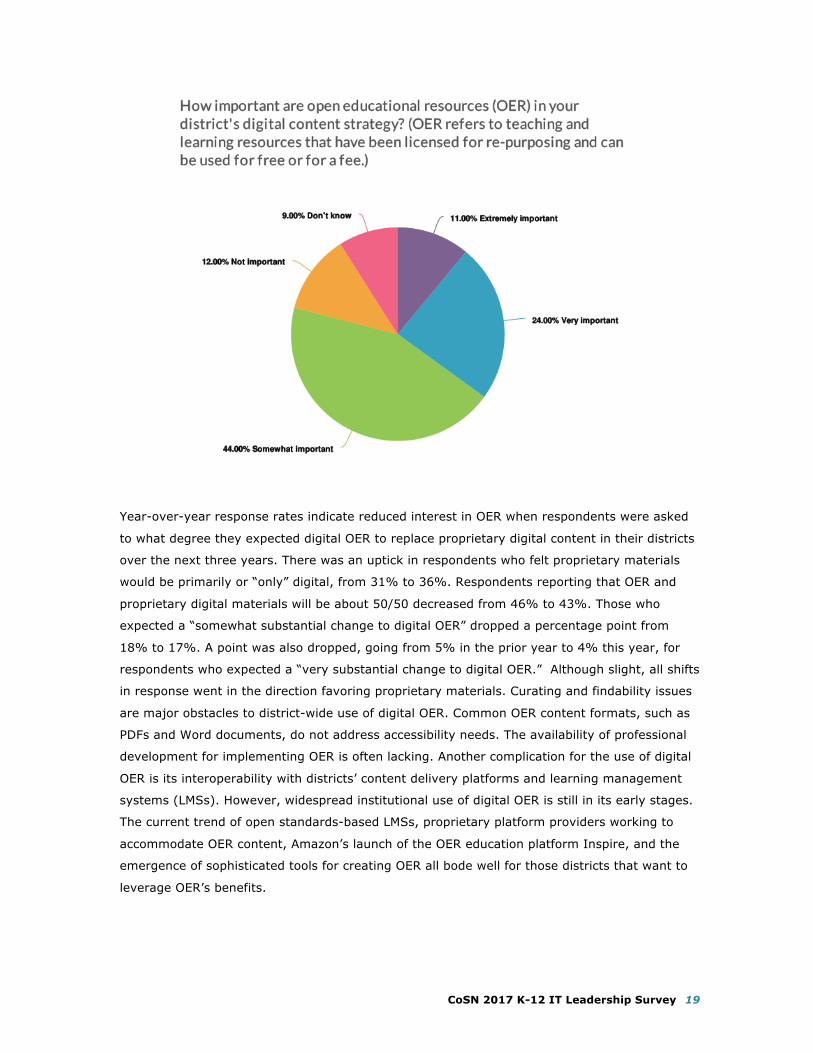
Open Educational Resources (OER)
Open educational resources (OER) have received a lot of recent attention, especially since the
2015 federal government #GoOpen initiative, which encourages the use of OER in schools. This
is the second year that survey respondents were asked about their use of digital OER. Year-
over-year responses were similar regarding the level of importance OER had in districts’ digital
content strategy. The overwhelming majority of respondents in 2017 and 2016 (79% and 78%
respectively) indicated that OER was part of their districts’ digital content strategy. In both
years the rate was the same (11%) for those rating digital OER “extremely important.” About a
quarter, 24% this year and 26% in the prior year, rated digital OER as “very important.”
“Somewhat important” was the largest category in both years, with 44% this year and 41% in
the prior year.
CoSN 2017 K-12 IT Leadership Survey 19
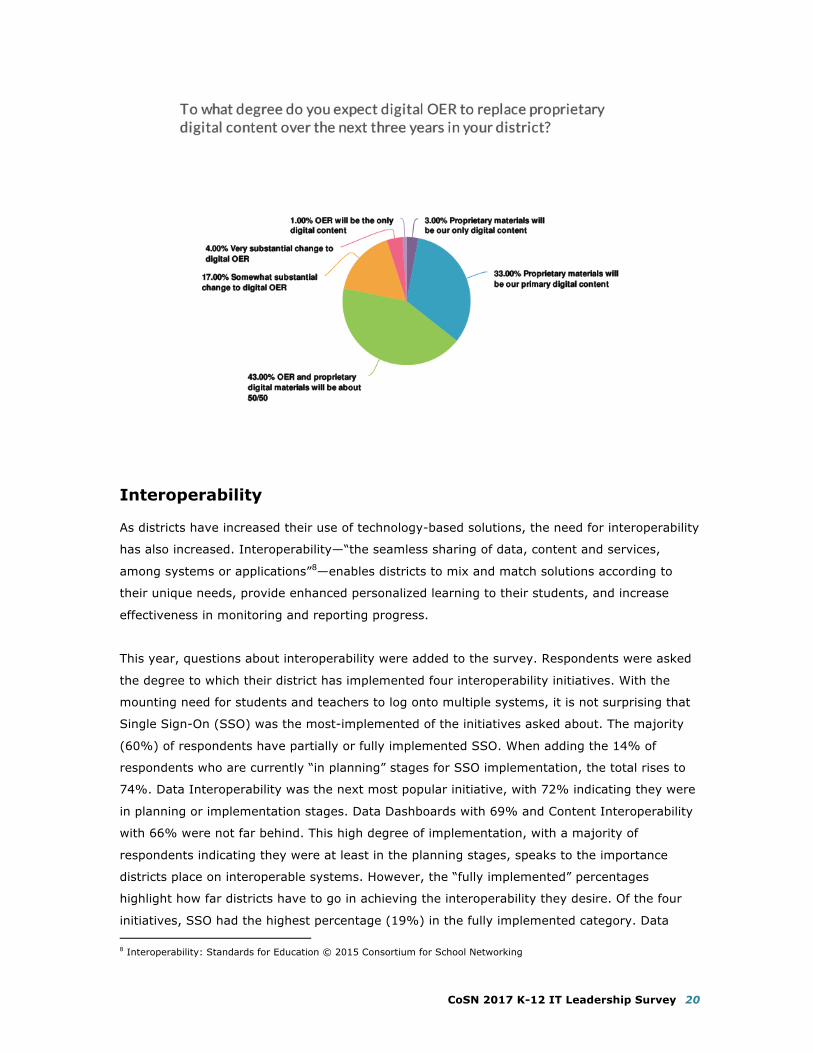
Year-over-year response rates indicate reduced interest in OER when respondents were asked
to what degree they expected digital OER to replace proprietary digital content in their districts
over the next three years. There was an uptick in respondents who felt proprietary materials
would be primarily or “only” digital, from 31% to 36%. Respondents reporting that OER and
proprietary digital materials will be about 50/50 decreased from 46% to 43%. Those who
expected a “somewhat substantial change to digital OER” dropped a percentage point from
18% to 17%. A point was also dropped, going from 5% in the prior year to 4% this year, for
respondents who expected a “very substantial change to digital OER.” Although slight, all shifts
in response went in the direction favoring proprietary materials. Curating and findability issues
are major obstacles to district-wide use of digital OER. Common OER content formats, such as
PDFs and Word documents, do not address accessibility needs. The availability of professional
development for implementing OER is often lacking. Another complication for the use of digital
OER is its interoperability with districts’ content delivery platforms and learning management
systems (LMSs). However, widespread institutional use of digital OER is still in its early stages.
The current trend of open standards-based LMSs, proprietary platform providers working to
accommodate OER content, Amazon’s launch of the OER education platform Inspire, and the
emergence of sophisticated tools for creating OER all bode well for those districts that want to
leverage OER’s benefits.
CoSN 2017 K-12 IT Leadership Survey 20
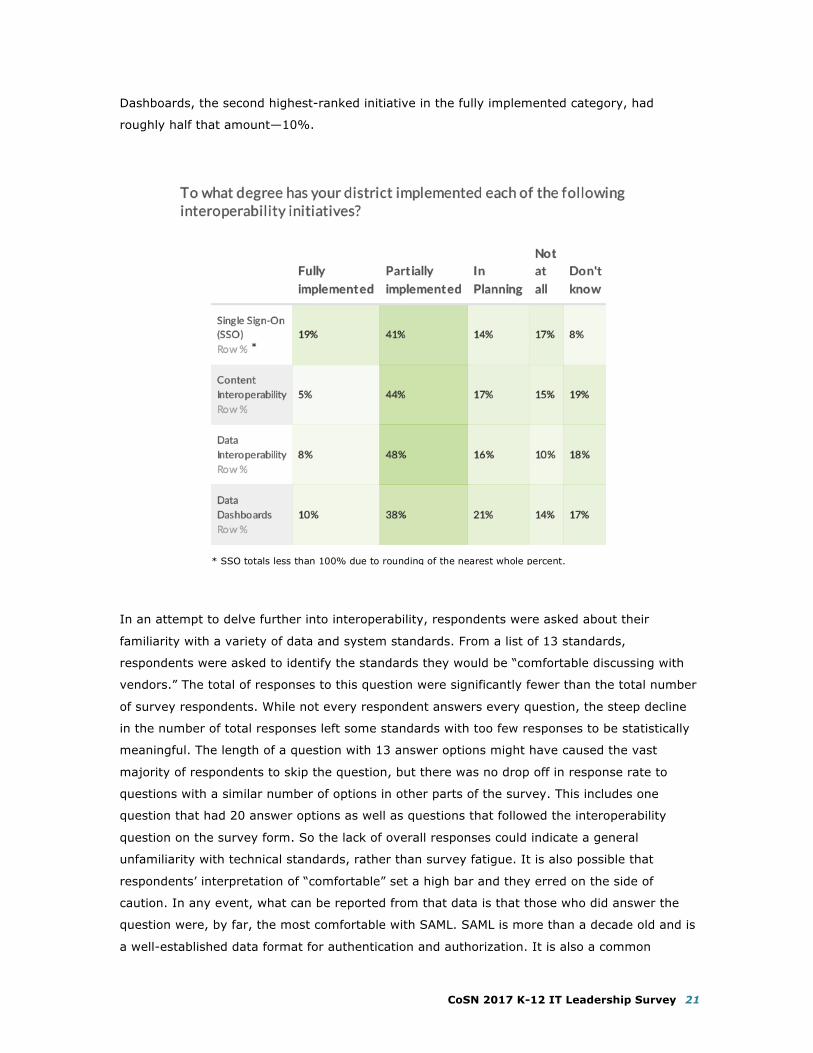
Interoperability
As districts have increased their use of technology-based solutions, the need for interoperability
has also increased. Interoperability—“the seamless sharing of data, content and services,
among systems or applications”8—enables districts to mix and match solutions according to
their unique needs, provide enhanced personalized learning to their students, and increase
effectiveness in monitoring and reporting progress.
This year, questions about interoperability were added to the survey. Respondents were asked
the degree to which their district has implemented four interoperability initiatives. With the
mounting need for students and teachers to log onto multiple systems, it is not surprising that
Single Sign-On (SSO) was the most-implemented of the initiatives asked about. The majority
(60%) of respondents have partially or fully implemented SSO. When adding the 14% of
respondents who are currently “in planning” stages for SSO implementation, the total rises to
74%. Data Interoperability was the next most popular initiative, with 72% indicating they were
in planning or implementation stages. Data Dashboards with 69% and Content Interoperability
with 66% were not far behind. This high degree of implementation, with a majority of
respondents indicating they were at least in the planning stages, speaks to the importance
districts place on interoperable systems. However, the “fully implemented” percentages
highlight how far districts have to go in achieving the interoperability they desire. Of the four
initiatives, SSO had the highest percentage (19%) in the fully implemented category. Data 8 Interoperability: Standards for Education © 2015 Consortium for School Networking
CoSN 2017 K-12 IT Leadership Survey 21
Dashboards, the second highest-ranked initiative in the fully implemented category, had
roughly half that amount—10%.
In an attempt to delve further into interoperability, respondents were asked about their
familiarity with a variety of data and system standards. From a list of 13 standards,
respondents were asked to identify the standards they would be “comfortable discussing with
vendors.” The total of responses to this question were significantly fewer than the total number
of survey respondents. While not every respondent answers every question, the steep decline
in the number of total responses left some standards with too few responses to be statistically
meaningful. The length of a question with 13 answer options might have caused the vast
majority of respondents to skip the question, but there was no drop off in response rate to
questions with a similar number of options in other parts of the survey. This includes one
question that had 20 answer options as well as questions that followed the interoperability
question on the survey form. So the lack of overall responses could indicate a general
unfamiliarity with technical standards, rather than survey fatigue. It is also possible that
respondents’ interpretation of “comfortable” set a high bar and they erred on the side of
caution. In any event, what can be reported from that data is that those who did answer the
question were, by far, the most comfortable with SAML. SAML is more than a decade old and is
a well-established data format for authentication and authorization. It is also a common
* SSO totals less than 100% due to rounding of the nearest whole percent.
*
CoSN 2017 K-12 IT Leadership Survey 22
method for enabling SSO and hence aligns with the findings of the previous question that
highlighted SSO as the most implemented interoperability initiative.
IT Leaders are not expected to be standards experts, but the more conversant they are with
the topic the better they can support their district’s interoperability goals. If districts continue
to move away from single-vendor solutions and require more interoperable systems, CoSN
expects fluency with technical standards to grow.
About Technology
For four years, survey respondents have been asked about the outsourcing of IT functions. The
trend line shows a decline with 49% of 2017 respondents indicating that no IT functions are
outsourced, compared with 32% in 2014. Only 45% indicated their districts currently outsource
one or more functions, compared with 59% in 2014.
2014 2015 2016 2017
No functions Outsourced 32% 44% 47% 49%
Considering Outsourcing 9% 8% 7% 6%
Currently Outsourcing one or more
functions
59% 48% 46% 45%
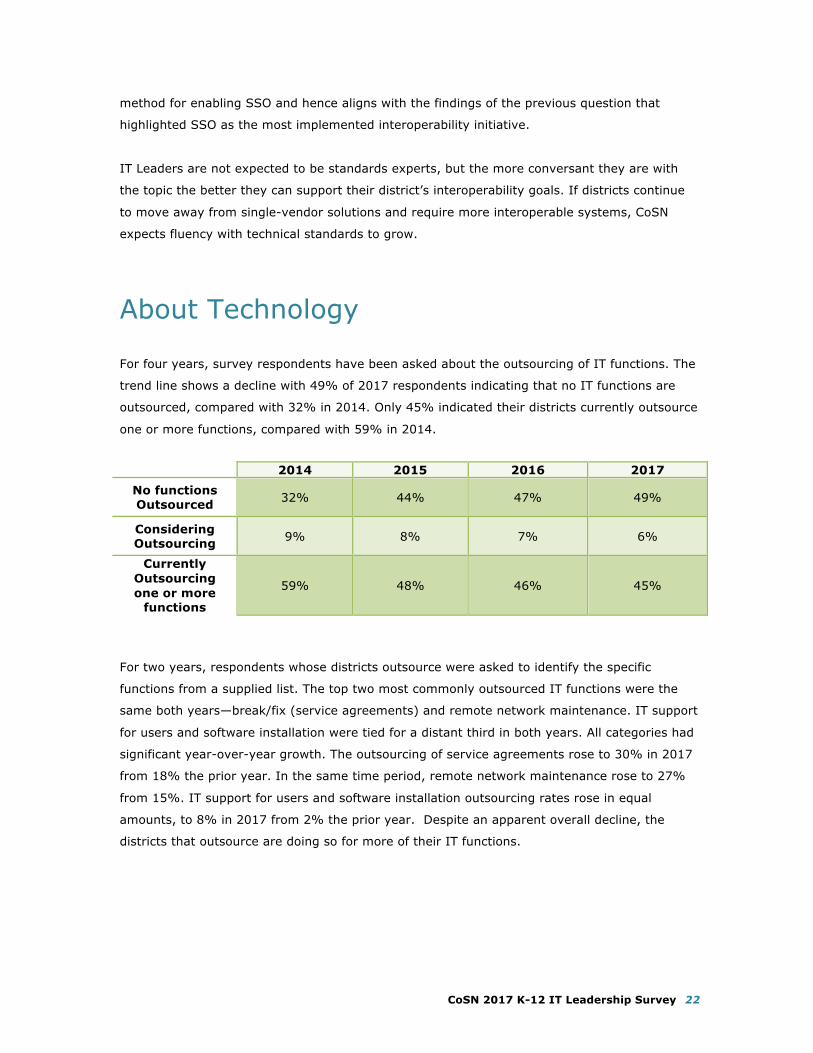
For two years, respondents whose districts outsource were asked to identify the specific
functions from a supplied list. The top two most commonly outsourced IT functions were the
same both years—break/fix (service agreements) and remote network maintenance. IT support
for users and software installation were tied for a distant third in both years. All categories had
significant year-over-year growth. The outsourcing of service agreements rose to 30% in 2017
from 18% the prior year. In the same time period, remote network maintenance rose to 27%
from 15%. IT support for users and software installation outsourcing rates rose in equal
amounts, to 8% in 2017 from 2% the prior year. Despite an apparent overall decline, the
districts that outsource are doing so for more of their IT functions.
CoSN 2017 K-12 IT Leadership Survey 23
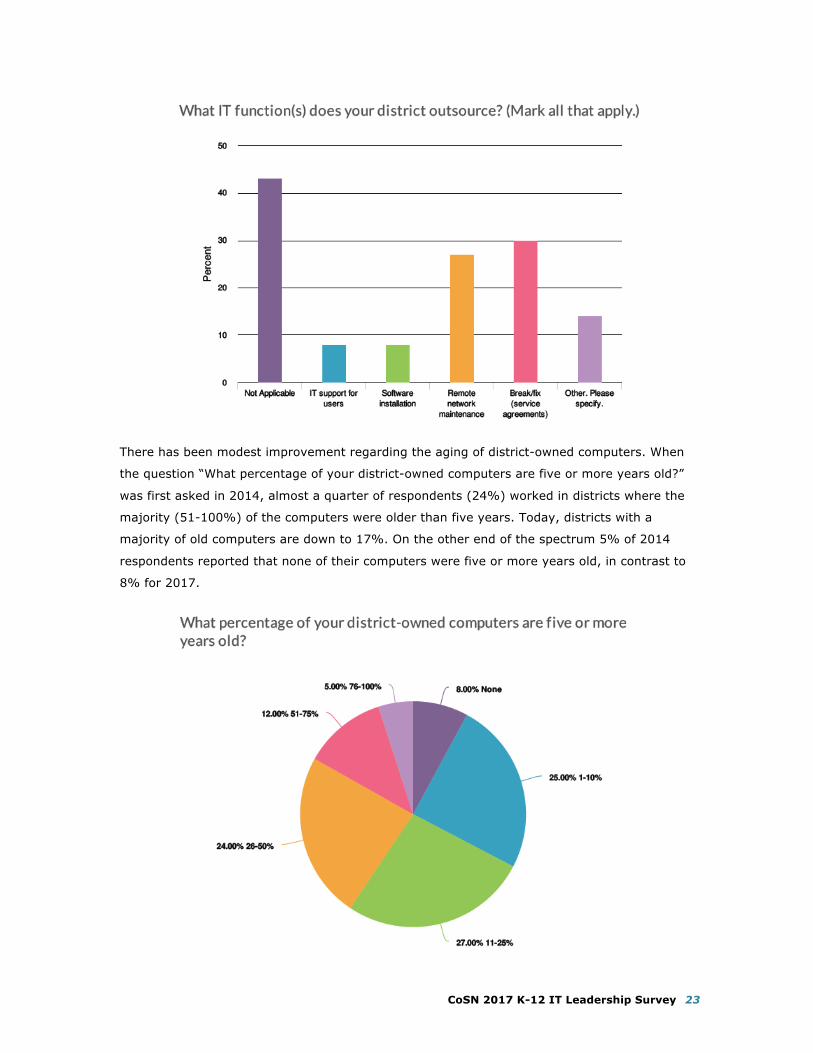
There has been modest improvement regarding the aging of district-owned computers. When
the question “What percentage of your district-owned computers are five or more years old?”
was first asked in 2014, almost a quarter of respondents (24%) worked in districts where the
majority (51-100%) of the computers were older than five years. Today, districts with a
majority of old computers are down to 17%. On the other end of the spectrum 5% of 2014
respondents reported that none of their computers were five or more years old, in contrast to
8% for 2017.
CoSN 2017 K-12 IT Leadership Survey 24
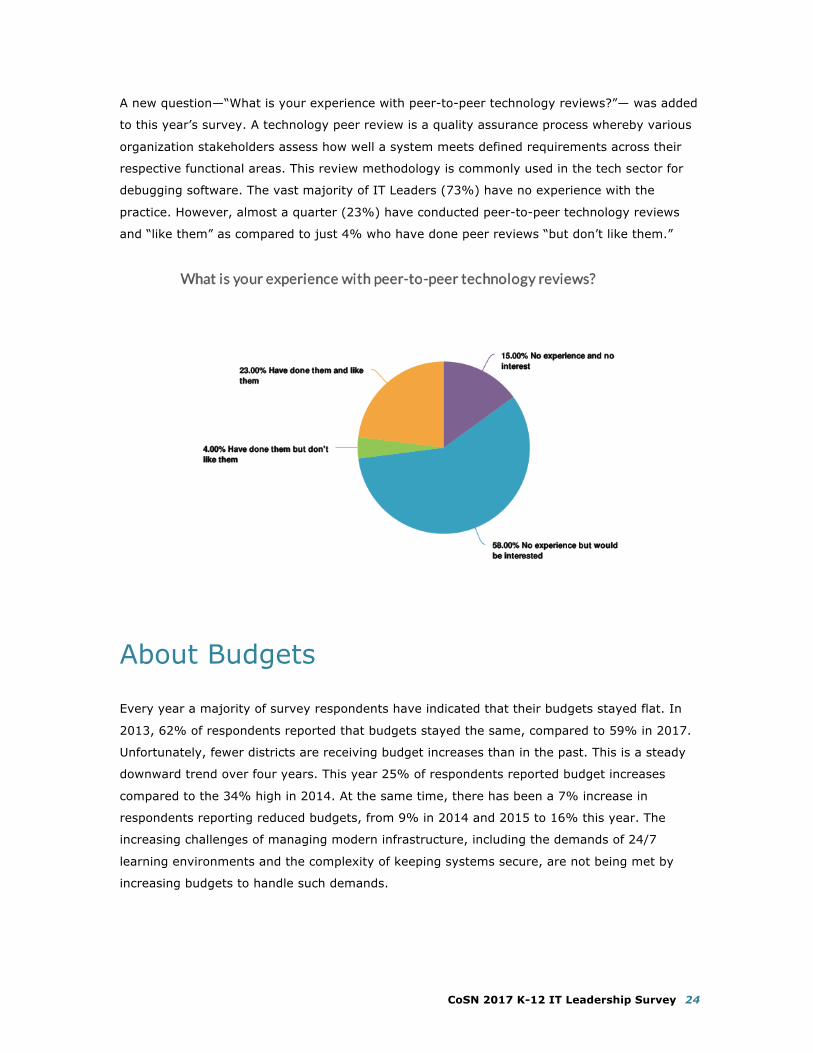
A new question—“What is your experience with peer-to-peer technology reviews?”— was added
to this year’s survey. A technology peer review is a quality assurance process whereby various
organization stakeholders assess how well a system meets defined requirements across their
respective functional areas. This review methodology is commonly used in the tech sector for
debugging software. The vast majority of IT Leaders (73%) have no experience with the
practice. However, almost a quarter (23%) have conducted peer-to-peer technology reviews
and “like them” as compared to just 4% who have done peer reviews “but don’t like them.”
About Budgets
Every year a majority of survey respondents have indicated that their budgets stayed flat. In
2013, 62% of respondents reported that budgets stayed the same, compared to 59% in 2017.
Unfortunately, fewer districts are receiving budget increases than in the past. This is a steady
downward trend over four years. This year 25% of respondents reported budget increases
compared to the 34% high in 2014. At the same time, there has been a 7% increase in
respondents reporting reduced budgets, from 9% in 2014 and 2015 to 16% this year. The
increasing challenges of managing modern infrastructure, including the demands of 24/7
learning environments and the complexity of keeping systems secure, are not being met by
increasing budgets to handle such demands.
CoSN 2017 K-12 IT Leadership Survey 25
Technology Budget
2013 2014 2015 2016 2017
Decreased 19% 9% 9% 13% 16%
Stayed the Same
62% 57% 60% 57% 59%
Increased 19% 34% 31% 30% 25%
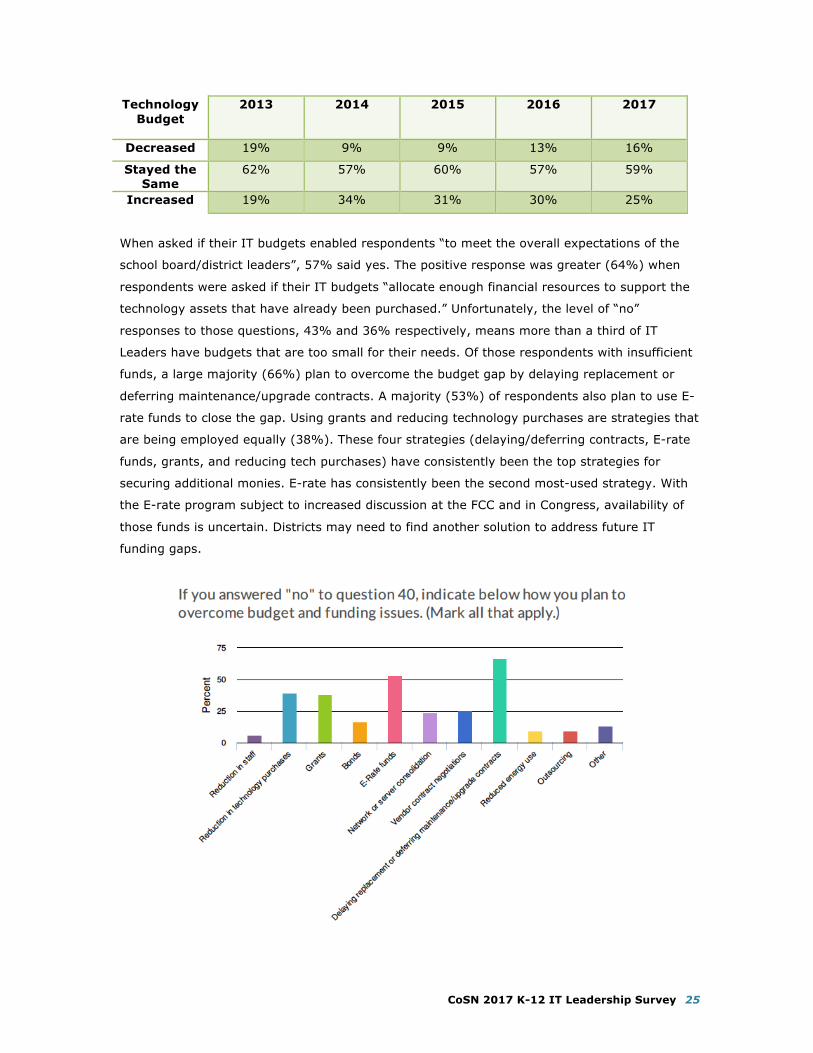
When asked if their IT budgets enabled respondents “to meet the overall expectations of the
school board/district leaders”, 57% said yes. The positive response was greater (64%) when
respondents were asked if their IT budgets “allocate enough financial resources to support the
technology assets that have already been purchased.” Unfortunately, the level of “no”
responses to those questions, 43% and 36% respectively, means more than a third of IT
Leaders have budgets that are too small for their needs. Of those respondents with insufficient
funds, a large majority (66%) plan to overcome the budget gap by delaying replacement or
deferring maintenance/upgrade contracts. A majority (53%) of respondents also plan to use E-
rate funds to close the gap. Using grants and reducing technology purchases are strategies that
are being employed equally (38%). These four strategies (delaying/deferring contracts, E-rate
funds, grants, and reducing tech purchases) have consistently been the top strategies for
securing additional monies. E-rate has consistently been the second most-used strategy. With
the E-rate program subject to increased discussion at the FCC and in Congress, availability of
those funds is uncertain. Districts may need to find another solution to address future IT
funding gaps.
CoSN 2017 K-12 IT Leadership Survey 26
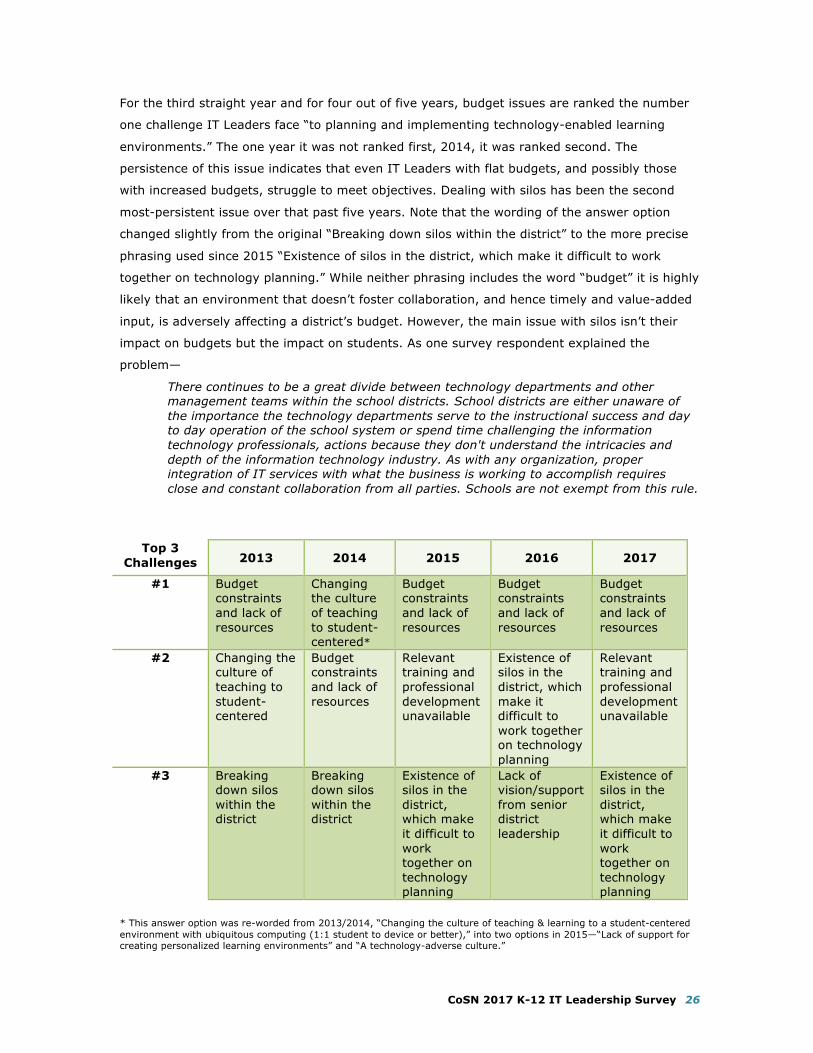
For the third straight year and for four out of five years, budget issues are ranked the number
one challenge IT Leaders face “to planning and implementing technology-enabled learning
environments.” The one year it was not ranked first, 2014, it was ranked second. The
persistence of this issue indicates that even IT Leaders with flat budgets, and possibly those
with increased budgets, struggle to meet objectives. Dealing with silos has been the second
most-persistent issue over that past five years. Note that the wording of the answer option
changed slightly from the original “Breaking down silos within the district” to the more precise
phrasing used since 2015 “Existence of silos in the district, which make it difficult to work
together on technology planning.” While neither phrasing includes the word “budget” it is highly
likely that an environment that doesn’t foster collaboration, and hence timely and value-added
input, is adversely affecting a district’s budget. However, the main issue with silos isn’t their
impact on budgets but the impact on students. As one survey respondent explained the
problem—
There continues to be a great divide between technology departments and other management teams within the school districts. School districts are either unaware of the importance the technology departments serve to the instructional success and day to day operation of the school system or spend time challenging the information technology professionals, actions because they don't understand the intricacies and depth of the information technology industry. As with any organization, proper integration of IT services with what the business is working to accomplish requires close and constant collaboration from all parties. Schools are not exempt from this rule.
Top 3 Challenges 2013 2014 2015 2016 2017
#1 Budget constraints and lack of resources
Changing the culture of teaching to student-centered*
Budget constraints and lack of resources
Budget constraints and lack of resources
Budget constraints and lack of resources
#2 Changing the culture of teaching to student-centered
Budget constraints and lack of resources
Relevant training and professional development unavailable
Existence of silos in the district, which make it difficult to work together on technology planning
Relevant training and professional development unavailable
#3 Breaking down silos within the district
Breaking down silos within the district
Existence of silos in the district, which make it difficult to work together on technology planning
Lack of vision/support from senior district leadership
Existence of silos in the district, which make it difficult to work together on technology planning
* This answer option was re-worded from 2013/2014, “Changing the culture of teaching & learning to a student-centered environment with ubiquitous computing (1:1 student to device or better),” into two options in 2015—“Lack of support for creating personalized learning environments” and “A technology-adverse culture.”
CoSN 2017 K-12 IT Leadership Survey 27
About Staffing
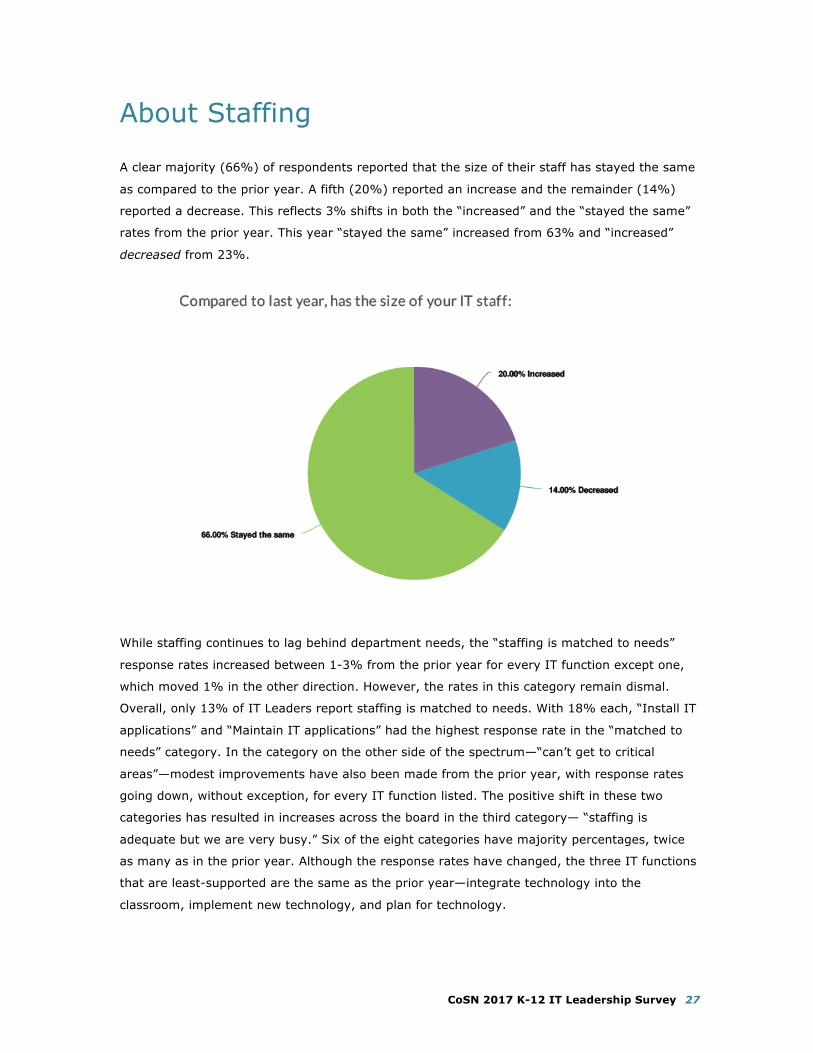
A clear majority (66%) of respondents reported that the size of their staff has stayed the same
as compared to the prior year. A fifth (20%) reported an increase and the remainder (14%)
reported a decrease. This reflects 3% shifts in both the “increased” and the “stayed the same”
rates from the prior year. This year “stayed the same” increased from 63% and “increased”
decreased from 23%.
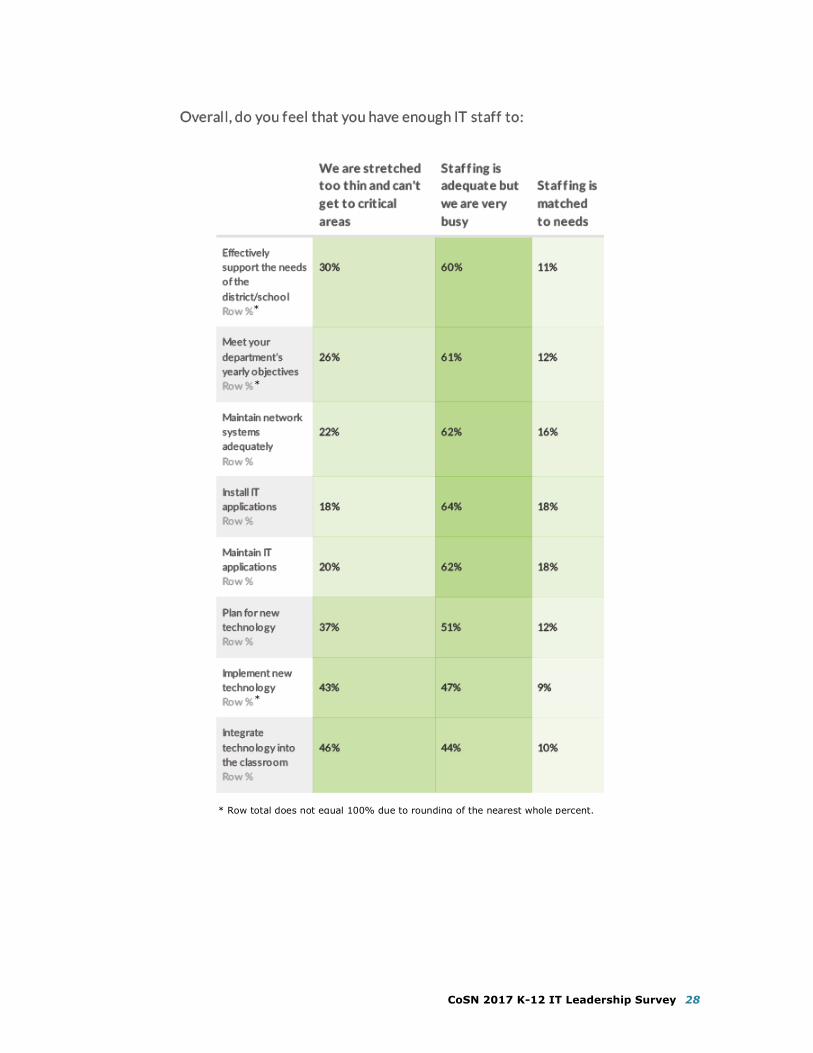
While staffing continues to lag behind department needs, the “staffing is matched to needs”
response rates increased between 1-3% from the prior year for every IT function except one,
which moved 1% in the other direction. However, the rates in this category remain dismal.
Overall, only 13% of IT Leaders report staffing is matched to needs. With 18% each, “Install IT
applications” and “Maintain IT applications” had the highest response rate in the “matched to
needs” category. In the category on the other side of the spectrum—“can’t get to critical
areas”—modest improvements have also been made from the prior year, with response rates
going down, without exception, for every IT function listed. The positive shift in these two
categories has resulted in increases across the board in the third category— “staffing is
adequate but we are very busy.” Six of the eight categories have majority percentages, twice
as many as in the prior year. Although the response rates have changed, the three IT functions
that are least-supported are the same as the prior year—integrate technology into the
classroom, implement new technology, and plan for technology.
CoSN 2017 K-12 IT Leadership Survey 28
* Row total does not equal 100% due to rounding of the nearest whole percent.
*
*
*
CoSN 2017 K-12 IT Leadership Survey 29
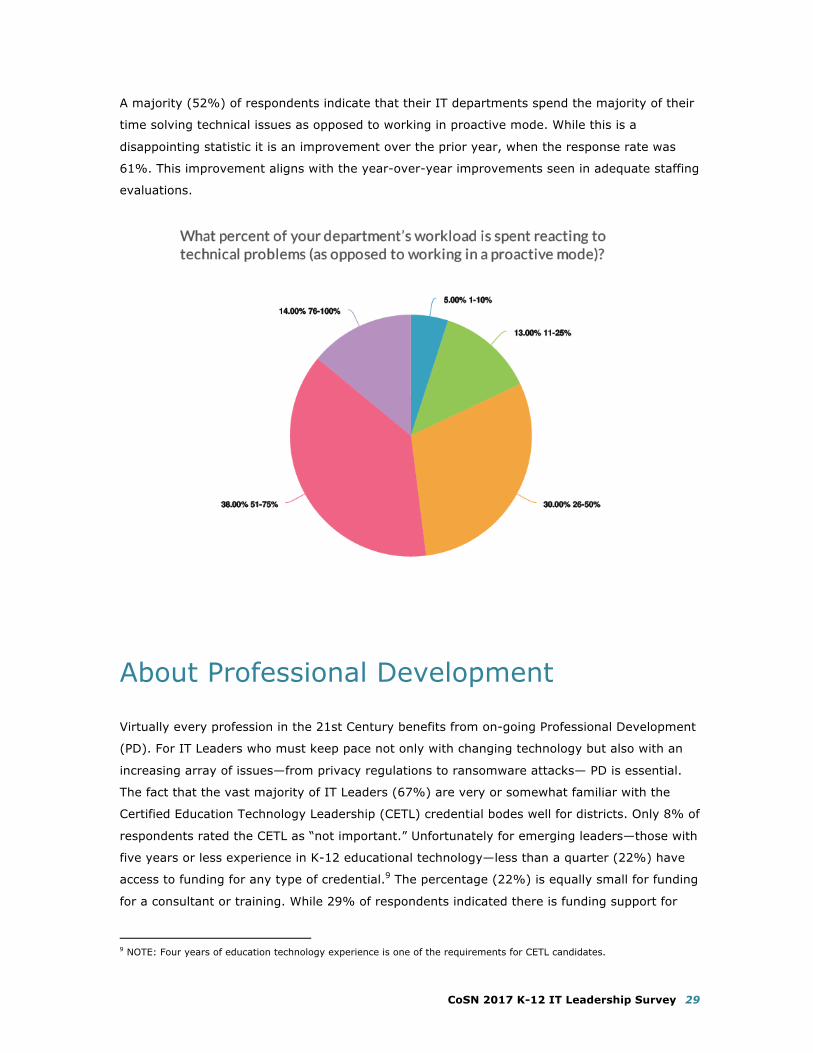
A majority (52%) of respondents indicate that their IT departments spend the majority of their
time solving technical issues as opposed to working in proactive mode. While this is a
disappointing statistic it is an improvement over the prior year, when the response rate was
61%. This improvement aligns with the year-over-year improvements seen in adequate staffing
evaluations.
About Professional Development
Virtually every profession in the 21st Century benefits from on-going Professional Development
(PD). For IT Leaders who must keep pace not only with changing technology but also with an
increasing array of issues—from privacy regulations to ransomware attacks— PD is essential.
The fact that the vast majority of IT Leaders (67%) are very or somewhat familiar with the
Certified Education Technology Leadership (CETL) credential bodes well for districts. Only 8% of
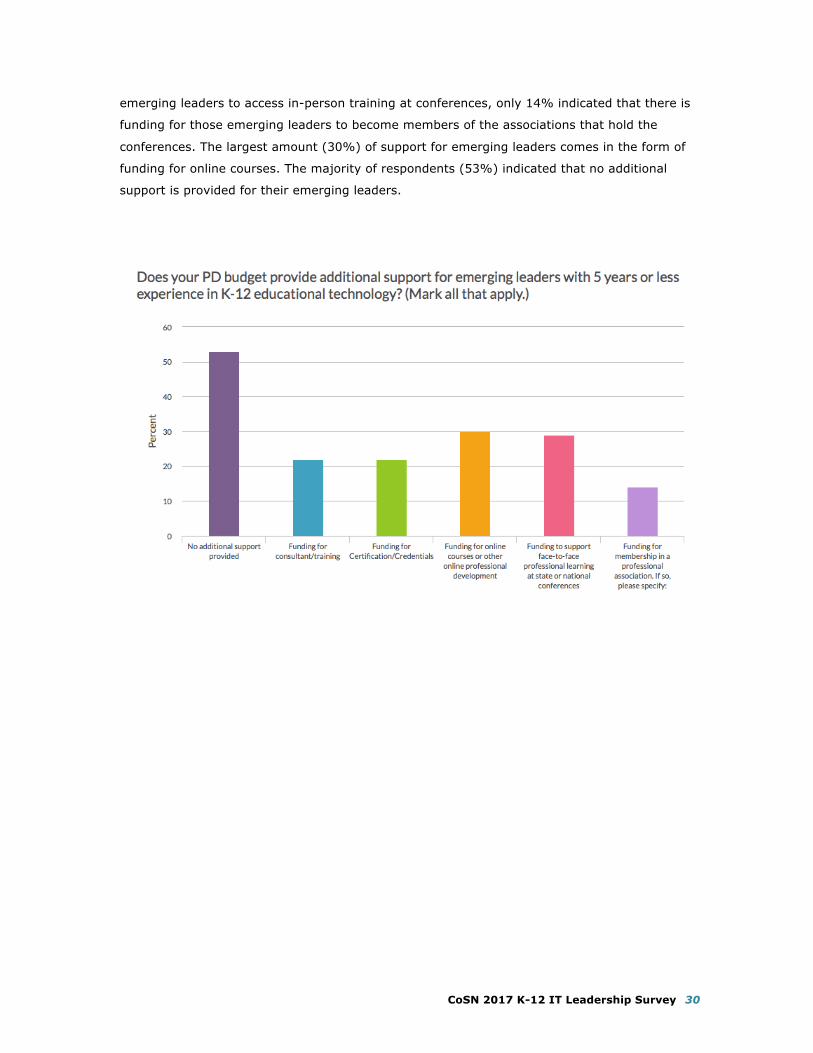
respondents rated the CETL as “not important.” Unfortunately for emerging leaders—those with
five years or less experience in K-12 educational technology—less than a quarter (22%) have
access to funding for any type of credential.9 The percentage (22%) is equally small for funding
for a consultant or training. While 29% of respondents indicated there is funding support for
9 NOTE: Four years of education technology experience is one of the requirements for CETL candidates.
CoSN 2017 K-12 IT Leadership Survey 30
emerging leaders to access in-person training at conferences, only 14% indicated that there is
funding for those emerging leaders to become members of the associations that hold the
conferences. The largest amount (30%) of support for emerging leaders comes in the form of
funding for online courses. The majority of respondents (53%) indicated that no additional
support is provided for their emerging leaders.
CoSN 2017 K-12 IT Leadership Survey 31
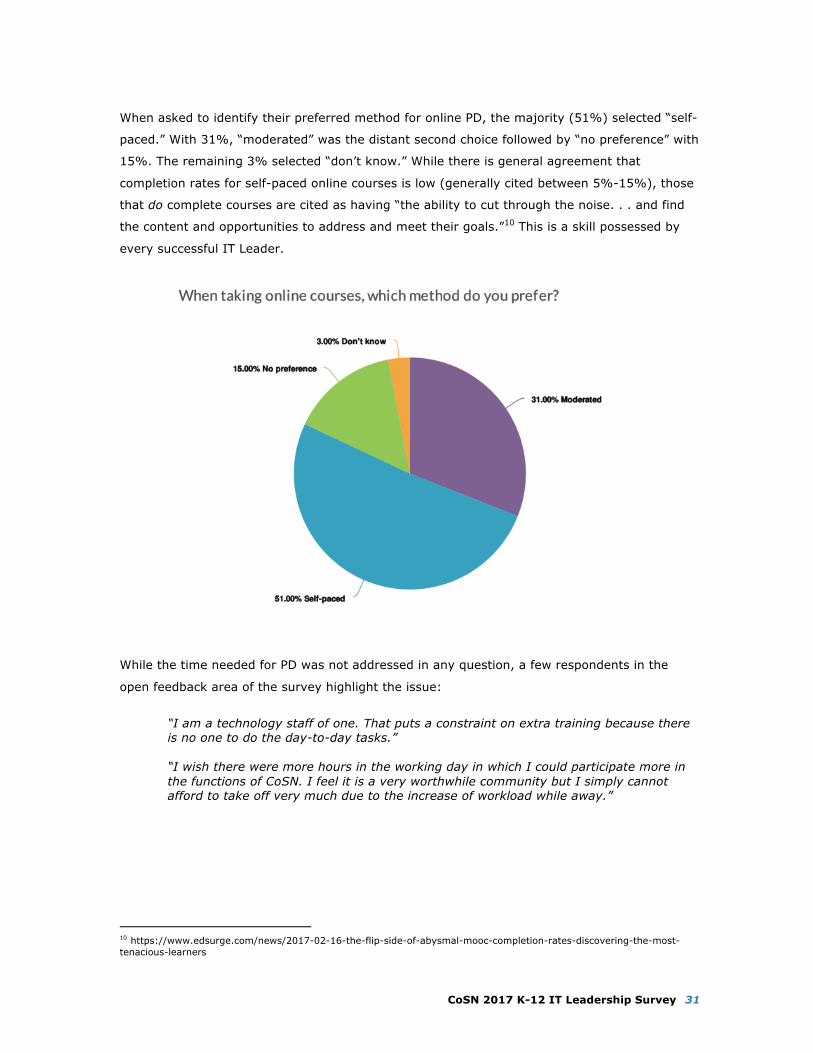
When asked to identify their preferred method for online PD, the majority (51%) selected “self-
paced.” With 31%, “moderated” was the distant second choice followed by “no preference” with
15%. The remaining 3% selected “don’t know.” While there is general agreement that
completion rates for self-paced online courses is low (generally cited between 5%-15%), those
that do complete courses are cited as having “the ability to cut through the noise. . . and find
the content and opportunities to address and meet their goals.”10 This is a skill possessed by
every successful IT Leader.
While the time needed for PD was not addressed in any question, a few respondents in the
open feedback area of the survey highlight the issue:
“I am a technology staff of one. That puts a constraint on extra training because there is no one to do the day-to-day tasks.” “I wish there were more hours in the working day in which I could participate more in the functions of CoSN. I feel it is a very worthwhile community but I simply cannot afford to take off very much due to the increase of workload while away.”
10 https://www.edsurge.com/news/2017-02-16-the-flip-side-of-abysmal-mooc-completion-rates-discovering-the-most-tenacious-learners
CoSN 2017 K-12 IT Leadership Survey 32
In Closing
Summary
Since the first annual CoSN IT Leadership Survey five years ago, there have been many shifts
in educational technology—affordable device options, access to open educational resources,
and the availability of online professional development. CoSN, currently celebrating its 25th
anniversary, no longer needs to ask survey respondents if they are “familiar with CoSN.”
However, not all changes are positive, and solving one problem can create another. As districts
have transitioned to digital environments, concerns have increased regarding data privacy and
data security. A low ranking priority in the early survey results, Cyber Security is now one of
the top concerns for IT Leaders. IT Leaders also contend with persistent issues that are
unrelated to their digital ecosystem. Five years of survey results show that budgets and
department silos consistently pose problems for them. Broader issues, such as racial diversity,
and lower priorities, like revising acceptable use policies, still require attention. Over the years,
the role of the IT Leader has continued to be vast in scope and complex in nature. And over the
years, CoSN has been here to support them.
About CoSN
CoSN (the Consortium for School Networking) is the premier professional association for
district technology leaders. For nearly quarter of a century, CoSN has provided leaders with the
management, community building, and advocacy tools they need to succeed. Today, CoSN
represents over 10 million students in school districts nationwide and continues to grow as a
powerful and influential voice in K-12 education.
CoSN Core Beliefs:
• The primary challenge we face in using technology effectively is human.
• Technology is a critical tool to personalize learning and overcome barriers of time and
space for each learner.
• Equitable and ubiquitous access to technology is a necessity.
• The effective use of technology for the systemic transformation of learning cannot occur
without strong organization, leadership, and vision.
• Technological fluency allows our children to be prepared for the world of today and
tomorrow.
CoSN 2017 K-12 IT Leadership Survey 33
CoSN Resources
CoSN’s Certified Education Technology Leader (CETL)™ Certification program –
www.cosn.org/certification
Leadership & Vision
• Leadership for Mobile Learning – www.cosn.org/MobileLead
• The Empowered Superintendent - http://www.cosn.org/superintendents
• Digital Equity Toolkit - http://www.cosn.org/digital-equity-action-toolkit-february-2016
• Participatory Learning in Schools: Leadership and Policy –
www.cosn.org/participatoryLearning
• Collaboration for Innovation: Advancing Excellence and Equity –
www.cosn.org/OnlineCoP
Understanding the Educational Environment
• Teaming for Transformation – www.cosn.org/OnlineCoP
• CoSN’s Annual E-rate and Broadband Survey – www.cosn.org/ErateSurvey
Managing Technology & Support Resources
• Smart Education Networks by Design (SEND) – www.cosn.org/SmartEdNetworks
• Protecting Privacy in Connected Learning - http://www.cosn.org/focus-
areas/leadership-vision/protecting-privacy
• Interoperability Standards - http://www.cosn.org/interoperability-standards
• Raising the BAR: Becoming Assessment Ready – http://www.cosn.org/assessment
• Data-Driven Decision Making – www.cosn.org/3dm
CoSN 2017 K-12 IT Leadership Survey 34
About Our Partner
MDR connects brands with 7M educators every day using powerful, modern, and effective
marketing solutions. We are expert marketers with unmatched expertise in education. Build
your brand, champion a cause, and/or inspire a child by leveraging our suite of email marketing,
market intelligence, creative services, database, and technology services. Speak directly to
your desired audience through our School Leaders Now, WeAreTeachers, WeAreParents and
EdNET communities. Align your brand with the most trusted partner in education marketing,
MDR.
About Our Sponsor
SchoolDude is the market leader in education enterprise asset management. Our cloud
solutions help small and large institutions save time and money by managing operations
effectively and efficiently, allowing institutions to provide a safe teaching and learning
environment. SchoolDude is the #1 provider of cloud solutions that helps public and private
schools, colleges, and universities better manage IT, facilities, and business operations.
SchoolDude provides a full suite of solutions for educational institutions to streamline their
operations. Our technology management solutions improve the efficiency of the IT help desk
and provide visibility and transparency to successfully manage the technology infrastructure, IT
asset hardware, operating systems, software, and mobile devices. SchoolDude also helps
schools manage maintenance, inventory, future capital needs, after-hours events and cost
recovery efforts, safety and security, and utility usage and energy conservation. SchoolDude’s
full suite of cloud-based software provides institutions with a lower cost of ownership, scalable
solutions, unlimited support, and benchmarks for success based upon data from thousands of
schools, districts, and higher education institutions.
Paula Maylahn, an education industry consultant with over 30 years’ experience across the K-20 spectrum,
prepared this report. Paula is a contributing author on two books, The Experts’ Guide to the K-12 Market and The
Experts’ Guide to the Postsecondary Market, and has penned the “Enterprise Systems” chapter of the 2016 and
2015 editions of the State of the K-12 Market publication. Paula is a member of CoSN’s Standards and Technical
Committee, a former board member of the Education Division of the Software & Information Industry Association,
and an Executive Council member of the PreK-12 Learning Group of the Association of American Publishers.