juvenile recidivism 2015 - in juvenile recidivism rate: 35.3% ... juvenile recidivism 2015 . table...
TRANSCRIPT

The Indiana Department of Correction (IDOC) defines recidivism as a return to incarceration within three years of the offender’s date of release from a state correctional institution.
This study looks at Juvenile offenders released in 2012 and follows the
offender for three years from their release date to determine if the offender returned to incarceration in either a Juvenile or Adult Facility.
2015 Juvenile Recidivism Rate: 35.3% ■ 1,013 Releases ■ 358 Returns (169 as a juvenile, 189 as an adult)
■ 79.1% of juvenile releases had not been incarcerated in an Adult facility within 3 years of their 2012 release from a Juvenile institution
Of all juveniles released in 2012 37.9% of males returned to IDOC,
while only 21.1% of females returned. Approximately 43.9% of African American juvenile offenders returned
to the Department of Correction, a higher rate than any other major race or ethnicity.
Nearly 87% of juveniles who recidivated were returned to IDOC for
the commission of a new crime, compared to 13% of returns which were for a technical violation of post-release supervision.
Juvenile offenders whose offense severity level was classified as
‘Serious’ were most likely to return to incarceration. Juvenile offenders released in 2012 who were identified as a sex
offender, returned to IDOC less frequently than the overall rate. Only 2.0% of identified juvenile sex offenders released in 2012
returned to IDOC for the commission of a new sex offense.
JUVENILE RECIDIVISM 2015
TABLE
OF
CONTENTS
IDOC Overall Recidivism Rates 2
Success Rate 3
Gender 4
Race 5
Type of Release 6
Type of Return 7
Severity Level 8
Offense Category 9
Age at Release 10
Length of Stay 11
Sex Offenders 12-16
Methodology 1

Juvenile Recidivism Rates, 2015 Indiana Department of Correction
The mission of the Division of Youth Services is focused on community protection, accountability, beliefs that foster responsible community living and competency development.
- 1 -
Recidivism Methodology
The Indiana Department of Correction (IDOC) defines recidivism as a return to
incarceration within three years of the juvenile’s date of release from a state correctional
institution. This particular study followed all students released from IDOC during calendar year
2012 to determine if they returned to incarceration, in either a juvenile or adult facility, within
three years of their respective release date.
Chronological order was followed to determine how to accurately assess each student.
To that effect, if a juvenile was returned to a juvenile facility, for purposes of the recidivism rate,
he/she was counted as a recidivist to a juvenile facility and not researched any further.
Success Rate Methodology
The rate of success for each student is established by determining if each juvenile
released in 2012 was subsequently returned to incarceration in an adult facility only. Students
released from a state correctional facility who remained free of adult incarceration three years
after their release, were deemed as successfully re-entering society.
Juvenile Recidivism Rates, 2015 Indiana Department of Correction
The mission of the Division of Youth Services is focused on community protection, accountability, beliefs that foster responsible community living and competency development.
- 2 -
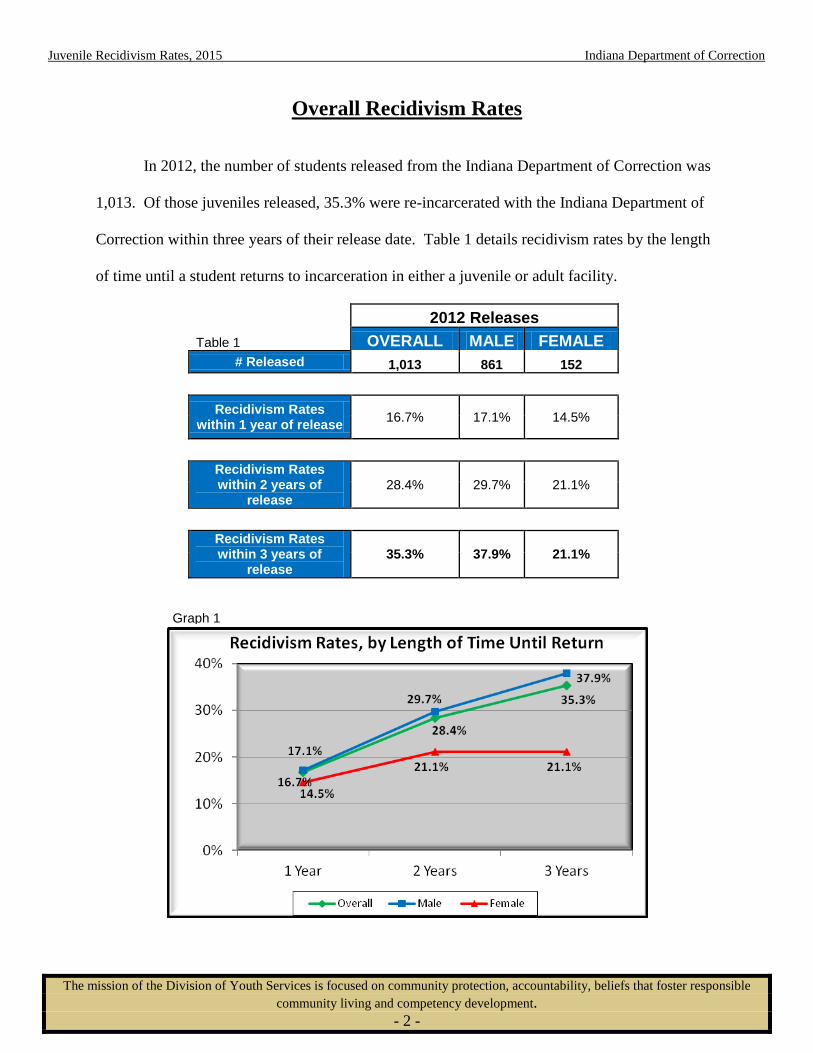
Overall Recidivism Rates In 2012, the number of students released from the Indiana Department of Correction was
1,013. Of those juveniles released, 35.3% were re-incarcerated with the Indiana Department of
Correction within three years of their release date. Table 1 details recidivism rates by the length
of time until a student returns to incarceration in either a juvenile or adult facility.
2012 Releases
Table 1 OVERALL MALE FEMALE # Released 1,013 861 152
Recidivism Rates
within 1 year of release 16.7% 17.1% 14.5%
Recidivism Rates within 2 years of
release 28.4% 29.7% 21.1%
Recidivism Rates within 3 years of
release 35.3% 37.9% 21.1%
Graph 1

Juvenile Recidivism Rates, 2015 Indiana Department of Correction
The mission of the Division of Youth Services is focused on community protection, accountability, beliefs that foster responsible community living and competency development.
- 3 -
Success Rate
The ultimate goal of any juvenile who has been released from a juvenile correctional
setting is for them to remain crime free and not become incarcerated as an adult. The Indiana
Department of Correction is obligated to serve all youth incarcerated in the State of Indiana and
prepare them to re-enter their communities, in hope that they will become successful law-abiding
citizens. Of the 1,013 juveniles released in 2012, 79.1% (801) were successfully re-integrated
into their communities and were not incarcerated in an adult correctional facility within three
years of their release.
Graph 2
Juvenile Recidivism Rates, 2015 Indiana Department of Correction
The mission of the Division of Youth Services is focused on community protection, accountability, beliefs that foster responsible community living and competency development.
- 4 -
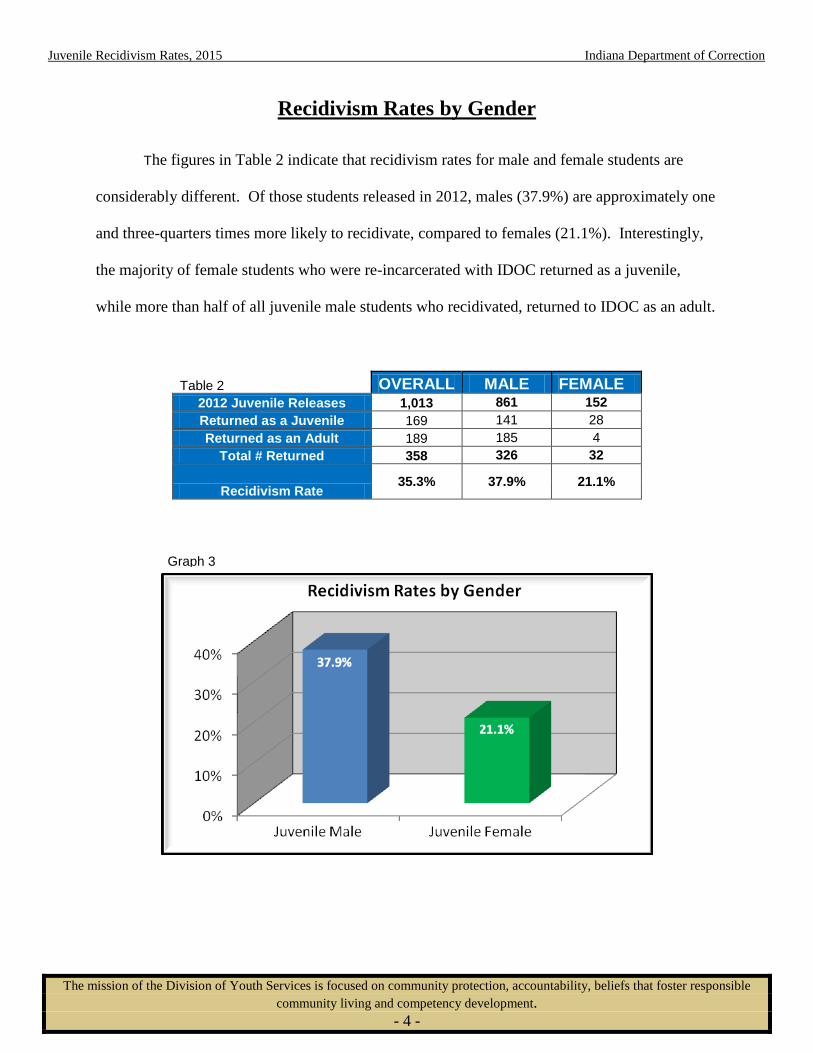
Recidivism Rates by Gender The figures in Table 2 indicate that recidivism rates for male and female students are
considerably different. Of those students released in 2012, males (37.9%) are approximately one
and three-quarters times more likely to recidivate, compared to females (21.1%). Interestingly,
the majority of female students who were re-incarcerated with IDOC returned as a juvenile,
while more than half of all juvenile male students who recidivated, returned to IDOC as an adult.
Table 2 OVERALL MALE FEMALE 2012 Juvenile Releases 1,013 861 152 Returned as a Juvenile 169 141 28 Returned as an Adult 189 185 4
Total # Returned 358 326 32
Recidivism Rate 35.3% 37.9% 21.1%
Graph 3
Juvenile Recidivism Rates, 2015 Indiana Department of Correction
The mission of the Division of Youth Services is focused on community protection, accountability, beliefs that foster responsible community living and competency development.
- 5 -
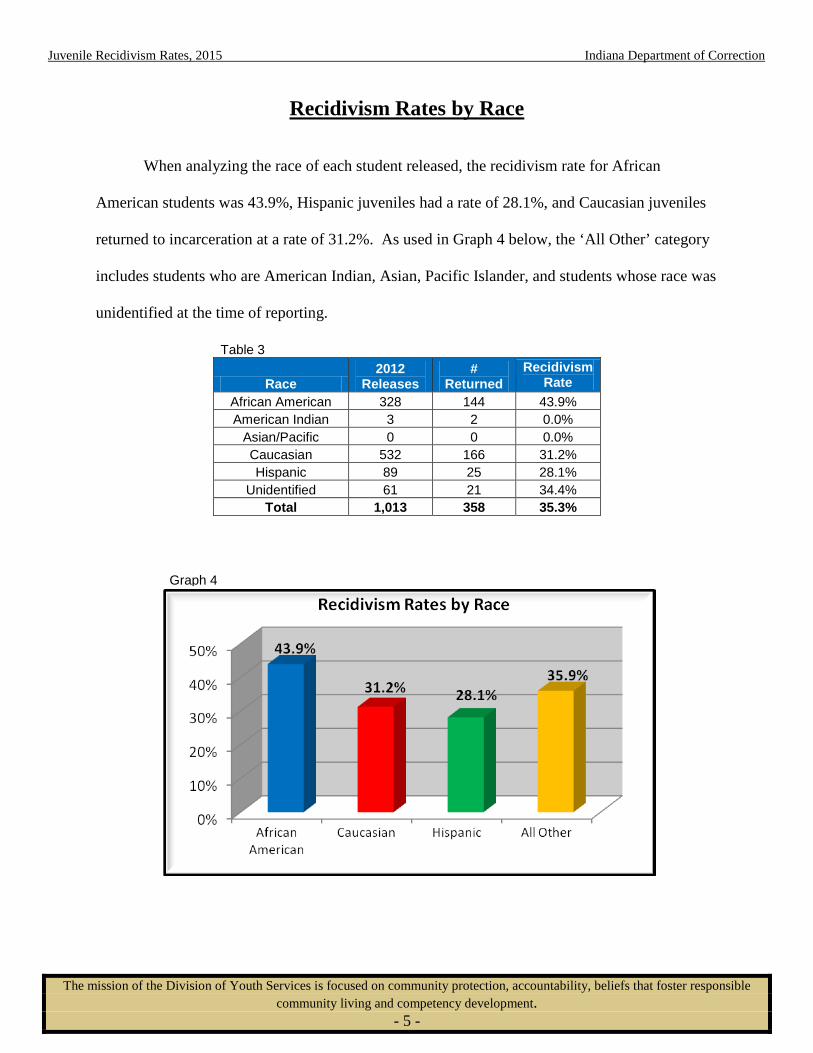
Recidivism Rates by Race
When analyzing the race of each student released, the recidivism rate for African
American students was 43.9%, Hispanic juveniles had a rate of 28.1%, and Caucasian juveniles
returned to incarceration at a rate of 31.2%. As used in Graph 4 below, the ‘All Other’ category
includes students who are American Indian, Asian, Pacific Islander, and students whose race was
unidentified at the time of reporting.
Table 3
Race 2012
Releases #
Returned Recidivism
Rate African American 328 144 43.9% American Indian 3 2 0.0%
Asian/Pacific 0 0 0.0% Caucasian 532 166 31.2% Hispanic 89 25 28.1%
Unidentified 61 21 34.4% Total 1,013 358 35.3%
Graph 4
Juvenile Recidivism Rates, 2015 Indiana Department of Correction
The mission of the Division of Youth Services is focused on community protection, accountability, beliefs that foster responsible community living and competency development.
- 6 -
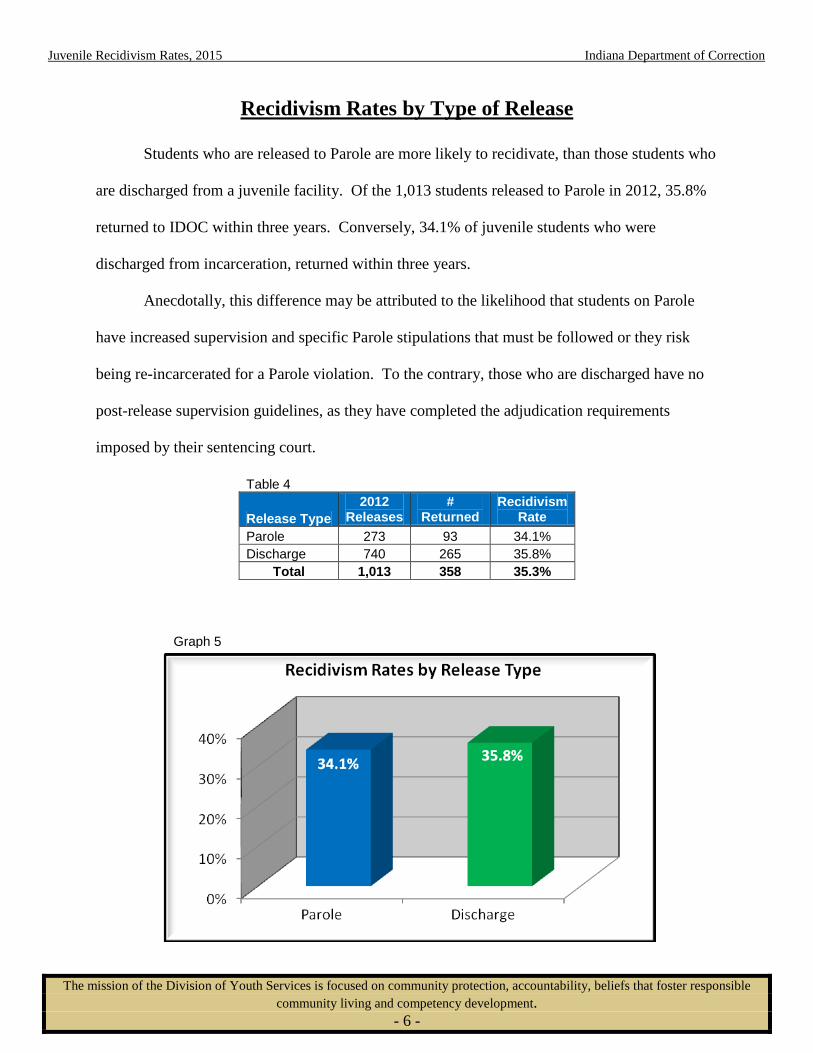
Recidivism Rates by Type of Release
Students who are released to Parole are more likely to recidivate, than those students who
are discharged from a juvenile facility. Of the 1,013 students released to Parole in 2012, 35.8%
returned to IDOC within three years. Conversely, 34.1% of juvenile students who were
discharged from incarceration, returned within three years.
Anecdotally, this difference may be attributed to the likelihood that students on Parole
have increased supervision and specific Parole stipulations that must be followed or they risk
being re-incarcerated for a Parole violation. To the contrary, those who are discharged have no
post-release supervision guidelines, as they have completed the adjudication requirements
imposed by their sentencing court.
Table 4
Release Type 2012
Releases #
Returned Recidivism
Rate Parole 273 93 34.1% Discharge 740 265 35.8%
Total 1,013 358 35.3%
Graph 5
Juvenile Recidivism Rates, 2015 Indiana Department of Correction
The mission of the Division of Youth Services is focused on community protection, accountability, beliefs that foster responsible community living and competency development.
- 7 -
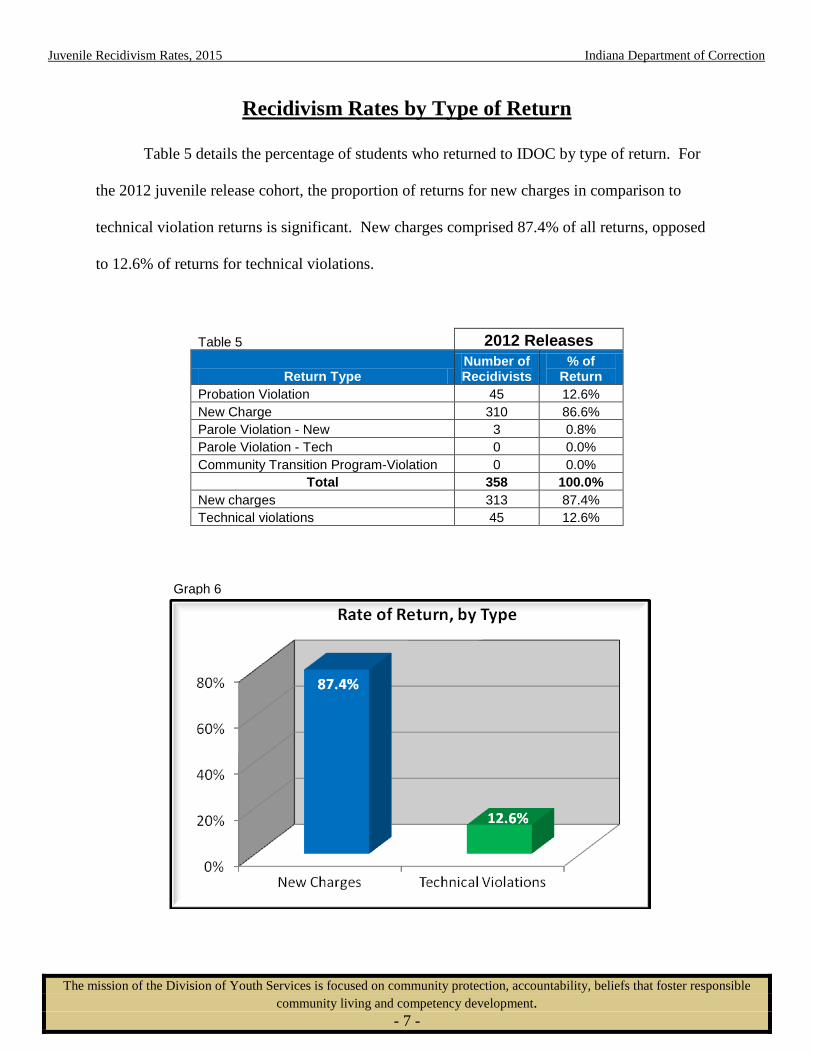
Recidivism Rates by Type of Return
Table 5 details the percentage of students who returned to IDOC by type of return. For
the 2012 juvenile release cohort, the proportion of returns for new charges in comparison to
technical violation returns is significant. New charges comprised 87.4% of all returns, opposed
to 12.6% of returns for technical violations.
Table 5 2012 Releases
Return Type Number of Recidivists
% of Return
Probation Violation 45 12.6% New Charge 310 86.6% Parole Violation - New 3 0.8% Parole Violation - Tech 0 0.0% Community Transition Program-Violation 0 0.0%
Total 358 100.0% New charges 313 87.4% Technical violations 45 12.6%
Graph 6
Juvenile Recidivism Rates, 2015 Indiana Department of Correction
The mission of the Division of Youth Services is focused on community protection, accountability, beliefs that foster responsible community living and competency development.
- 8 -
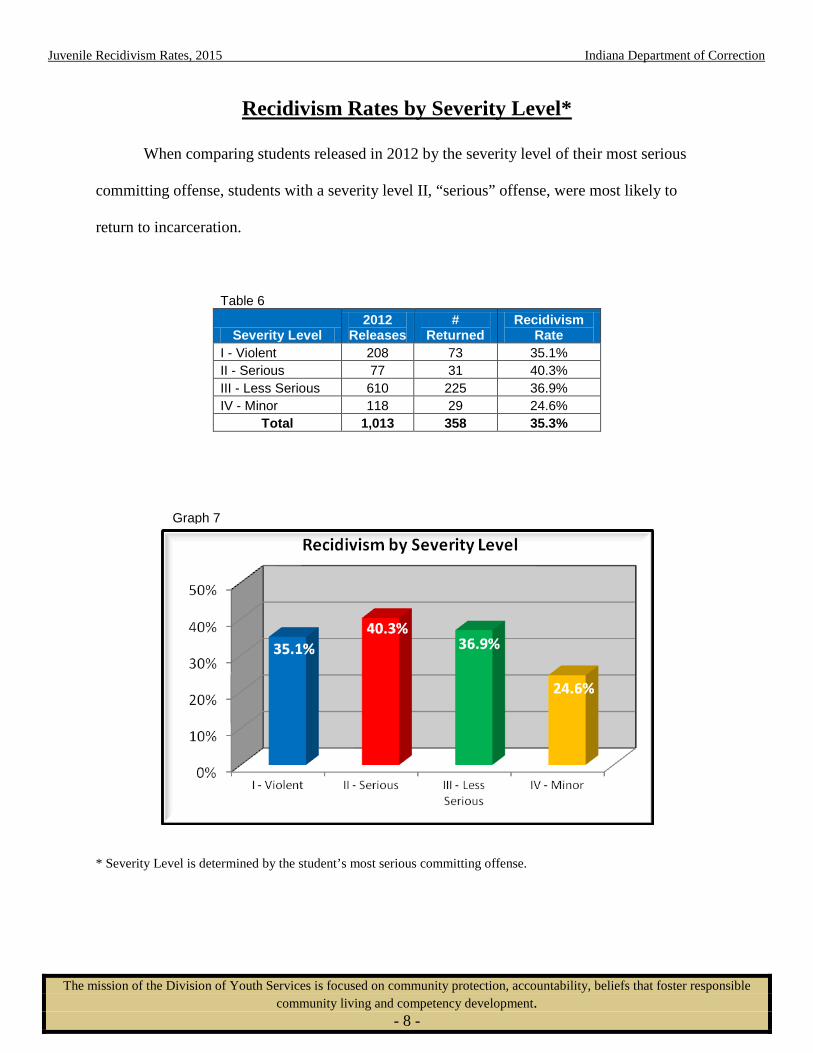
Recidivism Rates by Severity Level*
When comparing students released in 2012 by the severity level of their most serious
committing offense, students with a severity level II, “serious” offense, were most likely to
return to incarceration.
Table 6
Severity Level 2012
Releases #
Returned Recidivism
Rate I - Violent 208 73 35.1% II - Serious 77 31 40.3% III - Less Serious 610 225 36.9% IV - Minor 118 29 24.6%
Total 1,013 358 35.3%
* Severity Level is determined by the student’s most serious committing offense.
Graph 7
Juvenile Recidivism Rates, 2015 Indiana Department of Correction
The mission of the Division of Youth Services is focused on community protection, accountability, beliefs that foster responsible community living and competency development.
- 9 -
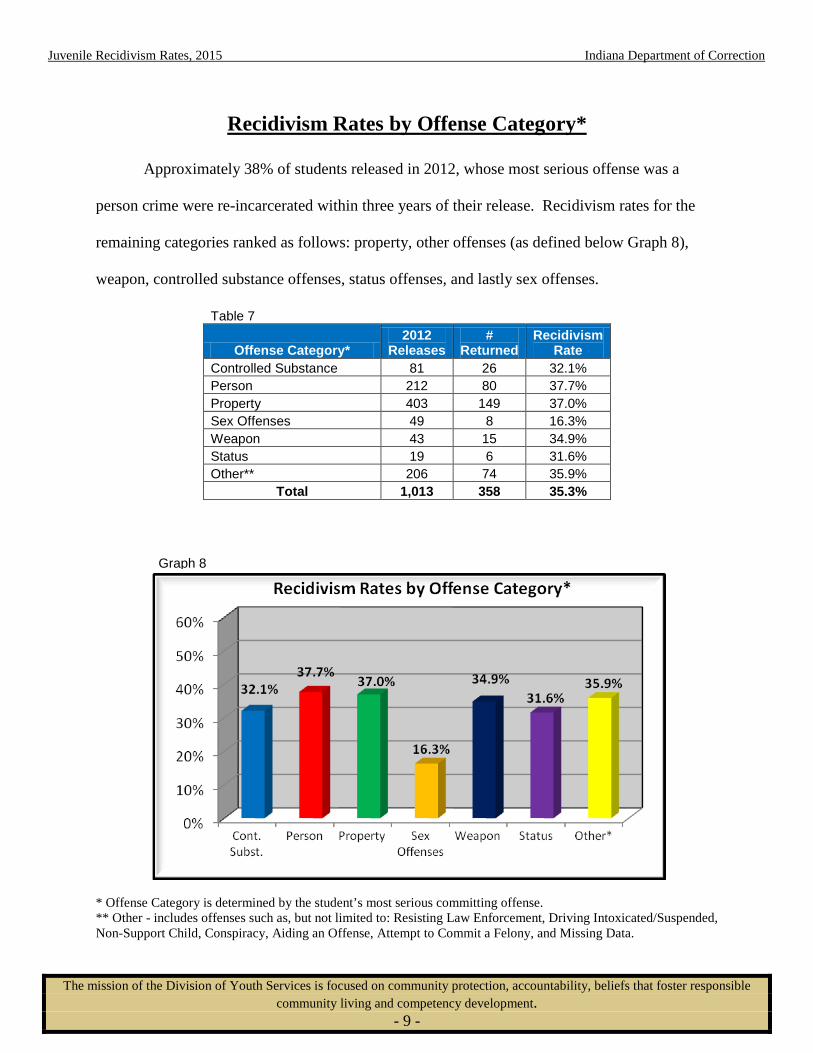
Recidivism Rates by Offense Category*
Approximately 38% of students released in 2012, whose most serious offense was a
person crime were re-incarcerated within three years of their release. Recidivism rates for the
remaining categories ranked as follows: property, other offenses (as defined below Graph 8),
weapon, controlled substance offenses, status offenses, and lastly sex offenses.
Table 7
Offense Category* 2012
Releases #
Returned Recidivism
Rate Controlled Substance 81 26 32.1% Person 212 80 37.7% Property 403 149 37.0% Sex Offenses 49 8 16.3% Weapon 43 15 34.9% Status 19 6 31.6% Other** 206 74 35.9%
Total 1,013 358 35.3%
* Offense Category is determined by the student’s most serious committing offense. ** Other - includes offenses such as, but not limited to: Resisting Law Enforcement, Driving Intoxicated/Suspended, Non-Support Child, Conspiracy, Aiding an Offense, Attempt to Commit a Felony, and Missing Data.
Graph 8
Juvenile Recidivism Rates, 2015 Indiana Department of Correction
The mission of the Division of Youth Services is focused on community protection, accountability, beliefs that foster responsible community living and competency development.
- 10 -
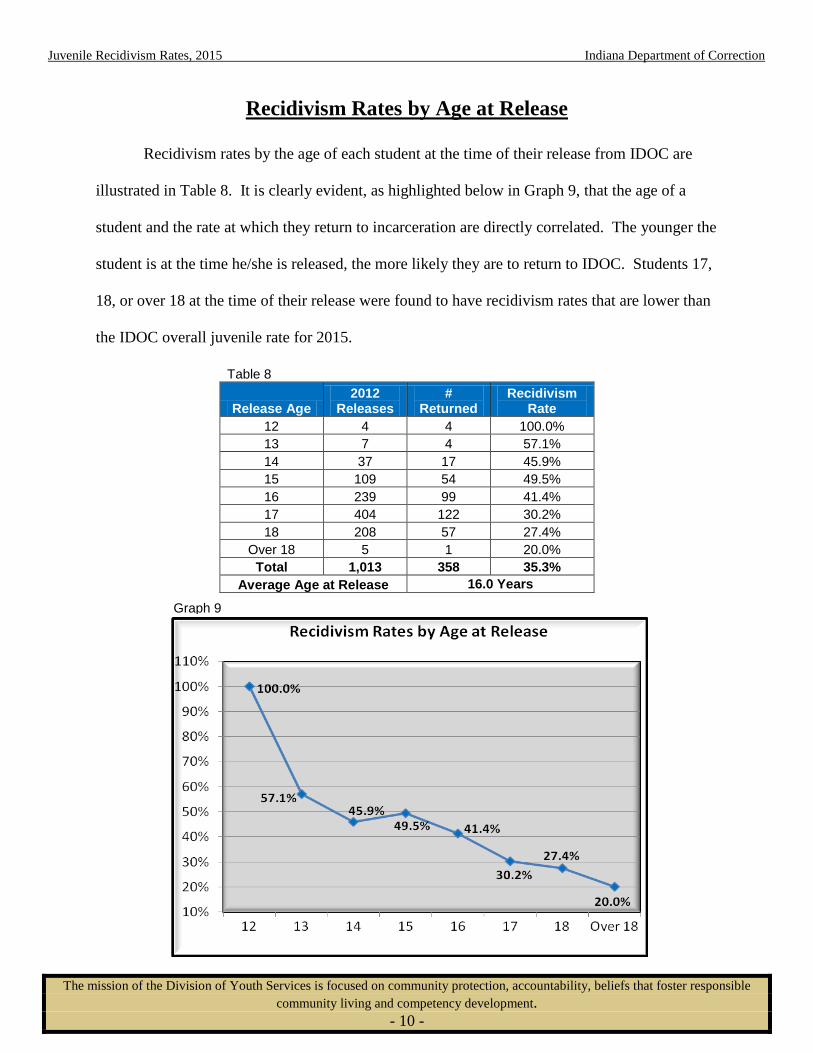
Recidivism Rates by Age at Release
Recidivism rates by the age of each student at the time of their release from IDOC are
illustrated in Table 8. It is clearly evident, as highlighted below in Graph 9, that the age of a
student and the rate at which they return to incarceration are directly correlated. The younger the
student is at the time he/she is released, the more likely they are to return to IDOC. Students 17,
18, or over 18 at the time of their release were found to have recidivism rates that are lower than
the IDOC overall juvenile rate for 2015.
Table 8
Release Age 2012
Releases #
Returned Recidivism
Rate 12 4 4 100.0% 13 7 4 57.1% 14 37 17 45.9% 15 109 54 49.5% 16 239 99 41.4% 17 404 122 30.2% 18 208 57 27.4%
Over 18 5 1 20.0% Total 1,013 358 35.3%
Average Age at Release 16.0 Years
Graph 9
Juvenile Recidivism Rates, 2015 Indiana Department of Correction
The mission of the Division of Youth Services is focused on community protection, accountability, beliefs that foster responsible community living and competency development.
- 11 -
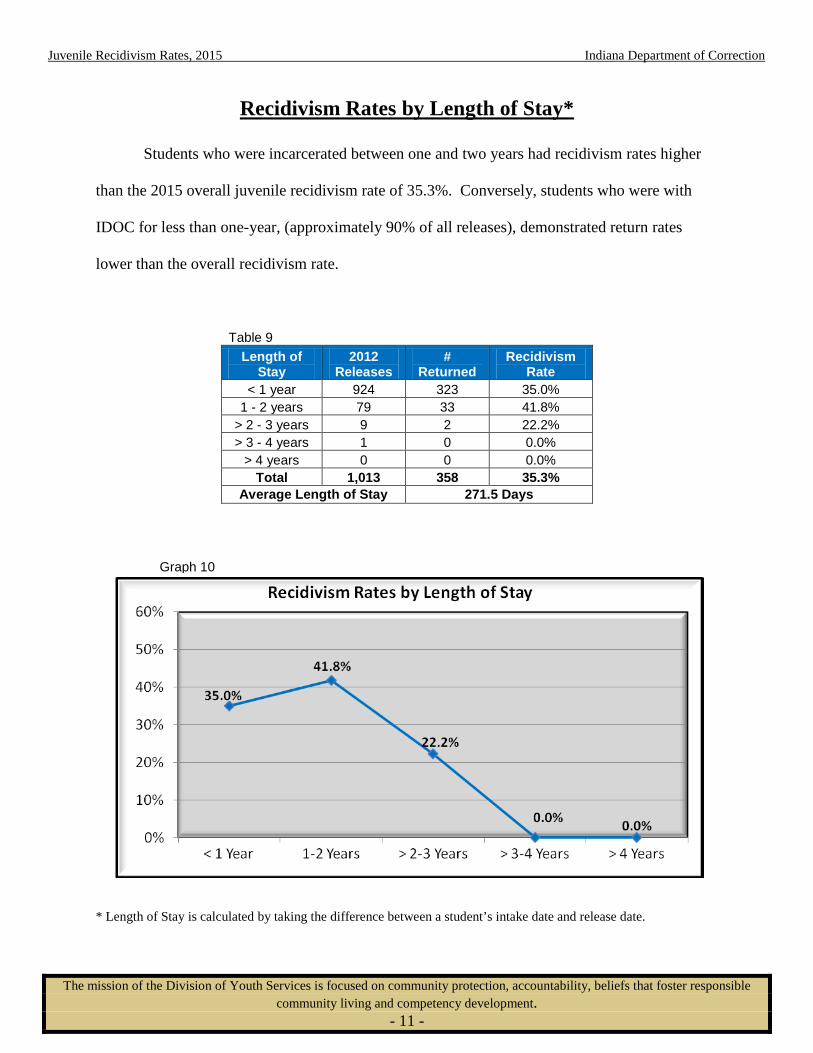
Recidivism Rates by Length of Stay*
Students who were incarcerated between one and two years had recidivism rates higher
than the 2015 overall juvenile recidivism rate of 35.3%. Conversely, students who were with
IDOC for less than one-year, (approximately 90% of all releases), demonstrated return rates
lower than the overall recidivism rate.
Table 9 Length of
Stay 2012
Releases #
Returned Recidivism
Rate < 1 year 924 323 35.0%
1 - 2 years 79 33 41.8% > 2 - 3 years 9 2 22.2% > 3 - 4 years 1 0 0.0%
> 4 years 0 0 0.0% Total 1,013 358 35.3%
Average Length of Stay 271.5 Days
* Length of Stay is calculated by taking the difference between a student’s intake date and release date.
Graph 10
Juvenile Recidivism Rates, 2015 Indiana Department of Correction
The mission of the Division of Youth Services is focused on community protection, accountability, beliefs that foster responsible community living and competency development.
- 12 -
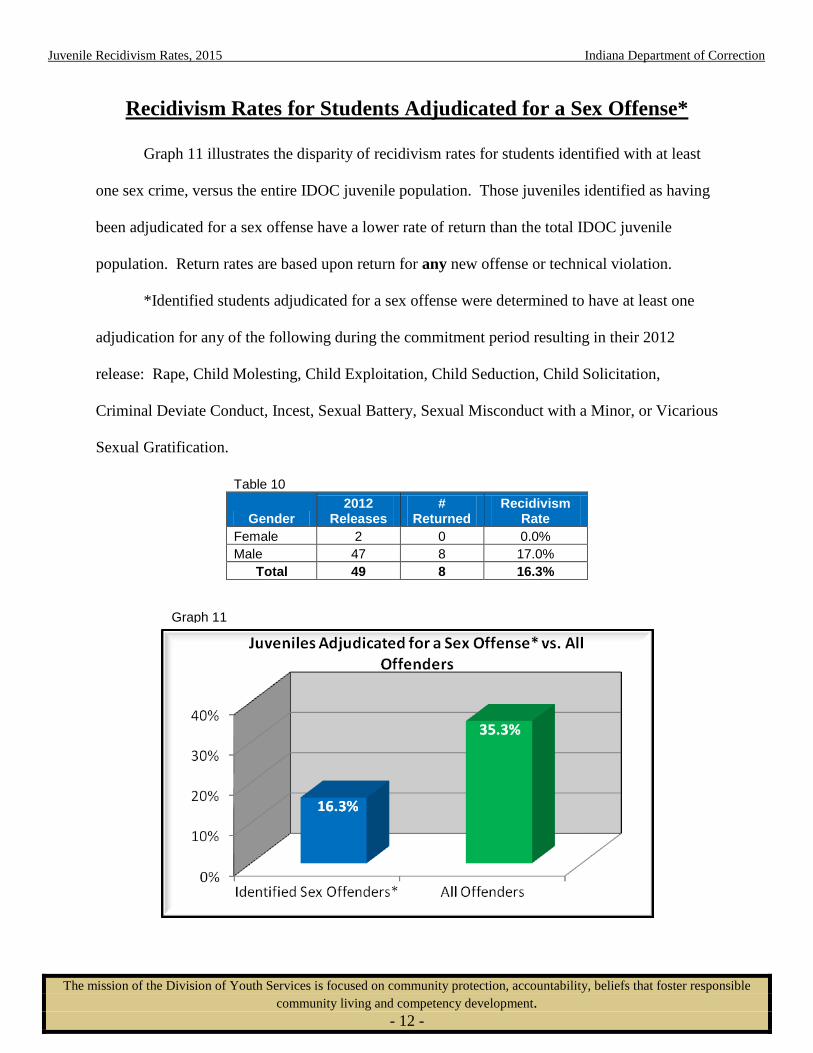
Recidivism Rates for Students Adjudicated for a Sex Offense*
Graph 11 illustrates the disparity of recidivism rates for students identified with at least
one sex crime, versus the entire IDOC juvenile population. Those juveniles identified as having
been adjudicated for a sex offense have a lower rate of return than the total IDOC juvenile
population. Return rates are based upon return for any new offense or technical violation.
*Identified students adjudicated for a sex offense were determined to have at least one
adjudication for any of the following during the commitment period resulting in their 2012
release: Rape, Child Molesting, Child Exploitation, Child Seduction, Child Solicitation,
Criminal Deviate Conduct, Incest, Sexual Battery, Sexual Misconduct with a Minor, or Vicarious
Sexual Gratification.
Table 10
Gender 2012
Releases #
Returned Recidivism
Rate Female 2 0 0.0% Male 47 8 17.0%
Total 49 8 16.3%
Graph 11
Juvenile Recidivism Rates, 2015 Indiana Department of Correction
The mission of the Division of Youth Services is focused on community protection, accountability, beliefs that foster responsible community living and competency development.
- 13 -
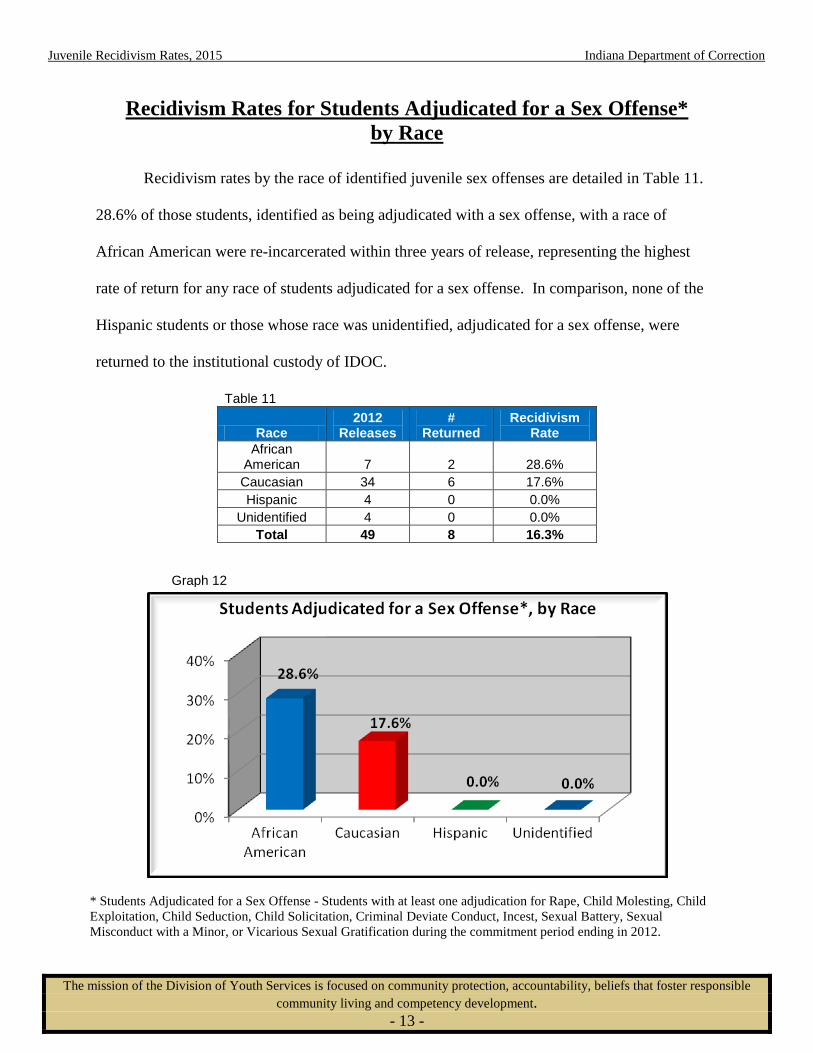
Recidivism Rates for Students Adjudicated for a Sex Offense* by Race
Recidivism rates by the race of identified juvenile sex offenses are detailed in Table 11.
28.6% of those students, identified as being adjudicated with a sex offense, with a race of
African American were re-incarcerated within three years of release, representing the highest
rate of return for any race of students adjudicated for a sex offense. In comparison, none of the
Hispanic students or those whose race was unidentified, adjudicated for a sex offense, were
returned to the institutional custody of IDOC.
Table 11
Race 2012
Releases #
Returned Recidivism
Rate African
American 7 2 28.6% Caucasian 34 6 17.6% Hispanic 4 0 0.0%
Unidentified 4 0 0.0% Total 49 8 16.3%
* Students Adjudicated for a Sex Offense - Students with at least one adjudication for Rape, Child Molesting, Child Exploitation, Child Seduction, Child Solicitation, Criminal Deviate Conduct, Incest, Sexual Battery, Sexual Misconduct with a Minor, or Vicarious Sexual Gratification during the commitment period ending in 2012.
Graph 12
Juvenile Recidivism Rates, 2015 Indiana Department of Correction
The mission of the Division of Youth Services is focused on community protection, accountability, beliefs that foster responsible community living and competency development.
- 14 -
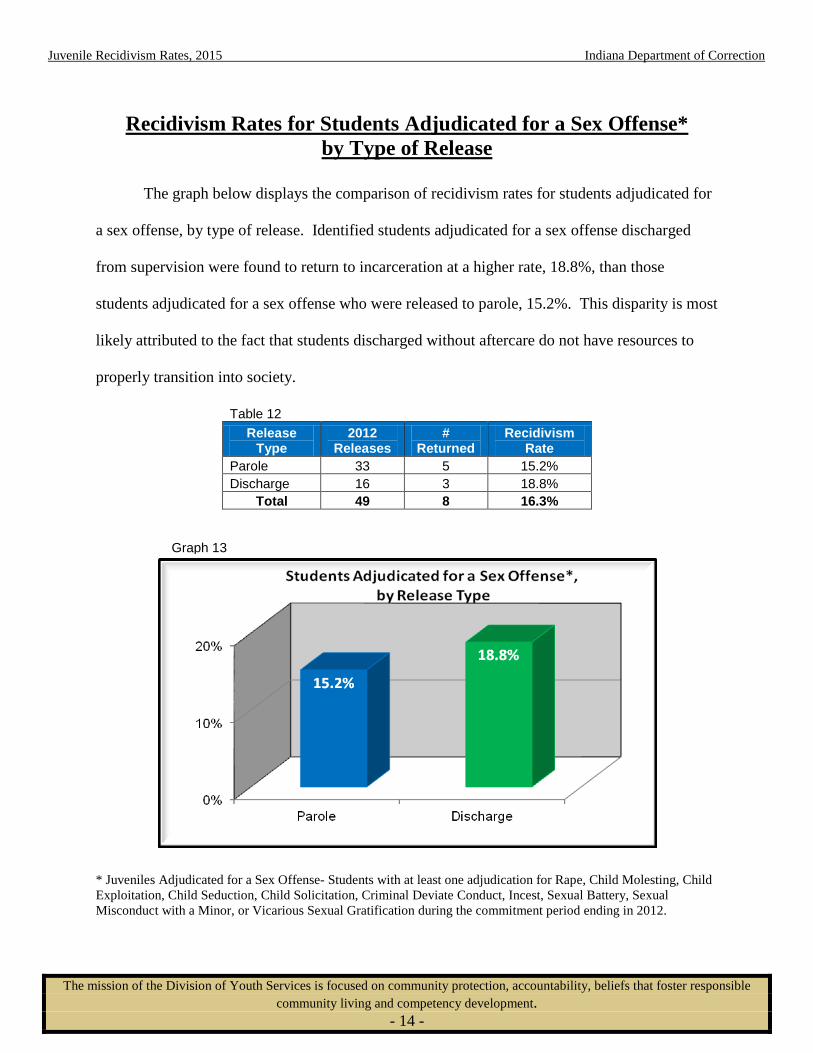
Recidivism Rates for Students Adjudicated for a Sex Offense* by Type of Release
The graph below displays the comparison of recidivism rates for students adjudicated for
a sex offense, by type of release. Identified students adjudicated for a sex offense discharged
from supervision were found to return to incarceration at a higher rate, 18.8%, than those
students adjudicated for a sex offense who were released to parole, 15.2%. This disparity is most
likely attributed to the fact that students discharged without aftercare do not have resources to
properly transition into society.
Table 12 Release
Type 2012
Releases #
Returned Recidivism
Rate Parole 33 5 15.2% Discharge 16 3 18.8%
Total 49 8 16.3%
* Juveniles Adjudicated for a Sex Offense- Students with at least one adjudication for Rape, Child Molesting, Child Exploitation, Child Seduction, Child Solicitation, Criminal Deviate Conduct, Incest, Sexual Battery, Sexual Misconduct with a Minor, or Vicarious Sexual Gratification during the commitment period ending in 2012.
Graph 13
Juvenile Recidivism Rates, 2015 Indiana Department of Correction
The mission of the Division of Youth Services is focused on community protection, accountability, beliefs that foster responsible community living and competency development.
- 15 -
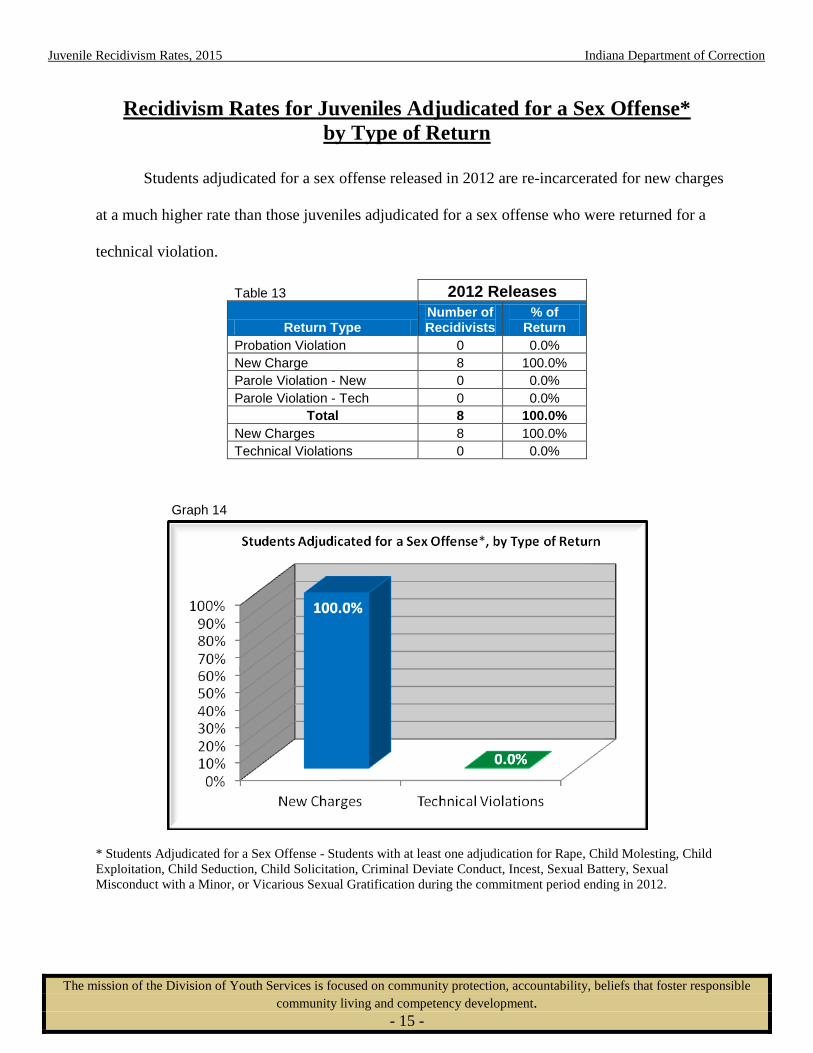
Recidivism Rates for Juveniles Adjudicated for a Sex Offense* by Type of Return
Students adjudicated for a sex offense released in 2012 are re-incarcerated for new charges
at a much higher rate than those juveniles adjudicated for a sex offense who were returned for a
technical violation.
Table 13 2012 Releases
Return Type Number of Recidivists
% of Return
Probation Violation 0 0.0% New Charge 8 100.0% Parole Violation - New 0 0.0% Parole Violation - Tech 0 0.0%
Total 8 100.0% New Charges 8 100.0% Technical Violations 0 0.0%
* Students Adjudicated for a Sex Offense - Students with at least one adjudication for Rape, Child Molesting, Child Exploitation, Child Seduction, Child Solicitation, Criminal Deviate Conduct, Incest, Sexual Battery, Sexual Misconduct with a Minor, or Vicarious Sexual Gratification during the commitment period ending in 2012.
Graph 14
Juvenile Recidivism Rates, 2015 Indiana Department of Correction
The mission of the Division of Youth Services is focused on community protection, accountability, beliefs that foster responsible community living and competency development.
- 16 -
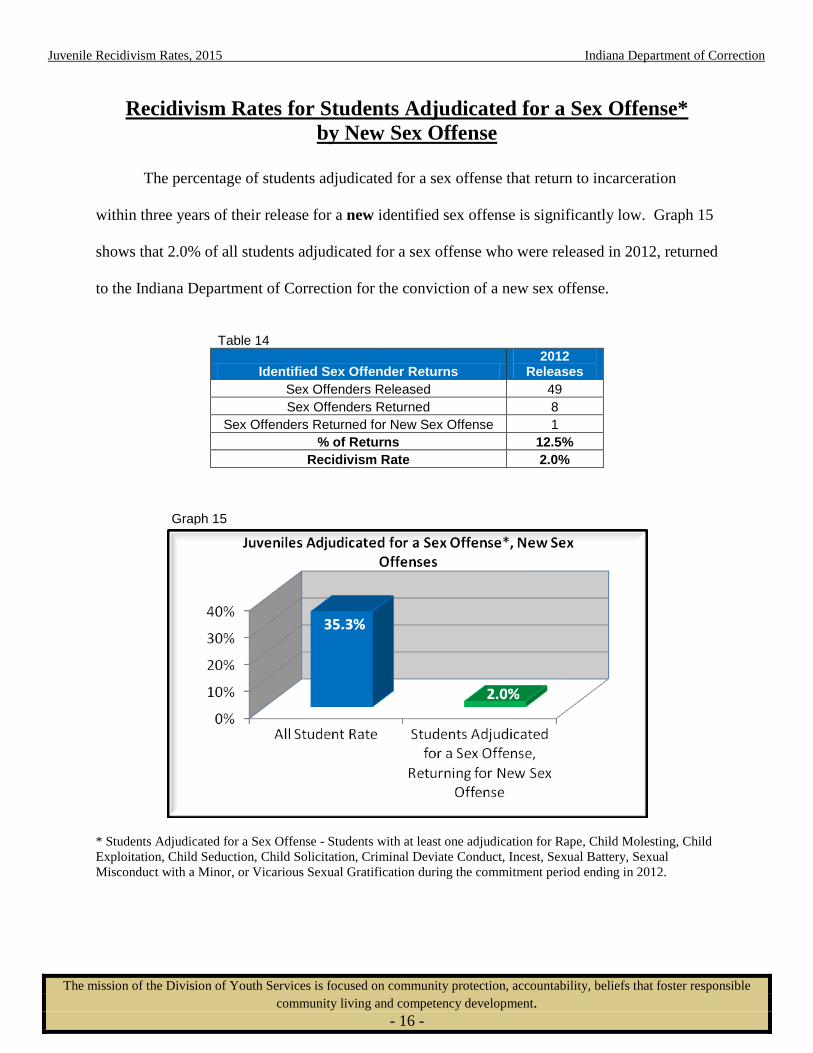
Recidivism Rates for Students Adjudicated for a Sex Offense* by New Sex Offense
The percentage of students adjudicated for a sex offense that return to incarceration
within three years of their release for a new identified sex offense is significantly low. Graph 15
shows that 2.0% of all students adjudicated for a sex offense who were released in 2012, returned
to the Indiana Department of Correction for the conviction of a new sex offense.
Table 14
Identified Sex Offender Returns
2012 Releases
Sex Offenders Released 49 Sex Offenders Returned 8
Sex Offenders Returned for New Sex Offense 1 % of Returns 12.5%
Recidivism Rate 2.0%
* Students Adjudicated for a Sex Offense - Students with at least one adjudication for Rape, Child Molesting, Child Exploitation, Child Seduction, Child Solicitation, Criminal Deviate Conduct, Incest, Sexual Battery, Sexual Misconduct with a Minor, or Vicarious Sexual Gratification during the commitment period ending in 2012.
Graph 15
INDIANA DEPARTMENT of CORRECTION
Indiana Government Center South, Room E334
302 W. Washington Street
Indianapolis, IN 46204
Prepared by:
Sarah Schelle, Research Analyst
(317) 232-2249
This report may be found at:
http://www.in.gov/idoc/files/2015JuvRecidivismRpt.pdf
DIVISION of YOUTH SERVICES
MISSION STATEMENT:
Our DYS mission is focused on community protection, accountability, beliefs that foster responsible community living and competency
development.