july 31, 2003 interim report january-june 2003 anders igel president and ceo
TRANSCRIPT
July 31, 2003
Interim report January-June 2003Anders IgelPresident and CEO
2
Q2 in brief
• Rapid profitability improvement
• Cash flow more than doubled
• Fast integration
• Synergies ahead of plan
• Increased market focus is beginning to yield results
• Turnaround targets reached in Danish fixed business and in former Telia International Carrier
3
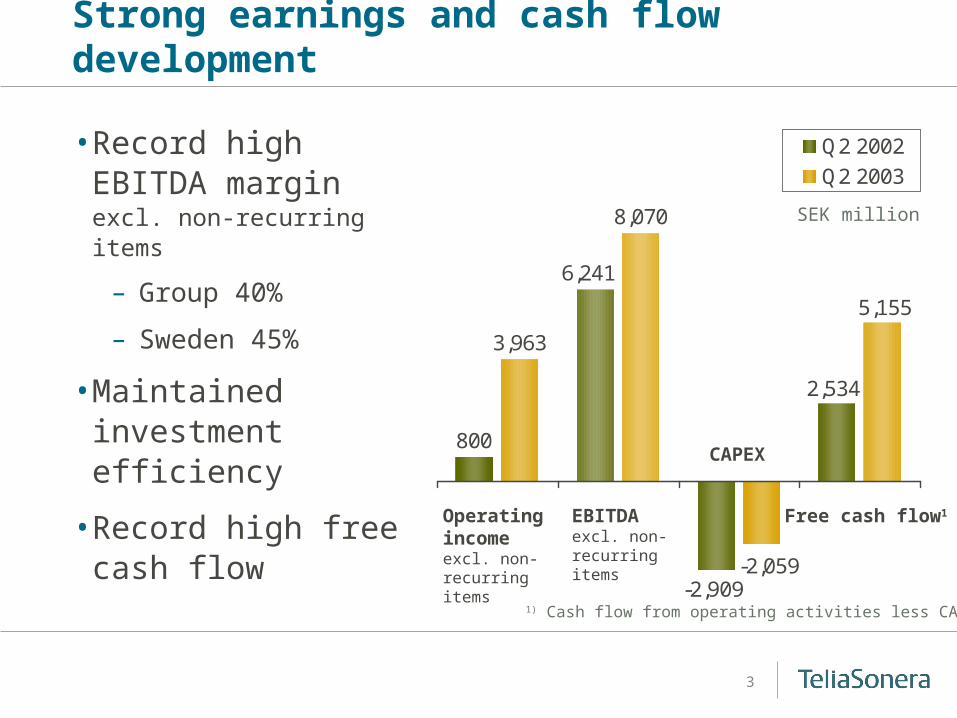
Strong earnings and cash flow development
• Record high EBITDA margin excl. non-recurring items
– Group 40%
– Sweden 45%
• Maintained investment efficiency
• Record high free cash flow
3,963
8,070
-2,909
2,534
6,241
800
5,155
-2,059
Q2 2002
Q2 2003
Operating income excl. non-recurring items
EBITDA excl. non-recurring items
CAPEX
Free cash flow1
SEK million
1) Cash flow from operating activities less CAPEX
4
Successful turnaround
International Carrier
• Restructuring program yields positive impact
• In April and May end-of-year target of positive EBITDA-CAPEX was reached
Denmark
• Improved earnings in both the fixed and mobile operations
• End-of-year target of positive EBITDA for Danish fixed was reached in Q2

5
Full speed in integration and synergy implementation
• Successful integration is yielding results – Synergy decision making ahead of schedule
• The EU requirements have been met
– ComHem sold, gain of SEK 1,811 million
– Telia Mobile Finland sold, loss of SEK 108 million
– Fixed and mobile networks legally separated from the retail business
6
More aggressive in the market
• Start to offer bundled products
• Telemarketing stepped up

7
Increased market efforts yield results
• Wide range of new offers and products launched with visible results by the end of the period
– Reduced losses in Swedish consumer segment and held position in Finnish consumer segment
– Strengthened position in Finnish and in Swedish Corporate segments
– Improved position in Norwegian and Danish mobile market
• Combined strength, a winning factor for several large contracts – Contracts worth SEK 3 billion signed in Sweden during Q2
– Metso
– IBM/Posten
– StoraEnso

8
Geographical focus
• Strengthening footprint in the markets where TeliaSonera currently operates
• Selected acquisitions in current footprint
• Long term strong cash flow provides us flexibility to grow in the consolidation of the European telecom industry
9
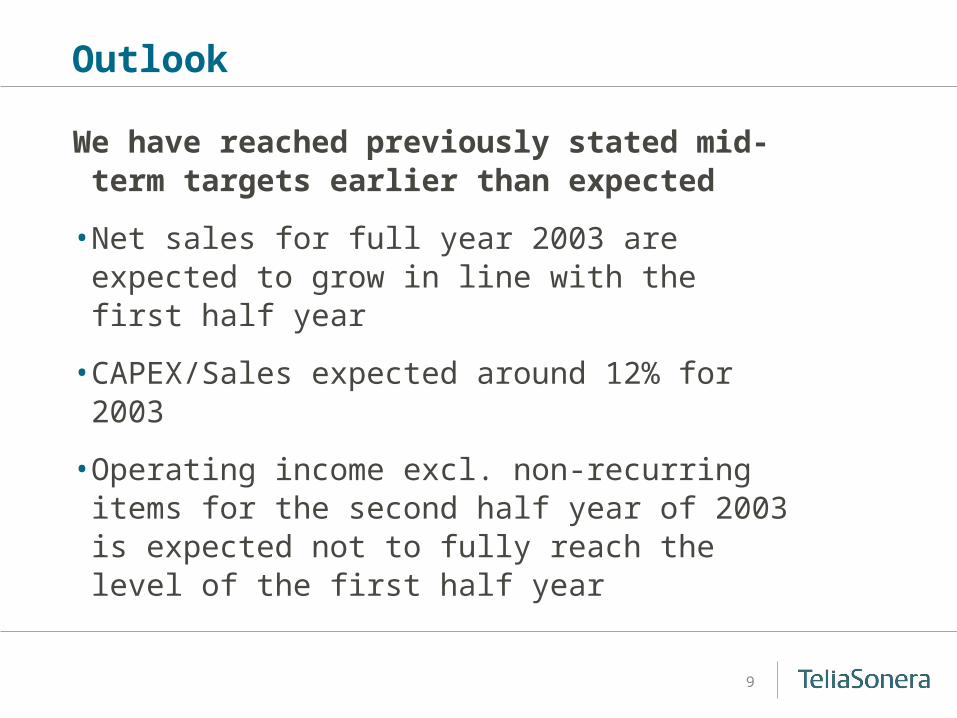
Outlook
We have reached previously stated mid-term targets earlier than expected
• Net sales for full year 2003 are expected to grow in line with the first half year
• CAPEX/Sales expected around 12% for 2003
• Operating income excl. non-recurring items for the second half year of 2003 is expected not to fully reach the level of the first half year

10
Focus going forward
• Commercial actions – win back market shares
• Continued synergy realization
• Efficiency improvements
• Strengthen existing geographical footprint
July 31, 2003
Kim Ignatius
CFO
12
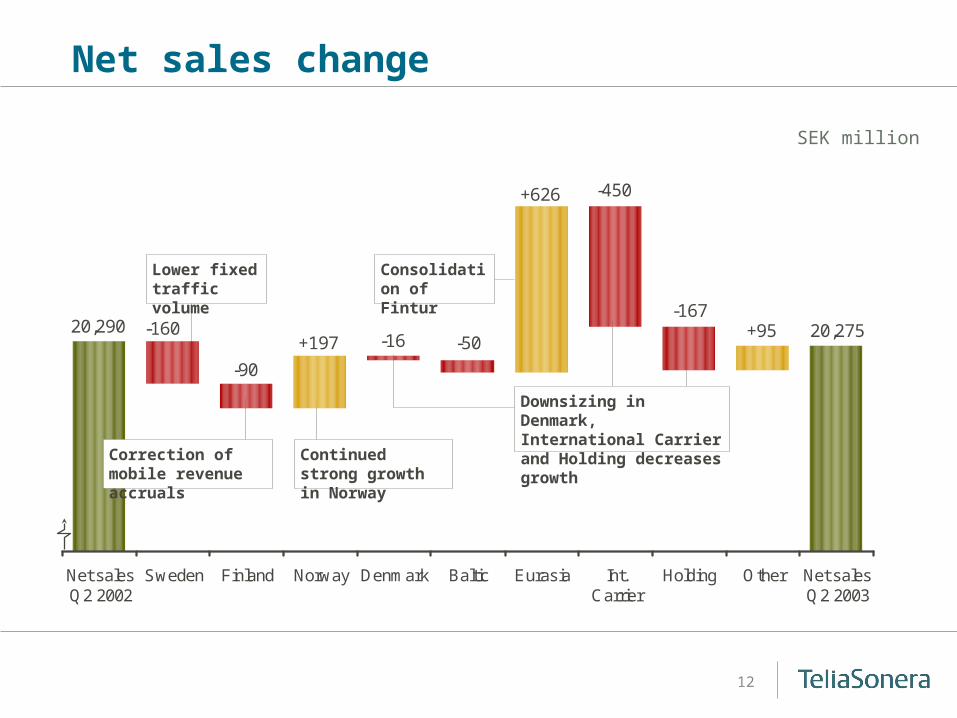
Net sales change
SEK million
20,275+95
-450+626
-50
-167
-16+197
-90
-16020,290
Net salesQ2 2002
Sweden Finland Norway Denmark Baltic Eurasia Int.Carrier
Holding Other Net salesQ2 2003
Downsizing in Denmark, International Carrier and Holding decreases growth
Continued strong growth in Norway
Correction of mobile revenue accruals
Lower fixed traffic volume
Consolidation of Fintur

13
Consolidation of Fintur
EBITDA excl. non-recurring items improvement + SEK 1,829 million
6,241
1,214 -3 92139 -73
-250353
3578,070
EBITDAQ2 2002
Sweden Finland Norway Denmark Baltic Eurasia Int.Carrier
Other EBITDAQ2 2003
Lower OPEX through restructuring Carrier
• Release of interconnect provision SEK 400 million• Effects from restructuring 2002 SEK 300 million• Synergy benefits SEK 100 million• Lower cost related to SUNAB due to UMTS delay
SEK million
14
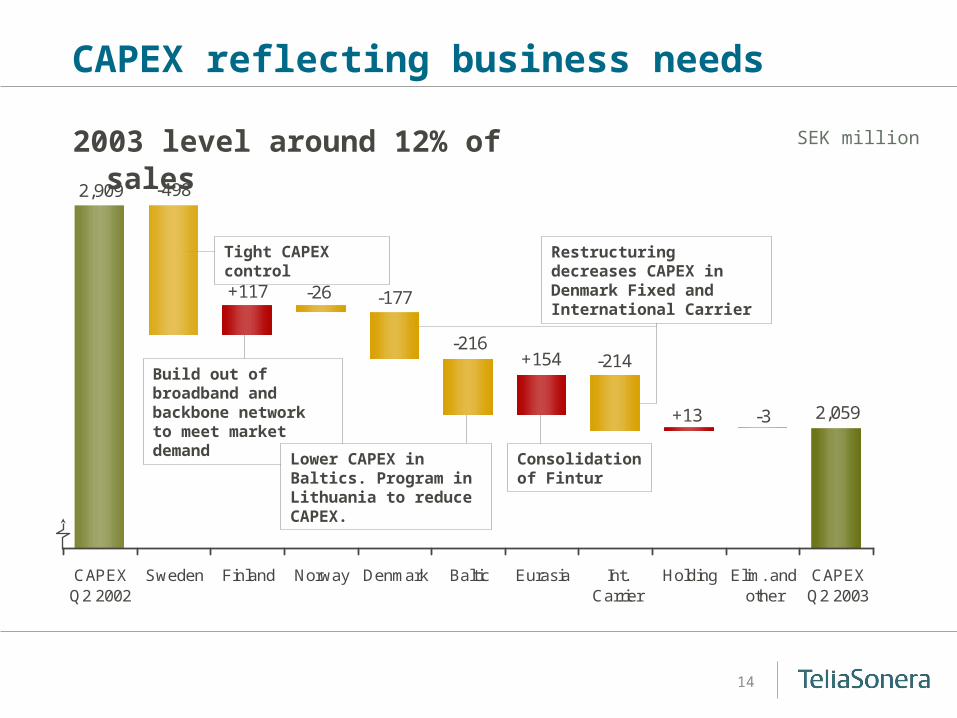
CAPEX reflecting business needs
2003 level around 12% of sales
Restructuring decreases CAPEX in Denmark Fixed and International Carrier
Consolidationof Fintur
Tight CAPEX control
2,909 -498
+117 -26 -177
-216+154 -214
+13 -3 2,059
CAPEXQ2 2002
Sweden Finland Norway Denmark Baltic Eurasia Int.Carrier
Holding Elim. andother
CAPEXQ2 2003
SEK million
Build out of broadband and backbone network to meet market demand
Lower CAPEX in Baltics. Program in Lithuania to reduce CAPEX.
15
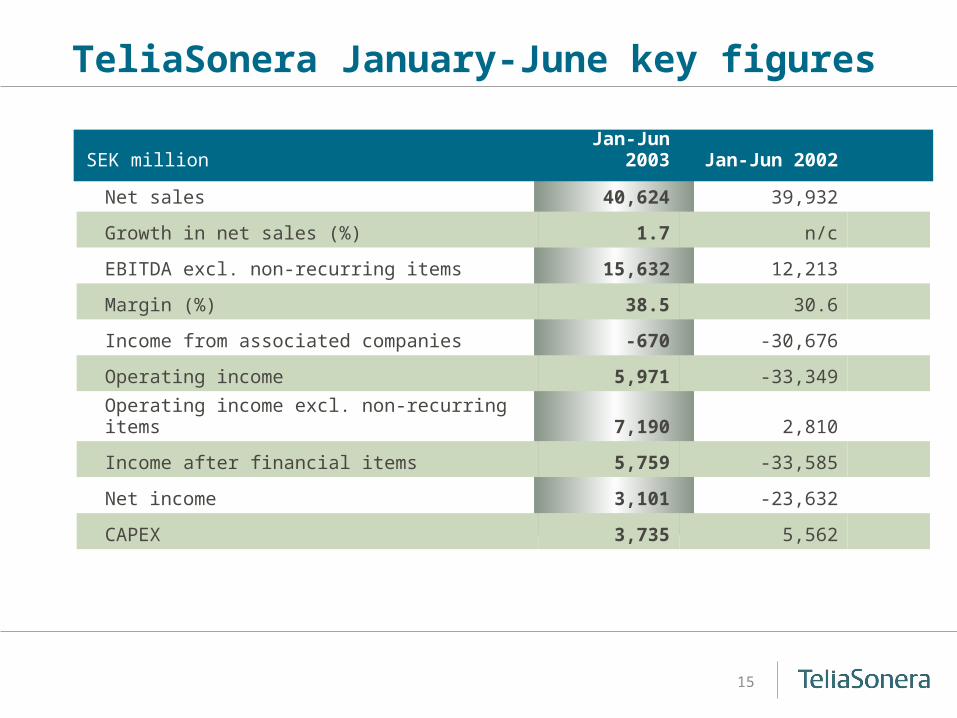
TeliaSonera January-June key figures
SEK million Jan-Jun 2003 Jan-Jun 2002
Net sales 40,624 39,932
Growth in net sales (%) 1.7 n/c
EBITDA excl. non-recurring items 15,632 12,213
Margin (%) 38.5 30.6
Income from associated companies -670 -30,676
Operating income 5,971 -33,349
Operating income excl. non-recurring items 7,190 2,810
Income after financial items 5,759 -33,585
Net income 3,101 -23,632
CAPEX 3,735 5,562

16
Synergies ahead of plan
SEK millionFull run rate annual
effect (by 2005)Effect
in 2003
OPEX
Product and service development 137 60
IT systems and infrastructure 36 20
Purchasing 169 169
Network operations 187 84
Corporate functions 145 145
Total 674 478
CAPEX
Product and service development 4 33
IT systems and infrastructure 26 22
Purchasing 225 265
Network operations 13 40
Total 268 360
Impact of decisions taken during 2003Decisions during Q2
• Eliminate duplicate platforms such as positioning services, e-mail, customer support systems and voice over IP
• Shared use of IT and systems within CRM
• Eliminate overlapping testing systems etc.
• Renegotiation of supplier agreements

17
Continued efficiency improvements in Finland and Sweden
Integration and governance models significantly increase efficiency and eliminate overlaps
• Sweden– Estimated redundancy of approx. 1,500 employees.
Approx. 700 employees remain affected by redundancy
– A provision of SEK 374 million has been made
• Finland– Redundancy of 400 employees
– A provision of SEK 15 million has been made

18
Non-recurring items Q2 2003
Affecting operating income
Operating income excl. non-recurring items
Within income from assoc. companies
Capital gain Bharti MobileWrite downs (Infonet, Metro One, VCs)
Write downs (synergy)
Provision for redundancyOther
Operating income as reported
Affecting financial items
No effect on pro forma profit & loss statement
3,963
+341
-1,208
-29
-389+66
2,744
Financial net excl. non-recurring items
Capital gains from financial items (Netia)
Write downs of financial items (VCs)
Financial net as reported
-116
+583
-163
304
SEK million
Capital gain ComHem
Capital loss Telia Mobile Finland
+1,811
-108
19
Income taxes
• Effective tax rate (42% in Q2) is mainly increased by non-deductible Infonet write-down and by non-deductible goodwill amortization
• Deferred tax liability of SEK 12 billion mainly relates to Sweden
• Deferred tax benefit of SEK 16 billion mainly relates to European 3G and other write-downs in 2002. Some SEK 2 billion relates to restructuring of International Carrier and Denmark and can be used in Sweden.
• No significant cash payment for taxes in Finland for 6 to 8 years is expected
20
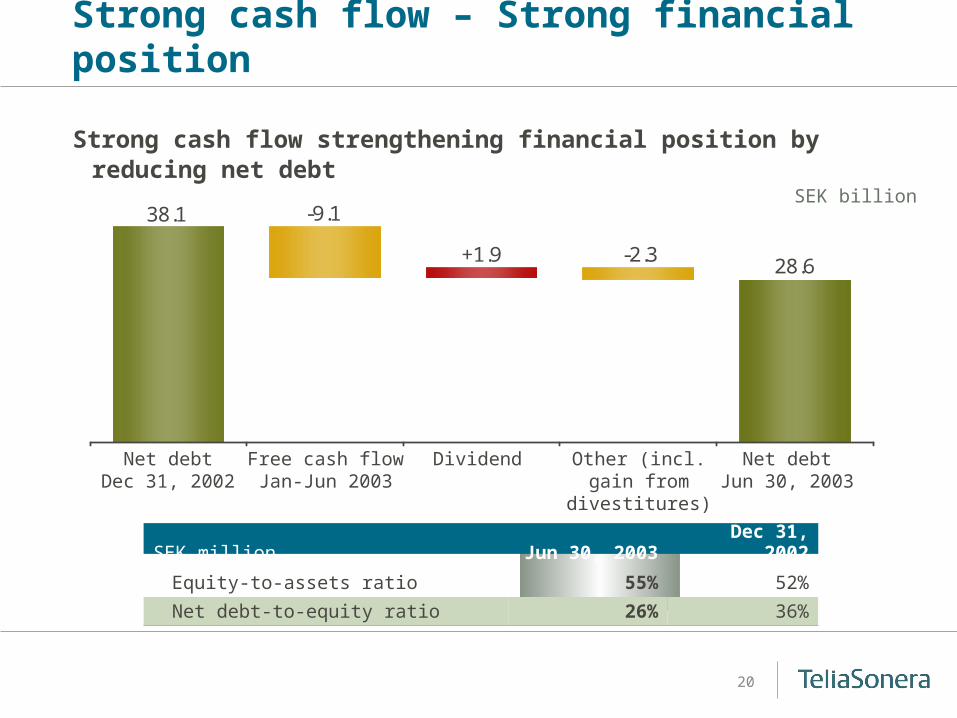
Strong cash flow – Strong financial position
Strong cash flow strengthening financial position by reducing net debt
38.1 -9.1
+1.9 -2.328.6
Net debtDec 31, 2002
Free cash flowJan-Jun 2003
Dividend Other (incl. gain from divestitures)
Net debtJun 30, 2003
SEK million Jun 30, 2003 Dec 31, 2002
Equity-to-assets ratio 55% 52%
Net debt-to-equity ratio 26% 36%
SEK billion
21
Forward-looking statements
This document contains statements concerning, among other things, TeliaSonera's financial condition and results of operations that are forward-looking in nature. Such statements are not historical facts but, rather, represent TeliaSonera's future expectations. TeliaSonera believes that the expectations reflected in these forward-looking statements are based on reasonable assumptions; however, forward-looking statements involve inherent risks and uncertainties, and a number of important factors could cause actual results or outcomes to differ materially from those expressed in any forward-looking statement, including TeliaSonera's market position, growth in the telecommunications industry in Europe, the effects of competition and other economic, business, competitive and/or regulatory factors affecting the business of TeliaSonera and the telecommunications industry in general. Forward-looking statements speak only as of the date they were made, and, other than as required by applicable law, TeliaSonera undertakes no obligation to update any of them in light of new information or future events.

July 31, 2003
The Nordic and Baltic telecommunications leader