july 2015 - humanitarianresponse · pdf filejuly 2015 hamed, community ... coalition forces...
TRANSCRIPT
Page | 1
Rapid Assessment of Explosive Remnants of War (ERW) Contamination in Northern Ninewah Governorate
July 2015
Hamed, Community Liaison Officer records a
dangerous area report which will be dealt with by
a MAG technical team.
Photograph by Sean Sutton.

Table of Contents
1 Summary 1
2 Introduction 2
3 Assessment findings 4
3.1 Summarised findings of the assessment by key indicator 4
3.2 Analysis of access to areas and extent of contamination and damage
5
3.3 Analysis of population movements and reports of accidents 9
3.4 Analysis of access to infrastructure and services 11
3.5 Table of assessment results by village and key indicator 13
4 Conclusion 17
6 Annexes
Annex A Assessment questionnaires 19
Annex B Methodology 26
Glossary CL Community Liaison
ERW Explosive Remnants of War
HMA Humanitarian Mine Action
IDP Internally Displaced Persons
IED Improvised Explosive Devices
IKMAA Iraqi Kurdish Mine Action Agency
IOM International Organisation for Migration
IS Islamic State
MAG Mines Advisory Group
UNDP United Nations Development Programme

Page | 1
1. Summary
The conflict between Islamic State (IS) and Iraqi and Kurdish security forces, supported by coalition forces has led to mass population displacement and a severe humanitarian crisis in a region already suffering from extensive contamination from landmines and explosive remnants of war (ERW)1. While displaced persons fleeing violence may have to enter/transit areas of contamination pre-dating the current conflict, a safe return to places or origin formerly under IS control is also threatened by an increase in the type and scope of ERW contamination. In particular, IS‟s widespread use of victim operated improvised explosive devices (IEDs) is posing a threat to civilians and hampering a safe returns process to areas secured by the security forces. Thousands of people spontaneously returning to their home locations face the threat of injury and death due to contamination and damage resulting from the conflict. Additionally, with no systematically collected information on the extent of the problem, the ability of humanitarian mine action (HMA) actors and the wider humanitarian community to respond efficiently and safely to IDPs‟ needs is compromised. The whole of Ninewah governorate was estimated to have a population of 3.5 million people before the arrival of IS. During this rapid ERW contamination assessment, conducted in 164 locations in the Governorate of Ninewah, district of Tal-Afar, sub-districts of Zummar, Rabeea and Sinuni, MAG has recorded approximately 50,000 people living in assessed areas. This assessment is part of the greater planning for recovery and stabilisation in Ninewah governorate. In early 2015 UNDP carried out a Recovery and Stabilisation Needs Assessment in Ninewah Governorate and in the findings of the report contamination assessments were identified as being vital in the area. In addition, to working in close collaboration with UNDP, MAG also worked with the Deputy Governor of Ninewah and the Iraqi Kurdish Mine Action Agency (IKMAA) to ensure that they were involved in the planning of the project and that any information required by them would be collected. This project aimed to increase the knowledge of risks from ERW, making available contamination/damage data to support prioritization of recovery efforts and, to facilitate the planning of national and local authorities and the greater humanitarian response. In addition, the data will assist in determining the type and scope of HMA activities to support the protection of returnees to areas formerly under IS control. The findings of the assessment have indicated that 142 (87%) of the villages identified were accessible. In the remaining 22 villages, access was not possible either because of on-going fighting in the area or due to the presence of Peshmerga forces who blocked access. In 67 of the accessible villages (47%), the local populations reported seeing evidence of contamination in their villages. Visible damage and destruction of buildings was reported in 71 (50%) of the villages and in 40 villages (28%) there was both reported contamination and destruction of buildings. The following report provides a further breakdown of data indicating population movement, contamination/damage levels and infrastructure damage.
1 Iraq‟s Mine Ban Treaty Article 7 report submitted in 2013 estimates in northern Iraq‟s Kurdish governorates
96km2 of CHA and almost 224km2 of contamination. These areas were identified by what it termed “preliminary technical survey,” a form of enhanced NTS intended to provide more precise data on contaminated areas.

Page | 2
2. Introduction The former control of IS in areas of northern Ninewah governorate and the armed conflict that led to their expulsion the infrastructure and housing in a large number of towns and villages, as well as agricultural areas, have been left damaged, destroyed and potentially contaminated by ERW, including victim operated IEDs and booby traps. The areas assessed within this project were retaken from IS in late 2014 by Kurdish security forces, supported by the coalition. In the following months increasing numbers of displaced people have been returning through their homes. As of September 2015 the IOM Displacement Tracking Matrix estimates that 10,449 families (62,694 people) have returned to the governorate of Ninewah, 80% of these families have returned to the district of Tel Afer where this assessment was carried out. While there is no systematic and comprehensive collection of accident data in Ninewah currently, evidence gathered by MAG community liaison (CL) teams and other sources indicates that with an increase in the numbers returning to their homes there is a corresponding increase in accidents caused by people coming into contact with a range of ERW. Victim and accident data collected by MAG CL staff in May and June 2015 in Ninewah governorate contains evidence of 62 accidents with 116 victims; 92% of the accidents were reported to have been caused by IEDs. Analysis of the victim reports that MAG has collected indicates that 54% of the victims were civilians and 52% of the victims were killed in the accidents. Death tolls from similar accidents are expected to rise as IDPs continue to return. Under this project six Community Liaison teams were recruited and trained and over a four week period in July/August 2015 and conducted a rapid contamination assessment in 164 locations. This assessment was carried out by interviewing both village elders and other members of the local population present in the village.The teams gathered information on destruction and contamination in the villages but also information on population movement, availability and damage to infrastructure and services and local reports of accidents. To gain an idea of the levels of population movement individuals were also asked if they had stayed in their villages during the recent conflict or if they had left and returned. Of the 565 people interviewed 85% had left their villages at some point during the conflict. In addition, 20% of people reported knowledge of accidents caused by contamination, the casualties from these accidents included men, women and children. There were also reports of loss of livestock in areas where agricultural land has been contaminated. The information gathered by this assessment will support prioritisation of clearance work in the area, also providing the local authorities and other humanitarian actors with data to support recovery and stabilisation activities in Ninewah Governorate. The assessment findings are organised as follows:
1. Table of summarised findings of the assessment by key indicator
2. Analysis of access to areas and extent of contamination and damage found
3. Analysis of population movement and reports of accidents
4. Analysis of access to infrastructure and services
5. Table of Assessment Results by Village and Key Indicators

Page | 3
Fig.1: Area of Tal-Afer district in Ninewa Governorate where the assessment was conducted
Fig.2: Map of Iraq with area of above map included for context

Page | 4
3. Assessment Findings
3.1 Table of summarised findings of the assessment by key indicator
Zummar Rabeea Sinuni Total
Access to villages
Number of villages 62 58 44 164
Villages that are accessible 52 48 42 142
Villages that are not accessible 10 10 2 22
Inhabited Villages
Of the accessible villages: 52 48 42 142
Is the village inhabited: Yes 45 46 40 131
No 7 2 2 11
Contamination in villages
Of the accessible villages: 52 48 42 142
# with reported contamination (individual questionnaires) 29 15 23 67
# with no contamination reported (individual questionnaires)
14 24 13 51
# where no information on contamination from individual questionnaires is available
9 9 6 24
Damaged Villages
Of the accessible villages: 52 48 42 142
Is there visible destruction: Yes 25 23 23 71
No 20 18 18 56
No data 7 7 1 15
Individual Questionnaires
Villages where Individual questionnaires were conducted 45 42 36 123
Number of men interviewed for individual questionnaires 188 121 172 481
Number of women interviewed for individual questionnaires 19 1 64 84
Total people interviewed 207 122 236 565
Population Movement
Did you leave your village during the conflict: Yes 181 80 222 483
No 23 41 13 77
No data 3 1 1 5
Accident Data
Number of villages where there were reports of accidents 18 9 20 47
Access to infrastructure and services
MEDICAL CENTRES:
Villages with a medical centre 20 14 11 45
Villages with no medical centre 25 26 31 82
Villages with no data on the medical centre 7 8 0 15
Villages where the medical centre has been damaged or destroyed
0 3 5 8
SCHOOLS:
Villages with a school 45 31 28 104
Villages with no school 1 8 14 23
Villages with no data on schools 6 9 0 15
Villages where the school has been damaged or destroyed 5 6 10 21
ELECTRICITY:
Villages with electricity services 46 18 35 99
Villages with no electricity services 1 22 7 30
Villages with no data on electricity services 5 8 0 13
Villages where the electricity services have been damaged or destroyed
6 5 6 17

Page | 5
3.2 Analysis of access to areas and extent of contamination and damage found Of the 164 villages where information was collected 142 (87%) of them were accessible. In the remaining 22 villages access was not possible either because of ongoing fighting in the area or due to the presence of Peshmerga who blocked access. Where possible, for these villages and the uninhabited villages, efforts were made to find people from these villages in other neighbouring villages who could provide information for the assessment but this was not possible in all cases. Of the villages that were accessible 47% (67 villages) had contamination reported by the local population, however for 24 villages either there were no individual questionnaires carried out or people in the population were not able to respond to the questions on contamination. Visible damage and destruction of villages was reported in a slightly higher number of villages 71 50%). In 40 villages there is both reported contamination and destruction of buildings. 3.2.1 Access to Villages
Indicator Zummar Rabeea Sinuni Total
Number of villages 62 58 44 164
Villages that are accessible 52 48 42 142
Villages that are not accessible 10 10 2 22
Villages accessible
87%
Villages not accessible
13%
Total Access to villages
Villages accessible
84%
Villages not
accessible 16%
Access to Villages in Zummar
Villages accessible
83%
Villages not
accessible 17%
Access to villages in Rabeea
Villages accessible
95%
Villages not
accessible 5%
Access to villages in Sinuni

Page | 6
3.2.2 Inhabited Villages
Indicator Zummar Rabeea Sinuni Total
Of the accessible villages: 52 48 42 142
Is the village inhabited: Yes 45 46 40 131
No 7 2 2 11
Village Inhabited
92%
Village not inhabited
8%
Total Inhabited Villages
Inhabited 87%
Not
inhabited 13%
Inhabited Villages in Zummar
Village Inhabited
87%
Village not inhabited
4%
Inhabited Villages in Rabeea
Inhabited 95%
Not
inhabited 5%
Inhabited villages in Sinuni

Page | 7
3.2.3 Contamination in Villages Fig. 3: Villages where contamination was reported
Indicator Zummar Rabeea Sinuni Total
Of the accessible villages: 52 48 42 142
# with reported contamination (individual questionnaires) 29 15 23 67
# with no contamination reported (individual questionnaires) 14 24 13 51
# where no information on contamination from individual questionnaires is available 9 9 6 24
Reported contamination
47%
No contamination
reported 36%
No information 17%
Total Contamination in Villages (from individual questionnaires)
Reported contamination
31%
No contamination
reported 50%
No information 19%
Contamination in Rabeea (from individual questionnaires)
Reported contamination
56% No
contamination reported
27%
No information 17%
Contamination in Zummar (from individual questionnaires)
Reported contamination
55%
No contamination
reported 31%
No information 14%
Contamination in Sinuni (from individual questionnaires)

Page | 8
3.2.4 Reports of damaged buildings in villages Fig. 4: Villages where damage and destruction of buildings was reported
Indicator Zummar Rabeea Sinuni Total
Of the accessible villages: 52 48 42 142
Is there visible destruction: Yes 25 23 23 71
No 20 18 18 56
No data 7 7 1 15
Yes 50%
No
39%
No data
11%
Total Damage in Villages Is there visible destruction?
Yes 48%
No
38%
No data
14%
Damaged Villages in Zummar Is there visible destruction?
Yes 48%
No
37%
No data
15%
Damaged Villages in Rabeea Is there visible destruction?
Yes 55%
No
43%
No data
2%
Damaged villages in Sinuni Is there visible destruction?
Page | 9
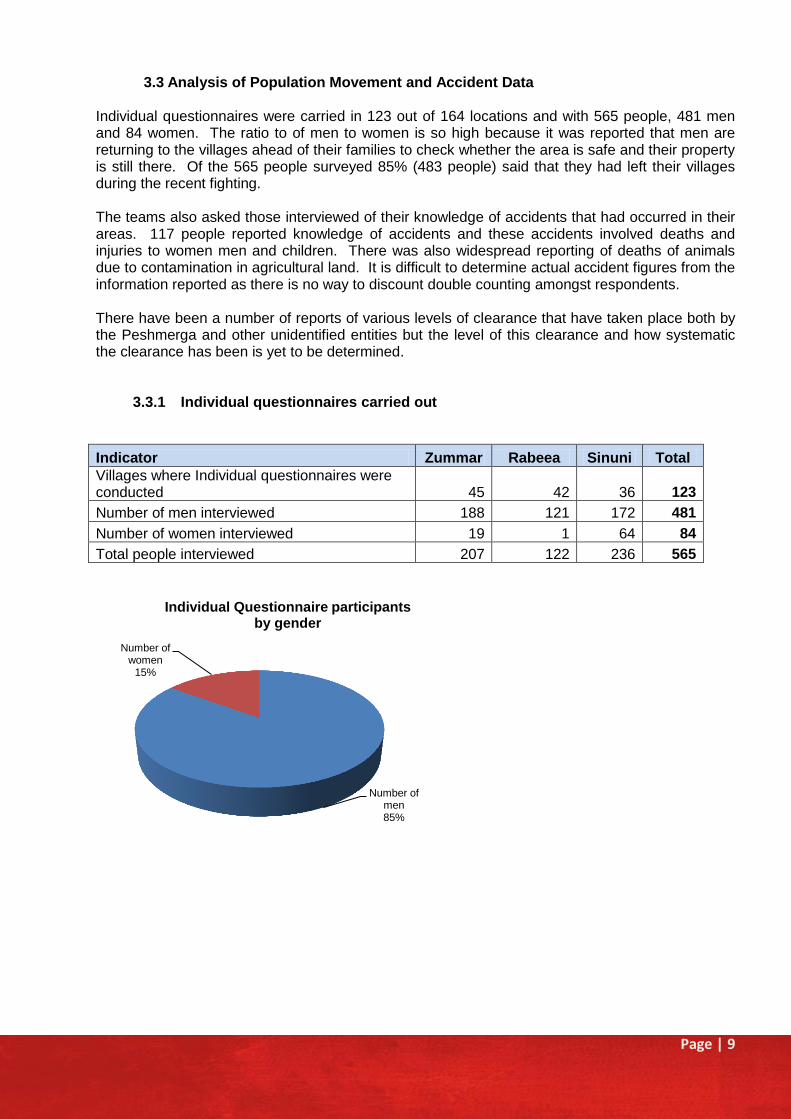
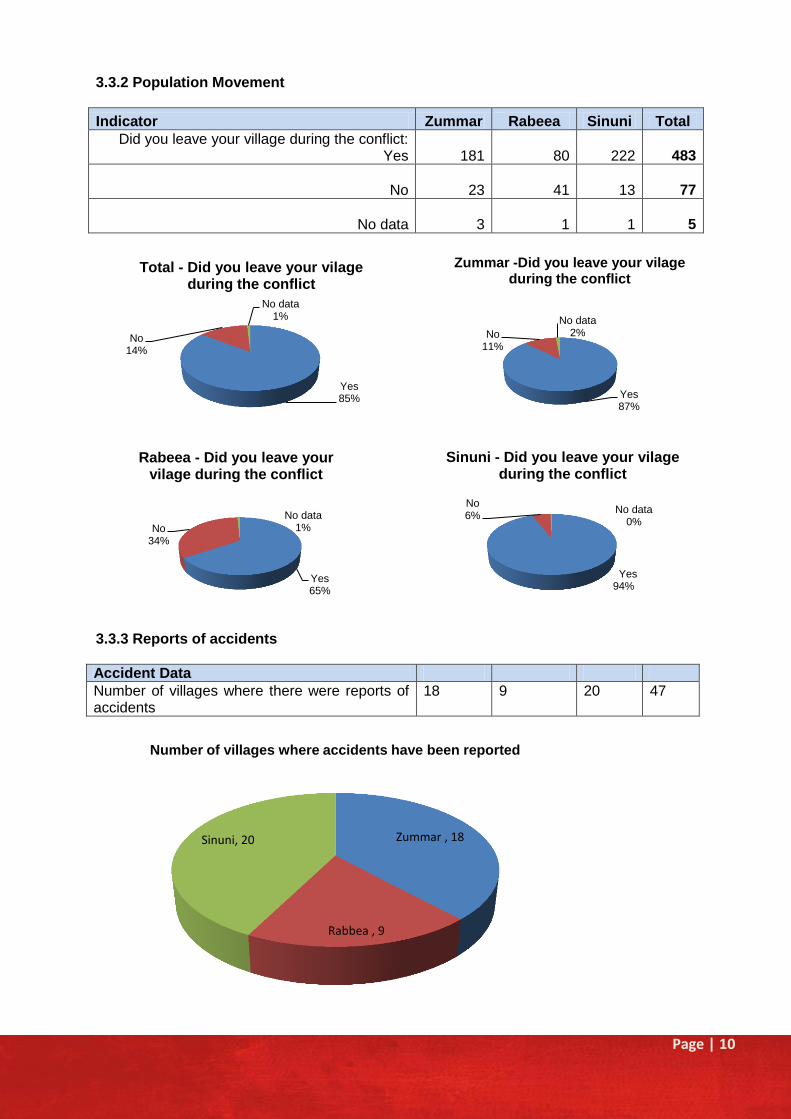
3.3 Analysis of Population Movement and Accident Data Individual questionnaires were carried in 123 out of 164 locations and with 565 people, 481 men and 84 women. The ratio to of men to women is so high because it was reported that men are returning to the villages ahead of their families to check whether the area is safe and their property is still there. Of the 565 people surveyed 85% (483 people) said that they had left their villages during the recent fighting. The teams also asked those interviewed of their knowledge of accidents that had occurred in their areas. 117 people reported knowledge of accidents and these accidents involved deaths and injuries to women men and children. There was also widespread reporting of deaths of animals due to contamination in agricultural land. It is difficult to determine actual accident figures from the information reported as there is no way to discount double counting amongst respondents. There have been a number of reports of various levels of clearance that have taken place both by the Peshmerga and other unidentified entities but the level of this clearance and how systematic the clearance has been is yet to be determined.
3.3.1 Individual questionnaires carried out
Indicator Zummar Rabeea Sinuni Total
Villages where Individual questionnaires were conducted 45 42 36 123
Number of men interviewed 188 121 172 481
Number of women interviewed 19 1 64 84
Total people interviewed 207 122 236 565
Number of men 85%
Number of women
15%
Individual Questionnaire participants by gender
Page | 10
3.3.2 Population Movement
Indicator Zummar Rabeea Sinuni Total
Did you leave your village during the conflict: Yes 181 80 222 483
No 23 41 13 77
No data 3 1 1 5
3.3.3 Reports of accidents
Accident Data
Number of villages where there were reports of accidents
18 9 20 47
Yes 85%
No
14%
No data
1%
Total - Did you leave your vilage during the conflict
Yes 87%
No
11%
No data
2%
Zummar -Did you leave your vilage during the conflict
Yes 65%
No
34%
No data
1%
Rabeea - Did you leave your vilage during the conflict
Yes 94%
No 6%
No data
0%
Sinuni - Did you leave your vilage during the conflict
Zummar , 18
Rabbea , 9
Sinuni, 20
Number of villages where accidents have been reported

Page | 11
3.4 Analysis of access to infrastructure and services
During the planning stages of the assessment it was suggested by government authorities that it would be useful to collect information on available local infrastructure and services and locations where damage had occurred. The facilities identified for inclusion in the assessment were: Utilities: electricity, water, sewerage and communications; Children services: schools, youth centres, Public Recreational Areas; community support services: Medical Centre, police station, fire station, local authority representative, places of worship; and the local economy: market, business, industry, arable land and grazing land. Data collected for many of the categories was limited but information on key areas such as schools health care and basic utilities was gathered and the findings are listed below. 3.4.1 Availability of and damage to medical centres
Medical Centres Indicator Zummar Rabeea Sinuni Total
Villages with a medical centre 20 14 11 45
Villages with no medical centre 25 26 31 82
Villages with no data on the medical centre 7 8 0 15
Villages where the medical centre has been damaged or destroyed 0 3 5 8
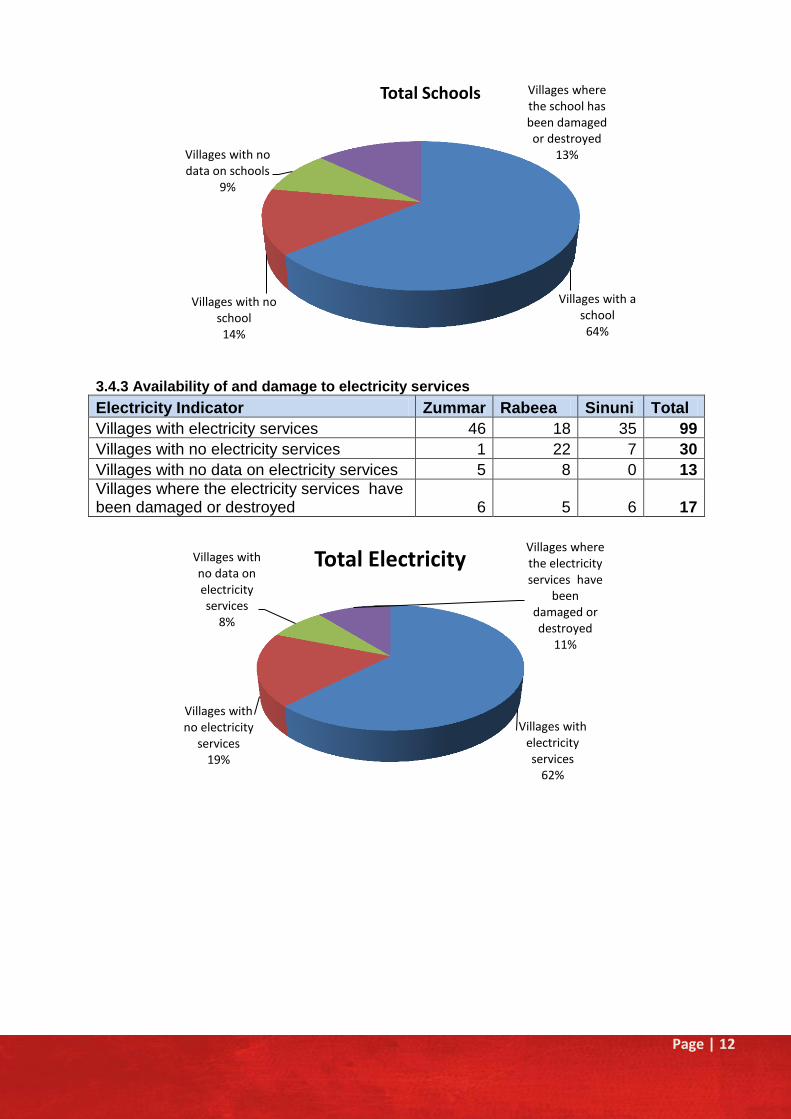
3.4.2 Availability of and damage to schools
Schools Indicator Zummar Rabeea Sinuni Total
Villages with a school 45 31 28 104
Villages with no school 1 8 14 23
Villages with no data on schools 6 9 0 15
Villages where the school has been damaged or destroyed 5 6 10 21
Villages with a medical centre
30%
Villages with no medical
centre 55%
Villages with no data on the medical
centre 10%
Villages where the medical centre has
been damaged or destroyed
5%
Total medical services
Page | 12
3.4.3 Availability of and damage to electricity services
Electricity Indicator Zummar Rabeea Sinuni Total
Villages with electricity services 46 18 35 99
Villages with no electricity services 1 22 7 30
Villages with no data on electricity services 5 8 0 13
Villages where the electricity services have been damaged or destroyed 6 5 6 17
Villages with a school 64%
Villages with no school 14%
Villages with no data on schools
9%
Villages where the school has been damaged or destroyed
13%
Total Schools
Villages with electricity services
62%
Villages with no electricity
services 19%
Villages with no data on electricity services
8%
Villages where the electricity services have
been damaged or destroyed
11%
Total Electricity
Page | 13
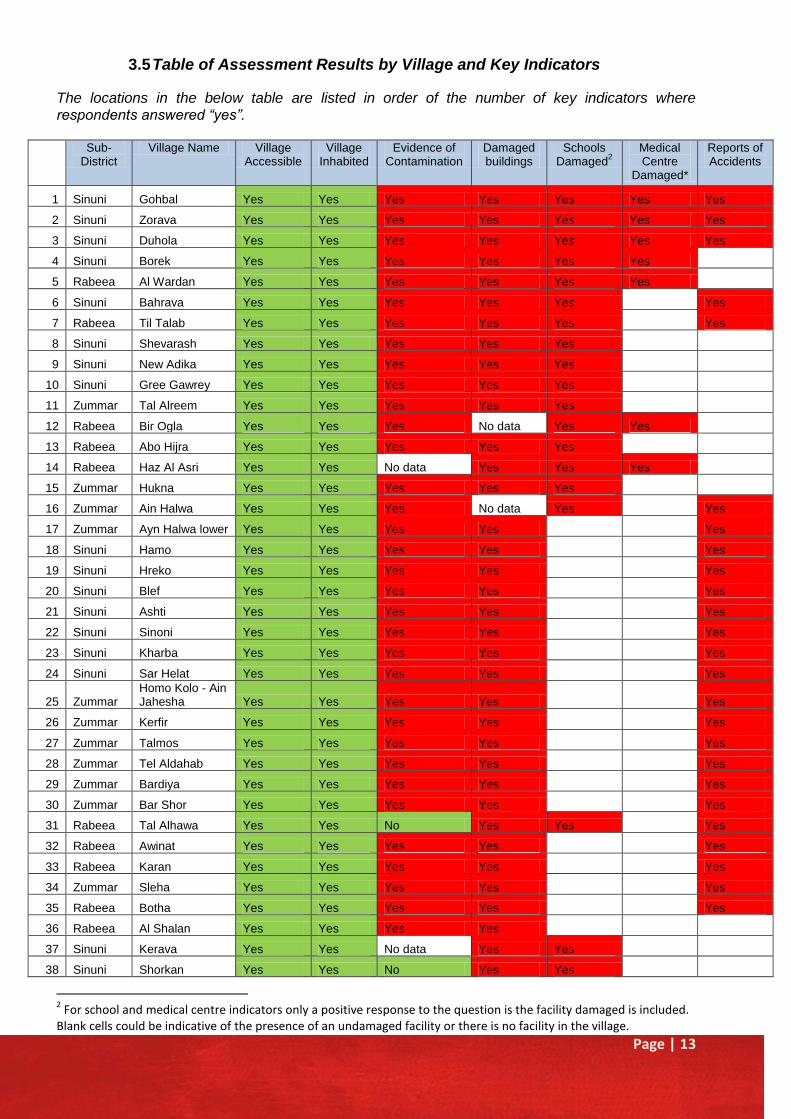
3.5 Table of Assessment Results by Village and Key Indicators
The locations in the below table are listed in order of the number of key indicators where respondents answered “yes”.
Sub-District
Village Name Village Accessible
Village Inhabited
Evidence of Contamination
Damaged buildings
Schools Damaged
2
Medical Centre
Damaged*
Reports of Accidents
1 Sinuni Gohbal Yes Yes Yes Yes Yes Yes Yes
2 Sinuni Zorava Yes Yes Yes Yes Yes Yes Yes
3 Sinuni Duhola Yes Yes Yes Yes Yes Yes Yes
4 Sinuni Borek Yes Yes Yes Yes Yes Yes
5 Rabeea Al Wardan Yes Yes Yes Yes Yes Yes
6 Sinuni Bahrava Yes Yes Yes Yes Yes Yes
7 Rabeea Til Talab Yes Yes Yes Yes Yes Yes
8 Sinuni Shevarash Yes Yes Yes Yes Yes
9 Sinuni New Adika Yes Yes Yes Yes Yes
10 Sinuni Gree Gawrey Yes Yes Yes Yes Yes
11 Zummar Tal Alreem Yes Yes Yes Yes Yes
12 Rabeea Bir Ogla Yes Yes Yes No data Yes Yes
13 Rabeea Abo Hijra Yes Yes Yes Yes Yes
14 Rabeea Haz Al Asri Yes Yes No data Yes Yes Yes
15 Zummar Hukna Yes Yes Yes Yes Yes
16 Zummar Ain Halwa Yes Yes Yes No data Yes Yes
17 Zummar Ayn Halwa lower Yes Yes Yes Yes Yes
18 Sinuni Hamo Yes Yes Yes Yes Yes
19 Sinuni Hreko Yes Yes Yes Yes Yes
20 Sinuni Blef Yes Yes Yes Yes Yes
21 Sinuni Ashti Yes Yes Yes Yes Yes
22 Sinuni Sinoni Yes Yes Yes Yes Yes
23 Sinuni Kharba Yes Yes Yes Yes Yes
24 Sinuni Sar Helat Yes Yes Yes Yes Yes
25 Zummar Homo Kolo - Ain Jahesha Yes Yes Yes Yes Yes
26 Zummar Kerfir Yes Yes Yes Yes Yes
27 Zummar Talmos Yes Yes Yes Yes Yes
28 Zummar Tel Aldahab Yes Yes Yes Yes Yes
29 Zummar Bardiya Yes Yes Yes Yes Yes
30 Zummar Bar Shor Yes Yes Yes Yes Yes
31 Rabeea Tal Alhawa Yes Yes No Yes Yes Yes
32 Rabeea Awinat Yes Yes Yes Yes Yes
33 Rabeea Karan Yes Yes Yes Yes Yes
34 Zummar Sleha Yes Yes Yes Yes Yes
35 Rabeea Botha Yes Yes Yes Yes Yes
36 Rabeea Al Shalan Yes Yes Yes Yes
37 Sinuni Kerava Yes Yes No data Yes Yes
38 Sinuni Shorkan Yes Yes No Yes Yes
2 For school and medical centre indicators only a positive response to the question is the facility damaged is included.
Blank cells could be indicative of the presence of an undamaged facility or there is no facility in the village.

Page | 14
Sub-District
Village Name Village Accessible
Village Inhabited
Evidence of Contamination
Damaged buildings
Schools Damaged
Medical Centre
Damaged*
Reports of Accidents
39 Sinuni Aassan Yes Yes Yes Yes
40 Sinuni Sharafadin Yes Yes Yes Yes
41 Zummar Shakak Yes Yes No Yes Yes
42 Zummar Telmarc Yes Yes Yes Yes
43 Zummar Kobany Yes Yes Yes Yes
44 Zummar Hamad Axa Tahtane Yes Yes Yes Yes
45 Zummar Zummar Yes Yes Yes No data Yes
46 Zummar Aljazronah Yes Yes Yes Yes
47 Zummar Kasarij Yes Yes Yes Yes
48 Zummar Domez Ain Zala Yes Yes Yes Yes
49 Rabeea Moshiref Yes Yes Yes Yes
50 Rabeea Kabaza Yes Yes Yes Yes
51 Rabeea Al Badiya Yes Yes Yes Yes
52 Sinuni Karsey Yes Yes Yes No Yes
53 Sinuni Dokry Yes Yes Yes No data Yes
54 Sinuni Zeroa Yes Yes Yes No Yes
55 Zummar Hudaima Yes Yes Yes No Yes
56 Rabeea Tilsumair Yes Yes Yes No data Yes
57 Zummar Karez Yes Yes Yes No data Yes
58 Zummar Alomla Alsakhira Yes Yes Yes No Yes
59 Sinuni Quessey Yes Yes No Yes Yes
60 Sinuni Rashed Yes Yes Yes No Yes
61 Rabeea Rajm Hassin Yes Yes Yes No Yes
62 Rabeea Rabeea-hazar Sikak Yes Yes No Yes Yes
63 Zummar Sahela Yes Yes Yes No Yes
64 Zummar Sahl Yes Yes Yes No Yes
65 Rabeea Bazadir Al- ajeel No Yes Yes Yes
66 Rabeea Al Siha Alfaliza No Yes No data Yes Yes
67 Sinuni Khanasor Yes Yes No Yes
68 Sinuni Qaserka-Halyqi Yes Yes No Yes
69 Sinuni Kirky Hasary Yes Yes Yes No
70 Sinuni Petuney Yes Yes Yes No
71 Zummar Tel Khader Yes Yes Yes No data
72 Rabeea Til Al hayal Yes Yes Yes No data
73 Rabeea Al thaya Yes Yes No Yes
74 Zummar Koz Keran Yes Yes Yes No
75 Zummar Jamrood Yes Yes Yes No data
76 Zummar Abo Wajna Yes Yes Yes No
77 Zummar Alsmod Complex Yes Yes No Yes
78 Rabeea Girsoor Yes Yes No Yes
79 Rabeea AL-johariya Yes Yes No Yes
80 Rabeea Momi Yes Yes No Yes
81 Rabeea Moosha Yes Yes No Yes
82 Rabeea Hay alaskary Yes Yes No Yes

Page | 15
Sub-District
Village Name Village Accessible
Village Inhabited
Evidence of Contamination
Damaged buildings
Schools Damaged
Medical Centre
Damaged*
Reports of Accidents
83 Rabeea Hay alaskary Yes Yes No data Yes
84 Rabeea Awisiya Yes Yes No Yes
85 Rabeea Hay –Alqaadsey Yes Yes No Yes
86 Rabeea Abo Khasab Yes Yes Yes No
87 Zummar Bazela Yes Yes No Yes
88 Zummar Mafri Yes Yes No Yes
89 Zummar Masefna Yes Yes Yes No
90 Rabeea Khirbal Mahmood Yes Yes No Yes
91 Sinuni Kely Yes Yes No No Yes
92 Sinuni Topal Yes Yes No No Yes
93 Zummar Omer Khalid Yes Yes No No Yes
94 Rabeea District Rabiya Yes Yes No data No data Yes
95 Zummar Celikh Yes Yes No No Yes
96 Zummar Shebana Yes Yes No No Yes
97 Sinuni Terraf Yes Yes No No Yes
98 Zummar Jasa Yes Yes No No Yes
99 Sinuni Tell Moshref Yes Yes No data No Yes
100 Sinuni Baraa 1 Down No No No data Yes Yes
101 Zummar Sahlaj No No Yes Yes
102 Rabeea AL-ramo Yes Yes No No
103 Rabeea Al alqana Yes Yes No No
104 Rabeea Buhar Yes Yes No No
105 Rabeea Al Murra Yes Yes No No
106 Rabeea Albazona Yes Yes No No data
107 Rabeea Al Abda Yes Yes No No
108 Zummar Kadaseya Yes No Yes No data
109 Zummar Chakuri Yes Yes No No
110 Rabeea Alyoka Yes Yes No data No
111 Rabeea Waleed Yes Yes No data No
112 Rabeea Masaka Yes Yes No data No
113 Rabeea Kalhi Yes Yes No data No
114 Zummar Dibshyat Almushahda Yes No No data Yes
115 Zummar Girkavir Yes No No data Yes
116 Zummar Teba Alrayah Yes Yes No No
117 Zummar Alsofiya Yes Yes No data No
118 Zummar Ain-Awez Yes Yes No data No
119 Zummar Ker Bear Yes Yes No data No
120 Rabeea Awena Yes Yes No data No
121 Zummar Rai Aljazera Yes Yes No No
122 Zummar Ain Zalah Yes No No data Yes
123 Zummar Aljazera Yes No No data Yes
124 Zummar Girkavir Yes No No data Yes
125 Rabeea AL-qahira Yes Yes No data No data
126 Rabeea AL- azim Yes Yes No No

Page | 16
Sub-District
Village Name Village Accessible
Village Inhabited
Evidence of Contamination
Damaged buildings
Schools Damaged
Medical Centre
Damaged*
Reports of Accidents
127 Sinuni Yousevan Yes Yes No No
128 Sinuni Sardasety Camp Yes Yes No No
129 Sinuni Jame Jaffra Yes Yes No No
130 Sinuni Bakran Yes Yes No No
131 Sinuni Sara Dashty Yes Yes No No
132 Sinuni Kolka Yes Yes No No
133 Rabeea Al Salahya Yes Yes No No
134 Rabeea Alatbax Yes Yes No No
135 Rabeea Albazona Yes Yes No No
136 Rabeea Bazona Al Wasta Yes Yes No No
137 Zummar Khamrok Yes Yes No No
138 Zummar Ali Abbar Yes Yes No No
139 Sinuni Omal Khabary Yes No No data Yes
140 Sinuni Ber Adam Yes Yes No data No
141 Sinuni Ber Qassim Yes Yes No data No
142 Zummar Khan Safya Yes Yes No No
143 Zummar Xrab Tabin No No data No data Yes
144 Zummar Ain Zola No No data No data Yes
145 Zummar Hamad axa No No data No data Yes
146 Zummar Ain Farace No No No data Yes
147 Rabeea Hay Shaafee No No No data Yes
148 Zummar Tel Khabaz No No No data Yes
149 Rabeea Salaha Alhom Yes No No No data
150 Rabeea Hae al hasriya Yes No No No
151 Zummar Ain Manaa Yes No No data No data
152 Sinuni Ragmalabed Yes No No data No
153 Rabeea Sar Sank No No No data No data
154 Zummar Brazanki No No No data No data
155 Rabeea Jidriya No No No data No data
156 Zummar Snan No No data No data No data
157 Zummar Gir Chal No No No data No
158 Rabeea Mishrif No No No data No data
159 Rabeea Jilparat No No No data No data
160 Rabeea Al Mahmoodiza No No data No data No data
161 Rabeea Sifaya No No No data No data
162 Rabeea Saudia No No No data No data
163 Zummar Sheikan No No No data No
164 Sinuni Khazoka No No No data No data
Page | 17
4. Conclusion
There were a number of key conclusions that can be made from carrying out the assessment.
Firstly, the assessment provided good initial contamination data that can be shared with
others to inform their programme decision making; secondly, the assessment enabled MAG to
narrow the focus of the activities and provided a basis for planning the next steps and further
developing the methodology; finally, the data collected provided an indication of the overall
scale of the problem which allows for better long term planning and evidence that can be used
when advocating for further funding to address the problem.
The data gathered by the report will be circulated to interested parties to inform planning and
decision making across the board. Relevant government partners including local government
actors in Ninewah and the Iraqi Kurdistan Mine Action Agency (IKMAA) in Erbil will be
provided with the data so that they can use it as part of their evaluation of the current situation
and when developing strategies for the future. The information will also be shared with the
humanitarian community, who will be able to use it to analyse what impact of contamination in
an area might have on their areas of operation. For example, the information on damage to
infrastructure and services could be used to inform reconstruction planning in Ninewah.
The assessment provided MAG with a vital foundation to enable planning which served to
narrow the focus of activities and helped inform the methodology of the clearance process.
Information from this survey has been used to inform next steps by identifying villages for
further detailed survey. The gaps in the current data will be filled through the more in depth
contamination assessments that will be carried out to support future clearance. This rapid
contamination assessment is now an integral element of the MAG methodology for
prioritisation of clearance work in new areas of operation in support of returning populations.
The data gathered by the assessment provide an indication of the extent of the problem which
was previously unknown. This enables MAG and other stakeholders to lobby for further
funding on the basis of the need identified by the assessment. A prioritisation of key areas
can be carried out and support for particular areas of concern can be identified and funds
advocated for accordingly.
While this assessment was carried out in a short period of time and collected only data on a
limited number of key indicators, it has provided MAG with vital data that previously was
unavailable and a rapid assessment methodology that can be reused in other new areas of
operation.

Page | 18
Children stand and look at the destroyed school in Ain el-Hilweh.
Page | 19
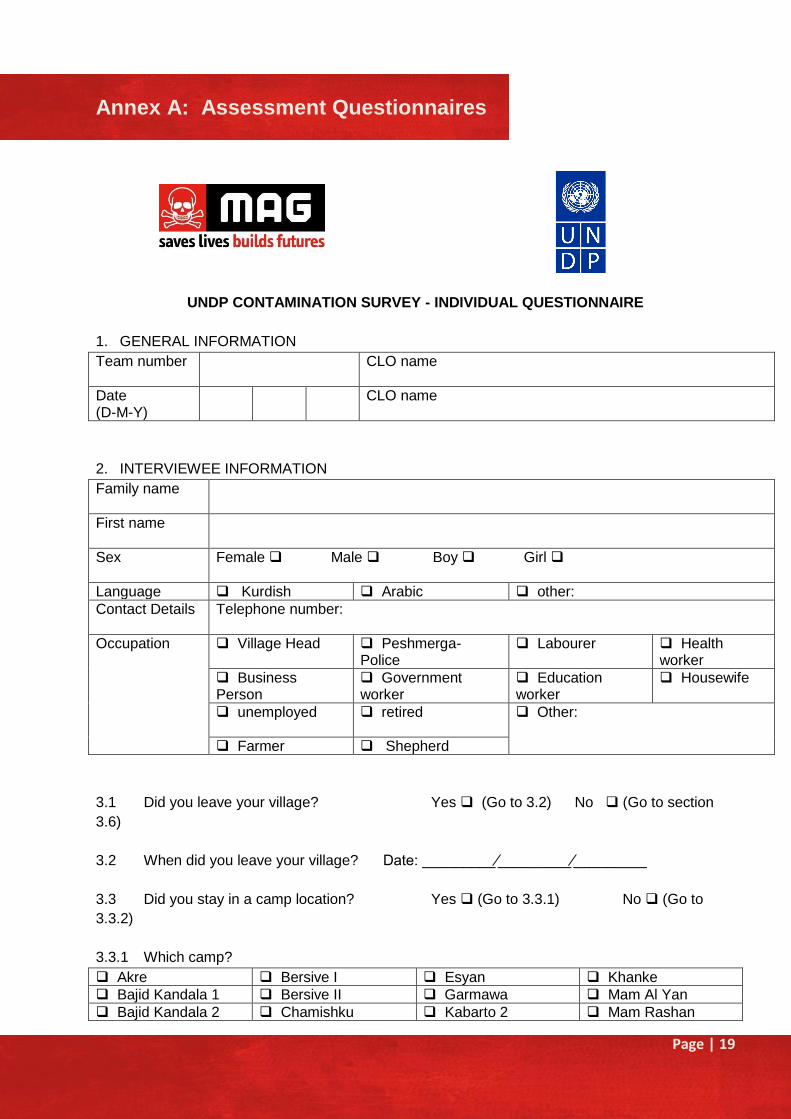
Annex A: Assessment Questionnaires
UNDP CONTAMINATION SURVEY - INDIVIDUAL QUESTIONNAIRE
1. GENERAL INFORMATION
Team number
CLO name
Date (D-M-Y)
CLO name
2. INTERVIEWEE INFORMATION
Family name
First name
Sex
Female Male Boy Girl
Language Kurdish Arabic other:
Contact Details Telephone number:
Occupation Village Head
Peshmerga- Police
Labourer Health worker
Business Person
Government worker
Education worker
Housewife
unemployed retired Other:
Farmer Shepherd
3.1 Did you leave your village? Yes (Go to 3.2) No (Go to section
3.6)
3.2 When did you leave your village? Date: _________⁄_________⁄_________
3.3 Did you stay in a camp location? Yes (Go to 3.3.1) No (Go to
3.3.2)
3.3.1 Which camp?
Akre Bersive I Esyan Khanke
Bajid Kandala 1 Bersive II Garmawa Mam Al Yan
Bajid Kandala 2 Chamishku Kabarto 2 Mam Rashan

Page | 20
Bamarne (Dawadia) Deir Aboun Kabarto I Sheikhan I
Bardarash Domiz Khadia Wargahe Zakho
Sharya Arbad
Other:
3.3.2 If outside a camp, where were you staying?
________________________________________
3.3 Did you return to your community permanently? Yes No
3.4. When did you return? Date:
_________⁄_________⁄_________
3.5 Why did you return?
Agriculture Checking security before returning with family
Checking if property is still there
Livestock
No financial means to stay at previous housing
Other
3.6 Have you ever received Risk Education? Yes (Go to 3.6.) No (Go to section 3.7)
3.6.1 When did you receive Risk Education? Date:
_________⁄_________⁄_________
3.6.2 Where did you receive Risk Education?
Camp Village Other
3.6.3 From whom did you receive Risk Education?
MAG Don‟t know Other:
3.7 Are you aware of any contamination in your community? Yes (Go to 3.7.1)
No – don‟t know (Go to
section 3.8)
3.7.1 How did you establish there is contamination?
Witnessed fighting-shelling, etc
I have seen UXO Someone told me
UXO Accident Have seen boxes-wrapping
I have seen UXOs being placed
Other:
3.7.2 Where is the contamination? Urban area Rural area Both
Moved by people Don‟t know

Page | 21
(Show community map) (please write down as much information as possible (who, what, when, where, why,how) Remarks:
Types ERW mentioned (confirmed by photographs)
Location contamination mentioned
Landmines IED UXO AXO Booby-traps other:
place of Worship School Health Centre Grazing Land Farming Land Market other:
3.8 Are you aware if any accidents happened in this community?
Yes (Go to 3.8.1) No – don‟t know (Go to section 4)
3.8.1. Accident:
When did the accident occur? Date: ________⁄_________⁄_____
Don‟t know
What caused the explosion? Don‟t know Removal Item
Tamper Tried to disarm
Other:
Who was involved? (how many)
Men Women
Boys Girls
Don‟t know
Animals:
What happened? Dead Injured Don‟t know

Page | 22
Went to clinic Don‟t know
Additional information (Show community map) (Please write down as much information as possible (who, what, when, where, why, how)
Contact details person involved:
4. Interviewee certifies that CL have visited locality
Name
Position / occupation
Signature
Date
Village Name
Village Coordinates UTM
Easting Northing

Page | 23
UNDP CONTAMINATION SURVEY - VILLAGE DATA
3. LOCATION INFORMATION
Governorate
District
Sub-District
Village Name
Alternative Village name
Alternative Village name
Village Leader Name
Village leader contact details
Coord system
UTM
UTM
Easting Northing
Coordinates fixed by GPS
GPS variation +/- _____ metres
Description of geographical reference (landmark that will remain, mosque, health clinic, etc)
3.1 Is the village⁄ town accessible? Yes No 1.1.2 Why is the village inaccessible?
Security issues Contamination Other:
2. Is the village/town inhabited? Yes No

Page | 24
No. of Households Men Women Boys Girls
Prior to conflict
Current
2.1 Are there visible signs of damaged or destroyed buildings? Yes No Unknown 3 INFRASTRUCTURE / SERVICES / LAND USE INFORMATION
Type of infrastructure Present
Not present
Damaged
Destroyed
In use
Not in use
Remarks
Electricity
Water
Sewerage
Communications
Roads
Bridges
School
Youth centre
Medical facility
Police station
Fire station
Local authority representative
Place of worship
Market
Businesses
Industry
Public recreation areas
Arable land
Grazing land
4. INFORMATION GATHERED BY:

Page | 25
Team number
CLO name
Date
CLO name
5. INTERVIEWEE CERTIFIES THAT CL HAVE VISITED LOCALITY
Name Interviewee
Position / occupation
Signature
Date
Google Earth Image Village attached.
Page | 26
Annex B: Methodology
Under this grant MAG recruited an international Community Liaison Manager (CLM) to oversee the
activities during a six week period between 15 June and 31 July 2015. During the first 2 weeks of
the grant, six teams were recruited, with two teams each in the districts of Zummar, Rabbia and
Sinuni respectively.
Each team, made up of two Community Liaison (CL) officers and a driver, were trained in both the
collection of the required data, using the data collection tools, and delivery of RE messages and
materials to people encountered while conducting the survey. The CLM provided each team with
a list of locations to visit in addition to maps, data collection tools, GPS equipment and risk
education (RE) materials for distribution.
The teams travelled to the villages where their activities were dependent on whether the village
was accessible and inhabited. Data was collected on access, presence of contamination, damage
to buildings, the number of current residents and reports of accidents in the area. Data collection
was conducted via two surveys – see Annex A – and was carried out in the following way:
Where there was no access to the village, the reason for the blockage was noted. In the vast
majority of cases this was because they were prevented access to the village by Peshmerga
forces for security reasons.
Where there was access to the village but no one was present, the coordinates of the village
were taken and the village was marked as abandoned.
For accessible villages:
o The team would first locate a village leader or elder and explain the nature of the project,
how it would be conducted and the importance of the information gathered. A village
overview discussion was then held to establish key information on the village and to
provide risk education messages and awareness materials. Using the first of two surveys,
„UNDP Contamination Survey – Village Data’ (see annex A), village information was
collected, including contact details for the leader, name and coordinates of the location,
level of accessibility, number of inhabitants and evidence of damage to buildings. This
group are also consulted to develop a map of the town indicating areas where damaged
buildings are located.
o Once the overview questionnaire and the map were completed, if permitted and possible,
MAG CL staff carried out interviews using the „UNDP Contamination Survey – Individual
Survey‟ (see Annex A) with other members of the local population to collect further
information as detailed above.
o The information was collected in hard copies and compiled and entered into the database
by the CLM.