july 2014 measuring and using juvenile recidivism data · pdf fileoutcomes beyond recidivism...
TRANSCRIPT

1
B A C K G R O U N D
Juvenile arrest rates, including for violent crimes, fell by approximately 50 percent from 1997 to 2011, to their lowest
level in more than 30 years.1 In combination with this sharp drop in arrests, state and local reforms have had an extraordinary impact: from 1997 to 2011, youth confinement rates declined by almost half.2 The juvenile justice field deservedly celebrates this success and continues to push for further reductions in confinement rates. Many states are also striving to ensure that youth who have been diverted from confinement, as well as those returning home after time spent in a facility, receive supervision and services that reduce recidivism and improve other youth outcomes. As such, policymakers are eager to know more about what happens to youth after they have been in contact with the juvenile justice system. What are their rearrest and reincarceration rates? How do they fare in terms of education, employment, and other important outcome measures while they are under juvenile justice supervision and afterward?
To understand to what extent states currently track recidivism data for youth involved in the juvenile justice system and use that information to inform policy and funding decisions, the Council of State Governments Justice Center, The Pew Charitable Trusts’ Public Safety Performance Project,3 and the Council of Juvenile Correctional Administrators surveyed juvenile correctional agencies in all 50 states.4 This issue brief highlights the key findings of the survey and provides state and local policymakers with five recommendations for improving their approach to the measurement, analysis, collection, reporting, and use of recidivism data for youth involved with the juvenile justice system. In addition, examples are provided of how select states have translated these recommendations into policy and practice.
Measuring and Using Juvenile Recidivism Data to Inform Policy, Practice, and Resource Allocation
July 2014
The Importance of Measuring Outcomes beyond Recidivism for Youth Involved with the Juvenile Justice System
Juvenile justice systems can use a number of metrics to track outcomes for youth under system supervision, including educational attainment, behavioral health improvements, or skill development and employment, all of which are critical to ensuring a youth’s long-term success. The survey focused primarily on the measurement of recidivism, and the recommendations presented here reflect that focus. The survey results did, however, indicate that only half of all state juvenile correctional agencies measure youth outcomes beyond whether youth commit future delinquent acts, and only 20 percent of states track these outcomes for youth after they are no longer on supervision. Policymakers and juvenile justice agency leaders should strongly consider including a priority set of positive youth outcomes in the evaluation of system success to determine not only whether the juvenile justice system is helping to prevent youth’s subsequent involvement in the system, but also whether it is helping youth transition to a crime-free and productive adulthood.

2
The survey responses summarized in this issue brief pertain to youth committed to and released from state custody. The majority of youth involved with the juvenile justice system, however, are not committed to state custody. Rather, they are under the supervision of state probation agencies or local/county correctional or probation agencies.5 Most local juvenile justice systems don’t have a way to evaluate recidivism effectively across locales because local systems typically have limited capacity to track these data. For this reason, although the survey findings presented here reflect state government practices, the recommendations in this brief are relevant to both state and local juvenile justice agencies. Ideally, state and local government officials will consider together how they can use the recommendations in this brief to improve the measurement and use of recidivism data to inform policy, practice, and resource-allocation decisions statewide.
S U M M A R Y O F R E C O M M E N D A T I O N S 1. Measure recidivism for youth involved with the juvenile justice system, considering the
multiple ways they may have subsequent contact with the justice system. Most states track recidivism for youth in their custody. Yet, one in five (11 states) reported that they don’t track recidivism rates at all for the youth under their system supervision. Of the 39 that do, 46 percent (18 states) use only one type of event (e.g., rearrest or reincarceration) to track recidivism.
2. Analyze recidivism data to account for youth’s risk levels, as well as other key youth characteristics and variables. Of the 39 states that collect recidivism data, only half (21 states) analyze recidivism by youth’s assessed risk levels and even fewer examine recidivism rates by key variables such as youth’s needs (13 states), lengths of stay in facilities (12 states), or participation in different service programs (11 states).
3. Develop and maintain the infrastructure necessary to collect, analyze, and report recidivism data. Almost half of all states rate their capacity to collect and report recidivism and other performance data as “Strong” or “Very Strong,” but the other half rated their capacity as “Average,” “Below Average,” or “Weak.”
4. Make recidivism data available to key constituents and the general public. Of the 39 states that collect recidivism data, the vast majority shares these data with the legislature and governor; 64 percent (25 states) share these data with the judiciary; and 74 percent (29 states) make these data publicly available.
Methodology
The Council of State Governments Justice Center (CSG Justice Center) designed a survey for state juvenile correctional agencies in partnership with the Council of Juvenile Correctional Administrators (CJCA) and The Pew Charitable Trusts’ Public Safety Performance Project to get a better understanding of which recidivism and other youth outcome data states collect and report for youth in state custody. In fall 2013, CJCA sent the survey electronically to all 50 state juvenile correctional administrators and received responses from each of these agencies. The CSG Justice Center then followed up with each agency to verify all survey responses and determine whether other agencies outside the juvenile correctional agency collect and/or report on recidivism data for youth in state custody (see the Survey Notes section for additional details on select states). Survey findings reflect the practices of state agencies (referred to throughout this brief as “states”) for measuring recidivism for youth in the custody of the state juvenile correctional agency.

3
5. Use recidivism data to inform juvenile justice policy, practice, and resource allocation. Just over a quarter of all states report using recidivism and other system performance measures as the “Primary” factor for guiding system policy, practice, and resource-allocation, while 58 percent report that they use it “Some” and 16 percent report that these data are used “Very Little” or “Not at All.”
R E C O M M E N D A T I O N SRECOMMENDATION 1. Measure recidivism for youth involved with the juvenile justice system, considering the multiple ways they may have subsequent contact with the justice system.
Most states track recidivism for youth in their custody. Yet one in five (11 states) reported that they don’t track recidivism rates at all for the youth under their system supervision. Of the 39 states that do track recidivism for youth in their custody, a number of them measure recidivism narrowly:
■ More than half measure recidivism through multiple system events (21 states), while 46 percent (18 states) measure recidivism focusing on only one system event, such as rearrest or readjudication/reconviction, including 6 states that measure recidivism solely as whether a young person is recommitted/reincarcerated.
■ 59 percent (23 states) track recidivism events that include both of the following, but the other 41 percent (16 states) don’t collect one or the other of them:
) Recidivism processed by the adult criminal justice system
) Technical violations of probation/parole
To measure recidivism for youth under supervision comprehensively and accurately, state and local juvenile justice systems should:
Track the distinct ways in which youth can have subsequent contact with the justice system.6 Policymakers should work with state and local juvenile justice agencies to measure recidivism for youth under community supervision and returning from facilities to take into account the following types of contact with the justice system:
■ Rearrest
■ Readjudication/reconviction
■ Recommitment/reincarceration
■ Technical violations/revocations
■ New offenses processed by the adult criminal justice system
■ New offenses that occur after a youth is no longer under system supervision
Using only one or two of the above measures to track recidivism may make it difficult to determine whether the juvenile justice system is succeeding in effectively preventing youth from coming into subsequent contact with the justice system. For example, in some states, an 18-year old male, released six months earlier from a juvenile correctional facility, could bypass the juvenile justice system altogether and end up in state prison because of his age. This event, however, would not be captured in recidivism data in a state that focuses exclusively on whether a youth recidivates within the juvenile justice system.
ME A SUR ING A ND US ING JU V ENILE REC ID I V ISM DATA TO INFORM POL ICY, PR ACT ICE , A ND RESOURCE A LLOCAT ION

4
RECOMMENDATION 2. Analyze recidivism data to account for youth’s risk levels, as well as other key youth characteristics and variables.
Most states conduct some analysis of their recidivism data but are limited in their ability to answer key questions about the effectiveness of their systems. Out of the 39 states that track recidivism:
■ 59 percent (23 states) analyze recidivism by youth’s originating county or region, but 41 percent (16 states) can’t identify if youth from specific geographic areas are doing better or worse than their peers.
■ More than half (21 states) analyze recidivism by youth’s assessed risk level, but 18 states cannot disaggregate by risk level as a critical part of their analysis.
■ Half (20 states) track recidivism by facility and only a third (12 states) by length of stay.
■ Only a handful of states analyze recidivism by youth’s needs (13 states), the impact of participating in specific programs/services designed to meet these needs (11 states), or involvement in other service systems (5 states).
Florida and Pennsylvania: Establishing Statewide Recidivism Measurement Standards
In 1997, the Florida Department of Juvenile Justice’s Bureau of Research and Planning held a conference at which state legislative staff and juvenile justice stakeholders developed common definitions and processes for the state to evaluate recidivism and other youth and system outcomes. The effort led to an interagency agreement to annually review and update these definitions and processes, while still ensuring that they are able to make comparisons from year to year.7
In states where counties operate their own probation or local corrections systems, it can be difficult for state policymakers to compare recidivism data from one county to the next, unless local agencies agree to measure recidivism in the same way. In Pennsylvania, the Juvenile Court Judges’ Commission collaborated with the Pennsylvania Council of Chief Juvenile Probation Officers and researchers at Temple University to develop a shared set of juvenile justice outcome measures and establish a common recidivism benchmark across Pennsylvania’s 67 counties.8 This initiative helped to unite local juvenile justice leaders to develop a statewide Juvenile Justice System Enhancement Strategy to improve outcomes for youth.

5
To achieve a full and nuanced understanding of what works and what doesn’t in a juvenile justice system and
determine how best to allocate resources accordingly, policymakers should:
Require recidivism data to account for youth’s assessed risk levels. When conducting recidivism analyses, it is critical that systems take into account the assessed risk level of the population being measured. Recidivism rates can and should differ substantially depending upon the risk level of the population of youth served. Indeed, high-risk youth released from a state juvenile correctional facility would be expected to experience a higher recidivism rate than low-risk youth diverted from such a facility. Absent this context, policymakers might incorrectly infer from an increasing recidivism rate that the performance of a state juvenile correctional agency is worsening. Instead, the agency could actually be performing just as well or better than in the past but diverting more low-risk youth out of the system, and thus, serving a higher-risk population that is more likely to reoffend. Disaggregating recidivism rates according to youth’s risk levels requires an agency to assess the risk levels of all youth under its supervision effectively using a validated assessment tool. Furthermore, this information must be maintained in an electronic record system. These are ambitious goals for most states, but if they are not realized, the recidivism data generated will have only marginal value.
Figure 1. 39 States’ Analysis of Recidivism Data
ME A SUR ING A ND US ING JU V ENILE REC ID I V ISM DATA TO INFORM POL ICY, PR ACT ICE , A ND RESOURCE A LLOCAT ION
By demographic group 85%
59%
59%
51%
28%
18%
8%
0% 20% 40% 60% 80% 100%
By geography
By offense type or group
By risk
By specific placement facility
By placement type
By needs
By length of stay
By placement/post-release service program
Other
By other systems involvement
None of the above
31%
13%
33%
51%
54%

6
Analyze recidivism data according to other key youth characteristics and variables. Policymakers should require and fund agencies to analyze recidivism data by the following additional variables, listed in priority order, to understand system effectiveness:
■ Youth demographic groups, so juvenile justice systems can identify deficits in system performance for youth who share certain characteristics or come from specific geographic areas.
■ Placement type, facility, service provider, and length of stay, so juvenile justice systems can know which providers are generating recidivism reductions; how long it takes to produce such outcomes (and when more time spent in services/facilities doesn’t produce better results); and where opportunities exist to use system resources more efficiently.
■ Youth’s service needs and programs, to understand how best to prioritize resources within the juvenile justice system and across other service systems to address youth’s needs and ensure that these resources are used only for interventions that address these needs effectively, with resulting reductions in recidivism.
Utah and Louisiana: Analyzing Recidivism Data
In Utah, the Division of Juvenile Justice Services (DJJS), in collaboration with the Juvenile Court, used its federal Juvenile Accountability Block Grant to develop a web-based data management system. The system supports quarterly recidivism analyses of all youth in DJJS custody and the comparison of outcomes for youth with varying demographic and offense profiles who receive different types of placements. DJJS also partnered with researchers at the University of Utah to use this system to evaluate the quality of community-based programs and service providers, and to analyze whether providers produce better or worse recidivism rates than expected based on the risk level of the youth they serve. These analyses are then used to inform program referral criteria and placement decisions and to develop provider quality improvement plans.9
The Louisiana Office of Juvenile Justice (OJJ) annually measures recidivism by a variety of factors, including risk and needs, geography, facility, and participation in specific programs. Tracking outcomes in this way gives OJJ a better picture of what works with specific types of youth and helps the state make adjustments to service delivery.10 For example, after evaluating a short-term program for youth in their system, OJJ realized that it had an excessively high recidivism rate. As a result, OJJ contracted with the University of Cincinnati to redesign this program so it better reflected the research on how to how improve youth outcomes and trained staff on how to implement it effectively.

7
RECOMMENDATION 3. Develop and maintain the infrastructure necessary to collect, analyze, and report recidivism data.
Almost half of all states described their capacity to collect and report recidivism and other performance data as “Strong” or “Very Strong,” but the other half rated their capacity as “Average,” “Below Average,” or “Weak.” States primarily blamed a lack of easily retrievable data, the perception that the data was not reliable, and limited resources for their struggles to track recidivism.
In order to collect all data necessary to track the recidivism rates of youth in the juvenile justice system, policymakers should:
Establish an electronic case management system. Routinely generating comprehensive recidivism data requires the establishment of an electronic case management system. Such systems improve data integrity and facilitate data accessibility, sharing, and reporting. The most effective systems track and connect youth assessments, dispositions, service provisions, youth’s involvement with other service systems, and recidivism events captured by a range of law enforcement, juvenile justice, and even adult corrections agencies. Investing in this system will enable policymakers and agency leaders not only to measure recidivism rates but also to understand how system policies and interventions are driving these results.
Develop interagency information-sharing agreements. As noted above, the data entered into an electronic case management system is likely to come from multiple sources including law enforcement, the courts, juvenile justice agencies, adult corrections agencies, and community-based service providers. Policymakers should facilitate interagency data-sharing agreements, where necessary, to ensure that staff from all participating agencies can enter data into the system and have access to the full range of available information while also adhering to confidentiality laws.
Establish policies and procedures to guide data entry and use. Once an electronic case management system is in place, policymakers should require juvenile justice and partner systems to establish policies and procedures for entering and maintaining the data, including provisions for training and operator support as well as quality assurance protocols to ensure data integrity and its appropriate use. Systems will also likely need to establish a common identification number for each youth to facilitate record matching across different agencies.
Figure 2. All States’ Ratings of Their Capacity to Collect and Report Juvenile Recidivism Data and Other Key Performance Measures
ME A SUR ING A ND US ING JU V ENILE REC ID I V ISM DATA TO INFORM POL ICY, PR ACT ICE , A ND RESOURCE A LLOCAT ION
Strong30%
Very Strong
16%
Average28%
Weak12%
BelowAverage
14%

8
RECOMMENDATION 4. Make recidivism data accessible to key constituents and the general public.
The majority of states share recidivism data with at least some key constituents, but significant gaps exist in many states’ reporting practices. Of the 39 state agencies that track recidivism:
■ The majority of states report sharing these data with the legislature and the governor.
■ 64 percent (25 states) share these data with the judiciary.
■ 56 percent (22 states) share these data with other state youth-service agencies and 41 percent (16 states) share these data with State Advisory Groups.
■ 74 percent (29 states) make their recidivism data available to the public.
To ensure that all agencies, organizations, and individuals who have a role to play in shaping juvenile justice system decisions and interventions have the most accurate information on system performance, policymakers should:
Require regular reporting of recidivism data. Juvenile justice agencies should generate annual performance reports that share recidivism trends for youth under their supervision. Agencies should formally report these data to all branches of government, court personnel, State Advisory Groups, service providers, other key system stakeholders, and the public. Ten of the 39 states that currently collect recidivism data have passed legislation that requires juvenile justice agencies to regularly report it.
Oregon and Oklahoma: Creating an Electronic Case Management System
In 1997, the Oregon state legislature facilitated the development of the Juvenile Justice Information System (JJIS) by approving funding for the system contingent upon the state securing intergovernmental agreements with counties to use the system. The Oregon Youth Authority (OYA) developed the JJIS and provides funding and technical support for its continued use by 36 county juvenile justice agencies. The JJIS tracks youth from referral to a juvenile court through secure confinement and reentry and is used by OYA to report on youth outcomes to the state legislature.11 OYA has also leveraged the historical recidivism data available through JJIS to create a set of sophisticated data tools, collectively known as the Youth Reformation System, that help the agency make more targeted placement and service decisions that improve public safety and youth outcomes.
In Oklahoma, the Office of Juvenile Affairs uses the Juvenile On-Line Tracking System (JOLTS) to collect data on all youth in the juvenile justice system across the state. Youth are tracked as they are admitted or discharged from various placements including detention, youth shelters, group homes, and secure facilities. Juvenile justice staff enters and has access to information on youth’s demographics, families, risk assessment scores, warrants, referrals, intakes, and petitions. JOLTS has helped ensure all government branches and systems agencies have access to a single electronic case record for individual youth and can track the outcomes of system interventions across agencies, enabling the delivery of a more streamlined, effective set of assessments and services for youth throughout their time in the system.12

9
Establish methods for sharing data effectively. Many of the states that report recidivism data to policymakers do so through lengthy documents in which the key findings are buried or obscure. Policymakers should work with juvenile justice systems to develop an agreed-upon, user-friendly way to report recidivism data that helps them to focus on and understand a limited, priority set of key indicators of system effectiveness, and use this information to guide system policy and funding decisions. State and local government agencies are increasingly using data dashboards that visually present recidivism rates for this purpose.
RECOMMENDATION 5. Use recidivism data to inform juvenile justice policy, practice, and resource allocation.
Most states use recidivism and other performance measures to some degree to inform policy and resource-allocation decisions, but the majority are not harnessing the full potential of this information.
■ 26 percent of all states (13 states) report using recidivism and other key performance measurement data as the “Primary” factor in guiding fundamental system decisions.
■ The majority of states (29 states) use these data “Some” to guide decisions.
■ 16 percent of all states (8 states) use these data “Very Little” or “Not at All.”
Figure 3. All States’ Use of Juvenile Recidivism Data and Other Key Performance Measures to Guide Policy, Practice, and Resource Allocation
Florida and Maryland: Reporting Recidivism Data
The Florida Department of Juvenile Justice publishes all of its statewide juvenile justice data—from prevention to reentry—on a public website that enables users to conduct their own analyses of the data to answer questions of interest. It also publishes user-friendly reports on the efficacy of specific programs as well as educational, health, prevention, detention, and intake services to promote increased transparency and accountability on the outcomes of these system interventions.13
Maryland legislated that its Department of Juvenile Services report to the General Assembly every year on the recidivism rates of juveniles committed to the state in residential care, including a breakdown of rates by program and placement.14
ME A SUR ING A ND US ING JU V ENILE REC ID I V ISM DATA TO INFORM POL ICY, PR ACT ICE , A ND RESOURCE A LLOCAT ION
Primary26%
Some58%
Very Little 10%
Not at All 6%

10
States that collect recidivism data typically use them for a general evaluation of system functioning and rarely for more specific purposes, which means they are not using all of the information they need to make policy, practice, and funding decisions to reduce recidivism for youth in the juvenile justice system. Of the 39 states that track recidivism:
■ Approximately half use data to evaluate the performance of specific facilities (22 states), system interventions/programs (19 states), or reform initiatives (18 states).
■ Less than 40 percent use data to compare recidivism rates across demographic groups (15 states), including across counties/localities (14 states).
■ 28 percent (11 states) use recidivism data to conduct cost-benefit analyses.
To ensure that recidivism data is used to inform key policy, practice, and resource allocation decisions and hold agencies and service providers accountable for performance, juvenile justice systems are encouraged to:
Establish formal processes for reviewing recidivism data. Policymakers should work with juvenile justice systems to establish, through legislation or agency policy, formal processes to review recidivism rates to evaluate (1) whether system performance is improving overall, and (2) the impact of specific reform initiatives.
Juvenile justice agency leaders should also develop their own internal processes to review recidivism data with both management and line staff. Often, even when agencies track and report recidivism data, these activities are isolated in research departments and the results are shared only with senior leadership. Instead, state and local agencies should seek to create a performance-based culture where all staff knows the current outcomes for the youth under their supervision.
Figure 4. 39 States that Collect Recidivism Data Use it for Specific Purposes
System monitoring and analysis 82%
77%
56%
56%
46%
36%
28%
3%
3%
0% 20% 40% 60% 80% 100%
Evaluation against prior performance
State oversight
Facility evaluation
Program/intervention evaluation
Evaluation of specific reform initiatives
Population comparison
County/local jurisdiction comparisons
Cost-benefit analysis
None of the above
Other
38%
49%

11
Set improvement targets. Using recidivism data from a single point in time to evaluate system performance does not enable policymakers and agency leaders to know whether the policies and practices they are putting into place to improve youth outcomes are making a measurable difference. Policymakers should work with juvenile justice systems to identify baseline (historical) recidivism rates and set annual targets for recidivism reduction that are ambitious but achievable. A measurable improvement goal, for example, could be a 10-percent reduction in technical violations of probation over a 1-year period.
Use recidivism data to promote accountability and the efficient use of resources. Policymakers should hold agencies accountable for achieving improvement targets. The budget development process offers an opportunity to tie overall agency funding, as well as resources for specific programs and reform initiatives, to demonstrated improvements in recidivism rates. Legislators and chief executives should also mandate or encourage juvenile justice agencies to present written recommendations and action plans for improvement.15 Similarly, at the agency level, all supervision and service managers and even line staff should (1) have a clearly defined role in—and be held accountable for—reducing recidivism for youth under agency supervision; (2) receive regular progress reports; and (3) participate in ongoing dialogue to identify and advance strategies for using data to strengthen agency policy and practice.
Indiana and Washington: Using Recidivism Data to Inform Policy, Practice, and Resource Allocation
In Indiana, the Division of Youth Services calculated the impact of lengths of stay in their secure facilities on youth’s recidivism rates when they returned to the community. The data showed that youth with a low risk of reoffending who were confined for longer periods of time were recidivating at a higher rate. In response, the agency worked with the courts to reduce the time these low-risk youth spent in a facility. In the three-year period that followed these reforms, the percentage of youth who were reincarcerated fell from 39 percent to 30.5 percent. In addition, the shortened lengths of stay have had a significant fiscal impact, accounting for approximately $12 to $15 million in savings annually. These efforts have also substantially lowered the overall correctional facilities’ population, and the state estimates a 3-year cost avoidance of $167 million, because the number of youth returning to these facilities would have been even higher if the state had not reduced its recidivism rate.16
The Washington State Institute for Public Policy both evaluated and showed the positive impact of youth’s participation in specific evidence-based programs on recidivism rates and was able to estimate the potential cost savings of keeping youth in the community through these services rather than committing them to institutional placements. As a result of this analysis, the Washington state legislature invested $48 million to expand the use of evidence-based programs, which was estimated to save approximately $250 million that the state would otherwise have spent on prison construction and operation.17
ME A SUR ING A ND US ING JU V ENILE REC ID I V ISM DATA TO INFORM POL ICY, PR ACT ICE , A ND RESOURCE A LLOCAT ION

12
C O N C L U S I O NJuvenile justice systems have made extraordinary strides in the last decade to reduce their dependence on confinement. To make sure that new policies—and funding reallocated to community-based supervision and services for youth on probation and those returning from confinement—reduce subsequent contact with the justice system, states need to track recidivism rates. This brief reflects that nearly 80 percent of states do track some recidivism data, but 20 percent still do not, and most states don’t generate the recidivism data analysis that should undergird important system decisions. State and local governments are encouraged to build on their success to date and ensure that all youth who come into contact with the juvenile justice system have their outcomes tracked in a comprehensive and accurate way.
Policymakers and juvenile justice system leaders should use the recommendations in this brief to assess their current capacity to accurately measure recidivism rates and to guide their efforts to collect, analyze, report, and use this data to promote accountability, and ultimately, a more effective system that improves outcomes for youth. Just as policymakers seek to hold their law enforcement agencies or education systems accountable for quantifiable results, it is important that juvenile justice systems are held responsible for public safety and supporting young people to transition to a crime free and productive adulthood. As states and counties divert increasing numbers of low-risk youth out of the juvenile justice system altogether, and those youth who remain under system supervision are higher risk, the need for such accountability will become even more critical.
13
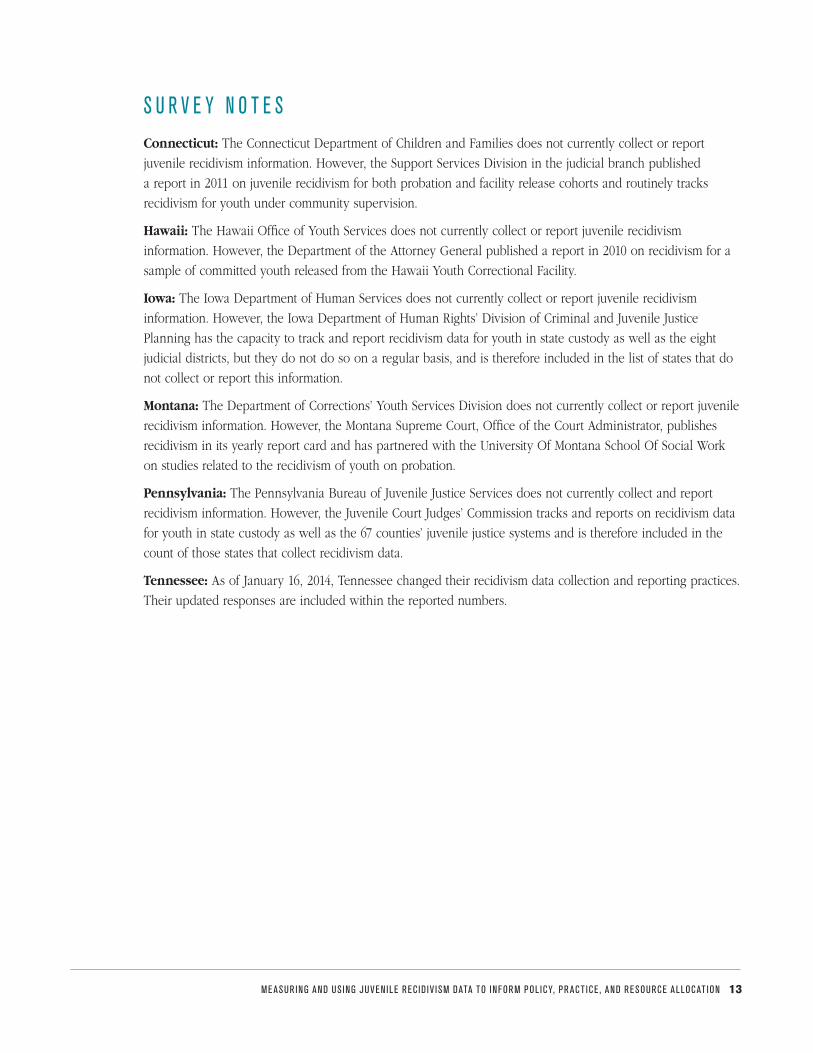
S U R V E Y N O T E S Connecticut: The Connecticut Department of Children and Families does not currently collect or report juvenile recidivism information. However, the Support Services Division in the judicial branch published a report in 2011 on juvenile recidivism for both probation and facility release cohorts and routinely tracks recidivism for youth under community supervision.
Hawaii: The Hawaii Office of Youth Services does not currently collect or report juvenile recidivism information. However, the Department of the Attorney General published a report in 2010 on recidivism for a sample of committed youth released from the Hawaii Youth Correctional Facility.
Iowa: The Iowa Department of Human Services does not currently collect or report juvenile recidivism information. However, the Iowa Department of Human Rights’ Division of Criminal and Juvenile Justice Planning has the capacity to track and report recidivism data for youth in state custody as well as the eight judicial districts, but they do not do so on a regular basis, and is therefore included in the list of states that do not collect or report this information.
Montana: The Department of Corrections’ Youth Services Division does not currently collect or report juvenile recidivism information. However, the Montana Supreme Court, Office of the Court Administrator, publishes recidivism in its yearly report card and has partnered with the University Of Montana School Of Social Work on studies related to the recidivism of youth on probation.
Pennsylvania: The Pennsylvania Bureau of Juvenile Justice Services does not currently collect and report recidivism information. However, the Juvenile Court Judges’ Commission tracks and reports on recidivism data for youth in state custody as well as the 67 counties’ juvenile justice systems and is therefore included in the count of those states that collect recidivism data.
Tennessee: As of January 16, 2014, Tennessee changed their recidivism data collection and reporting practices. Their updated responses are included within the reported numbers.
ME A SUR ING A ND US ING JU V ENILE REC ID I V ISM DATA TO INFORM POL ICY, PR ACT ICE , A ND RESOURCE A LLOCAT ION

14
E N D N O T E S1 Charles Puzzanchera, Juvenile Arrests 2011 (Washington, DC: Office of Juvenile Justice and Delinquency Prevention, 2013), available at www.ojjdp.gov/pubs/244476.pdf.
2 Melissa Sickmund, et al., “Easy Access to the Census of Juveniles in Residential Placement,” (Washington, DC: Office of Juvenile Justice and Delinquency Prevention, 2013), available at www.ojjdp.gov/ojstatbb/ezacjrp.
3 To view state-by-state results of the survey, see “Measuring Juvenile Recidivism: Data Collection and Reporting Practices in Juvenile Corrections,” available at www.pewtrusts.org/en/multimedia/data-visualizations/2014/measuring-juvenile-recidivism.
4 While Washington D.C.’s Department of Youth Rehabilitation Services participated in the survey, their responses are not included in the analysis due to the challenge of comparing a District with states.
5 For example, probation was ordered in 53 percent of the 920,000 delinquency cases that received a juvenile court sanction in 2010, compared with 12 percent that received placement in an out-of-home facility. For more information, see “Statistical Briefing Book,” available at www.ojjdp.gov/ojstatbb/.
6 In 2009, the Council of Juvenile Correctional Administrators (CJCA) issued a white paper that lays out recommendations for standardizing measures of recidivism and provides resources for improving the way jurisdictions track recidivism. For more information, see Phil Harris, Brian Lockwood, and Liz Mengers, A CJCA White Paper: Defining and Measuring Recidivism (Braintree, MA: Council of Juvenile Correctional Administrators, 2009), available at www.cjca.net/attachments/article/55/CJCA-Recidivism-White-Paper.pdf.
7 See “Common Definitions,” Florida Department of Juvenile Justice, available at www.djj.state.fl.us/research/reports/car/common-definitions.
8 See “Juvenile Court Judges’ Commission,” available at www.jcjc.state.pa.us.
9 For more information on Utah’s data collection and use, visit the Utah Division of Juvenile Justice Services website at jjs.utah.gov/.
10 For more information on Louisiana’s data collection and use, visit Louisiana Office of Juvenile Justice at www.ojj.la.gov/.
11 See “Juvenile Justice Information System,” available at www.oregon.gov/oya/pages/jjis.aspx.
12 For more information on Oklahoma’s JOLTS, visit www.ok.gov/oja/.
13 For more information on Florida’s data collection and reporting, visit the Florida Department of Juvenile Justice at website www.djj.state.fl.us/research.
14 Annie Balck, Advances in Juvenile Justice Reform: 2009 –2011 (Washington, DC: The National Juvenile Justice Network, 2012), available at www.njjn.org/uploads/advances-2009/NJJN-Advances-in-Juvenile-Justice-Reform_2009-2011.pdf.
15 Gordon Bazemore, Measuring What Really Matters in Juvenile Justice (Alexandria, VA: American Prosecutors Research Institute, July 2006), available at www.ndaa.org/pdf/measuring_what_really_matters_06.pdf.
16 For more information on how Indiana uses youth outcome data, visit the Indiana Department of Corrections Division of Youth Services website at www.in.gov/idoc/dys/.
17 See Washington State Institute for Public Policy, Washington State Juvenile Court Funding: Applying Research in a Public Policy Setting (Olympia, WA: Washington State Institute for Public Policy, 2010), available at www.wsipp.wa.gov/ReportFile/1077/Wsipp_Washington-State-Juvenile-Court-Funding-Applying-Research-in-a-Public-Policy-Setting_Full-Report.pdf.

15
A C K N O W L E D G M E N T SThe authors of this report—Senior Policy Analyst Nastassia Walsh and Juvenile Justice Program Director Josh Weber—would like to thank Ben Adams of The Pew Charitable Trusts’ Public Safety Performance Project for his assistance in constructing the survey questions as well as Ned Loughran, Darlene Conroy, Alexis Kalevich, and Brendan Donahue of the Council of Juvenile Correctional Administrators for their support with administering the survey and providing technical assistance to respondents. Special thanks to Kellie Dressler at the Office of Juvenile Justice and Delinquency Prevention, Office of Justice Programs and Laurie Garduque and Soledad McGrath at the MacArthur Foundation for their review and support of the document. The authors also thank the many in-house experts at the CSG Justice Center who offered critical perspectives that made the publication a stronger and more useful document for the juvenile justice field, including Michael Thompson, David D’Amora, Karen Watts, Dr. Tony Fabelo, Nancy Arrigona, and Jessica Gonzales.
This project was supported by Grant No. 2012-CZ-BX-K071 awarded by the Bureau of Justice Assistance. The Bureau of Justice Assistance is a component of the Office of Justice Programs, which also includes the Bureau of Justice Statistics, the National Institute of Justice, the Office of Juvenile Justice and Delinquency Prevention, the Office for Victims of Crime, the Community Capacity Development Office, and the Office of Sex Offender Sentencing,
Monitoring, Apprehending, Registering, and Tracking. Points of view or opinions in this document are those of the author and do not necessarily represent the official position or policies of the U.S. Department of Justice.
The Council of State Governments Justice Center prepared this paper in partnership with the John D. and Catherine T. MacArthur Foundation (MacArthur Foundation) and the U.S. Department of Justice’s Office of Juvenile
Justice and Delinquency Prevention. The opinions and findings herein are those of the authors and do not necessarily represent the official position or policies of the MacArthur Foundation or the Office of
Juvenile Justice and Delinquency Prevention.
Suggested citation: Council of State Governments Justice Center, Measuring and Using Juvenile Recidivism Data to Inform Policy, Practice, and Resource Allocation (New York: Council of State Governments Justice Center, 2014).
ME A SUR ING A ND US ING JU V ENILE REC ID I V ISM DATA TO INFORM POL ICY, PR ACT ICE , A ND RESOURCE A LLOCAT ION
Bureau of Justice AssistanceU.S. Department of Justice

The Council of State Governments (CSG) Justice Center is a national nonprofit organization that serves policymakers at the local, state, and federal levels from all branches of government. It provides practical, nonpartisan advice and consensus-driven strategies—informed by available
evidence—to increase public safety and strengthen communities. For more about the CSG Justice Center, see www.csgjusticecenter.org.
The Bureau of Justice Assistance (BJA), Office of Justice Programs, U.S. Department of Justice, supports law enforcement, courts, corrections, treatment, victim services, technology, and prevention initiatives that strengthen the nation’s criminal justice system. BJA
provides leadership, services, and funding to America’s communities by emphasizing local control; building relationships in the field; developing collaborations and partnerships; promoting capacity building through planning; streamlining the administration of grants; increasing training and technical assistance; creating accountability of projects; encouraging innovation; and ultimately communicating the value of justice
efforts to decision makers at every level. Visit www.bja.gov for more information.
About the John D. and Catherine T. MacArthur Foundation: The MacArthur Foundation is one of the nation’s largest independent foundations. Through the support it provides, the MacArthur Foundation fosters the development of knowledge, nurtures individual creativity, strengthens institutions, helps improve public policy, and provides information to the public, primarily through support
for public interest media. The MacArthur Foundation works to defend human rights, advance global conservation and security, make cities better places, and understand how technology is affecting children and society.
Additional information is available at www.macfound.org/ or www.modelsforchange.net.
The Office of Juvenile Justice and Delinquency Prevention (OJJDP), Office of Justice Programs, U.S. Department of Justice, supports states, local communities, and tribal jurisdictions in their efforts to develop and implement effective programs for juveniles. OJJDP
strives to strengthen the juvenile justice system’s efforts to protect public safety, hold offenders accountable, and provide services that address the needs of youth and their families. OJJDP sponsors research, program, and training initiatives; develops priorities and goals
and sets policies to guide federal juvenile justice issues; disseminates information about juvenile justice issues; and awards funds to states to support local programming. For more information, see www.ojjdp.gov/.
Established by the Second Chance Act, the National Reentry Resource Center (NRRC) provides education, training, and technical assistance to states, tribes, territories, local governments, community-based service providers, non-profit organizations, and corrections
institutions involved with prisoner reentry. The NRRC’s mission is to advance the reentry field by disseminating information to and from policymakers, practitioners, and researchers and by promoting evidence-based principles and best practices. The NRRC is administered by the U.S. Department of Justice’s Bureau of Justice Assistance and is a project of the Council of State Governments Justice Center, in
cooperation with the Urban Institute, the National Association of Counties, the Association of State Correctional Administrators, the American Probation and Parole Association, and other key partner organizations. To learn more about the
National Reentry Resource Center, please visit www.csgjusticecenter.org/nrrc.
Bureau of Justice AssistanceU.S. Department of Justice