july 2012 k-12 c omputer s cience e ducation : unlocking the future of students july 2012
TRANSCRIPT
July 2012
K-12 COMPUTER SCIENCE EDUCATION:
Unlocking the Future of Students
July 2012

July 2012
OVERVIEW
July 2012
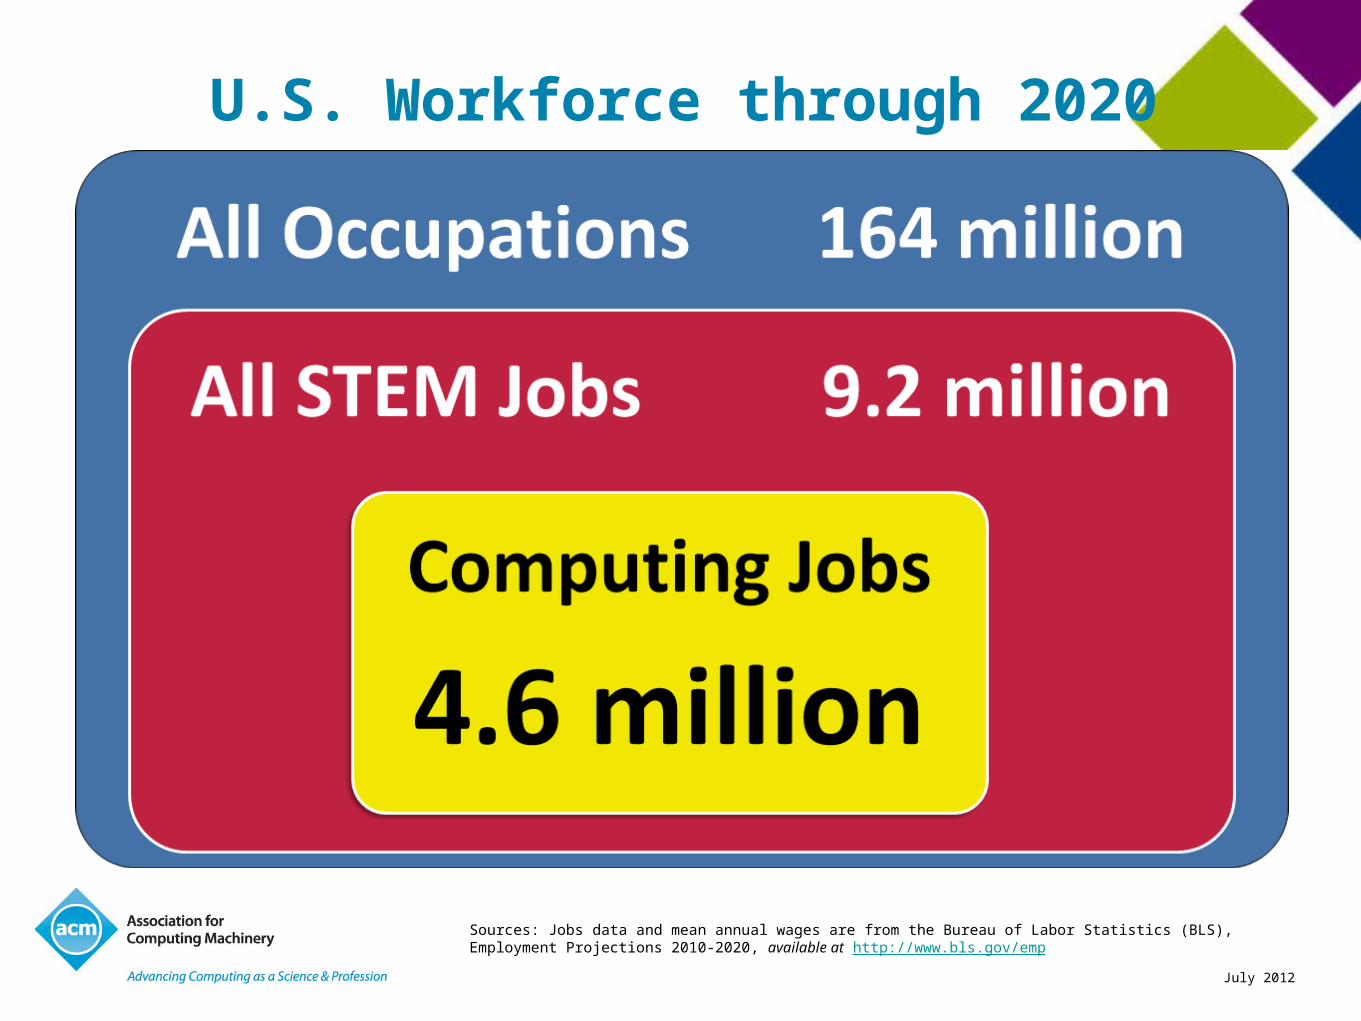
U.S. Workforce through 2020
Sources: Jobs data and mean annual wages are from the Bureau of Labor Statistics (BLS), Employment Projections 2010-2020, available at http://www.bls.gov/emp
July 2012
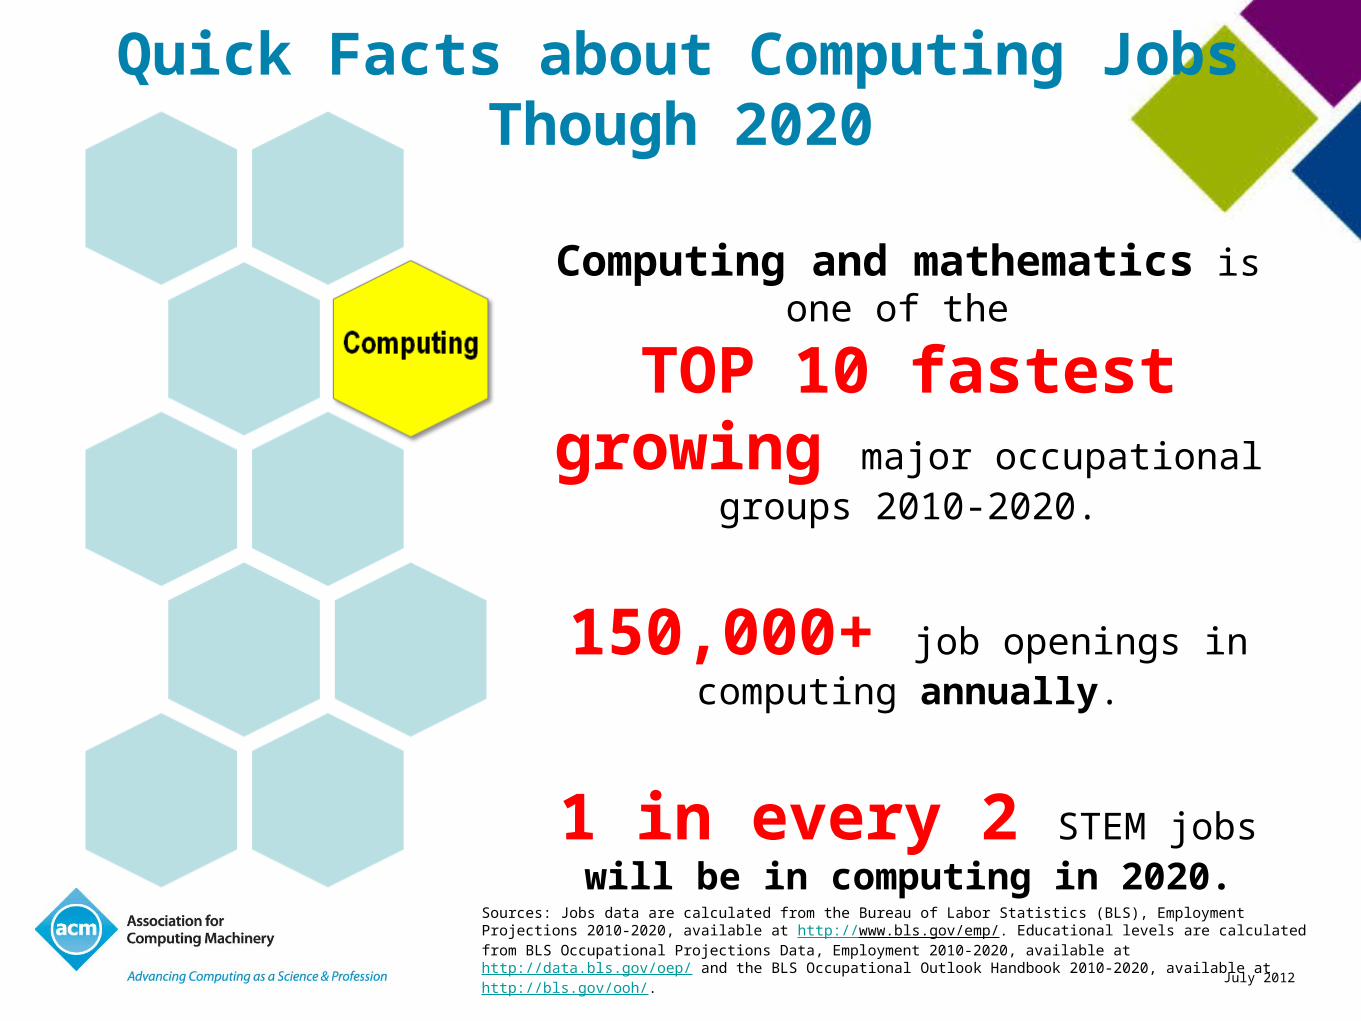
Computing and mathematics is one of the
TOP 10 fastest growing major occupational groups 2010-2020.
150,000+ job openings in computing annually.
1 in every 2 STEM jobs will be in computing in 2020.
Quick Facts about Computing Jobs Though 2020
Sources: Jobs data are calculated from the Bureau of Labor Statistics (BLS), Employment Projections 2010-2020, available at http://www.bls.gov/emp/. Educational levels are calculated from BLS Occupational Projections Data, Employment 2010-2020, available at http://data.bls.gov/oep/ and the BLS Occupational Outlook Handbook 2010-2020, available at http://bls.gov/ooh/.

July 2012
THE BRIGHT FUTURE FOR COMPUTING JOBS
July 2012
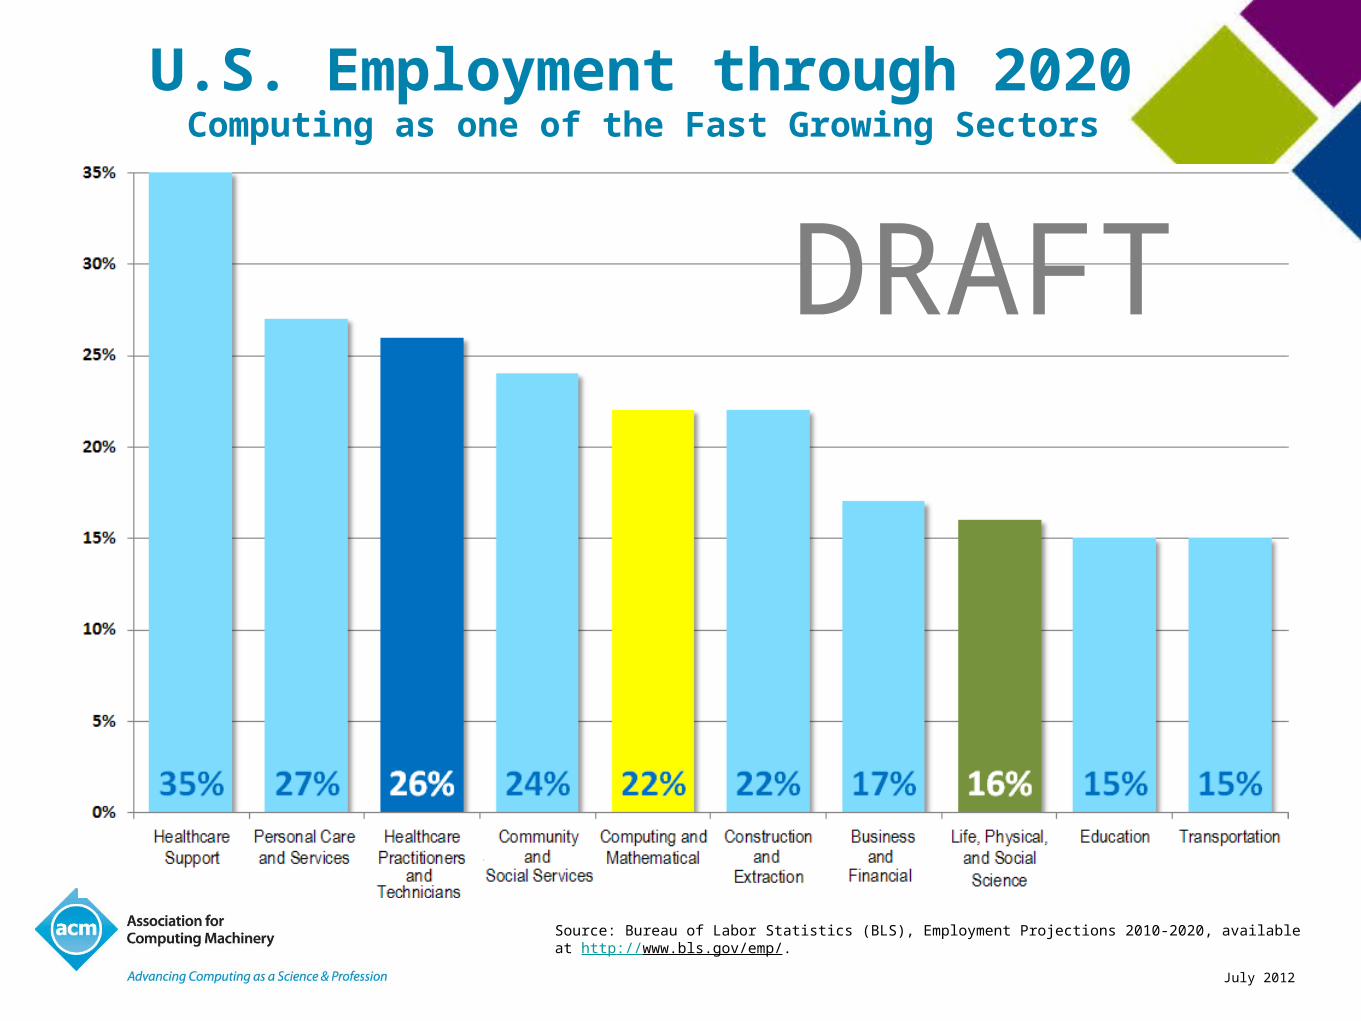
U.S. Employment through 2020Computing as one of the Fast Growing Sectors
Source: Bureau of Labor Statistics (BLS), Employment Projections 2010-2020, available at http://www.bls.gov/emp/.
DRAFT
July 2012
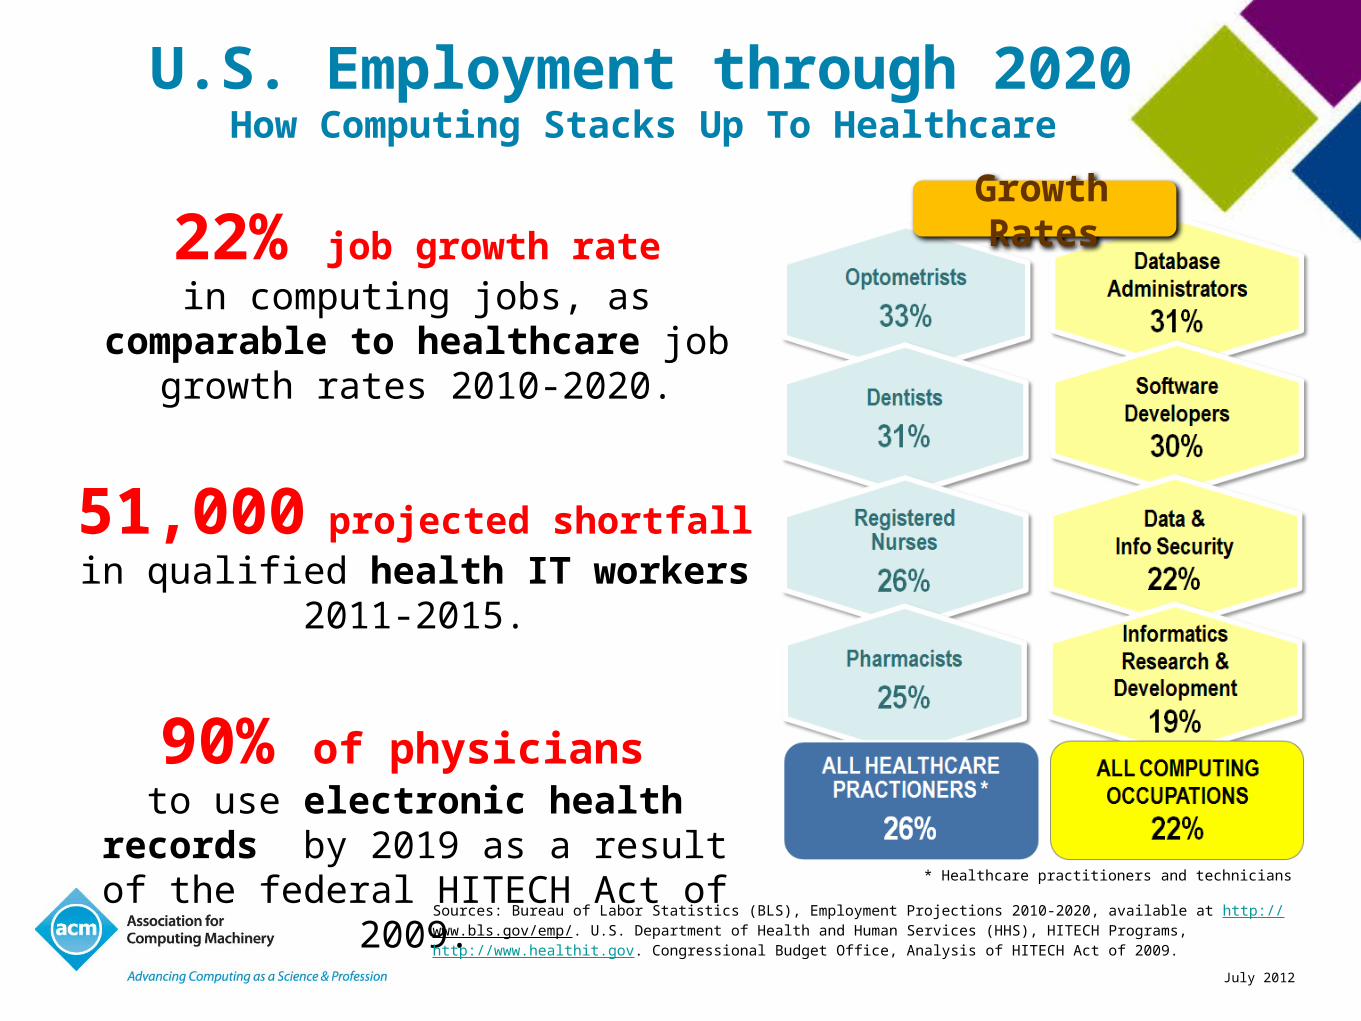
U.S. Employment through 2020How Computing Stacks Up To Healthcare
22% job growth ratein computing jobs, as comparable to
healthcare job growth rates 2010-2020.
51,000 projected shortfall in qualified health IT workers 2011-2015.
90% of physicians to use electronic health records by 2019 as a result of the federal HITECH Act of 2009.
* Healthcare practitioners and technicians
Sources: Bureau of Labor Statistics (BLS), Employment Projections 2010-2020, available at http://www.bls.gov/emp/. U.S. Department of Health and Human Services (HHS), HITECH Programs, http://www.healthit.gov. Congressional Budget Office, Analysis of HITECH Act of 2009.
Growth Rates
July 2012
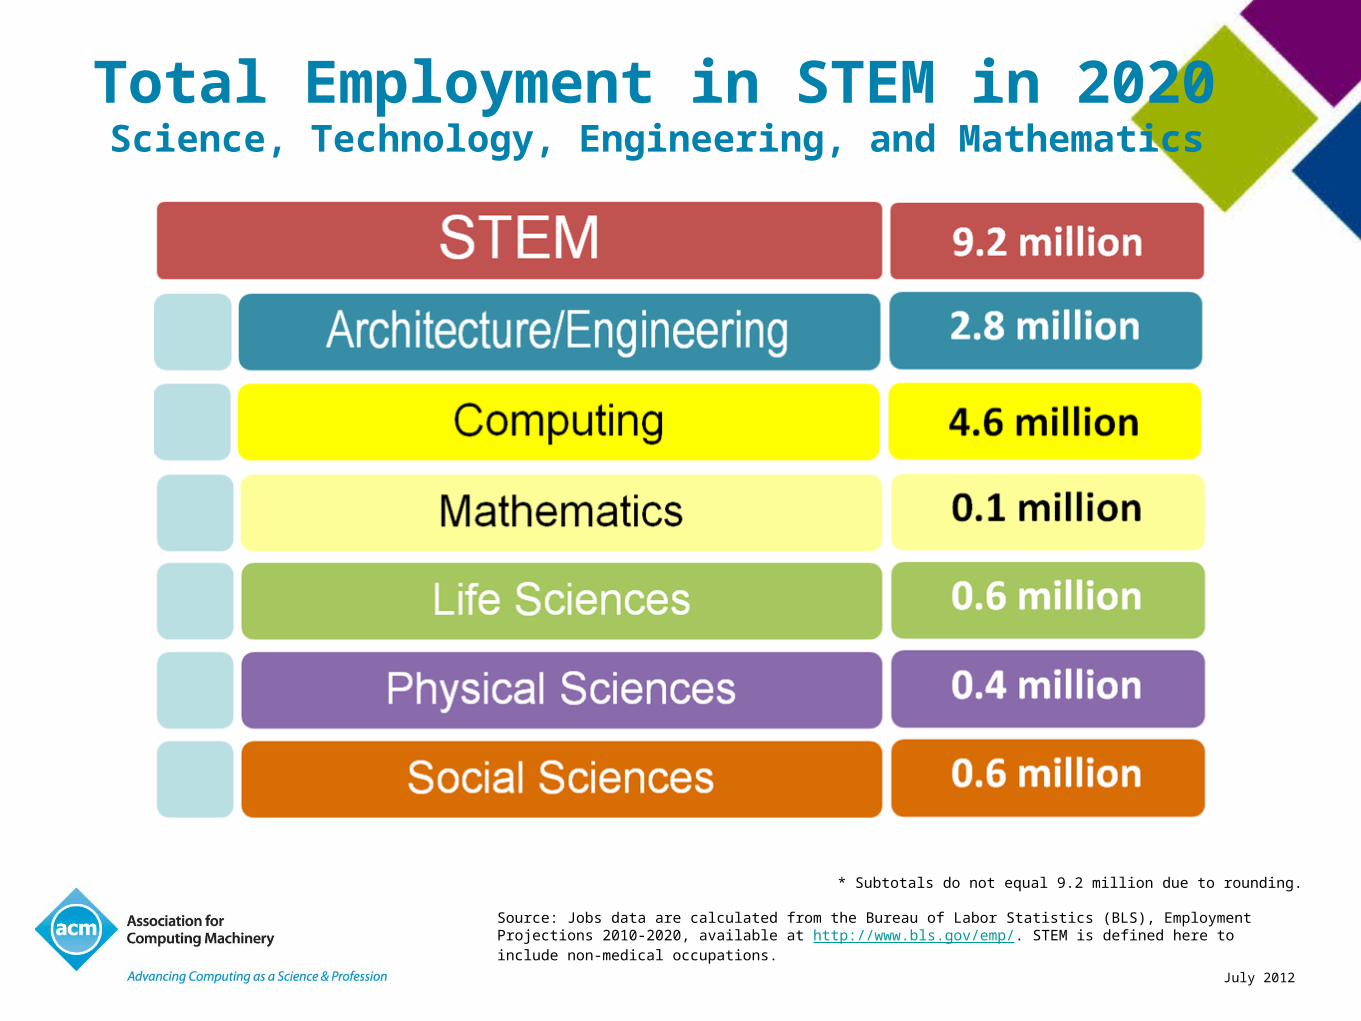
Total Employment in STEM in 2020Science, Technology, Engineering, and Mathematics
* Subtotals do not equal 9.2 million due to rounding.
Source: Jobs data are calculated from the Bureau of Labor Statistics (BLS), Employment Projections 2010-2020, available at http://www.bls.gov/emp/. STEM is defined here to include non-medical occupations.
July 2012
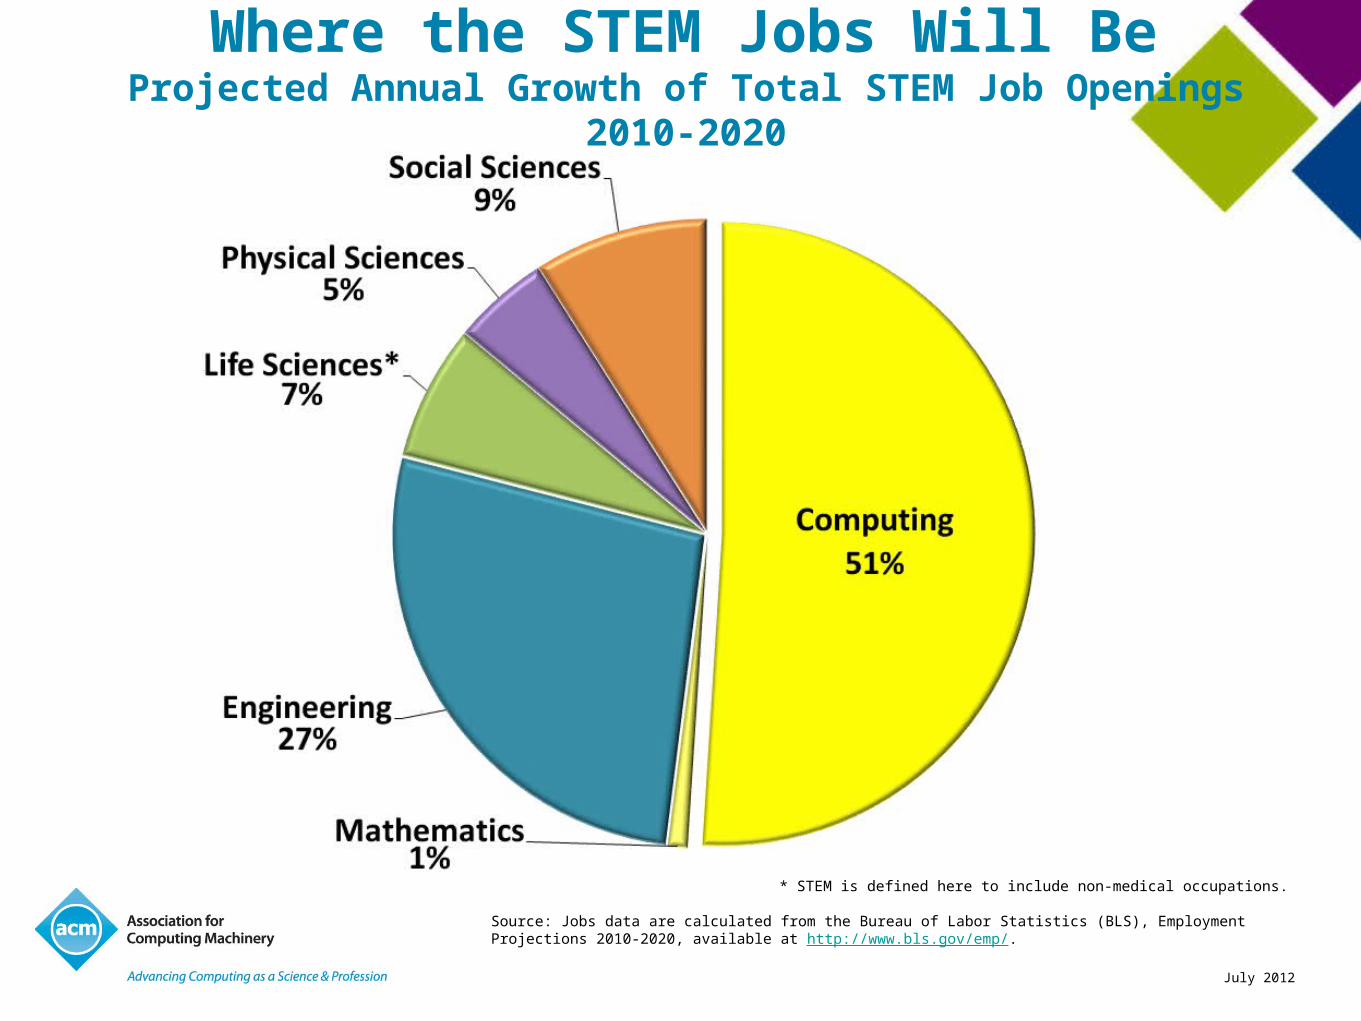
Where the STEM Jobs Will BeProjected Annual Growth of Total STEM Job Openings 2010-2020
* STEM is defined here to include non-medical occupations.
Source: Jobs data are calculated from the Bureau of Labor Statistics (BLS), Employment Projections 2010-2020, available at http://www.bls.gov/emp/.
July 2012
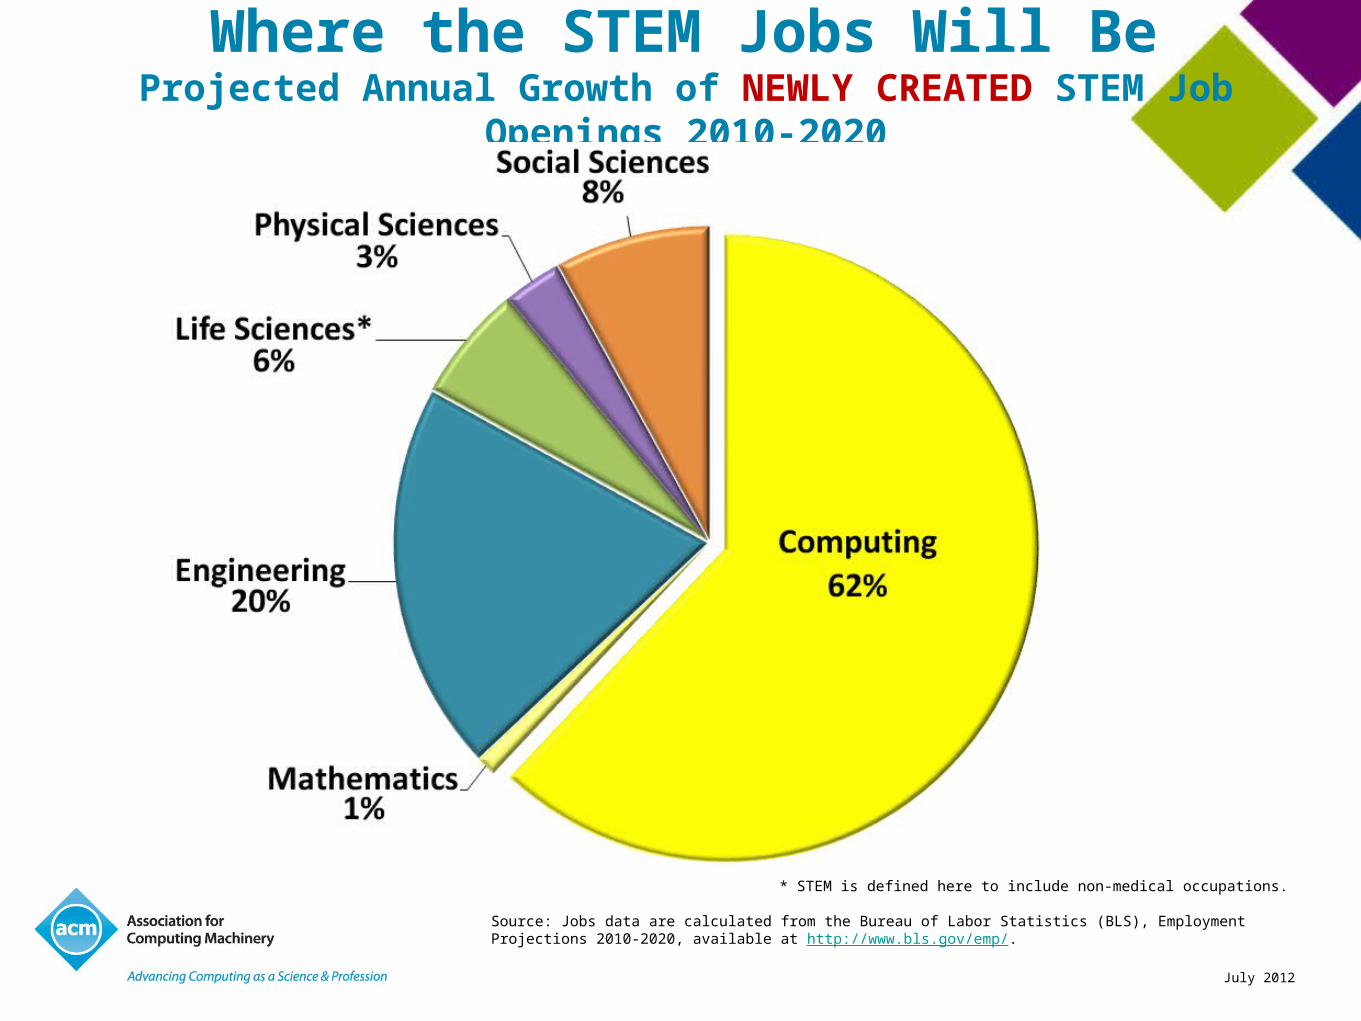
Where the STEM Jobs Will BeProjected Annual Growth of NEWLY CREATED STEM Job Openings 2010-2020
* STEM is defined here to include non-medical occupations.
Source: Jobs data are calculated from the Bureau of Labor Statistics (BLS), Employment Projections 2010-2020, available at http://www.bls.gov/emp/.

July 2012
Where the STEM Jobs Will BeDegrees vs. Jobs Annually
Sources: Degree data are calculated from the National Science Foundation (NSF), Science and Engineering Indicators 2012, available at http://www.nsf.gov/statistics/seind12/appendix.htm. Annual jobs data are calculated from the Bureau of Labor Statistics (BLS), Employment Projections 2010-2020, available at http://www.bls.gov/emp/. STEM is defined here to include non-medical degrees and occupations.
July 2012
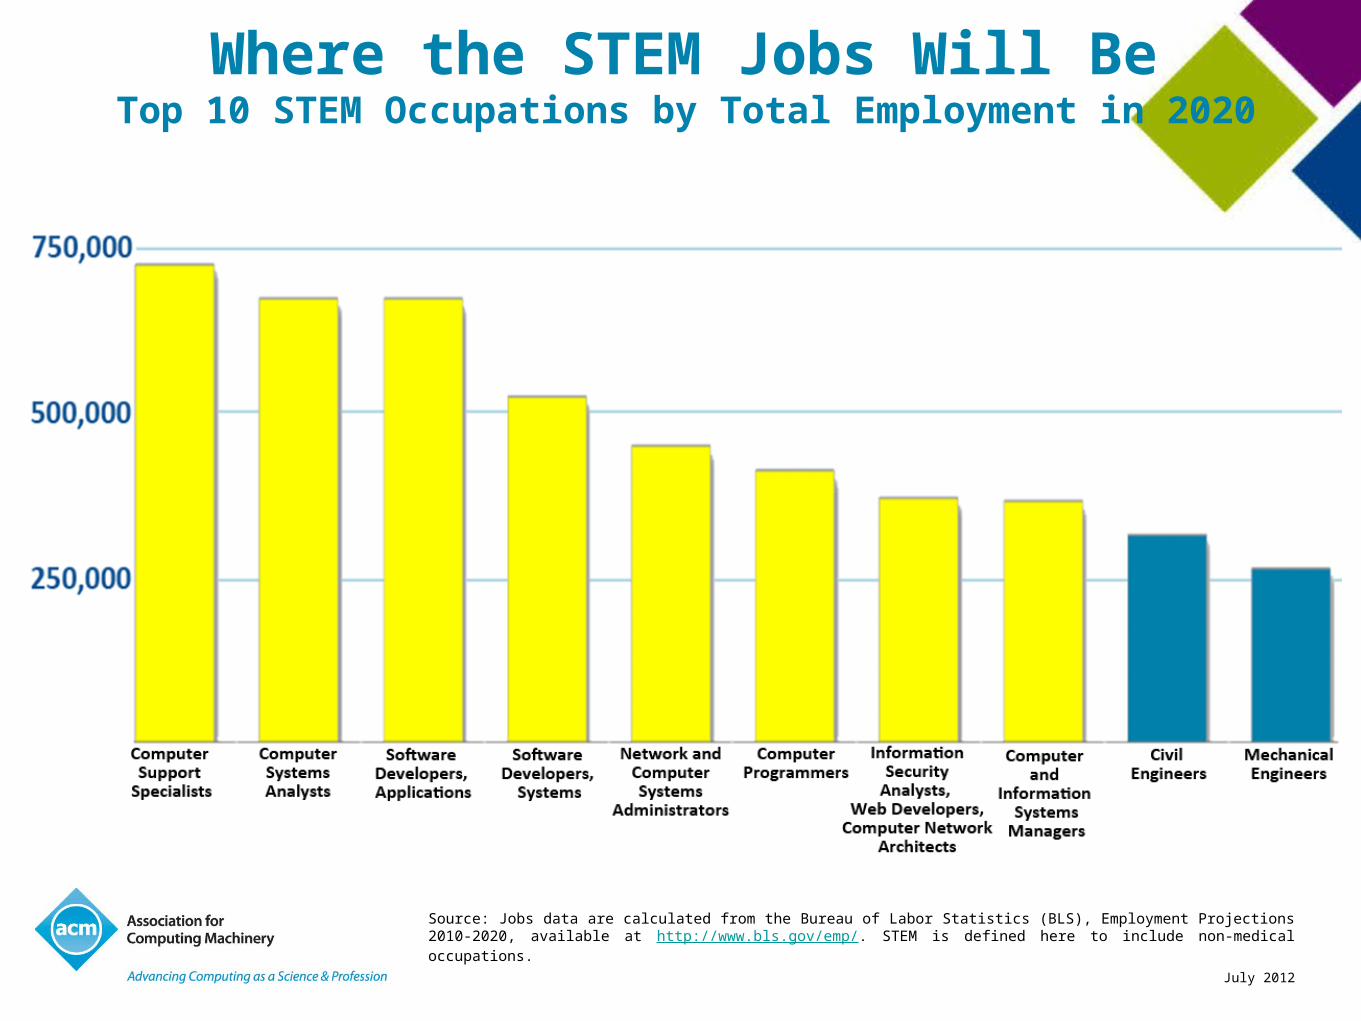
Where the STEM Jobs Will BeTop 10 STEM Occupations by Total Employment in 2020
Source: Jobs data are calculated from the Bureau of Labor Statistics (BLS), Employment Projections 2010-2020, available at http://www.bls.gov/emp/. STEM is defined here to include non-medical occupations.
July 2012
EARNINGS POTENTIAL IN COMPUTING
July 2012
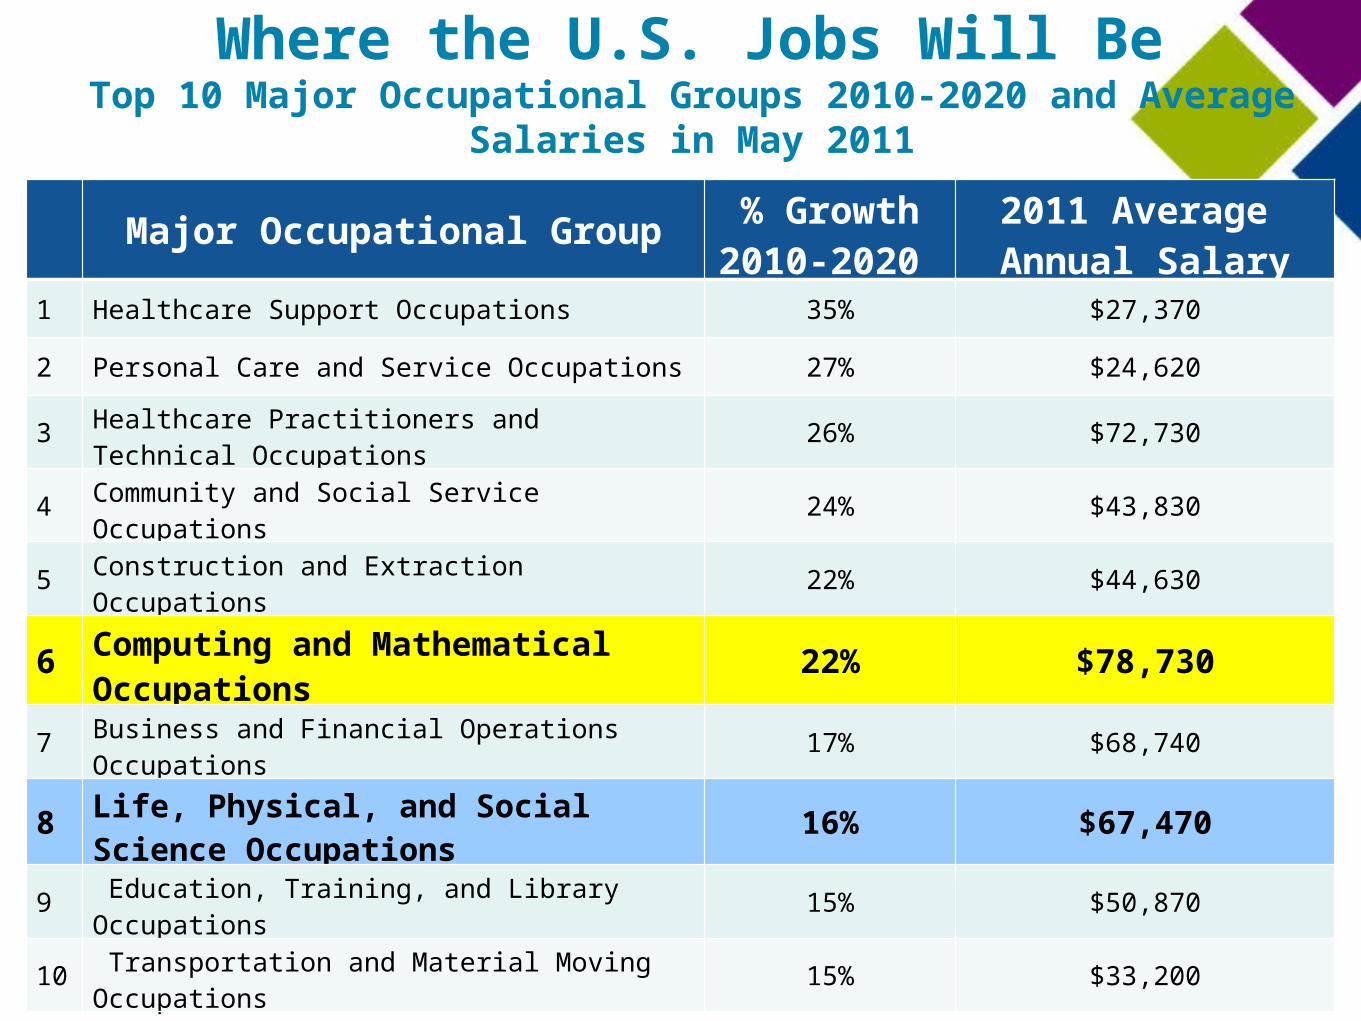
Where the U.S. Jobs Will BeTop 10 Major Occupational Groups 2010-2020 and Average Salaries in May 2011
Sources: Jobs data are from the Bureau of Labor Statistics (BLS), Employment Projections 2010-2020, available at http://www.bls.gov/emp/. Salary data are from BLS Occupational Employment Statistics, May 2011, available at http://www.bls.gov/oes/current/oes_nat.htm.
Major Occupational Group% Growth2010-2020
2011 Average Annual Salary
1 Healthcare Support Occupations 35% $27,370
2 Personal Care and Service Occupations 27% $24,620
3 Healthcare Practitioners and Technical Occupations 26% $72,730
4 Community and Social Service Occupations 24% $43,830
5 Construction and Extraction Occupations 22% $44,630
6 Computing and Mathematical Occupations 22% $78,730
7 Business and Financial Operations Occupations 17% $68,740
8 Life, Physical, and Social Science Occupations 16% $67,470
9 Education, Training, and Library Occupations 15% $50,870
10 Transportation and Material Moving Occupations 15% $33,200
July 2012
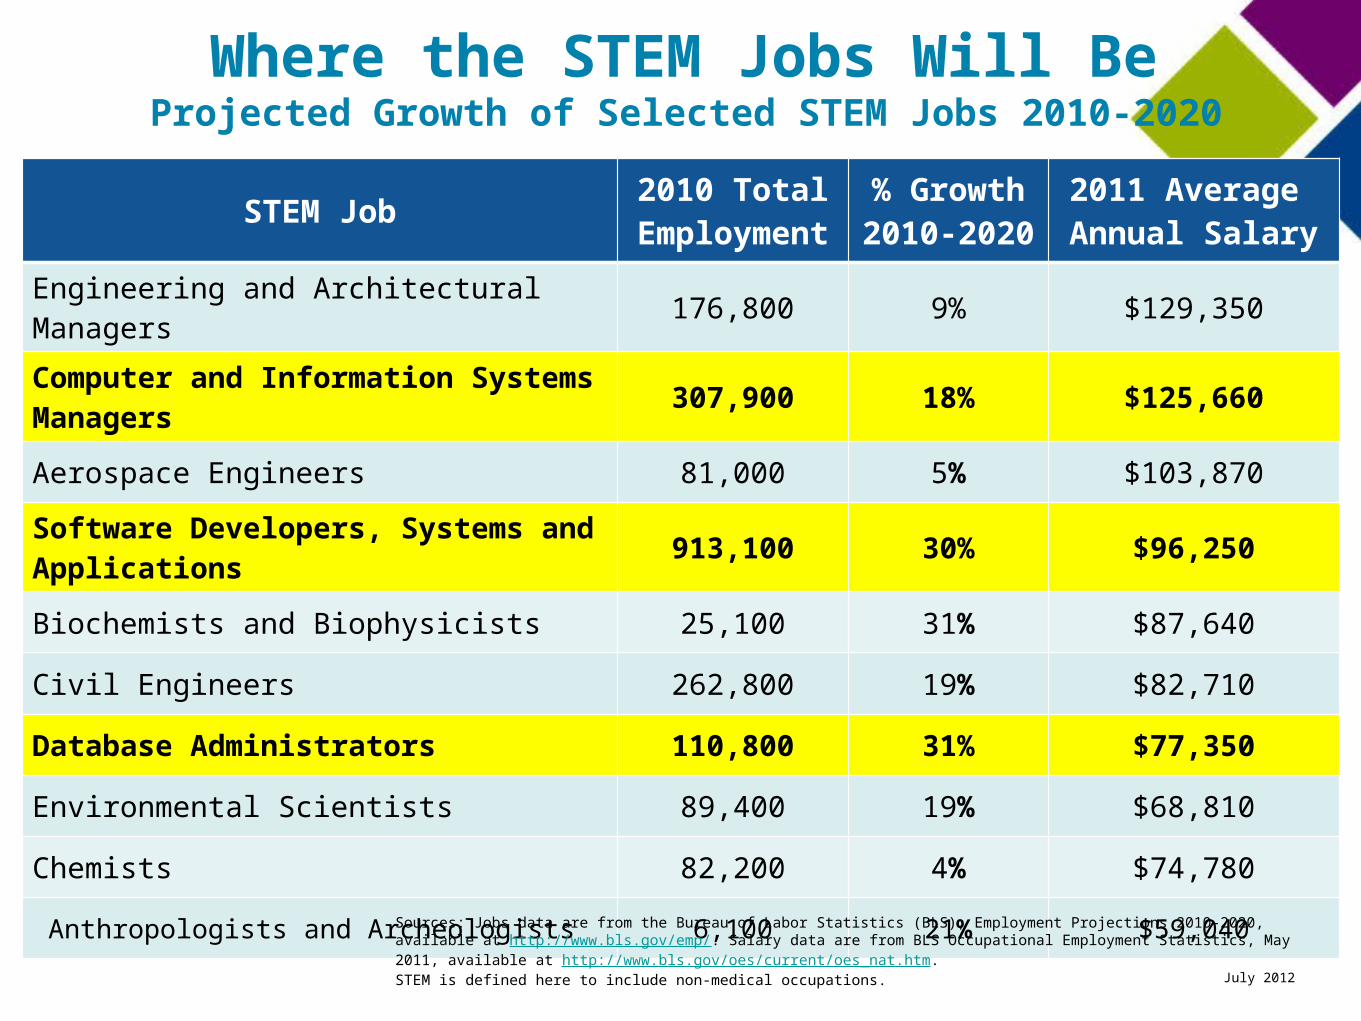
Where the STEM Jobs Will BeProjected Growth of Selected STEM Jobs 2010-2020
STEM Job2010 Total Employmen
t
% Growth2010-2020
2011 Average Annual Salary
Engineering and Architectural Managers 176,800 9% $129,350
Computer and Information Systems Managers 307,900 18% $125,660
Aerospace Engineers 81,000 5% $103,870
Software Developers, Systems and Applications 913,100 30% $96,250
Biochemists and Biophysicists 25,100 31% $87,640
Civil Engineers 262,800 19% $82,710
Database Administrators 110,800 31% $77,350
Environmental Scientists 89,400 19% $68,810
Chemists 82,200 4% $74,780
Anthropologists and Archeologists 6,100 21% $59,040
Sources: Jobs data are from the Bureau of Labor Statistics (BLS), Employment Projections 2010-2020, available at http://www.bls.gov/emp/. Salary data are from BLS Occupational Employment Statistics, May 2011, available at http://www.bls.gov/oes/current/oes_nat.htm. STEM is defined here to include non-medical occupations.

July 2012
PIPELINE OF TALENT IN COMPUTING
July 2012
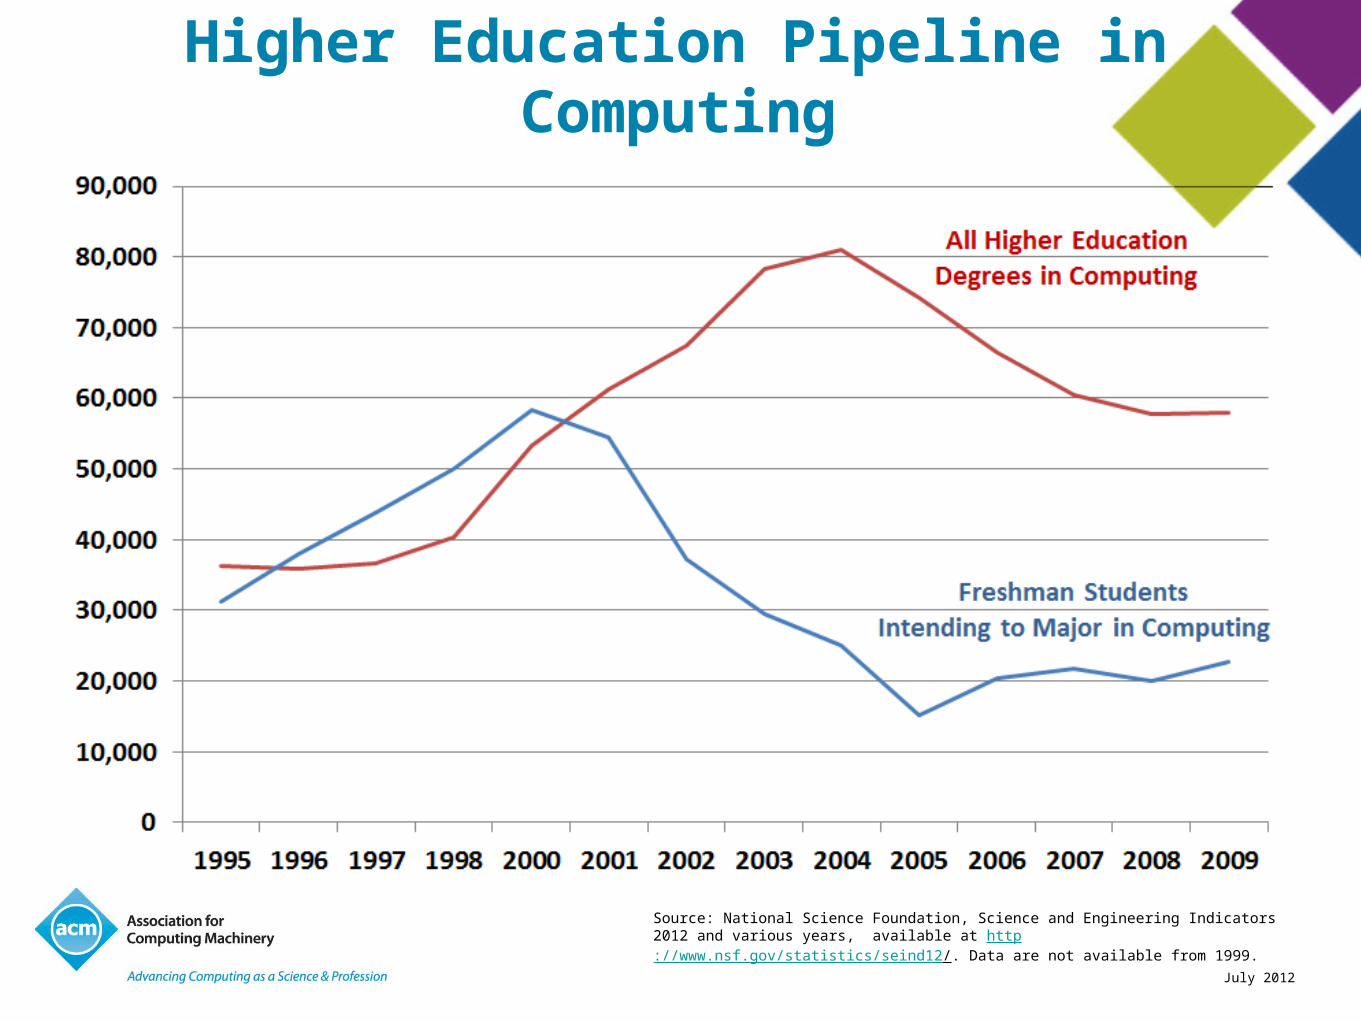
Source: National Science Foundation, Science and Engineering Indicators 2012 and various years, available at http://www.nsf.gov/statistics/seind12/. Data are not available from 1999.
Higher Education Pipeline in Computing
July 2012
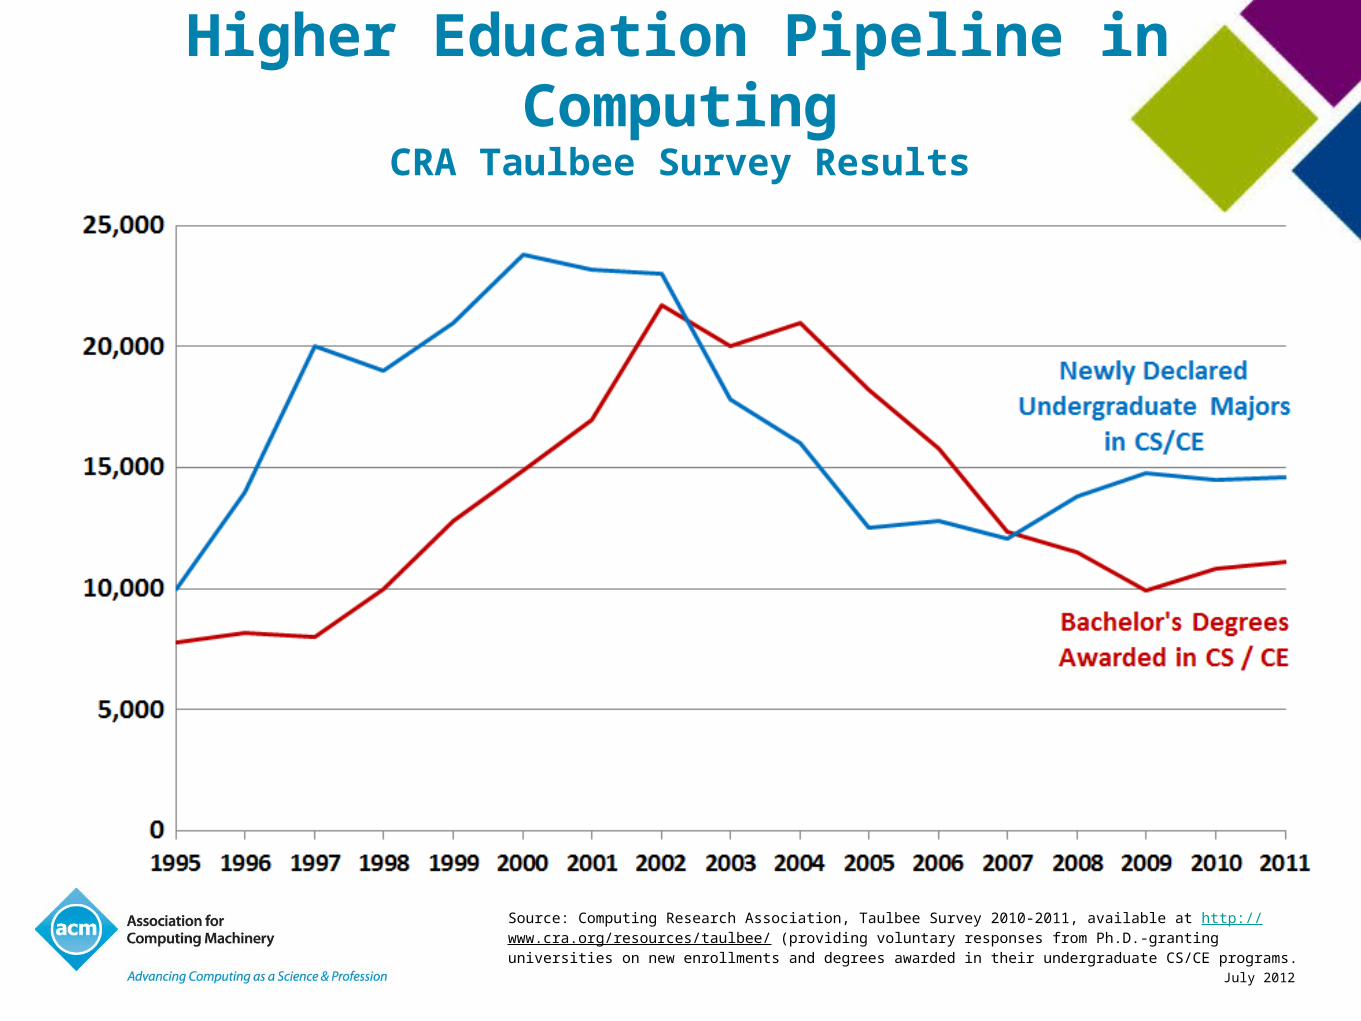
Higher Education Pipeline in ComputingCRA Taulbee Survey Results
Source: Computing Research Association, Taulbee Survey 2010-2011, available at http://www.cra.org/resources/taulbee/ (providing voluntary responses from Ph.D.-granting universities on new enrollments and degrees awarded in their undergraduate CS/CE programs.
July 2012
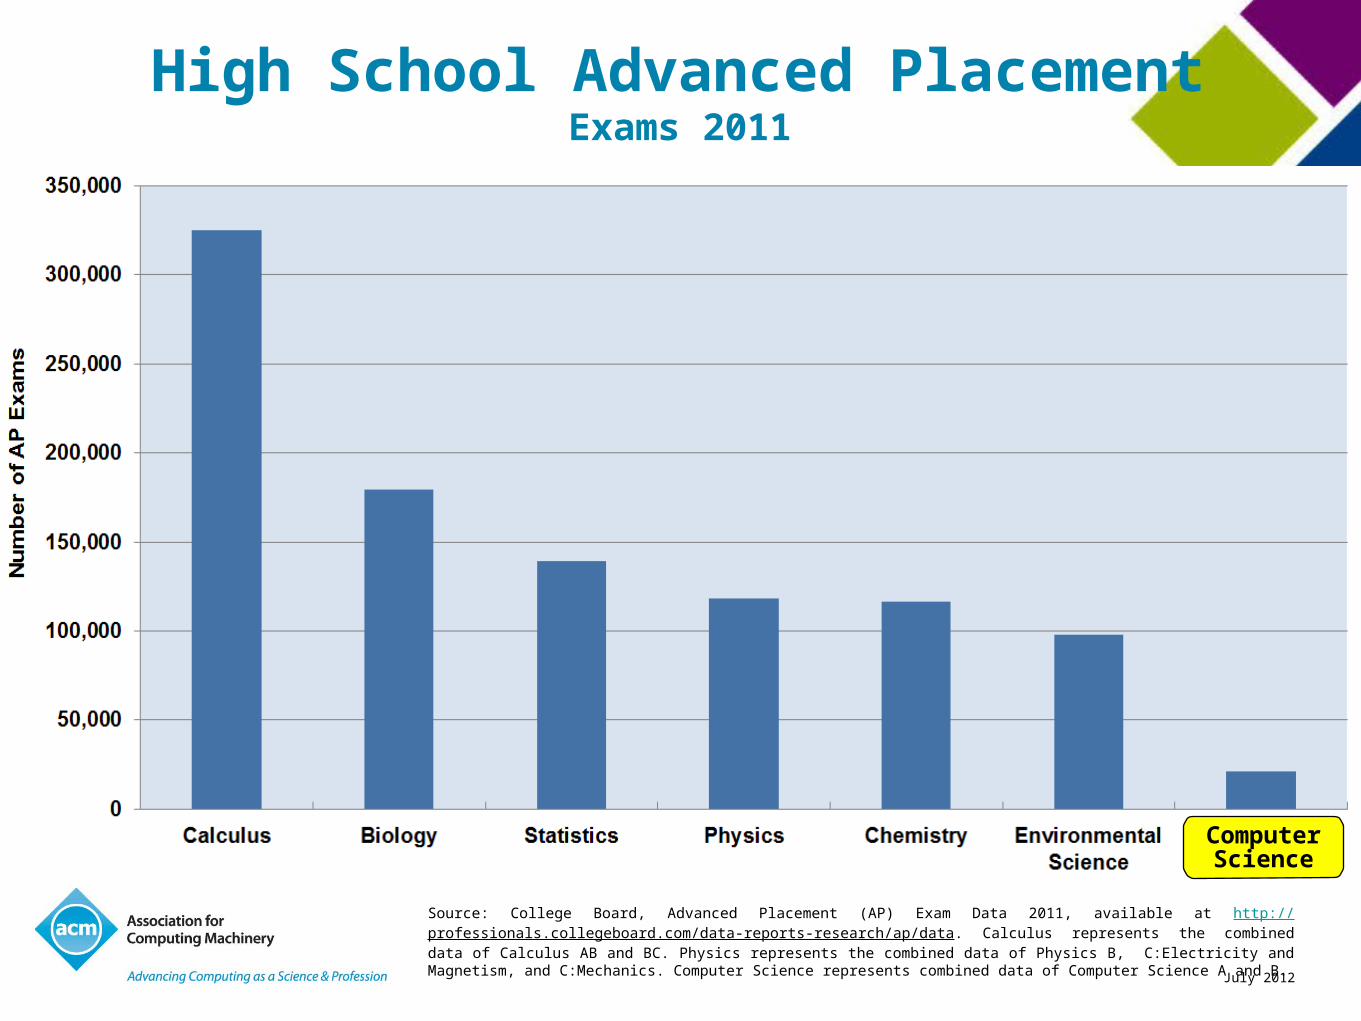
High School Advanced PlacementExams 2011
Computer Science
Source: College Board, Advanced Placement (AP) Exam Data 2011, available at http://professionals.collegeboard.com/data-reports-research/ap/data. Calculus represents the combined data of Calculus AB and BC. Physics represents the combined data of Physics B, C:Electricity and Magnetism, and C:Mechanics. Computer Science represents combined data of Computer Science A and B.
July 2012
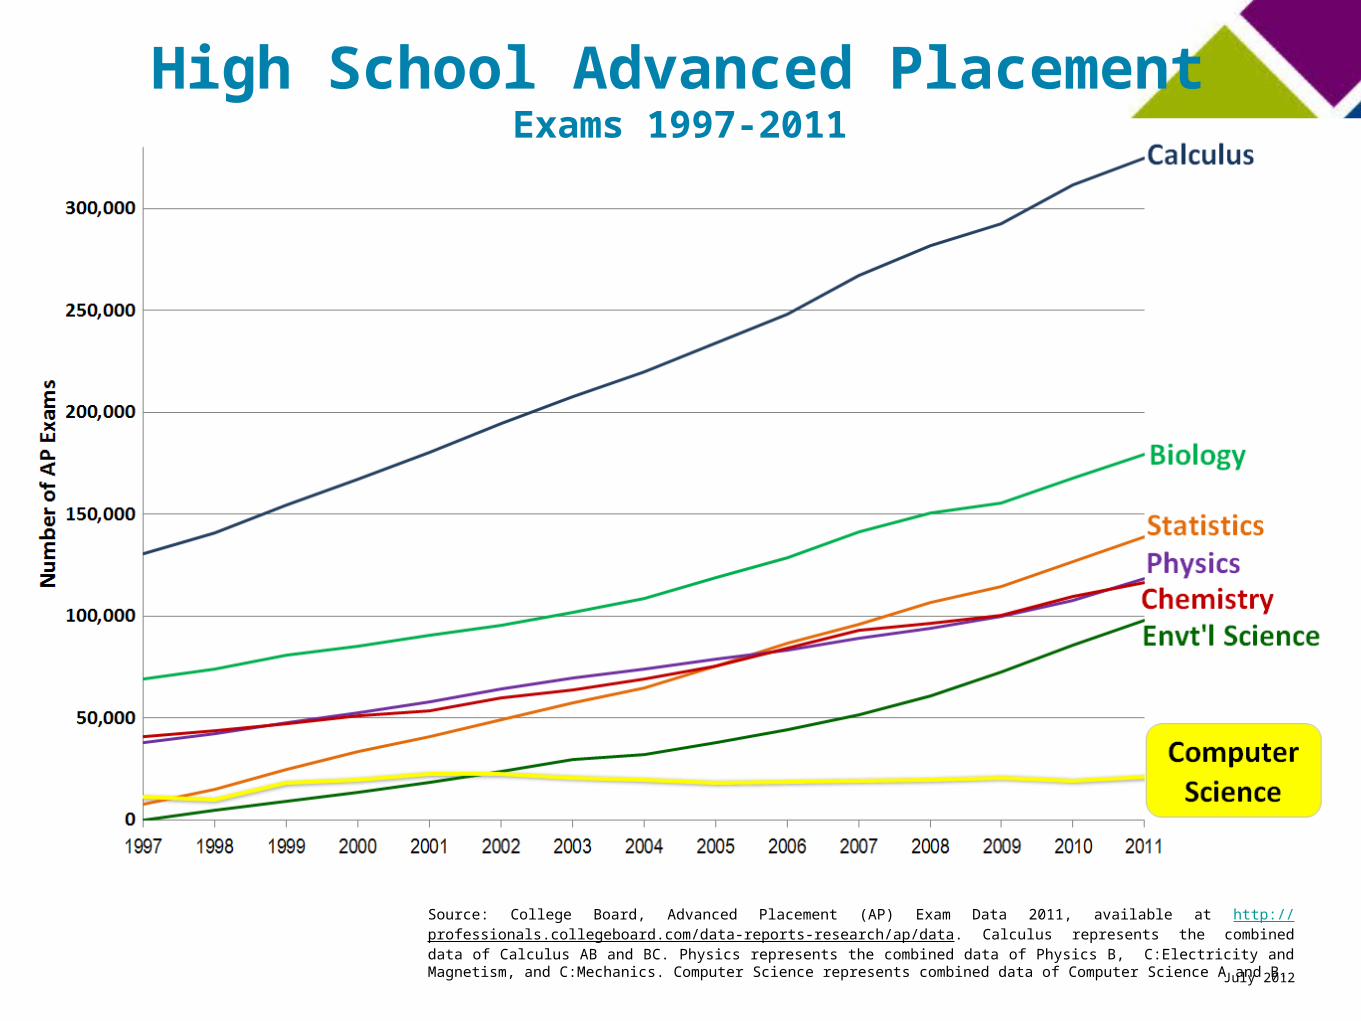
Source: College Board, Advanced Placement (AP) Exam Data 2011, available at http://professionals.collegeboard.com/data-reports-research/ap/data. Calculus represents the combined data of Calculus AB and BC. Physics represents the combined data of Physics B, C:Electricity and Magnetism, and C:Mechanics. Computer Science represents combined data of Computer Science A and B.
High School Advanced PlacementExams 1997-2011
July 2012
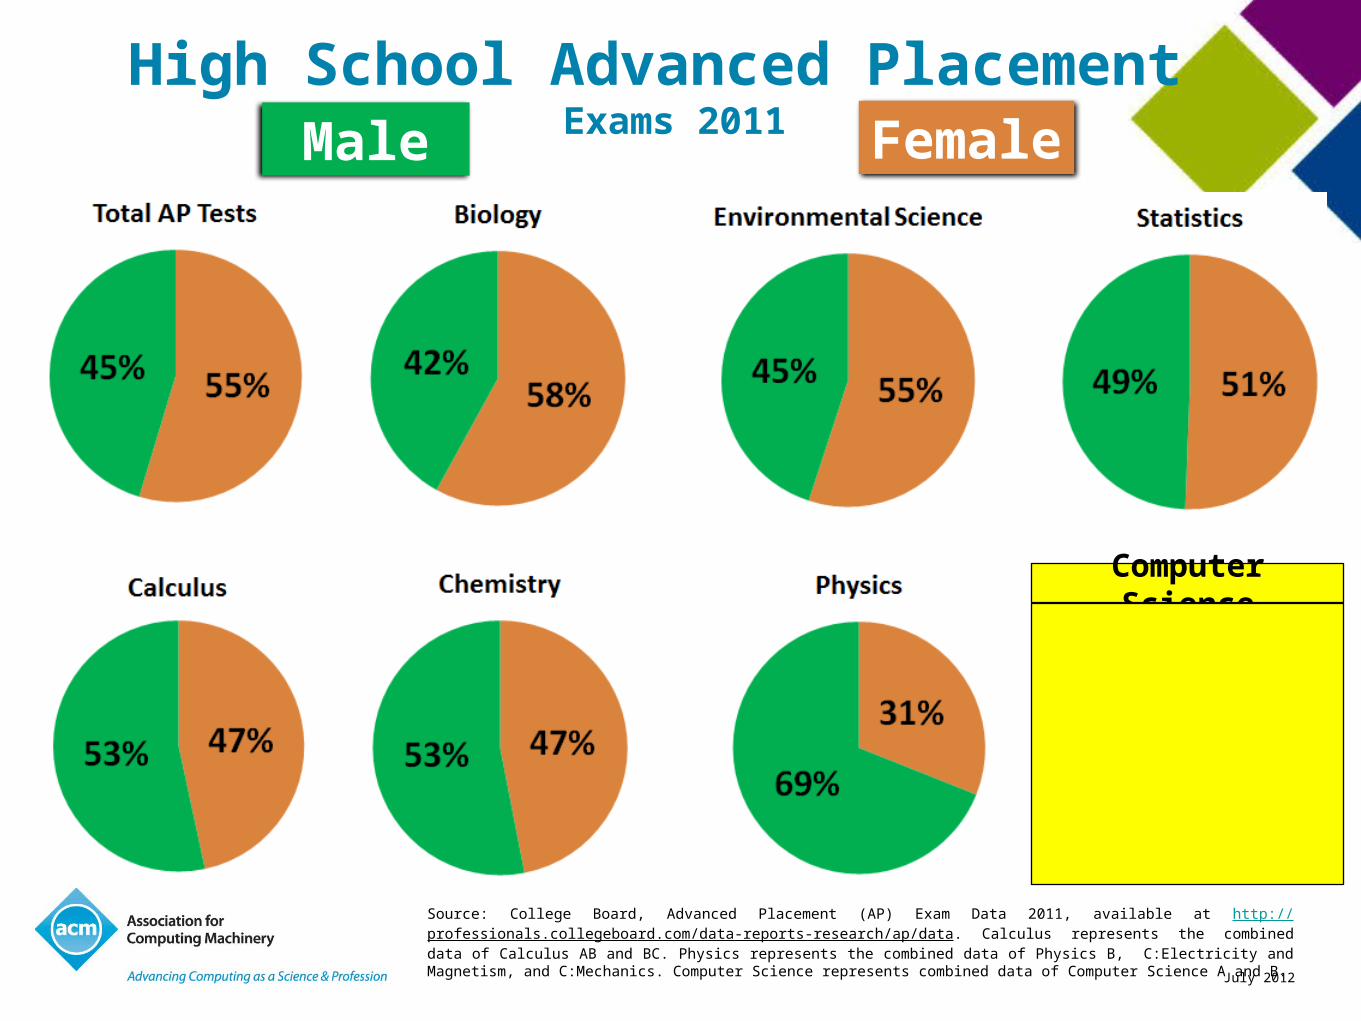
High School Advanced Placement Exams 2011
Source: College Board, Advanced Placement (AP) Exam Data 2011, available at http://professionals.collegeboard.com/data-reports-research/ap/data. Calculus represents the combined data of Calculus AB and BC. Physics represents the combined data of Physics B, C:Electricity and Magnetism, and C:Mechanics. Computer Science represents combined data of Computer Science A and B.
Male Female
Computer Science

July 2012
How Computer Science “Counts” In K-12
Source: ASSOCIATION FOR COMPUTING MACHINERY & COMPUTER SCIENCE TEACHERS ASSOCIATION, RUNNING ON EMPTY: THE FAILURE TO TEACH K-12 COMPUTER SCIENCE IN THE DIGITAL AGE (2010), at page 45, available at http://www.acm.org/Runningonempty.
835

July 2012
Findings: StandardsPercentage of Secondary School Computer Science Standards
Level II and Level III Adopted by State
Source: ASSOCIATION FOR COMPUTING MACHINERY & COMPUTER SCIENCE TEACHERS ASSOCIATION, RUNNING ON EMPTY: THE FAILURE TO TEACH K-12 COMPUTER SCIENCE IN THE DIGITAL AGE (2010), at page 8, available at http://www.acm.org/Runningonempty.
July 2012
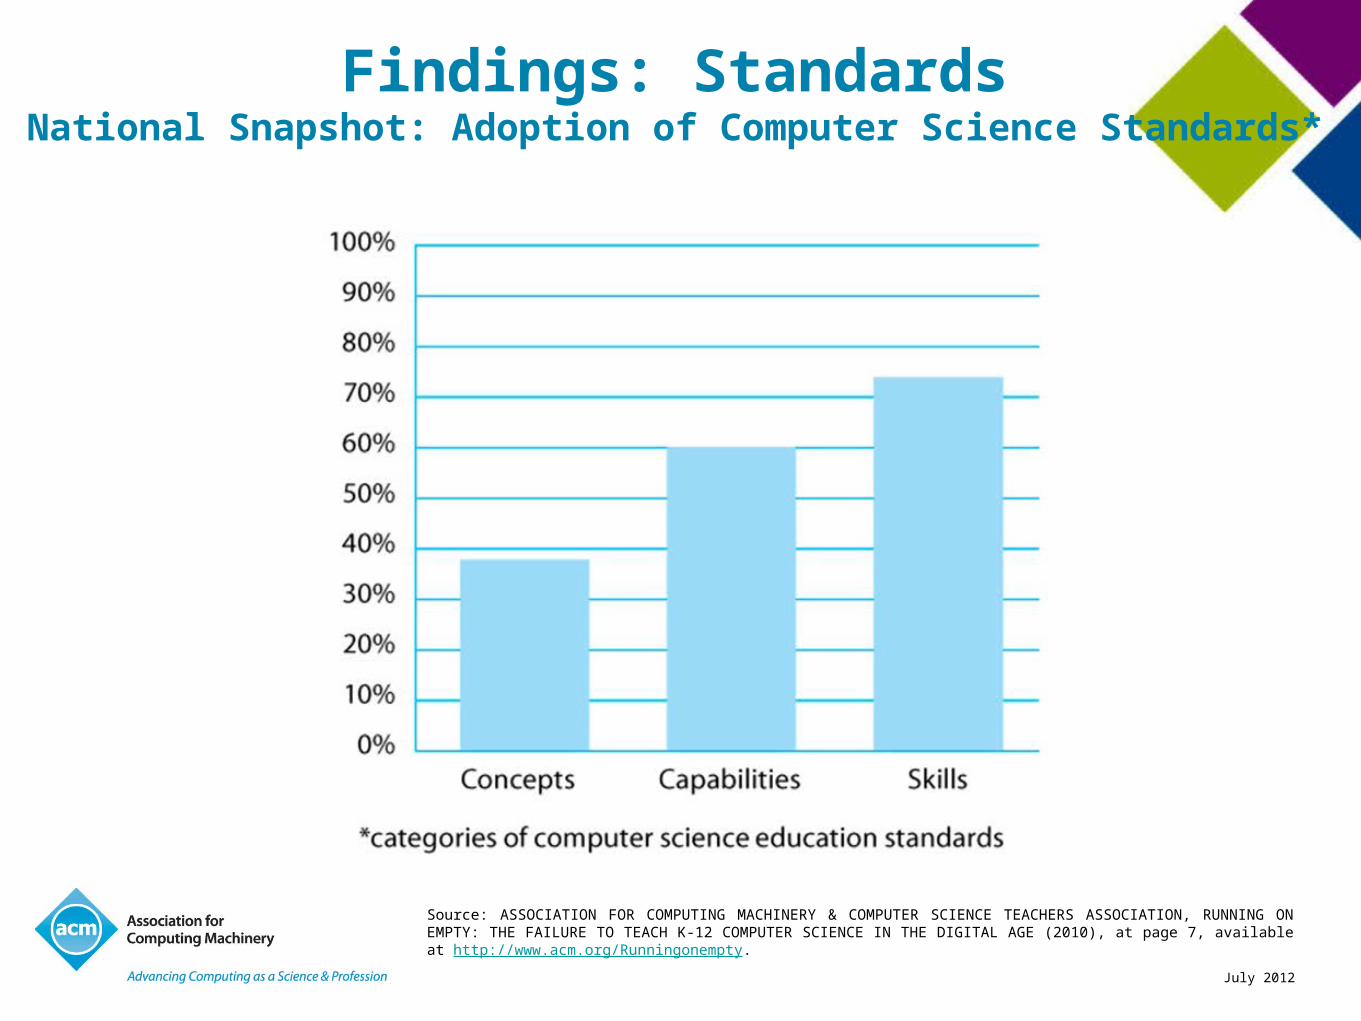
Source: ASSOCIATION FOR COMPUTING MACHINERY & COMPUTER SCIENCE TEACHERS ASSOCIATION, RUNNING ON EMPTY: THE FAILURE TO TEACH K-12 COMPUTER SCIENCE IN THE DIGITAL AGE (2010), at page 7, available at http://www.acm.org/Runningonempty.
Findings: StandardsNational Snapshot: Adoption of Computer Science Standards*
July 2012
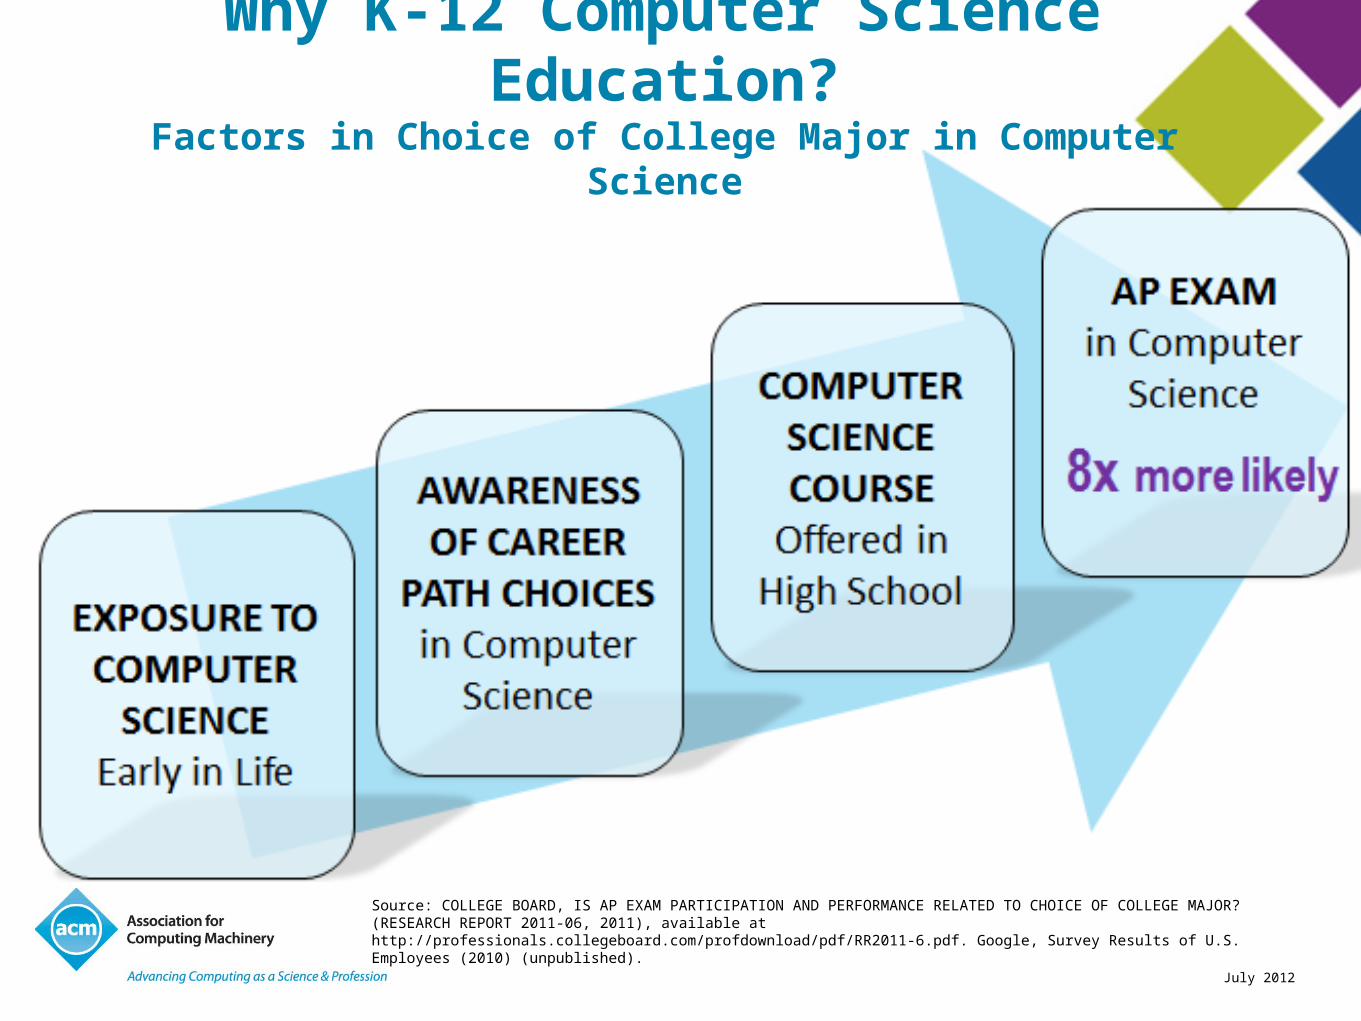
Source: COLLEGE BOARD, IS AP EXAM PARTICIPATION AND PERFORMANCE RELATED TO CHOICE OF COLLEGE MAJOR? (RESEARCH REPORT 2011-06, 2011), available at http://professionals.collegeboard.com/profdownload/pdf/RR2011-6.pdf. Google, Survey Results of U.S. Employees (2010) (unpublished).
Why K-12 Computer Science Education?Factors in Choice of College Major in Computer Science
July 2012
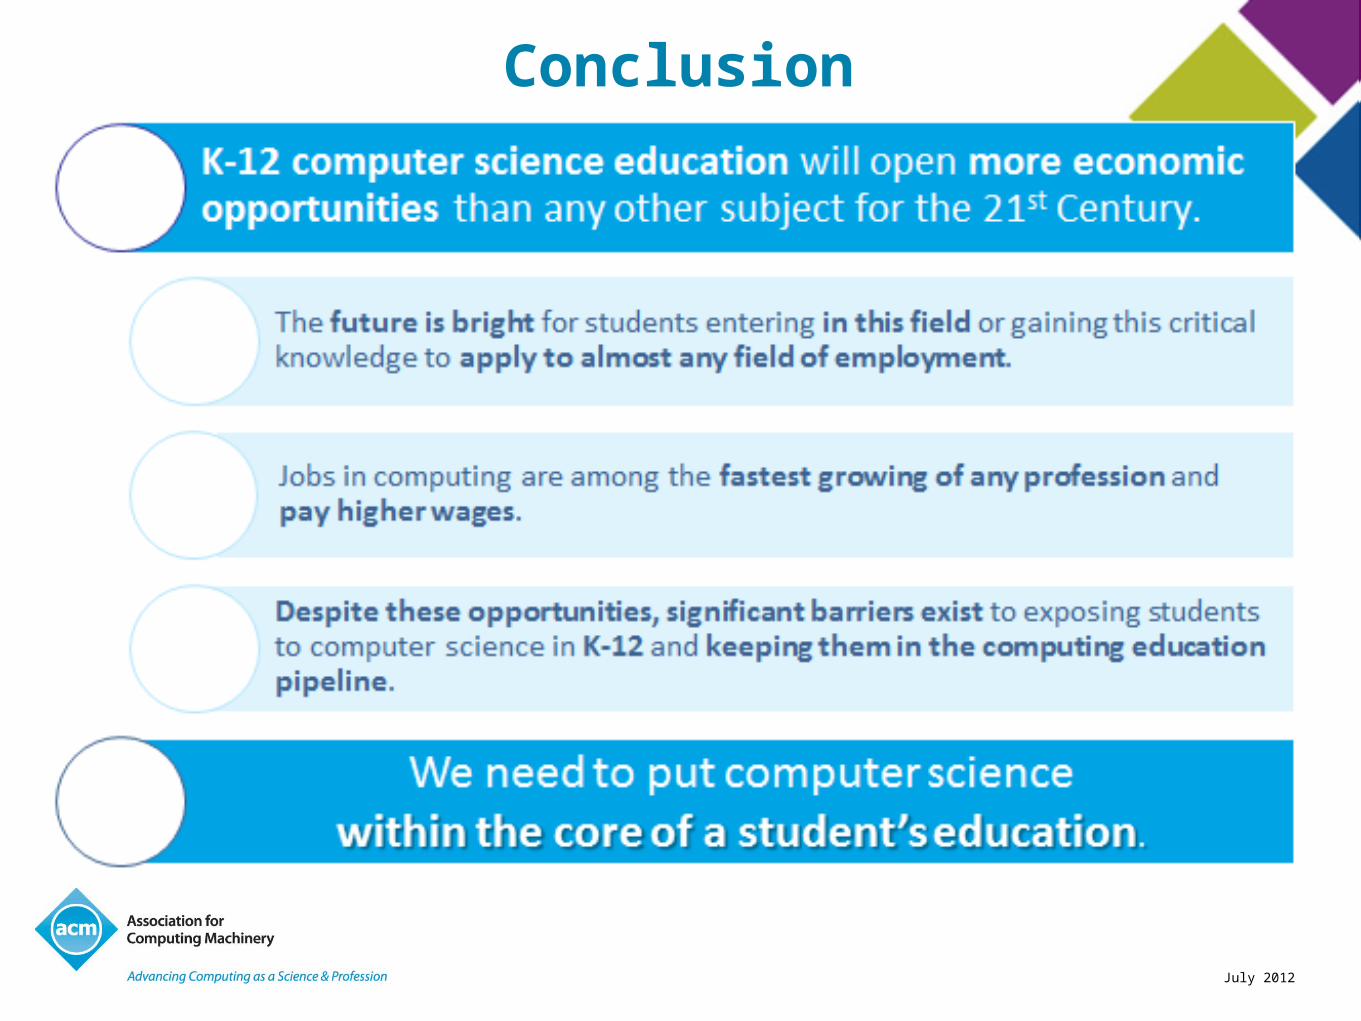
Conclusion