july 1999 the social impact in indonesia - world bank filethe social impact of the crisis in...
TRANSCRIPT

e%.i 4 A.aC#I'SIWU^" sSocial evelopment- tu,
21249July 1999
The Social Impactof the Crisis in Indonesia:
Results from a Nationwide KecamatanSurvey
Sudarno Sumarto
Anna Wetterberg
and
Lant Pritchett
Pub
lic D
iscl
osur
e A
utho
rized
Pub
lic D
iscl
osur
e A
utho
rized
Pub
lic D
iscl
osur
e A
utho
rized
Pub
lic D
iscl
osur
e A
utho
rized
Pub
lic D
iscl
osur
e A
utho
rized
Pub
lic D
iscl
osur
e A
utho
rized
Pub
lic D
iscl
osur
e A
utho
rized
Pub
lic D
iscl
osur
e A
utho
rized


The Social Impact
of the Crisis in Indonesia:Results from a Nationwide Kecamatan
Survey
Sudarno Sumarto
Anna Wetterberg
and
Lant Pritchett
Support from the Ford Foundation and ASEM Trust Fund is gratefully acknowledged The authorswould also like to thank the mnany people who contributed to the design of the questionnaire, includingScott Guggenheim, Sarah Cliffe, Brigitte Duces, Steven Burgess, and Shyaikhu Usman. BPS wasresponsible for data collection and Peter Gardiner and his team at INSAN HITAWASANA SEJAHTERAcarried out the empirical work. The findings and conclusions expressed in this paper are entirely thoseof the authors. They do not necessarily represent the views of the World Bank, its Executive Directors,or the countries they represent.


The Social Impact of the Crisis in Indonesia:
Results from a Nationwide Kecamatan Survey
Page
Abstract ............................. ii - iii
I. Background .............................. 1
II. Survey and Methods ............................. 1
III. Provincial and Kabupaten Analysis ................. 4
IV. Specific Crisis Impacts ............................. 13
V. Conclusions and Recommendations ............... 17
Appendix 1: Details of the Survev
Appendix 2: Inter-Coder Reliability
Appendix 3: Construction of an Index
Appendix 4: Survey Indicators
Foreword
In the middle of 1997, the economies of many East Asian countries experienced a meltdown with serious consequences for the development agenda and goals of the region. Inresponding to the crisis. the World Bank has worked to galvanize action to protect themost vulnerable social groups and preserve the human development gains made in thelast two decades. Crisis response has tested the Bank in many ways, including having tobring complex and contentious issues, such as good governance and the rule of law, tothe forefront of economic and social policy. Seemingly more simple issues such as theuse of monitoring methods to understand the impact of the crisis on different social andregional groups have posed no less a challenge to the Bank's staff, and the otherimportant players at national and regional level.
This paper contains the findings of a largely qualitative instrument for measuring theimpact of the crisis in Indonesia. In addition to its important finding on the differentiatedimpact of the crisis, the relatively low cost and quick turnaround characteristics of themethodology will be of interest to development practitioners caught in similar crisissituations that call for rapid and informed response.
Kristalina GeorgievaSector Director
East Asia Environment and Social Development Unit
ii
The Social Impact of the Crisis in Indonesia:
Results from a Nationwide Kecamatan Survey
Abstract
This paper is based on a qualitative survey of three expert respondents in everykecamatan (sub-district) in Indonesia, designed to obtain a quick indication of overallimpacts of the Indonesian crisis. Questions cover the degree of different types of impacts(migration, access to health and education, food availability), the frequency of differenttypes of coping strategies (selling assets, reducing frequency of meals, etc), and the mostsevere impacts in each area. Indices were constructed to measure crisis impact along fivedimensions.
There are three main findings. First, urban areas have been harder hit by the crisisthan rural areas. Second, the impact of the crisis is very heterogeneous, with someregions experiencing great difficulties and others doing relatively well. Both rural andurban areas on Java have been hard hit by the crisis. Some of the other islands,particularly large parts of Sumatra, Sulawesi, and Maluku, have experienced minimalnegative crisis impact. Other areas show negative impact, but it is unclear whetherproblems are economic crisis-related or result from drought (East Timor, NTT, NTB) andfires (East Kalimantan). Third. there is little connection between initial poverty levelsand the extent to which an area has been hit by the crisis, with some relatively poor areashave not been hard hit while some relatively well off areas have been quite hard hit. Thisimplies that crisis impact targeting and poverty program targeting are two, quitedifferent, exercises.
The consistency of the results with other quantitative surveys also shows that this typeof quick turnaround. largely qualitative. instrument can give a good overview of degreesof crisis impact in different areas and trends in overall changes. Although results requirefurther validation and cross-checking for use in the design of crisis response programs,this kind of survey can point response efforts in the right direction. Because of its lowcost and quick turnaround, a similar survey could also be repeated after six months in aneffort to provide on-going monitoring of crisis impacts.
..

Dampak Sosial dari Krisis di Indonesia:
Hasil dari Survey Nasional Kecamatan
Abstrak
Makalah ini ditulis berdasarkan hasil-hasil survey kualitatif yang dilakukan terhadap tigaorang ahli di setiap kecamatan di seluruh Indonesia. Survey ini dirancang untuk memperolehgambaran secara cepat dan menyeluruh mengenai dampak krisis yang terjadi di IndonesiaPertanyaan-pertanyaan yang diajukan mencakup berbagai jenis dampak (migrasi, akses terhadapsarana kesehatan dan pendidikan, ketersediaan pangan), frekuensi penggunaan berbagai jenis kiatpenanggulangan (penjualan aset, pengurangan frekuensi makan, dan lain-lain), dan dampakterbesar yang dialami oleh masing-masing daerah. Kemudian disusun beberapa indeks untukmengukur dampak krisis yang mencakup lima segi (yaitu kesehatan, pendidikan, kesempatankerja, ketahanan pangan, dan kiat mengatasi krisis).
Terdapat tiga temuan utama. Pertama, dampak krisis di daerah perkotaan lebih parahdibandingkan dengan daerah pedesaan. Kedua, dampak krisis ini sangat heterogen, dimanaterdapat beberapa daerah yang mengalan-i kesulitan parah sementara daerah-daerah lain relatifbaik keadannya. Tetapi di pulau Jawa baik daerah pedesaan maupun perkotaan sama-samamengalami dampak yang parah. Beberapa daerah di pulau-pulau lain, khususnya sebagian besarSumatera, Sulawesi, dan Maluku, mengalami dampak krisis yang tidak terlalu besar. Ada jugadaerah-daerah yang memperlihatkan keadaan yang memburuk, namun tidak jelas apakah inimerupakan dampak dari krisis ekonomi ataukah akibat dari musim kemarau (Timor Timur, NTT,NTB) dan kebakaran (Kalimantan Timur). Ketiga, terdapat kaitan yang kecil antara tingkatkemiskinan awal dengan derajat besamya dampak krisis, dimana terdapat beberapa daerah yangrelatif miskin yang ternyata tidak begitu terkena krisis sementara terdapat beberapa daerah lainyang lebih makmur yang ternyata mengalami dampak krisis yang besar. Implikasi dari hal iniadalah bahwa sasaran dari program penanganan krisis dan sasaran dari program pengentasankemiskinan merupakan dua hal yang sangat berbeda.
Konsistensi dari hasil survey ini dengan hasil penelitian-penelitian lain yang bersifatkuantitatif menunjukkan bahwa suatu instrumen kualitatif dengan jangka waktu pelaksanaan yangsingkat seperti yang digunakan dalam penelitian ini mampu memberikan gambaran yang baikmengenai derajat dampak krisis di berbagai daerah dan kecenderungan dari keseluruhanperubahan yang mereka alami. Meskipun hasil penelitian ini memerlukan pengesahan lebih jauhserta pemeriksaan silang untuk dapat digunakan dalam perancangan program-programpenanganan krisis, survey jenis ini mampu mengarahkan upaya-upaya penanganan krisis ke arahyang benar. Karena biayanya rendah dan jangka waktunya singkat, survey sejenis dapat diulangsetelah enam bulan sebagai suatu usaha untuk melakukan pemantauan berlanjut dari dampakkrisis ini.
iv

I. Background
As the economnic and political crisis in Indonesia has worsened over the past year,there has been increasing recognition of the need to identify and track emergingproblems, with a view to designing appropriate responses. Efforts to monitor socialimpacts have concentrated on improving or accelerating existing tools, such as thenational expenditure survey (SUSENAS) and the village potential survey (PODES).Although these efforts are crucial for medium-term planning, the time necessary todesign instruments, and gather and process data is too long for these instruments to be auseful guide for immediate action. By the time data are processed and analyzed, quicklychanging crisis conditions have rendered them obsolete.
Other surveys have focused on measuring impact in specific sectors, such ashealth and education, and have produced good detailed information for a small number oflocations and an indication of trends in these sectors. However, they have not beendesigned to compare crisis impacts across all of Indonesia and identify areas whereoverall effects have been most severe.
To get a snapshot of changes in overall welfare and emerging problems acrossIndonesia, the Ford Foundation and the World Bank designed a quick turnaround surveyto be implemented in every kecamatan (sub-district). The purpose of this tool was togive a first indication of overall crisis impacts, the relative severity of various problemsin different parts of Indonesia, and an idea of how to target crisis responses mosteffectively.
-I. Survey and Methods
The Kecamatan Rapid Poverty Assessment was a subjective, expert respondentsurvey of three government officials in each of Indonesia's 4.025 kecamatans. In eachsub-district three respondents with kecamatan-wide responsibilities were chosen: theagriculture officer (mantri tani) in rural areas or the development officer (kepala seksiPMD) in urban areas; the kecamatan school supervisor (penilik sekolah); and the healthofficer (dokter puskesmas). Each respondent was asked a standard set of questions aboutchanges taking place in the kecamatan as a whole, as well as a set of questions about theirprofessional specialty.'
The questions focused on the degree of different kinds of impacts (e.g., migration,access to health and education, food availability, etc.), the frequency of different types ofcoping strategies, and the most severe impacts in each area. All questions were designedto measure proportional change in indicators relative to the same time in 1997, toeliminate seasonal changes. The questions asked of all three respondents were qualitative
In addition to the three respondents in each kecamatan, the local representative for the Central Bureau ofStatistics (BPS) completed a separate questionnaire, including some quantitative questions regardingchanges since the start of the crisis. See Appendix I for more details on survey design and datacollection.
1

and asked respondents to rate each indicator's severity on a five-point scale: 1) somewhatimproved; 2) about the same; 3) somewhat worse; 4) much worse; and 5) very much
2worse . The common questions also included a ranking of problems and three questionson existing crisis response programs. The respondent-specific questions were alsoprimarily qualitative, but included a small number of quantitative questions (whichduplicated the topics covered qualitatively).
There are limitations to every approach and the use of subjective qualitativequestions is no exception. With the decision to use this type of instrument, the loss ofquantitative precision and relying on a very small number of respondents in each locationwere the price paid for a rapid and nationally comprehensive survey. For this survey,national coverage was necessary in order to identify crisis-hit areas for program targeting.A quantitative survey using representative sanpling approach was ruled out asdemanding kecamatan sample sizes that are simply too large. By asking for qualitativeassessments we hoped to get universal coverage with complete response (the use ofquantitative questions did dramatically raise the non-response rate in this survey). It wasalso necessary to limit the number of respondents in each kecamatan to minimize the timebetween survey distribution and return of questionnaires.
Inter-respondent reliabilitv. One concern about using the expert respondentqualitative approach is the inter-respondent reliability. Simply put, do two people, askedthe same question about the same kecamatan, tend to give the same answer? Since 21questions of this survey were general questions that all three respondents answered, wecan assess this inter-respondent reliability by comparing responses. Appendix 2 detailsthe outcome of three different measures: the correlation across different respondents:within versus across kecamatan analysis of variance; and the average absolute deviation.
All three approaches show an acceptable degree of consistency in responsepatterns within kecamatan but also show that there is a significant level of disagreementbetween respondents. The correlations across kecamatans of the responses of any two ofthe coders from the same kecamatan seldom rise above 0.3 and some cases are closer to0.2. The average absolute disagreement between two respondents in the same kecamatan(on a scale from I to 5) is between 0.6 and 0.8. While this disagreement is relativelysmall in an absolute sense, the total variation of the responses is also quite small(standard deviations vary between 0.9 and 1.2). The "within" kecamatan sums of squares(that part of the variation in the data that arises from disagreements among therespondents in the same area) is generally on the order of one-third to one-half of the total
3variance
This degree of uncertainty serves as a warning to confine analysis to comparisonswhere we can realistically hope that "signal" will overshadow "noise." This means eitherusing aggregates of kecamatan (e.g., provinces or kabupaten and kotamadva) oraggregates of variables. Also, between-kecamatan gross distinctions are fairly reliable,
2 A typical question is "Relative to the same period last year how many families are switching from stablefoods to lower quality substitutes?", answered on the scale indicated.
3 Because the respondent-specific questions involve only one respondent per kecamatan we cannot dosimilar tests to those above. However, one can expect that these qualitative responses are subject tosimilar imprecision.

but fine distinctions (e.g., between "about the same" and "slightly worse") should bemade with extreme caution. It should be noted that these limitations imply that, while thebroad patterns indicated by this data are useful in targeting of crisis response, used ontheir own these data alone cannot target program locations at the kecamatan level.
Index construction. There are too many questions in the survey to do a detailedanalysis of each. Instead, summary indices were constructed from a combination ofindicators in each of five dimensions. The construction of each impact index involvesseveral steps:
a) choosing variables with sufficient internal reliability and creating a single4kecamatan response
b) dividing the reliable variables into five categories: 1) use of coping strategiesin response to crisis impacts; 2) food security; 3) employment; 4) education;and 5) health; and
c) assigning appropriate weights to chosen variables within each category.
Using the chosen variables in each category, we applied the principal componentstechnique to summarize the "signal" contained in a set of variables dealing with acommon topic. The first principal component of the set of variables for each category,which is that linear combination of all the variables which captures the most commonvariation in all the variables, was used as the impact index for each category.
The variables included in the principal components analysis for each index were5:
* Coping: There were 10 questions about coping strategies and reducedinvolvement in community activities, such as changes in selling animals orconsumer durables and changes in the participation and contributions toarisan and ceremony activities.
* Food Security: This index combined nine questions on food security,including population reducing the quantitv and quality of foodconsumption, population unable to afford the staple food, and indicationsof malnutrition.
* Employment: This combined seven individual variables about thefraction of people working more hours, the number of family membersworking, migration movements of males and females, and local businessconditions.
4 For the 21 questions with three respondents, the responses for each kecamatan were combined into asingle value. We adopted the following rules to create single variables for each kecamatan: a) if all threerespondents had the same response, we used that response/number; b) if two respondents had the sameresponse, we used that response/number; and c) if all three respondents differed, we used the medianvalue of the three responses.
5 For specific questions used and their factor loadings, see Appendix 2, Table 2-4.
3

* Education: The education index combined nine questions from theschool official about enrollments and drop-outs at the primary level, andabout parental contributions and teacher attendance.
* Health: Seven questions from the dokter puskesmas about patient visits,purchasing power for medicines, availability of medicines andcontraceptives, and quality of services were used for the health index. Thehealth index was the most disappointing as the common component of theresponses was too small to give the index much value added over theindividual questions. For this reason we do not include the maps forhealth below.
III. Provincial and Kabupaten Analysis: Regional Heterogeneity andUrban-Rural Differences
The indices were used for two stages of analysis: one at the provincial level.distinguishing rural from urban areas. and another at the district level that distinguishesbetween rural kabupaten (districts) versus kotamadva (municipaliti. . There are threeresults that come through very clearly from the analysis at both levels:
1) Urban areas have been much harder hit than rural areas by the crisis.
2) There is enormous heterogeneity in the impact of the crisis with some areas sufferingenormously while others appear to be absolutely better off. Three prominent patternsemerge:
* Java is hard hit, even in rural areas, most likely because of a high degreeof integration between urban and rural areas.
* Some of the other islands, particularly large parts of Sumatra, Sulawesi.and Maluku, have experienced minimal negative crisis impact.
* Other areas show negative impact, but it is unclear whether problems areeconomic crisis-related or result from drought (East Timor, NTT, NTB)and fires (East Kalimantan).
3) There is little connection between initial poverty and the magnitude of the shock, withmany of the areas that were hardest hit were the relatively well-off areas that hadbooming modern economy sectors pre-crisis.
4

A. Provincial analysis
Within each province the values for urban and rural kecamatan are aggregatedseparately. This produces 51 regions (two for each of 25 provinces6 and one for DKIJakarta, which has no rural kecamatan). These are then sorted by level of impact (seeTable 1).
The rankings for each of the five indices are shown in Table 1, for urban and ruralareas by province, using standard area abbreviations (e.g., "Kaltim" in boldface type isurban East Kalimantan, while the rural area of the same province is shown in italics).The same areas are also sorted by an overall impact index based on the average of therankings of three indices (i.e., food security, employment, and coping).
According to the overall crisis impact index, the single hardest hit region is urbanEast Kalimantan while urban Bengkulu is the least hit. Comparing the 40% hardest hitprovinces and 40% least hit provinces reveals very clearly that urban areas are, onaverage, much harder hit than rural areas. Of the 20 hardest hit areas, 14 are urban, whileof the 20 least hit areas, 13 are rural. Notably. all areas of Java are included in the 20hardest hit areas, regardless of urban/rural status. The only other rural areas included inthe 20 most affected areas are East Kalimantan and Aceh.
The urban areas that fall into the least hard hit 40% are those in provinces whererural areas are also relatively unaffected, such as Jambi, South Sumatra, Bali, NorthSulawesi, Central Sulawesi, Maluku, and Bengkulu.
These results imply that the crisis impacts are concentrated in urban areas and onJava. Also, some of the eastern provinces have experienced substantial negative impactin both urban and rural areas. Important exceptions are urban areas in provinces thatproduce export crops or other foreign exchange earning activities (such as tourism).Likely explanations for this regional pattern include the higher integration of rural andurban areas on Java so that a modern sector crisis (e.g., originating in the banking andcorporate sector) would spill over more, the recent drought in Eastern Indonesia, and thehigher rupiah incomes (due to the currency depreciation) earned from export crops inregions that escaped the recent drought.
Since the principal components analysis produces index numbers that are both re-scaled (to have a mean of zero) and are a complicated aggregate of a variety of indicatorsit is difficult to make statements about the absolute magnitude of changes. While we cansay which are the "least hit" areas, it is difficult to say whether this means they areabsolutely better off than a year ago or whether their absolute living standards haddeteriorated, but just to a lesser degree than other areas. However, looking at the crosstabulation on specific questions does suggest that some areas are absolutely better offthan a year ago.
6Irian Jaya is not included in the analysis because of insufficient response from kecamatan in the province.
5

Table 1. Indices by Province and Rural/Urban Status
Rank Overall Food Coping Employment Education HealthImpact* Security Strategy
I Kaltim Timtim DI Aceh NTB Kalbar Dl Yogva2 NTT r NTT Kaltim Lampung Timtim Bali3 DI Aceh Timtim Kalsel Sumut NTT Kalbar4 NTB N7T Jabar Kaltim DI Aceh | Lampung5 'Kalsel | NTB Lampung Sumsel Kalbar Timtim6 Jabar 1 Dl Yogva NTT Jateng Sumut Jambi7V DI Yogya Dl Aceh Jabar Jabar Timtim DI Yogva8 Lampung Kaltim Kalbar Jateng Dl Aceh Lampung9 Kalbar DI Yogva NTB Dl Yogya Sumut NTB10 Jabar Kalbar Kalteng Kalsel Kaltim Bali11 Timtim Jatim Sumbar I Jabar Sultra Jabar12 Jateng Jateng DI Aceh INTT NTT Dl Acelt13 Sumut Kaltim DKI Jakarta NTB Riau Jateng14 Jateng Jatim Sumut I Dl Aceh DKI Jakarta Sultra15 Jatim Kalsel Dl Yogya DI Yogya Kalteng Kaltim16 Kaltim Jabar Kaltim Jatim DI Yogva Sumut17 Dl Yogva Jateng Jateng DI Aceh Kalsel Jabar18 DIAceh Jabar Jateng Jatim - Jabar Jatim19 DKI Jakarta Lampung Timtim Lampung Riau Kalbar20 Jatim NTB Kalteng Kalteng Jateng NTB21 Sumbar Sulsel Kalsel Riau Bengkulu Sumut22 NTT Sumut Jatim I Sumut Bali Kalteng23 NTB Lampung Riau j DKI Jakarta I Sumbar Maluku24 Timtim DKI Jakarta 1Sultra Sulsel i Jateng Riau25 Kalteng DIAce Iz Jambi Sumsel Jambi Sulut26 Sulsel Sultra NTB ! Sumbar NTB Sumbar27 i Kalteng Sultra Jatim Timtim Lampung Sulteng28 ; Lampung Bali - DI Yogva T Kalbar Sumsel Sumsel29 Kalsel Kalteng Sumbar Bali Sumsel DKI Jakarta30 Sultra Sumbar Sulsel L Sumbar Jabar Sulsel31 Riau Maluku Sulteng Kalteng Sumbar I Kalsel32 Jambi Kalsel N7T F Bali i Jambi [Jatim33 Sumsel l Bali Sumsel lKalsel Jatim Sulteng34 Sultra I Kalbar |Lampung Kaltim Sulut I Ben gkulu35 Kalbar Sulut IKalbar: Jambi Kalsel l Sultra36 Sumbar Jambi Timtim Kalbar | DI Yogya ! DI Aceh37 Sumut Riau Sumut Sulsel Sulsel Sulsel38 Bali Sulsel Sulsel Sulut | Lampung Jateng39 Bali Kalteng Sultra IBengkulu Sulteng Maluku40 Sulsel Sumur Sulut Sultra | Kalteng Bengkulu41 Sulut Sumsel Sumsel NTT Sultra Kaltim42 Sulteng Sulteng Riau Sultra I Su1teng Sumbar43 Maluku Bengkulu Sulteng SBengkulu Susel Sulut44 Surnsel _ Sulteng Jambi Riau Maluku NTT45 Sulteng Sumbar Bali Timrim Jatim Riau46 Bengkulu Sumsel Bengkulu Suleng NTB Jambi47 Rau Maiku JBali iambi Kaltim NTT48 Jambi Riau| Maluku | Maluku Sulut | Sumsel49 Sulut Jambi Sulut Sulut Bali Kalsel50 Maluku Sulut Bengkulu Sulteng Ben. Timtim51 Bengkulu I Bengkuiu -Maluku Maluku Maluku Kalten
* Based on average if three indices (food security, employment and coping mechanism).(Note: Urban areas are shown in bold, rural areas in italics.)
6

Table 2 chooses just one question about the "change in the population sellinghousehold goods to meet basic needs" broken down into provinces, and by rural andurban. This table shows the fraction of kecamatans in these areas that reported that, bythis indicator, things were worse (any one of the three possible responses for severity).For hard hit areas in Table 1, as measured by the "coping" index, the fraction reporting,,worse" on this question is very high, such as 93% in urban Aceh, 87.5% in urban WestJava, 82.5% in rural west Java. In contrast, of the areas reported as least hard hit asmeasured by the "coping" index, only a small fraction reported things were "worse". Forinstance in rural Bengkulu in only 16.7% of kecamatans were asset sales "worse" whilein rural Maluku only 26.1% of kecamatans reported things were "worse". In fact, lessthan half the kecamatans reported asset sales were "worse" in the rural areas of 12provinces: North Sumatra. West Sumatra, Riau, Jambi, South Sumatra, Bengkulu,Lampung, East Timor, West Kalimantan, and West, Central, and South Sulawesi.
Table 2. Fraction of Kecamatan in Each Area (Province, Urban, Rural) Reporting"People Selling Assets to Meet Basic Needs" as a Coping Mechanism Was "Worse"
(of Severity 3, 4 or 5).
Total Urban RuralWorse Worse Worse
DI Aceh 65.6 93.3 62.0Sumatra Utara 49.2 68.6 43.8Sumatra Barat 52.7 75.0 43.9
Riau 37.2 61.1 30.9
Jambi 32.2 53.9 25.5Sumatra Selatan 28.4 50.0 26.6
Bengkulu 25.8 57.1 16.7
Lampung 43.9 75.0 36.3Average 41.9 66.8 35.7
Jakarta 88.4 88.4Java Barat 83.2 87.5 82.5Java Tengah 73.8 81.6 72.4Di Yogya 65.4 84.2 59.0.lava Timor 76.7 86.0 75.4
Average 77.5 85.5 72.3
Bali 56.9 66.6 53.9NTB 72.1 77.8 71.2
NTT 54.0 73.3 51.4East Timor 40.3 46.2 38.7
Kal Barat 33.6 100.0 26.7
Kal Tengah 55.2 87.5 50.0Kal Selatan 70.2 84.6 68.4
KalTimor 71.4 85.7 66.6Average 56.7 77.7 53.4
Sulawesi Utara 28.0 35.3 26.4Sulawesi Tengah 29.0 44.4 26.6Sulawesi Selatan 38.6 58.9 33.1Sulawesi Southeast 51.6 55.5 51.0
Maluku 30.0 42.9 26.1Average 35.4 47.4 32.6
7

B. Kabupaten level analysis
In this analysis we distinguish between rural and urban areas on the basis ofkabupaten and kotamadya which were ranked according to the impact indices anddivided into quintiles. We do two types of analysis, a visual analysis of the maps and astatistical comparison of the proportions of various areas falling into the various quintilesof severity.
Maps of crisis impact. Quintiles were then mapped to show the spatialdistribution of crisis impact. Figure I shows maps for four indicators: la) Coping, lb)Food security, lc) Employment, and Id) Education.
These maps tell a very clear story, most striking in the index of "coping" (whichis an index driven mainly by asset sales and reduced participation in communityactivities). On the nationwide map there are five areas that are in the bottom quintile:
* West Java and parts of Central Java,
* Urban areas (the kotamadva appear as dark spots on all islands, even moreclearly on the insert Java-Bali map),
* NTT and parts of East Timor,
* Scattered areas of West and North Sumatra (Aceh), and
* A huge (but sparsely populated) area of Kalimantan.
In contrast the unshaded areas, which are the top quintile, shows:
* Wide parts of Sumatra, Sulawesi, Maluku, and Bali among the least hard hit,and;
* No part of Java in the top fifth, or "least hit" categorv.
These same broad patterns show up in the other general crisis indicators. Theemployment index shows that, in employment terms. there is an even more "island ofJava" (and with more rural kabupaten hit hard) and urban crisis, with a few exceptions inSumatra. Interestingly, an important element of the employment impact index is people"returning to their village." This means that unemployment per se is not measured andthat some areas from which people are migrating are equally hard hit as the nearbyreceiving areas. This is perhaps why more rural parts of Java and Bali appear hard hit onemployment, as a spill over from Java.
The food security map, which is driven by indicators of eating fewer and lower qualitymeals, tells again a "Java ant urban story" but with a couple of twists. First, on thisindex NTT and East Timor show up as much worse hit than by "coping" or"employment" this is an indication of the natural environment dimensions of theproblem. Second, parts of West Java and especially the Jabotabek area appear much less
8

Figure la. Kabupaten Level Crisis Impacts on Coping Strategies
a W_ s~~~~~~~~~~~~~~~~~~~~nptw. Mrl Wt , mr.ntw
~IS
A 9 __ I
INDONESI Ab^'
r'>
MU . 1i,C k JAWA - IMALI ~~~~ ~-~I -i.~
Figure lb. Kabupaten Level Crisis Impacts on Food
JAM- RAs- U5 1 i
* . A -.
~~W I, -, j^ *f,'
., >9,~~~~~~~

Figure ic. Kabupaten Level Crisis Impacts on Employment
_12 ~ ~ ~~~'~~~~~~~~~.~~ ~ .- ..
_t -t i;' -- ; r.
JAM.- MI ,7r
w~~~~~~~
Figure Id Kaupte Lee Crisi Impact onEuctoA ~ ~ ~ ~ )INDONESIA p.X
Figure Id. Kabupaten Level Crisis Impacts on Education
~~~~~ i,,,,I.,.,
-~~~~~ ~~~~~~~~~~~~~ 4_ .- , .' ,-~
10

hard hit on this dimension, which is likely due to the fact that initial incomes were muchhigher and hence selling assets would take prominence over reducing food intake as acoping mechanism. That is, since the "food security" index captures not just foodproduction but also lowering food intake, the crisis in richer areas (like Jabotabek) willshow up more clearly in selling assets. which is a first resort for those that have them, andonly later in food intake declines.
Statistical analysis. Examining the hardest hit 40% of tingkat II (district level)clearly reinforces the provincial level results. Kotamadvas have generally been moreseverely hit than rural kabupatens. For both coping and employment indices, 60% ofkotamadyas are in the hardest hit 40% of tingkat II, compared to only 38% of ruralkabupatens. For the food index, similar proportions of kotamadyas and kabupatens areranked in the hardest hit 40% (41% of kabupaten versus 45% of kotamadva).
Again, as with the provincial results, areas on Java show a different pattern. Bothkabupatens and kotamadvas are classified in the two hardest hit quintiles. (See mapswhere most of areas on Java falls into the categories of hardest hit (black), especially forcoping and employment.) Moreover. the coping index for West Java shows that 65% ofthe tingkat II in the province fall in the worst hit quintile. while an additional 20% are inthe second quintile. Five of the six kotamadyas in the province are in those two quintiles,as well as 85% of the rural kabupatens.7 East and Central Java, as well as DIYogyakarta, are also experiencing similar patterns.
C. Has the crisis hit the poorest areas?
It is important to remember that the kecamatan survey measures only changes inwelfare (and that qualitatively). The results of the survey indicate relative shifts since thecrisis began, but are not able to show current absolute welfare or standard of living levels.A question as yet unanswered is whether the crisis hit hardest in areas that were alreadypoor, making them even worse off. or whether the impact has been more severe inrelatively well-off areas. A simple test between various indices and pre-crisis levels ofthe incidence of poverty, based on SUSENAS 1993-1996. across kecamatans revealsvery little correlation, statistically insignificant even with 3,900 observations.
The same lack of association between pre-crisis poverty and the magnitude of thecrisis impact can be seen by comparing the figures which show changes due to the crisisto the pre-crisis poverty levels. Figure 2 shows the proportion below the standardpoverty line in each kabupaten, using SUSENAS data averaged from 1993 and 1996.While most of West Java, and especially the area around Jakarta, has very low povertyrates, the crisis has been enormous in those areas. In contrast, Maluku, with very highpoverty rates, has perhaps even benefited from the crisis.
The fact that severity of crisis impact does not correlate with pre-crisis conditionsmakes the design of poverty and crisis response instruments extremely complicatedbecause pre-crisis poverty data can not be relied upon for target responses to the crisis.First, some areas which were not poor have been hit relatively hard and may now be
A similar pattern is seen for the employment index.
11

Figure 2. Pre-Crisis Poverty Levels (SUSENAS 1993-1996)
F.P(rwirr Itn' w 7fl u1r1ii|~~~~~~~~~~~~~~~~~~~~~~~~~~~~~~~~~~~~~T11 t1r- Pnrvy t in
A- ,: , ,'- a" .,v,<* R
. A jl X ,. 4 . - ~~~~' ' . \; y
W * > > __4S t __. *. t
, ~ ~ ~ ~ ~ ~ ~ ~ ~ ~ ~ ~ ~ ~- ., .
'_ s!_ ; : . .__~~~4_
JAWA -BALI -
poorer than other areas. Second, what is even more complicated is that many previouslywell-off regions (e.g., Jabotabek) have been hit very hard, but almost certainly have notreached the level of absolute poverty of traditionally poor areas. In this case. targetingthe crisis impact is not the same as targeting absolute poverty. Needless to say, thiscreates considerable tensions between the long-term development programs, which havetraditionally been aimed at bringing mainly remote and rural areas into the mainstream ofgrowth, and crisis and emergency programs, which will be targeted to urban and ruralareas which were, until the crisis, relatively better off and booming.
Table 3 illustrates various mixes of crisis effects and pre-crisis poverty levels:relatively well-off and hard hit (e.g., Jabotabek), relatively poor and hard-hit (e.g., NTT),relatively poor and not hard hit (e.g., Maluku), and relatively well-off and not hard hit(e.g., Bali).
12

Table 3. Examples of Differential Impact of Crisis
Relatively well-off pre-crisis Relatively poor pre-crisis
Hard-Hit Jabotabek, West Java NTT, East Kalimantan
Not Hard-Hit Central Sulawesi, Bali Maluku, Jambi
IV. Specific Crisis Impacts
Beyond the regional heterogeneity of the overall crisis impact there are alsoregional differences in the various dimensions of the crisis. For some areas the crisis ismainly an economic crisis feeding through labor markets, while in other areas there is afood security crisis driven by natural conditions.
Moreover, people who begin from different absolute levels of income will havedifferent responses to the crisis. For instance, middle-class families will respond to ashock by working more, reducing consumption, drawing down savings, and sellingassets, but are unlikely to pull children from primary school or suffer malnutrition. Incontrast, people near absolute poverty may not have the luxury of these coping strategiesso an equally large shock will force them into more drastic measures, such as primaryschool drop-out and reduced food intake.
An examination of how the various indices differ across locations gives someclues to these effects. Result of different indices across locations is presented in Table 4.
Table 4. Comparison Between Indices
Hardest hit areas 1 Least hard hit # of urban in 20 # of urban in 20areas hardest hit areas least hit areas
Overall impact E. Kalimantan (U) Bengkulu (U) 14 7
Food security E. Timor (U) Bengkulu (U) 12 9
Coping strategies DI Aceh (U) Maluku (U) 15 5
Employment NTB (U) Maluku (U) 13 6
Education W. Kalimantan (U) Maluku (U) 8 14
Health DI Yogya (U) C. Kalimantan (U) 12 11
13

A. Food security
As Table 4 shows, the impact of the crisis on food availability has been moresevere in urban areas. Further, the hardest hit rural areas are either on Java or in EasternI!. ;nesia. These findings are consistent with preliminary data reported by the IndonesiaFamily Life Surveys (IFLS) 2+8. Real per capita expenditures in rural areas have risen inboth mean and median. Meanwhile, in urban areas the mean real per capita householdexpenditures has fallen by around 40% (although median incomes fall by much less,suggesting a larger proportionate compression in expenditures mainly in the richer half ofthe distribution). Combined with higher food prices, urban dwellers are thereforesuffering from sharply reduced purchasing power.
In Eastern Indonesia. food security problems are the result of last year's drought.Other data also project severe food shortages in Eastern Indonesia, especially for maize,cassava, sweet potato, and taro9 .
In addition, individual variables from the survey reveal the following:
Increased price of rice - Not surprisingly, half of the respondents indicated that the priceof rice has increased by more than 50%. This result is in line with price reports fromaround the country. The general CPI from May to September 1998 has increased morethan 50%, and increases in the rice price have outpaced general CPI.
Reduced availabilitv of basic foodstuff - The mean response to the question of changes inavailability and accessibility of staples indicates that there has been a dramatic worseningin food security compared to other indicators. In addition to higher food prices, scarcityof staples results from breakdowns in distribution systems and decreased output indrought-struck areas.
B. Employment and wages
The impact of the crisis on labor markets and access to economic activity hasbeen more severe in urban areas and in Java (Table 1). Four of the seven provinces in thehardest hit rural areas are on Java. The finding that NTB is hardest hit in terms ofemployment impact is also consistent with preliminary results from IFLS2+, that showthat almost 15% of males working in 1997 had lost their jobs in August 1998 (Rand:Measuring Change in Indonesia, 1998). Individual survey variables show the following:
Return migration of males - Both urban and rural kecamatans reported a greater thannormal in-flow of males, returning because they lost their jobs elsewhere. This resultindicates that there is not necessarily a consistent flow of unemployed urban dwellers to
These data are very preliminary, as this survey attempts to track the same house' Ids. At this stage theanalysis is based on the 80% of the households that have been identified, almost certainly the other 20%,which the survey team is in the process of tracking, are atypical and hence the sample of those who werelocated is not representative.
9 Garcia-Garcia and Foley, Drought and Food Securiry, Nov. 1997.
14

rural areas or vice versa. In contrast, there has been a smaller increase in the number ofwomen that have returned to the kecamatans compared to the previous year. The datashowed less out-migration.
Increase in nominal agricultural wages and output prices - More than 85% of the mantritani reported that wages had increased for hoeing. Responses also indicate that there hasbeen a less dramatic increase in harvesting wages'0 . These imply that while assumptionof no-change in nominal income is far off the mark'', the data about price changessuggest there have been substantial declines in real wages in many areas. However, onthe revenue side, there has been an intermediate increase in non-rice output prices.Mantri tani responses also point to some increase in farm profitability (more than 50%answered that farm profits had increased compared to last year, although the meanresponse was no change), indicating that increases in output prices have outweighedrising labor costs in some areas.
C. Education
As discussed above, analysis of survey results indicate that urban areas have beenharder hit than rural areas, according to the indices constructed. The exception is theeducation index, for which 12 of the 20 hardest hit areas are rural. In terms of the leasthit 20 areas, only six are rural. Although the individual responses showed that dropoutrates have been low, the index points to some problems in rural areas. One possibility isthat the increase in agricultural wages raises the opportunity cost of schooling in ruralareas, making it more attractive to pull children out of school. Another possibility is thatrural families are "nearer the margin' so that an equi-proportionate shock to incomes willcause more rural than urban families to withdraw children from school.
For the individual variables, all respondents indicated that taking children out ofprimary school was not a common response to crisis impacts'2. This result is furtherreinforced by the responses given by the school supervisors to the sector-specificquestions - almost 85% indicated that there had been no change or a reduction in thenumber of students that dropped out between Kelas 3 and 4 3. On average, schoolsupervisors also indicated no change in the overall level of dropouts during the lastschool year (compared to the preceding year) or in the numbers of girls and boys thatentered Kelas I this school year (compared to last year). However, for the latter, thedistribution of answers is skewed towards a decrease in first-year enrollment rates,indicating that parents may be delaying school starts for younger children while lettingolder children continue.
10 Data from BPS indicate that agricultural wages have increased 30-35% on average for different tasks,with increases ranging from 10% to 50% in different provinces.
One recent publication, for instance, placed the numbers in poverty in Indonesia at nearing 100 million in1998, which essentially assumed that nominal incomes would remain unchanged while prices climbed80%. This is obviously both analytically unsound and empirically false.
12 The common question did not differentiate between primary or secondary school students.
3 Historically, dropout rates at the primary level are highest between these two grades. There was nodifference in responses for girls or boys. Other data sources indicate the problem with drop out is at thejunior secondary level and hence our data has little to contribute on this issue.
15

D. Health
As shown in Table 4, the impact of the crisis on health is more equally distributedbetween rural and urban areas. Twelve of the 20 hardest hit areas are urban, and 11 ofleast hit provinces are also urban. However, the health index is consistent with the otherindices in that Java has been severely affected. Except for DKI Jakarta, the four otherprovinces on Java are in the 20 hardest hit provinces.
The responses by the dokter puskesmas show that magnitudes of increases inprices and reduced availability of contraceptives are greater than most of the otherimpacts included in the survey. The distribution of answers indicates that higher pricesmay be a bigger problem than availability.
E. Ranking of problems
Respondents were asked to rank the most to least severe crisis impacts from a listof eight potential problems. From these we identified as "priority" those ranked as thetop three of the eight. Response patterns suggest some fairly strong and consistentopinions about which crisis impacts have been most severe. For example, the relativelyhigh ranking of "unemployment" (particularly in urban areas), "finding staple food" and"loss of income" can be compared with the relatively low ranking of "children droppingout of school" or "reduction in health services" (see Table 5). Overall the loss of the realpurchasing power of incomes, which is a combination of less employment and risingprices of staples, is the predominant concern.
Table 5. Ranking of Priority Problems in Kecamatan
% of respondents ranking as priority problem
Problem Urban Rural Total
Unemployment 6.5 20.1 27
Finding staple food 3.5 17 21
Loss of income 4.5 20 25
Children dropping out of school .3 1.5 2
Reduction in health service .3 1.4 2
16

F. Comparison with other studies
There are three other surveys which are producing preliminary results comparingpre- and post-crisis levels of impact: The Indonesia Family Life Surveys (IFLS) 2+. the"100 Villages" surveys, and a recent survey of schools. None of these have nationwidecoverage so the comparison of the results is difficult. But the main result of thekecamatan survey are largely consistent with preliminary data from other surveys.
Estimates of mean expenditures for rural and urban areas from the IFLS2+ showthat mean per capita household expenditures in rural areas have increased in the pastyear, while those in urban areas have fallen by almost 40%. UNICEF's 100 Villagessurvey also shows that ownership of durables has increased in rural areas, whichreinforces the conclusion that urban areas have been more severely affected across theboard.
The IFLS2+ survey shows that primary school enrollment has increased for bothgirls and boys in urban and rural areas. which is consistent with the result that dropoutrates have remained the same or dropped slightly. Results from a very recent survey ofschools carried out by the World Bank and Ministry of Education and Culture alsoreveals that overall enrollment at the primary level does not appear to be deviating fromtheir past trend and fell by only 1.5% in 1998/99, about average from the previous fouryears. The survey also shows that urban Central Java, urban Maluku, and Jakartaexperienced significant declines of junior secondary level, while rural South Sulawesisaw an 8% increase.
V. Conclusions and Recommendations
Of course this survey reconfirms the obvious: Indonesia's population isexperiencing enormous social impacts from a severe economic and financial crisis. Butwhat is new is empirical evidence at a national level that suggests the crisis impact is veryheterogeneous, both between urban and rural areas and across regions. Some regionshave been hard hit, others are relatively less affected. and some are even booming.
Ranking of urban and rural areas according to indices of crisis impacts shows that.in general, crisis impacts have been more severe in urban areas. For four of the fiveindices, the concentration of urban areas in the 20 hardest hit is considerably higher thanthe concentration of rural locations (12-15 out of 20). Likewise, the number of ruralareas in the 20 least affected areas is higher for the food security, coping strategy, andemployment indices (11-15 out of 20).
The second pattern is that both urban and rural areas on Java have been hardhit by the crisis. All areas of Java rank within the top 20 (of 51) most hard hit regions forthe overall impact index (and within or close to the 20 worst affected for the otherindices). Other areas that consistently turn up close to the top of the ranking are urbanareas in East Kalimantan, West Kalimantan, North Sumatra, DI Aceh, Lampung,NTB, NTT, and East Timor.
17

At the other end of the scale, some provinces seem to have felt relatively littleimpact of the financial crisis in both urban and rural areas. Notably, North Sumatra,Bengkulu, Central Sulawesi, and Maluku fit into this category. In addition, rural areas inSouth Sulawesi, Jambi, and Riau also consistently rank among the 20 least affected.
Designing specific programs that respond to the crisis is complicated and mustbalance several objectives, but these data at least suggest that crisis response effortsshould therefore target urban centers. in general, and particularly those that have had therelatively largest drops in welfare levels. such as urban areas in East and WestKalimantan, North Sumatra. DI Aceh. Lampung. NTB, NTT, and East Timor. Both ruraland urban areas on Java should be included in crisis programs.
It is important to note that the magnitude of crisis impacts does not correlatewith pre-crisis levels of povertv. This result points to the need to reassess data andassumptions about poverty distributions. While difficult to draw in practice. there is ananalytical distinction between targeting for crisis programs and for long-term povertyprograms. In designing longer-term poverty interventions there is a deeper, andunresolved. question of whether the crisis has changed fundamental dynamics. and hencecalls for a rethinking of long-term poverty programs. or is merely a temporary shock.
In terms of the kinds of interventions that should be designed for the crisis, moredetailed analysis of the cost-effectiveness in practice of various types of interventions isrequired. But there appears to be a need for continued efforts to channel rice and otherbasic foods to needy areas, workfare programs in urban areas, efforts to maintain healthservices, provision of free or subsidized contraceptives. and continuation of thescholarship program.
The consistency of the results with other surveys also show that this tvpe of quickturnaround. largely qualitative. instrument can give a good overview of degrees of crisisimpact in different areas and trends in overall changes. Although results require furtherinvestigation for design of crisis response programs. this kind of survey can pointresponse efforts in the right direction. Because of its low cost and quick turnaround. asimilar survev could also be repeated after six months in an effort to provide on-goingmonitoring of crisis impacts across Indonesia.
18

APPENDIX 1: DETAILS OF THE SURVEY
The survey was distributed through the Central Bureau of Statistics' (BPS)existing network of mantri statistik, who represent BPS at the kecamatan level. Themantri statistik are present in almost every kecamatan and their regular responsibilitiesinclude maintaining and updating population, education, and other local data bases. Thesurvey was sent to the BPS office at the kabupaten level, where mantri statistik from eachkecamatan picked them up along with instructions to implement the survey and return itto the kabiupaten office within a week. Completed surveys were mailed back to BPSheadquarters for data entry and processing. Total turnaround (including administeringthe survey and processing the data) was approximately one month. Analysis took placeover a three week period.
In rural areas, the three respondents were:
* mnantri tani -- As the kecamatan representative for the Ministry ofAgriculture. the mantri tani supervises all agricultural extension workers and,through them. gets regular reports on agricultural production. areas planted.and farm technologies used throughout the kecamatan.
- dokter puskesmas -- The dokter putskesmnas is the head of the kecamatanhealth center and sees patients from different parts of the kecamatan. Somedokter puskesmas also pay regular visits to the smaller supporting healthcenters in the sub-district.
• penilik sekolah -- The penilik sekolalb. or school supervisor, meets regularlywith principals and teachers from across the kecamatan.
In urban areas. the mantri tani was replaced by the Kepala Seksi PMD, who is in chargeof coordinating development activities for the kecamatan. In the instructionsaccompanying the questionnaire. the respondents were asked to consult with theircolleagues (i.e.. agricultural extension worker. nurses and midwives, and principals andteachers) before completing the questionnaire to ensure that answers were representativeof the kecamatan as a whole.
Translations of the questionnaires used are attached. Five answer choices aregiven for each of the scaling questions - three are gradations of a worsening inconditions, one registers no change, and one designates an improvement. This particularrange of answer choices was based on the need to balance survey objectives of measuringdegrees of change with logistical concerns of questionnaire design. Partners at BPSadvised that when confronted with several answer choices, respondents would be likelyto answer no change. It was therefore decided to limit the scale to five choices. Giventhis constraint, it was necessary to ensure that there was enough gradation to capturedegrees of worsening. In other words, if the crisis had led to a worsening of conditionseverywhere, the survey had to register nuances in this worsening, so that comparisonswere possible. This consideration led to the decision to include three degrees ofworsening and only one choice for improvement, as areas that had benefited from thecrisis were of less concern.
Instructions were also provided along with the questionnaires, describing thepurpose of the survey, defining terms used, and how to register responses. Whenever

possible, quantitative guidelines for the degree of change associated with each answerwere provided. It was not possible to provide ranges for each of the questions, however,as quantitative data on changes were not always available and, even when they were, theyvaried greatly across regions.
Final Questionnaire: Agricultural Extension Worker
I2 3 4 5I Total number of male residents that retumed to vour A lot i lore Slightly Same Fewer
kecamatan during Jan-Aug 98 because they lost their jobs more moreelsewhere (compared to Jan-Aug 97)
2 Total number ot fr,naie residents that rcturned to vour A- lot More Slightly Same Fewerkecamatan dunng Jan-Au )98 because thev lost their jobs more |moreelsewhere Icompared to Jan-Aug 97)
3 Total number of nale residents that hav c-one to a different A lot %lore Slightly I Same Fewerkecamatan during Jan-Aug 98 to look tor a job (compared more more
ito Jan-AuL 97)4 Total number o female residents that have gone to a A lot More Slightly j Same Fewer
different kecamatan during Jan-Aug 98 to look for a job more I more Ii___ (compared to Jan-Au,c _97) _ ll5 Total number or residents replacing staples with lower A lot Mlore Sli-htlv Same Fewer
q quality foods (roots, feed. etc.) duonn Jan-Aug 98 inore morei__ I compared to Jan-Aue 97 l I6 I Total number of residents taking on additional tasks and/or A lot Niore Slightly Same Fewer
working longer hours during Jan-Aug 98 compared to Jan- more moreI Aug '97 _ _ _
7 ITotal number of residenits selling assets (jewelry, livestock. A lot More Slightly v Same FewerTV, etc.) to meet daily needs during Jan-Aug 98 compared more moreto Jan-Aug 97Total number of residents leavin. orisns because they A lot More Slightly I Same Fewercannot aflord to participate during Jan-Aug -98 compared to more more
E___ Jan-Auc''7 19
9 Compared to August 97. amount of unisan payout now A lot less Less Slightly Same More
I Number of reli2ious/traditional celebrations during Jan-Aug A lot less Less Slightly Same More'98 compared to Jan-Auc -97 Less
II Contributions to reliuious/traditional celebrations durio A lot less Less Slightly I Same MoreJan-Au )98 comnared to Jan-Aug (J7 Less
I2 Availabilit. o1 stapic lood (rice. corn. ctc.) in stores and A lot Ic.s. L.ss Slightlv Same \loremarkets now comnared to Auteust -97 Less
13 Total number of residents that cannot attord to buy stapic A lot More Sli--htlv Same Fewertoods (rice. corn. etc.) during Jan-Aug 98 compared to Jan- more moreAug 97
14 Number of thefts and burglaries during Jan-Aug '98 A lot More I Slightly I Same Fewer icompared to Jan-Aug 97 more more'
15 Below are a series of problems that may be affecting your kecamatan. Please rank them according to how severely thevare affecting your kecamatan (I= most serious: 2=second most serious: 3=third most serious. etc.)
l Unemployment
Availability of staple foods lStudents dropping out of school lReduced incomes __|
Increased crime e_!
Crop failureReduced health servicesHunger
l___ Other: ............... _.......l O ther: ......................

16 Below are a series of possible ways residents in your kecamatan may be responding to the crisis. Please indicate theanswer that best describes the frequency of each response by residents in your kecamatan. .Substituting lower quality foods for staple foods Very frequent Frequent In-frequent Rare NeverReducing the number of meals per day Very frequent Frequent In-frequent Rare NeverReducing the quantity of food at each meal Very frequent Frequent In-frequent Rare NeverSelling livestock Verv frequent Frequent In-frequent Rare NeverSelling other assets Very frequent Frequent In-frequent Rare I NeverLeaving arisan Very frequent Frequent In-frequent Rare I NeverWithdrawing children from school Very frequent Frequent In-frequent Rare NeverSending additional family members to work Very frequent i Frequent In-frequent Rare NeverNot holding celebrations Very frequent Frequent In-frequent Rare Never IReducing contributions to celebrations Very frequent Frequent In-frequent Rare Never
17 In the last year, have there been special programs in your Yes Nokecamatan to help people deal with the crisis? I
18 If yes, what was the most widespread program'? ..........ad...............................19 How effective was this program in helping people affected Very beneficial I Somewhat I Not benelicial
by the crisis? I beneficial l l20 Compared to August '97, the price of medium quality rice A lot I Higher Slightly Same Lower
now: higher higher21 Compared to August '97, the number of stores that are A lot Higher Slightly Same Lower
closed down now: hicher higher l22 Compared to average harvests, the most recent harvest of A lot Lower Slightly Same Higher
I the staple crop (specify: ........... ) was: lower lower '23 Compared to August '97. the average output price of the A lot Higher Slightly Same I Lower
staple crop now: | higher higher l l24 Compared to the same harvest last year. the profitability of A lot Lower Slightly Same Higher
the most recent harvest of the staple crop was: lower lower25 Compared to August '97, farm wages for hoeing now: A lot Lower Slightly Same f Higher
~~~~~lower Ilower
26 t Compared to August '97, farm wages for weeding now: A lot I Lower Slightly Same HigherI_ _ _ _ _ _ _ _ _ _ _ _ _ __ I I lower lower l l _ I
27 Average output of staple crop (specify: ........ ) during last 1 1998 l
harvest compared to same planting season in 1997 1997 _______._l
I___I (quintal/ha):
28 Average market price of medium quality nce in August '98 August 1998 ...... land August '97 (RpAkg): August 1997
29 Average output price of staple crop (specifv i. in August 1998 l
|__| August '98 and August '97 (Rp/kg): August 199730 Farm wages for hoeing in August '98 and August '97 August 1998 l
(Rp/dav): AuLust 19971 31 Farm wages for weeding in August'98 and August'97 i August 1998 l
|__I (Rp/day): | August 1997
.t.l

Final Questionnaire: Director of Education Office
If 2 3 [ 4 51 Total number of male residents that returned to your A lot More Slightly Same Fewer
kecamatan during Jan-Aug '98 because they lost their jobs more moreelsewhere (compared to Jan-Aue 97)
2 2 Total number of fenale residents that returned to vour A lot More Sliwhtlv Same F-werkecamatan during Jan-Aug '98 because they lost tleir jobs more !moreelsewhere (compared to Jan-Aug '97) _
3 Total number of male residents that have gone to a ditferent A lot Mlore Slightly Same Fewer
kecamatan dunng Jan-Aug '98 to look for a job (compared more more
to Jan-Aue '97)
4 Total number of female residents that have gone to a A lot NMore i Slightly I Same Fewer
Ldifferent kecamatan during Jan-Aug '98 to look tor a job more more
(compared to Jan-Aun '97) I
5 otal number of'residents replacing staples with lower A lot More Slightlv Same Fewer
Lquality foods (roots. Ieed. etc.) durinl Jan-Au '98 more more
- . compared to Jan-Au- '97
( Total number of residents takinu on additional tasks and/or A lot lore Slightly Same Fewer
working longer hours during Jan-Aug '98 compared to Jatt- more more
Au2'97
7 Total number of residents selling assets (jewelry, livestock. A lot More Slightly Same Fewer
TV, etc.) to meet daily needs dunng Jan-Aug '98 comnared more more
to Jan-Aua '97 __ '__
S Total number of residents leaving ar-isooZs because they A lot More Slightlv Same Fewer
cannot atford to participate during Jan-Aug '98 compared to more more IJan-Aug'97
9 Compared to August '97. amount of toisein pLxoLit now A lot less l Less Slightly Same Nlore
Less :_._ i
I ( Number of reliaiousAtraditional celebrations durine Jan-Aug A lot less Less Slightly Same More
'98 compared to Jan-AuL '97 Less
I I Contributions to religious/traditional celebrations duritiw A lot less Less Slightly Same More
Jan-Aug '98 compared to Jain-ALo '97 Less
1 2 Availability ot'staple foods (rice, comr etc.) in stores and A lot less Less Slightly Same Mlore
markets now compared to Aueust '97 Less
13 Total number of residents that cannot afford to buy staple A lot More I Slightly Same Fewer
foods (rice. com. etc.) during Jan-Aug '98 compared to Jan- more I more
Aug 97 ____I _
14 Number ot thefts and burglaries during Jan-Aug '98 A lot ' lore Slightly Same Fewer
compared to Jan-Aut- '97 more moreI Below are a senes of problems tlIat may be attecting *Lour kecamatan. Please ranik them according to how scverei thev
are at'fectieL your kecamaan i i = most seCrous: 2=>econd msot ierious: 3=third most serious. etc.)
Unemployment
Availability ot staple toods
Students dropping out ot school
Reduced incomes
Increased cnme
Crop failure
Reduced health services
Hunger
Other : .-.
Other:......................
iv

16 Below are a series of possible ways residents in your kecamatan may be responding to the crisis. Please indicate theanswer that best describes the frequencv of each response bv residents in your kecamatan.Substituting lower quality foods for staple foods Very frequent Frequent In-frequent Rare NeverReducing the number of meals per dav Very frequent Frequent In-frequent Rare NeverReducing the quantity of food at each meal Very frequent i Frequent In-frequent I Rare NeverSelling livestock Very trequent Frequent In-frequent i Rare X NeverSelling other assets Verv frequent Frequent In-frequent E Rare i NeverLeavin- arisan Verv frequent Frequent In-frequent i Rare I NeverWithdrawinm children from school j Verv frequent E Frequent In-frequent j Rare | Never Sendine additional familv members to work Verv frequent i Frequent In-frequent | Rare NeverNot holding celebrations I Vet- frequent i Frequent In-frequent I Rare | Never !
____ Reducing contributions to celebrations Vetv frequent Frequent In-frequent I Rare Never |17 In the last year, have there been special programs in your Yes No
kecamatan to help people deal with the crisis'?18 If ves. what was the most widespread program? ...... I............................................19 How effective was this program in helping people affected E Very beneficial Somewhat Not beneficial
i___ - by the crisis'? beneficial i
20 Compared to August '97. the pnce of medium quality nce A lot Higher Slightly Same i Lowernow: higher | higher j
21 Compared to August '97. the number ot stores that are A lot RHiher ISlightly I Same Lowerclosed down now: higher | higher _ _ I__
22 Number ot' female students trom pnmarv class 3 that did not I A lot Higher Sli6htiv Same Lower !continue to class 4 for 1998/99 school year compared to I higher i higher1997/98 school vear: _ _
23 Number of male students from pnmary class 3 that did not A lot j Higher Slightly Same Lower i
continue to class 4 for 1998/99 school year compared to higher higher S1997/98 school year: _
24 Compared to the 1997198 school year, the number of female A lot Lower Slightly Same Higherstudents entering pnmarv class I in 1998/99 school vear: lower lower l
25 Compared to the 1997/98 school year. the number of male A lot Lower Slightly Same Higherstudents enterinn primary class I in 1998/99 school year: lower i lower l l
26 Compared to the 1996/97 school year. the number offemale I A lot 1 Higher Slightly Same Lowerstudents that dropped out during 1997/98 school year: higher i higher l l
27 Compared to the 1996/97 school year, the number of male A lot Higher Slightly Same Lowerstudents that dropped out during 1997/98 school year: higher higher-
28 Compared to the 1997/98 school year. the size of parents A lot Lower Slightly Same Highercontributions in 1998/99 school vear: lower lower '
29 Compared to the 1997/98 school vear, the attendance of A lot Lower Slightly Same Higherteachers in 1998/99 school vear: lower i lower I
30 P The number ol'students commm to school hungry ounng- -A lot Higher SliEhtly Same LowerJan-Aug 98 compared to Jan-Au2 9? higher I hieher !
31 Number ot' emale students from pnmary class 3 that did not 1998/99I continue to class 4 for 1998/99 school year and 1997/98 1997/98 j| school vear:
32 Number ot' male students from pnmarv class 3 that did not 1998/99 icontinue to class 4 for 1998/99 school year and 1997/98 1997/98school year:
33 Number of female students entering primarv class I in 1998/991998/99 school year and in 1997/98: 1997/98
34 Number of male students entering primary class I in 1998/991998/99 school year and in 1997/98: 1997/98
35 Number offemale students that dropped out during 1997/98 1997/98school year and during 1996/97: 1996/97
36 Number of male students that dropped out during 1997/98 1997/98school year and dunng 1996/97: 1996/97
V

Final Questionnaire: Public Health Center Doctor
= _ _ _ _ _ _ _ _ _ _ _ _ _ _ _ _ _ _ _ _ _ _ _ _ _ _ 2 3 4 51 Total number of male residents that returned to your A lot More Slightly Same Fewer
kecamatan during Jan-Aug '98 because they lost their jobs more moreelsewhere (compared to Jan-Aug '97)
2 Total number of female residents that returned to your A lot More Slightly Same Fewerkecamatan during Jan-Aug '98 because they Iost their jobs more moreelsewhere (compared to Jan-Aug 97) l _
3 Total number of male residents that have gone to a different A lot More Slightly Same Fewerkecamatan during Jan-Aug '98 to look for a job (compared more moreto Jan-Aug '97)
4 Total number of female residents that have gone to a A lot More Slightly Same Fewerdifferent kecamatan during Jan-Aug '98 to look for a job more more(compared to Jan-Aug '97) i _
5 Total number of residents replacing staples with lower A lot More Slightly Same Fewerquality foods (roots, feed. etc. during Jan-Aug '98 more morecompared to Jan-Aug '97 i
6 Total number of residents takintL on additional tasks and/or A lot More Slightly i Same Fewerworking longer hours during Jan-Aug '98 compared to Jan- more moreAug '97 _ ! l
7 Total number of residents selling assets (jewelrv, livestock. A lot More Slightly Same Fewerl TV, etc.) to meet daily needs during Jan-Aug '98 compared more more
|___ to Jan-Au2 '97 _ , I8 Total number of residents leaving arisans because they A lot More Slightly Same Fewer
cannot afford to participate during Jan-Aug '98 compared to more E moreJan-Aug '97 l
9 Compared to August '97. amount ot'f risan payout now A lot less Less Slightly Same Moret | = :~~~~~~~~~~~~~~~~~~ Less I
10 Number of religious/traditional celebrations during Jan-Aug A lot less Less Slightly Same MoreI '98 compared to Jan-Aug '9 7
l Less S MI I Contributions to religious/traditional celebrations dunng A lot less Less Slightly Same More
Jan-Aug '98 compared to Jan-Aug '97 l j | Less l j12 Availability of staple foods (rice, corn, etc.) in stores and A lot less Less Slightly I Same More
markets now compared to August '97 l Less1 3 Total number of residents that cannot afford to buy staple A lot More Slightly Same Fewer
foods (rice, corn, etc.) dunng Jan-Aug '98 compared to Jan- more morei _ <Aug '97 , _l_l_l14 Number of thefts and burglaries during Jan-Aug '98 T A lot More Slightly Same Fewer
compared to Jan-Aug '97 I more _ - more15 Below are a series of probiems that may be atfecting your kecamatan. Please rank them according to how severely they
are affecting your kecamatan X I= most senous: 2=second most senous: 3=third most serious. etc.)UnemploymentAvailabilitv of staple foods l_lStudents dropping out of schoolReduced incomes IIncreased crimeCrop failure l_lReduced health services j_j
HungerOther: .l.O ther: .......................
vi

16 Below are a series of possible ways residents in your kecamatan may be responding to the crisis. Please indicate theanswer that best describes the frequency of each response b residents in your kecamatan.Substituting lower quality foods for staple foods Very frequent Frequent In-frequent I Rare Never
Reducing the number of meals per day Very frequent Frequent In-frequent T Rare Never
Reducing the quantity of food at each meal Verv frequent Frequent In-frequent Rare Neveri Selling livestock Very frequent l Frequent In-frequent Rare Never
Selling other assets Verv frequnt Frequent qen I Rare i Never Ii Leaving arisan Very frequent I Frequent In-frequent Rare Never i
Withdrawing children from school Very frequent Frequent In-frequent Rare Never
Sending additional family members to work Very frequent Frequent In-frequent Rare Never [
Not holding celebrations Very trerequen Frequent In-frequent Rare i NeverReducing contributions to celebrations Very frequent j Frequent In-frequent Rare ! Never
17 In the last vear, have there been special programs in your Yes Nokecamatan to help people deal with the crisis? i
18 Ilf yes, what was the most widespread program'?18 i fys htwstems iepedporm?..................................................19 1 How effective was this program in helping peopie Very beneficial Somewhat Not beneficial
I affected by the crisis? beneficial20 Compared to August '97, the price of medium qualitv rice A lot higher Higher 1 Slightly Same Lower
now: higher' I
21 Compared to August '97. the number of stores that are A lot higher Higher Slightly Same Lowerclosed down now: ! _ hicher
22 Number of patients visiting the Puiskesmas during June- i A lot higher Higher Slightly I Same LowerAug '98 compared to June-Aug '97: i higher _ _;
'23 Number of patients visiting the biggest private clinic in A lot higher Higher Slightly 1 Same Lowerthe kecamatan during June-Aug '98 compared to June- higher
_ Aug'97:24 Compared to August '97. average price ot KB A lot higher Higher Slightly Same Lower
contraceptives now: higher
25 Compared to August '97, availability of KB A lot lower Lower Slightly Same Highercontraceptives at the Puskesmas now: lower
26 I Compared to August '97, total number of malnourished r A lot higher Higher Slightly Same Lower
children (<12 years) now: _ higher I _
27 Compared to August '97. total number of services offered A lot lower Lower Slightly Same Higherat the Puskesmas now: lower
28 1 Compared to August '97, availability of medicines and A lot lower Lower Slightly Same i Higheri other medical supplies now: _ lower j _
29 Compared to August '97. ability of patients to pay for A lot lower Lower Slightly Same Higher,medicines now: lower i _ l
30 Number of patients visiting the Puskesmas during June- June-August 1998 j
Aug '98 and '97 June-August 199731 Number of patients visiting the biggest pnvate clinic in June-August 1998 j
the kecmatan during June-Aug '98 and'97: June-August 1997
32 Number of malnourished children (<12 years) during Jan- ! Januarv-August 1998 !Aug '98 and'97: Januarv-August 1997
33 Number of KB users changing contraceptives because of Januarv-August 1998 l
j___ price changes during Jan-Aug '98 and '97: Januarv-August 1997'34 Price of the most frequently used contraceptive in your August 1998 l
kecamatan (specify: ............. ) in August '98 and '97 August 1997 i|__| (Rp/unit): l_l35 Price of parcetamol in your kecamatan in August '97 and August 1998 l
'97 (Rp/tablet): August1997
vii

Final Questionnaire: Representative Of Local Development Office
2 3 4 5
I Total number of male residents that retumed to your A lot More Slightly Same Fewerkecamatan during Jan-Aug '98 because they lost their jobs more moreelsewhere (compared to Jan-Aug '97) i
2 e Total number offemale residents that returned to your A lot More Slightly Same Fewerkecamatan during Jan-Aug '98 because thev lost their jobs more moreelsewhere (compared to Jan-Auc 97) ' i
3 Total number of male residents that have gone to a different A lot More Slightly Same Fewerkecamatan during Jan-Aug '98 to look tor a job (compared more moreto Jan-Aug '97) I
4 Total number offemale residents that have gone to a A lot More I Slightly Same Fewerdifferent kecamatan during Jan-Aug '98 to look for a job more more(compared to Jan-Aug '97) -I l
5 Total number of residents replacing staples with lower A lot More Slightly Same Fewerquality foods (roots, feed. etc.) during Jan-Aug '98 more morecompared to Jan-Aug '97 i _ _ _.
6 Total number of residents takine on additional tasks and/or A lot More Slightly Same Fewerworking longer hours during Jan-Aug '98 compared to Jan- more moreAu2 '97 !
7 I Total number of residents selling assets ijcweirv, livestock. A lot More Slightlv Same FewerTV, etc.) to meet daily needs durinn Jan-Aug '98 compared more moreto Jan-Aua '97 I ' -
8 Total number of residents leavine arisans because they A lot iMore Slightiv Same Fewer| cannot afford to participate during Jan-Aug '98 compared to I more more'| Jan-Au- '97 i
9 Compared to August '97, amount of arisan payout now A lot less Less Slightly Same More_ _ l__ _ _ _ _ _ _ _ _ _ _ _ _ _ _ _ _ _ _ _ _ _ _ _ _ _ _ _ _ _ _ _ _ _ _ _ _ _ L ess l_ I
10| Number of religious/traditional celebrations during Jar-Aug A lot less Less Slightly I Same More'98 compared to Jan-Aug 97 _ Less _
I I Contributions to relicious/traditional celebrations dufinn A lot less I Less Slightly | Same Morel ____ I Jan-Aug '98 compared to Jan-Aug 97 _ Less ! l _
12 Availability of staple foods (rice, corn, etc.) in stores and A lot less Less Slightly J Same Moremarkets now compared to August '97 _ Less _ _ _
13 Total number of residents that cannot afford to buy staple A lot More Slightly Same Fewer ifoods (rice. corn, etc. X durinn Jan-Aug '98 compared to Jan- more moreAug '97
14 Number of thefts and burglaries during Jan-Aug '98 A lot More Slightlv Same Fewercompared to Jan-Aug 97 more more
15 Below arc a sertes ot problems that may be attecting yotir kecamatan. Please rank them accordinLe to how severeiv theyare affectine your kecamatan I = most serious: 2=second most serious: 3=third most serious. etc.)UnemplovmentAvailabilitv of staple foodsStudents dropping out ot schoolReduced incomes ___
Increased crime I
Crop failure _
Reduced health servicesl Hunger
O ther: .................. !.IOther: .....................
viii

16 Below are a series of possible ways residents in your kecamatan may be responding to the crisis. Please indicate theanswer that best describes the frequencv of each response bv residents in your kecamatan.Substituting lower quality foods for staple foods Very frequent 1 Frequent In-frequent Rare NeverReducing the number of meals per da% Very frequent 1 Frequent In-frequent Rare I NeverReducing the quantity of food at each meal Very frequent Frequent In-frequent Rare Never
Selling livestock Very frequent i Frequent In-frequent Rare NeverSelling other assets Very trequent ! Frequent i In-frequent Rare Never
I Leavina ansan Very frcquent Frequent In-frequent Rare NeverWithdrawing children from school Verv frequent Frequent i In-frequent Rare i NeverSending additional family members to work Very frequent Frequent i In-frequent Rare I NeverNot holding celebrations Verv frequent r Frequent in-frequent Rare I Never
____ Reducing contributions to celebrations I Very frequent ! Frequent In-frequent | Rare I Never17 In the last year, have there been special programs in Yes No
your kecamatan to help people deal with the crisis?I18 If yes. what was the most widespread program9 i .............................................19 How effective was this program in helping people Very beneficial Somewhat Not beneticial
affected by the crisis? beneficial20- Compared to August '97, the price ot medium quaiity A lot higher Higher T Slightly' Same Lower
rice now: E higher2, Compared to August '97. the number of stores that are A lot higher Hieher i Slightlv Same Lower
closed down now: higher,22 Compared to August '97. quality ot neighborhood A lot lower I Lower Slightly Same Higher i
services icleaning) now: lower, 23 . Compared to August '97. number ot intormal sector A lot higher Higher Slightl Same Lower
workers (motorcvcle taxis, pedicabs. street sellers, higherprostitutes. etc.) now: !,
24 Compared to August '97, number of street children now: A lot higher Higher Slightly Same Loweri___ - I higher25 Number of stores closing in your kecamatan dunng Jan- ; Januarv-August 1998
2 Aug '98 and Jan-Aue 97: January-August 199726 Number of workers in the informal sector Imotorcycle August 1998
taxis, pedicabs. street sellers, prostitutes. etc.) in August August 199798 and August '97:
27 Number of child laborers (< 15 vears) in vour Augustl 1998kecamatan in August '98 and Au'gust '97: . August 1997
28 i Number of street children in your kecamatan during August 1998 l
Aueust '98 and August '97: August 199729 Number of thefts in your kecamatan uunng Jan-Aug '98 January-August 1998 |
Iand Jan-Aug '97: January-August 19973O I Number ot' households in vour kccamatan that cannot January-August 1998
afford staple foods trice, corn. etc. l dunng Jan-Aug 98 January-August 1997and Jan-Aug 97:
31 Number of residents applying tor poserty certiticates in January-August 1998 !
vour kecaniatan durin2 Jan-Auo '98 and Jan-Aug '97: Januarv-Augoust 199732 Number of requests for permits to open a new business January-August 1998
dunng Jan-Aug '98 and Jan-Aug '97: January-August 1997
ix

APPENDIX 2: INTER-CODER RELIABILITY.
Although responses from different respondents in the same kecamatan will nevercompletely coincide, a large amount of within-kecamatan variation relative to that foundto exist between kecamatans will indicate a level of noise (as opposed to signal) in theresponse patterns that calls for caution in interpreting summary indicators at thekecamatan level.
To be able to compare values of the phenomena being measured, we shoulddetermine the degree to which responses from the three groups of respondents are thesame. This internal reliability testing was carried out in the following ways:
a) testing the degree of correlation among each of the three respondents on each of thecommon questions;
b) decomposing the total variance into that across coders (respondents) and acrosskecamatan; and
c) an analysis of systematic differences in central tendencv across the three type ofrespondents.
Results of various measures of internal reliability test are presented in Table 2-1.Table 2-2, and Table 2-3. Table 2-1 shows correlation coefficients between each of thethree respondents on each of the common questions (except for Question 15) Table 2-2applies one-way ANOVA to break down between- and within-kecamatan cont:ibutions tovariance. Table 2-3 shows average response deviations within kecamatan, the sum of theabsolute differences of responses within each kecamatan divided by the total number ofkecamatans.

Table 2-1. Correlations by Type of Respondent
(Common Questions: 1-14,16,20,21)
0. 1 - Change in males returning to kecamatan due to loss of workRespondent Type No. of
Civil | Health Educ. CasesUrban Resp. Civil 1.000 0.464 0.479 613
Type Health 0.464 1.000 0.415 613
Educ. 0.479 0.415 1.000 613
Respondent Type No. ofAgric. Health Educ. Cases
Rural Resp. Agric. 1.000 0.441 0.435 3023Type Health 0.441 1.000 0.466 3023
Educ. 0.435 0.466 1.000 3023
Q. 2 - Change in females returning to kecamatan due to loss of workRespondent Type No. of
Civil Health Educ. CasesUrban Resp. Civil 1.000 0.389 0.348 613
Type Health 0.389 1.000 0.372 613
Educ. 0.348 0.372 1.000 613
_________ l___l__l_ Respondent Type No. of
Agric. 1 Health Educ. Cases
Rural Resp. Agric. 1.000 0.386 0.370 3023
Type Health 0.386 1.000 0.403 3023
Educ. 0.370 0.403 1.000 3023
I ~~~~~~~~~~~~~~~~~~~~~~~~~~~~~~~~~~~~~~~~~~~~~~~~~~~~IQ. 3 - Change in males leaving kecamatan to find work
Respondent Type l_l_*_No. ofCivil Health Educ. Cases
Urban Resp. Civil 1.000 0.298 0.275 613Type Health 0.298 1.000 0.266 613
Educ. 0.275 0.266 1.000 613
Respondent Type No. of
Agric. 1 Health Educ. Cases
Rural Resp. Agric. 1.000 1 0.272 0.297 3023Type Health 0.272 1.000 0.318 3023
Educ. 0.297 0.318 1.000 3023
..

0. 4 - Change in females leaving kecamatan to find workI_____ L Respondent Type No. of
Civil Health Educ. CasesUrban Resp. Civil 1.000 0.281 0.247 613
Type Health 0.281 1.000 0.229 613Educ. 0.247 0.229 1.000 613
Respondent Type No. ofAgric. Health Educ. Cases
Rural Resp. Agric. 1.000 0.250 0.267 3023Type Health 0.250 1.000 0.294 3023
Educ. 0.267 0.294 1.000 3023
Q. 5 - Change in population decreasing quality of intake of basic foodRespondent Type No. of
Civil Health Educ. CasesUrban Resp. Civil 1.000 0.273 0.369 613
Type Health i 0.273 1.000 0.280 613Educ. 0.369 0.280 1.000 613
I I_ _ __
j_____ ____Respondent Type i No. ofAgric. Health Educ. | Cases
Rural Resp. Agric. 1.000 0.264 0.298 3023Type Health 0.264 1.000 0.290 i 3023
Educ. 0.298 0.290 1.000 3023
0. 6 - Change in population working at more jobs/longer hoursRespondentType No. of
I________ T________ T. ICivil Health Educ. 1 CasesUrban Resp. Civil i 1.000 0.327 0.272 | 613
Type T Health |0.327 1.000 0.262 61Educ. 0.272 0.262 1.000 613
_________ _________ Respondent Type No. of|_______ |________ Agric. Health Educ. Cases
Rural Resp. Agric. 1.000 0.264 0.261 3023Type Health 0.264 1.000 0.277 3023
Educ. 0.261 0.277 1.000 3023
I I I . I~~~~~~11

Q. 7 - Change in population selling household goods to meet basic needsRespondent Type | No. of
Civil I Health Educ. Cases
Urban Resp. Civil 1.000 0.290 0.329 613Type Health 0.290 1.000 0.300 613
Educ. 0.329 0.300 1.000 613
{ Respondent Type No. ofI Agric. 7 Health Educ. Cases
Rural Resp. Agric. 1.000 i 0.384 0.358 3023Type Health 0.384 1 1.000 0.378 3023
Educ. 0.358 1 0.378 1.000 1 3023
0. 8 - Change in population leaving arisan due to lack of moneyRespondent Type l l No. of
Civil Health Educ. | CasesUrban Resp. Civil 1.000 0.239 0.245 613
Type Health 0.239 1.000 0.210 613Educ. 0.245 0.210 1.000 613
Respondent Type No. ofAgric. Health Educ. Cases
Rural Resp. Agnc. 1.000 0.288 0.273 3023Type Health j 0.288 1.000 0.280 3023
Educ. 0.273 0.280 1.000 3023
0. 9 - Change in turnover of arisan|_______ I Respondent Type No. of
Civil Health Educ. CasesUrban Resp. Civil 1 t.000 0.226 0.313 613
Type Health 0.226 1.000 0.193 6138 | ~~~Educ. 0.313 0.193 1.000 1613
l j ~~~~~Respondent Typ No. of________ I ________Agric. Health Educ. Cases
Rural_ | Resp. Agric. 1.000 0.293 0.274 3023| Type Health 0.293 1 .000 0.280 3023
Educ. 0.274 0.280 1.000 3023
lv

a. 10 - Change in level of community activities/celebrationsRespondent Type No. of
Civil Health Educ. CasesUrban Resp. Civil 1.000 0.215 0.237 613
Type Health 0.215 1.000 0.161 613
Educ. 0.237 0.161 1.000 613
Respondent Type No. ofAgric. Health Educ. Cases
Rural Resp. Agric. 1 .000 0.315 0.306 3023Type Health ] 0.315 1.000 0.307 3023
Educ. 0.306 0.307 1.000 3023
0. 11 - Change in level of community contributionsI______ L:_____ | Respondent Type _ No. of
Civil Health Educ. CasesUrban Resp. Civil 1.000 0.233 0.312 613
Type Health 0.233 1.000 0.224 613Educ. 0.312 0.224 1.000 613
= ________ = _______ =Respondent Type No. ofAgric. Health Educ. Cases
Rural Resp. Agric. 1.000 0.304 0.312 3023
Type Health 0.304 1.000 0.332 3023
Educ. 1 0.312 0.332 1.000 3023
Q. 12 - Change in availability of basic foods|_____ 1 Respondent Type { No. of
Civil Health Educ. Cases
Urban Resp. Civil 1.000 0.210 0.236 613Type Health 0.210 1.000 0.219 613
Educ. 0.236 0.219 1.000 613
|_______ _Respondent Type No. of_________ |________ _________ Agric. Health Educ. Cases
Rural Resp. Agric. 1.000 0.274 0.295 3023| Type Health 0.274 1.000 0.265 3023
Educ. 0.295 0.265 1.000 3023
v

Q. 13 - Change in ability to purchase basic foodsRespondent Type No. of
Civil Health Educ. CasesUrban Resp. Civil 1.000 0.263 0.301 613
Type Health 0.263 1.000 0.317 613Educ. 0.301 0.317 1.000 613
Respondent Type No. ofAgric. Health Educ. Cases
Rural Resp. Agric. 1.000 0.343 0.327 3023Type Health 0.343 1.000 0.360 3023
Educ. 0.327 0.360 1.000 3023
Q. 14 - Change in incidende of theftRespondent Type No. of
Civil 1 Health Educ. CasesUrban Resp. Civil 1.000 0.263 0.301 613
Type Health 0.263 1.000 0.317 i 613Educ. 0.301 0.317 1.000 1 613
Respondent Type | No. ofAgnc. Health Educ. Cases
Rural Resp. Agric. 1.000 0.343 0.327 3023Type Health 0.343 1.000 0.360 3023
Educ. 0.327 0.360 1.000 3023
0. 16-1 - Response: Consume less expensive foodRespondent Type | No. of
Civil Health Educ. CasesUrban Resp. Civil 1.000 0.321 0.373 613
Type Health i 0.321 1.000 0.295 613Educ. 0.373 0.295 1.000 613
_ _ _i _ I i__ __ _ _ _
Respondent Type j No. ofAgric. Health Educ. I Cases
Rural Resp. Agric. 1.000 0.359 0.388 3023Type Health 0.359 1.000 0.372 3023
Educ. 0.388 0.372 1.000 3023
vi

0. 16-2 - Response: Eat less frequentlyI
Respondent Type No. of.________ _________ Civil Health Educ. Cases
Urban Resp. Civil 1.000 0.207 0.352 613Type Health 0.207 1.000 0.316 613
Educ. 0.352 0.206 1.000 613
Respondent Type No. ofI Agric. Health Educ. Cases
Rural Resp. Agric. 1.000 0.328 0.339 3023Type Health 0.328 1.000 0.306 3023
Educ. 0.339 0.306 1.000 3023
0. 16-3 - Response: Decrease quality of food consumption| Respondent Type No. of________ i Civil f Health Educ. Cases
Urban Resp. Civil 1.000 0.278 0.301 613_________ Type Health 0.278 1.000 0.256 X 13
Educ. T 0.301 0.256 1.000 613
Respondent Type No. ofAgric. Health Educ. Cases
Rural Resp. Agric. 1.000 0.313 0.337 3023Type Health 0.313 1.000 0.338 3023
Educ. 0.337 0.318 1.000 3023
0. 16-4 - Response: Sell livestockj______ I _RespondentType No. of
_________ |________ Civil Health Educ. CasesUrban Resp. Civil 1.000 0.443 0.381 F 613
Type Health 0.443 1.000 0.396 613Educ. ! 0.381 0.396 1.000 613
Respondent Type | No. ofAgric. Health Educ. Cases
Rural Resp. Agric. 1.000 0.332 0.369 3023Type Health 0.332 1.000 0.340 3023
Educ. 0.369 0.340 1.000 3023
vii

Q. 16-5 - Response: Sell household assets|______ |______ Respondent Type No. of
Civil Health Educ. CasesUrban Resp. Civil 1.0000 0.327 0.260 613
Type Health 1 0.327 1.000 0.279 613Educ. 0.260 0.279 1.000 613
Respondent Type No. ofAgric. | Health Educ. Cases
Rural Resp. Agric. 1.000 0.361 0.352 3023Type Health 0.361 1.000 0.336 3023
Educ. 0.352 0.336 1.000 3023
a. 16-6 - Response: Stop attending arisan
Responcent Type | No. ofCivil Health Educ. Cases
Urban Resp. Civil 1.0000 0.239 0.252 613Type Health 0.239 1.000 0.201 613
Educ. 0.252 0.201 1.000 613
Respondent Type No. ofjAgric. | Health Educ. Cases
Rural Resp. Agric. 1.000 0.300 0.285 3023I______ rType Health r 0.300 1.000 3023
l I | ~~~~~~Educ . 0.285 | 0.289 1.000 j3023
Q. 16-7 - Response: Take children out of schoolRespondent Type No. of
Civil Health Educ. CasesUrban Resp. Civil 1.0000 0.199 0.242 613
Type Health 0.199 1.000 0.140 613Educ. 0.242 0.140 1.000 613
Respondent Type No. ofj Agric. Health Educ. Cases
Rural Resp. Agric. 1.000 0.242 0.272 3023Type Health 0.242 1.000 0.246 3023
Educ. 0.272 0.246 1.000 3023
viii

0. 16-8 - Response: Increase number of family members workingRespondent Type No. of
Civil Health Educ. Cases
Urban Resp. Civil 1.0000 0.187 0.217 613Type Health 0.187 1.000 0.221 613
Educ. 0.217 0.221 1.000 613
|______ Respondent Type No. of_ Agric. Health Educ. Cases
Rural Resp. Agric. ! 1.000 0.254 0.230 3023
Type Health I 0.254 1.000 0.270 3023
Educ. 1 0.230 0.270 1.000 3023
0. 16-9 - Response: Decease participation in village activities/celebrationsRespondent Type I No. of
Civil Health Educ. CasesUrban Resp. Civil 1.0000 0.261 0.270 613
Type Health 0.261 1.000 0.263 613
Educ. 0.270 | 0.263 1.000 613
I______ |_____ I Respondent Type No. of_________ Agric. F Health Educ. Cases
Rural Resp. Agric. 1.000 0.268 0.271 3023
Type Health 0.268 1.000 0.290 3023Educ. 0.271 0.290 1.000 3023
Q. 16-10 - Response: Decrease contributions to village activites/celebrationsRespondent Type j No. of
Civil | Health Educ. CasesUrban Resp. Civil 1.0000 0.356 0.254 + 613
| Type Health 0.356 1.000 0.268 613
Educ. 0.264 0.268 1.000 613
Respondent Type No. ofAgric. Health Educ. Cases
Rural Resp. Agric. 1.000 0.273 0.282 3023
Type Health 0.273 1.000 0.293 3023
Educ. 0.282 0.293 1.000 3023
lx

0. 20 - Change in price ot medium quality riceRespondent Type No. of
Civil Health Educ. CasesUrban Resp. Civil 1.0000 0.243 0.208 613
Type Health 0.243 1.000 0.161 613Educ. 0.208 0.161 1.000 613
Respondent Type No. ofAgric. Health Educ. Cases
Rural Resp. Agric. 1.000 0.259 0.268 3023Type Health 0.259 1.000 0.248 3023
Educ. 0.268 0.248 1.000 3023
G. 21 - Change in number of stores going out of businessRespondent Type No. of
Civil Health Educ. CasesUrban Resp. Civil 1.0000 0.169 0.251 613
Type Health 0.169 1.000 0.223 613Educ. 0.251 0.223 1.000 613
Respondent Type No. ofAgric. Health Educ. Cases
Rural Resp. Agric. 1.000 0.264 0.249 3023Type Health 0.264 1.000 0.265 3023
Educ. 0.249 0.265 1 .000 3023
x

Table 2-2. Analysis of Variance by Type of Respondent Across Kecamatan
: __________________________ (Common Questions: 1-14, 16, 20,_21)
0. 1 - Change in males returning to kecamatan due to loss of workSum of Mean
Squares df Square F Sig.
Urban Between 983.000 612 1.606 3.483 0.000Within 565.333 1226 0.461Total 1548.333 1838
Sum of MeanSquares df Square F Sig.
Rural Between 4472.238 3022 1.480 3.419 0.000Within 2617.333 6046 0.433Total 7089.571 9068
0. 2 - Change in females returning to kecamatan due to loss of workSum of MeanSquares df Square F Sig.
Urban Between 957.176 612 1.594 2.755 0.000VWithin 696.000 1226 0.598Total 1653.176 1838
Sum of MeanSquares df Square F Sig.
Rural Between 4558.805 3022 1.509 2.881 0.000Within 3166.000 6046 0.4524Total 7724.805 9068
0. 3 - Change in males leaving kecamatan to find workSum of Mean
______ Squares df Square F Sig.Urban Between 871.657 612 1.424 2.165 0.000
Within 806.667 1226 0.658Total 1678.324 1838
Sum of MeanSquares df Square F Sig.
Rural Between 4295.011 3022 1.421 2.252 0.000Within 3815.333 6046 0.631Total 8110.344 9068
xi

0. 4 - Change in females leaving kecamatan to find workSum of Mean
Squares df Square F Sig.
Urban Between 685.859 612 1.121 2.007 0.000Within 684.667 1226 0.558Total 1370.526 1838
Sum of MeanSquares df Square F Sig.
Rural Between 3392.975 3022 1.123 2.101 0.000
Within 3230.667 6046 0.534Total 6623.642 9068
0. 5 - Change in population decreasing quality of intake of basic foodSum of Mean
Squares df Square F Sig.
Urban Between 677.145 612 1.106 2.297 0.000
Within 590.667 1226 0.482Total 1267.812 1838
Sum of MeanSquares df Square F Sig.
Rural Between 3268.997 3022 1.082 2.161 0.000
Within 3026.667 6046 0.501Total 6295.664 9068
0. 6 - Change in population working at more jobs/longer hoursSum of MeanSquares df Square F Sig.
Urban Between 848.837 612 1.387 2.201 0.000
Within 772.667 1226 0.630Total 1621.504 1838
Sum of MeanSquares df Square F Sig.
Rural Between 3679.304 3022 1.218 2.095 0.000
Within 3513.333 6046 0.581Total 7192.637 9068
xii

Q. 7- Change in population selling household goods to meet basic needsSum of MeanSquares df Square F Sig.
Urban Between 892.231 612 1.458 2.323 0.000Within 769.333 1226 0.628Total _ 1661.564 1838 __
Sum of MeanSquares df Square F Sig.
Rurai Between 4856.299 3022 1.607 2.747 0.00Within 3536.667 6046 0.585Total 8392.966 9068
0. 8 - Change in popuiation leaving arisan due to lack of money
Sum of MeanSquares df Square F Sig.
Urban Between 722.226 612 1.18 1.894 0.000Within 764.000 1226 0.623Total 1486.226 1838
Sum of MeanSquares df Squart F Sig.
Rurai Between 3558.074 3022 1.177 2.145 0.000Within 3319.333 6046 0.549Total 6877.407 9068
Q. 9 - Change in turnover of arisanSum of MeanSquares df - Square F Sig.
Urban Between 604.129 612 0.987 1.944 0.000Within 622.667 1226 0.508Total 1226.796 1838
Sum of MeanSquares df Square F Sig.
Rural Between 3581.126 3022 1.185 2.156 0.000Within 3322.667 6046 0.550Total 6903.793 9068
xiii

0. 10 - Change in level of community activities/celebrationsI Sumof Meani Squares df Square F Sig.
Urban Between 540.813 612 0.884 1.770 0.000
Within 612.000 1226 0.499
Total 1152.813 1838
Sum of MeanSquares df Square F Sig.
Rural Between 3516.648 3022 1.164 2.328 0.000
Within 3022.000 6046 0.500Total 6538.648 9068
0. 11 - Change in level of community contributionsSum of MeanSquares df Square F Sig.
Urban Between 613.998 612 1.003 2.043 0.000
Within 602.000 1226 0.491Total 1215.998 1838
Sum of MeanSquares df Square F Sig.
Rural Between 3668.971 3022 1.214 2.367 0.000
Within 3100.667 6046 0.513Total 6769.638 9068
0. 12 - Change in availability of basic foodsSum of MeanSquares df Square F Sig.
Urban Between 582.359 612 0.952 1.852 0.000
Within 630.000 1226 0.514Total 1212.359 1838
Sum of MeanSquares df Square F Sig.
Rural Between 3236.070 3022 1.071 2.124 0.000
Within 3048.667 6046 0.504Total 6284.737 9068
xiv

0. 13 - Change in ability to purchase basic foodsSum of MeanSquares df Square F Sig.
Urban Between 845.916 612 1.382 2.214 0.000Within 765.333 1226 0.624Total 1611.249 1838
Sum of MeanSquares df Square F ig.
Rural Between 4677.225 3022 1.548 2.510 0.000Within 3728.000 6046 0.617Total 8405.225 9068
Q. 14 - Change in incidence of theftSum of MeanSquares df Square F Sig.
Urban Between 604.324 612 0.987 2.054 0.000Within 589.333 1226 0.481Total 1193.657 1838 ____= __
Sum of MeanSquares df Square F Sig.
Rural Between 4006.293 3022 1.326 2.883 0.000Within 2780.000 6046 0.460Total 6786.293 9068 - = _
Q. 16-1 - Response: Consume less expensive foodSum of MeanSquares df Square F Sig.
Urban-1- Between 1455.557 612- 2.378 2.439 0.000Within 1195.333 1226 0.975Total 2650.890 1838
Sum of MeanSquares df Square F Sig.
Rural Between 7886.046- 3022 2.610 2.760 0.000Within 5716.000 6046 0.945Total 13602.046 9068
xv

0. 16-2 - Response: Eat less frequentlySum of Mean
Squares df Square F Sig.Urban Between 1182.935 612 1.933 2.212 0.000
Within 1071.333 1226 0.874Total 2254.268 1838
Sum of MeanSquares df Square F Sig.
Rural Between 6461.995 3022 2.138 2.401 0.000Within 5384.000 6046 0.891Total 11845.995 9068
0. 16-3 - Response: Decrease quality of food consumptionSum of MeanSquares df Square F Sig.
Urban Between 1097.637 612 1.794 2.108 0.000Within 1 043.333 1226 0.851Total 2140.970 1838
Sum of Mean=___________ Squares df Square F Sig.
Rural Between 6361.067 3022 2.105 2.457 0.000Within 5180.000 6046 0.857Total 11541.067 9068
0. 16-4 - Response: Sell livestockSum of Mean
Squares df Square F Sig.Urban Between 1644.189 612 2.687 3.054 0.000
Within 1078.667 1226 0.880Total 2722.856 1838
Sum of MeanSquares df Square F Sig.
Rural Between 5890.074 3022 1.949 2.594 0.000Within 4543.333 6046 0.751Total 10433.407 9068
xvi
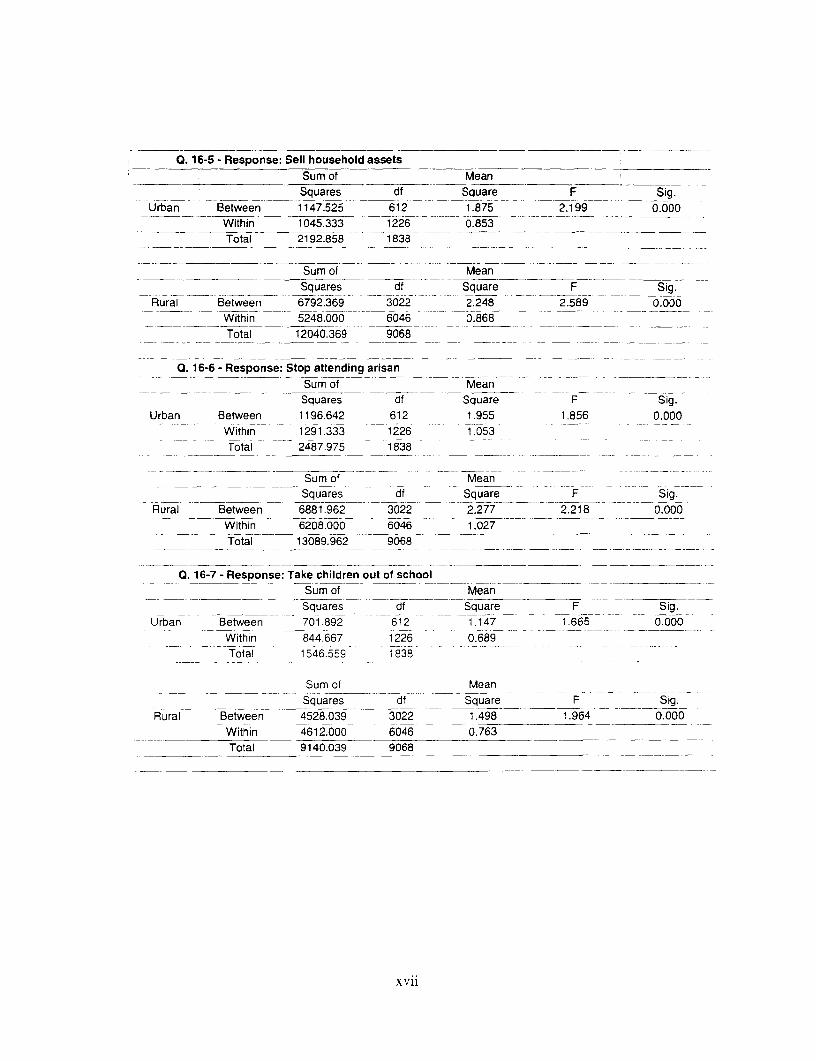
Q. 16-5 - Response: Sell household assetsSum of MeanSquares df Square F Sig.
Urban Between 1147.525 612 1.875 2.199 0.000Within 1045.333 1226 0.853Total 2192.858 1838
Sum of MeanSquares df Square F Sig.
Rural Between 6792.369 3022 2.248 2.589 0.000Within 5248.000 6046 0.868Total 12040.369 9068 -- -0 _ - =__
0. 16-6 - Response: Stop attending arisanSum of MeanSquares df Square F Sig.
Urban Between 1196.642 612 1.955 1.856 0.000Within 1291.333 1226 1.053Total 2487.975 1838
Sum of MeanSquares df Square F Sig.
Rural Between 6881.962 3022 2.277 2.218 0.000Within 6208.000 6046 1.027Total 13089.962 9068
Q. 16-7 - Response: Take children out of schoolSum of MeanSquares df Square F Sig.
Urban Between 701.892 612 1.147 1.665 0.000Within 844.667 1226 0.689Total - 1546.559 1 838
Sum of MeanSquares df Square F Sig.
Rural Between 4528.039 3022 1.498 1.964 0.000Within 4612.000 6046 0.763Total 9140.039 9068 _ __ X __ -
xvii

Q. 16-8 - Response: Increase number of family members workingSum of MeanSquares df Square F Sig.
Urban Between 1017.586 612 1.663 1.787 0.000Within 1140.667 1226 0.930Total 2158.253 1838
Sum of MeanSquares df Square F Sig.
Rural Between 5455.004 3022 1.805 2.003 0.000Within 5448.000 6046 0.901Total 10903.004 9068
Q. 16-9 - Response: Decease participation in village activitiesicelebrationsSum of MeanSquares df Square F Sig.
Urban Between 1305.367 612 2.133 2.069 0.000Within 1264.000 1226 1.031Total 2569.367 1838
Sum of MeanSquares df Square F Sig.
Rural Between 6770.302 3022 2.240 2.141 0.000Within 6325.333 6046 1.046Total 13095.635 9068
0. 16-10 - Response: Decrease contributions to village activiteslcelebrationsSum of MeanSquares df Square F Sig.
Urban Between 1279.333 612 2.090 2.222 0.000Within 1153.333 1226 0.941Total 2432.666 1838
Sum of MeanSquares df Square F Sig.
Rural Between 6475.869 3022 2.143 2.175 0.000Within 5957.333 6046 0.985Total 12433.202 9068
xviii

a. 20 - Change in price of medium quality riceSum of MeanSquares df Square F Sig.
Urban Between 511.899 612 0.836 1.748 0.000Within 586.667 1226 0.479Total 1098.566 1838
Sum of MeanSquares df Square F Sig.
Rural Between 2873.018 3022 0.951 2.038 0.000Within 2820.000 6046 0.466Total 5693.018 9068
Q. 21 - Change in number of stores going out of businessSum of Mean
Squares df Square F Sig.Urban Between 802.191 612 1.311 1.812 0.000
Within 886.667 1226 0.723Total 1688.858 1838
Sum of MeanSquares df Square F Sig.
Rural Between 3557.294 3022 1.177 2.035 0.000Within 3497.333 6046 0.578Total 7054.627 9068
xix
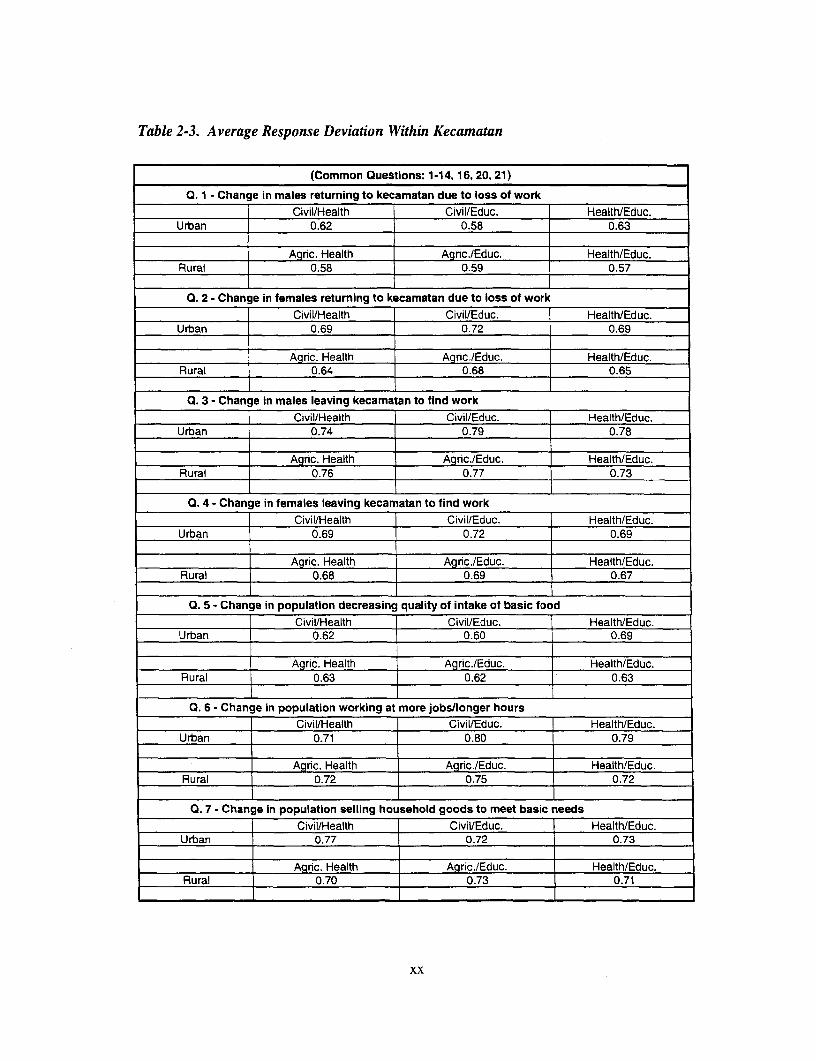
Table 2-3. Average Response Deviation Within Kecamatan
(Common Questions: 1-14, 16, 20, 21)
0. 1 - Change in males returning to kecamatan due to loss of workCivil/Health Civil/Educ. Health/Educ.
Urban 0.62 0.58 0.63
_________ Agc. Health Agric./Educ. Health/Educ.Rural 0.58 0.59 0.57
0. 2 - Change in females returning to kecamatan due to loss of workCivil/Health Civil/Educ. Health/Educ.
Urban 0.69 0.72 0.69
Aganc Health Aanc./Educ. Health/Educ.Rural 0.64 0.68 0.65
0. 3 - Change in males leaving kecamatan to find workCivil/Heaith Civil/Educ. Health/Educ.
Urban 0.74 0.79 0.78
Agric. Health Agric./Educ. Health/Educ.Rural 0.76 0.77 0.73
0. 4 - Change in females leaving kecamatan to find work|_______ Civil/Health Civil/Educ. Health/Educ.
Urban 0.69 0.72 0.69
L______ Agric. Health Agnc./Educ. Health/Educ.Rural 0.68 0.69 0.67
0. 5 - Change in population decreasing quality of intake of basic food__________________ 7Civil/Health Civil/Educ. Health/Educ.
Urban 0.62 0.60 0.69
Agric. Health Agnc./Educ. Health/Educ.Rural 0.63 0.62 0.63
0. 6 - Change in population working at more jobs/longer hoursCivil/Health Civil/Educ. Health/Educ.
Urban 0.71 0.80 0.79
Agric. Health Agric./Educ. Health/Educ.Rural 0.72 0.75 0.72
0. 7 - Change in population selling household goods to meet basic needs________ Civil/Health Civil/Educ. Health/Educ.
Urban 0.77 0.72 0.73
Agric. Health Agric.Educ. Health/Educ.Rural 0.70 0.73 0.71
xx
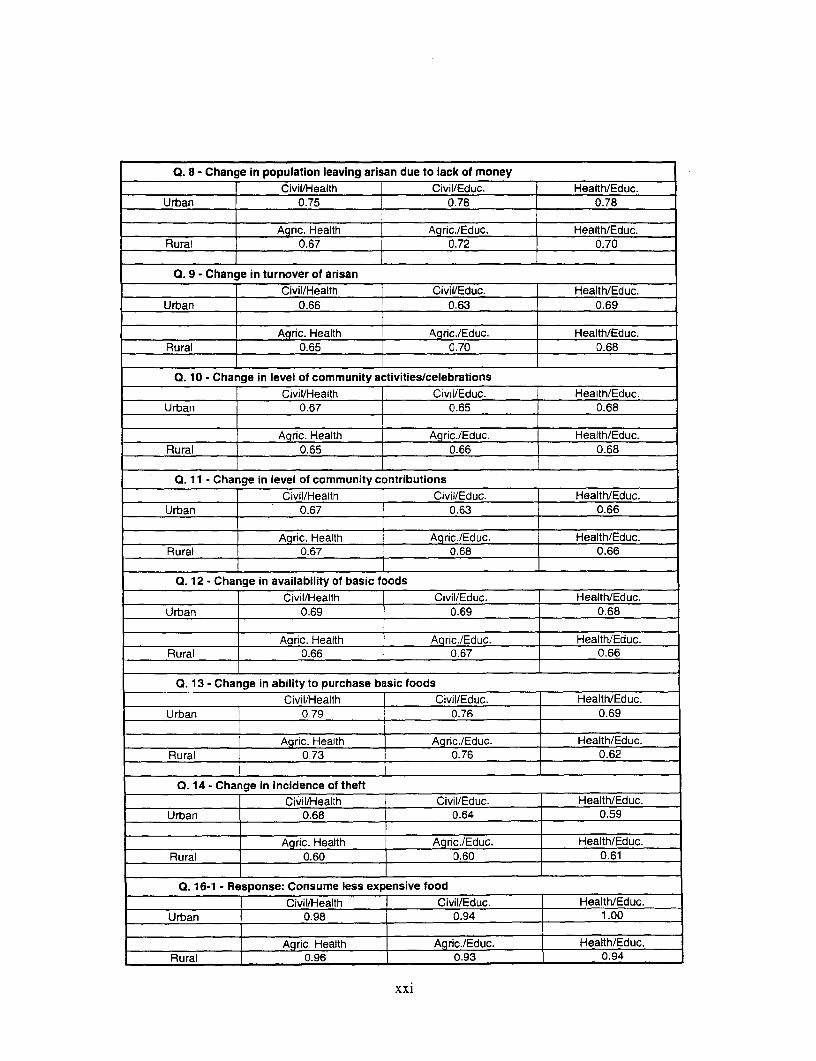
Q. 8 - Change in population leaving arisan due to lack of moneyCivil/Health Civil/Educ. HealthiEduc.
Urban 0.75 0.78 0.78
Agnc. Health Agric./Educ. Health/Educ.Rural 0.67 0.72 0.70
0. 9 - Change in turnover of arisanCivil/Health CiviVEduc. Health/Educ.
Urban 0.66 0.63 0.69
_______A__c__ . Health Agrnc./Educ. Health/Educ.Rural 0.65 0.70 0.68
0. 10 - Change in level of community activities/celebrationsCivil/Health Civil/Educ. Health/Educ.
Urban 0.67 0.65 0.68
Agric. Health Agnc./Educ. Health/Educ.Rural 0.65 0.66 0.68
0. 11 - Change in level of community contributions
I 0 Civil/Health Civil/Educ. Health/Educ.Urban 0.67 0.63 0.66
Aqnc. Health Agric./Educ. Health/Educ.Rural 0.67 0.68 0.66
0. 12 - Change in availability of basic foodsCivil/Health Civil/Educ. Health/Educ.
Urban 0.69 0.69 0.68
Agric. Health Agric/Educ. Health/Educ.Rural 0.66 0.67 0.66
0. 13 - Change in ability to purchase basic foods|_______ Civil/Health Civil/Educ. Health/Educ.
Urban 0.79 0-76 0.69
Agric. Health Agric./Educ. Health/Educ.Rural 0.73 0.76 0.62
0. 14 - Change in incidence of theftCivil/Health Civil/Educ. Health/Educ.
Urban 0.68 0.64 0.59
Agnc. Health Agric./Educ. Health/Educ.Rural 0.60 0.60 0.61
Q. 16-1 - Response: Consume less expensive food
CivilHealth Civil/Educ. HealthlEduc.Urban 0.98 0.94 1.00
l_______ Agric. Health Agric./Educ. Health/Educ.Rural 0.96 0.93 0.94
xxi
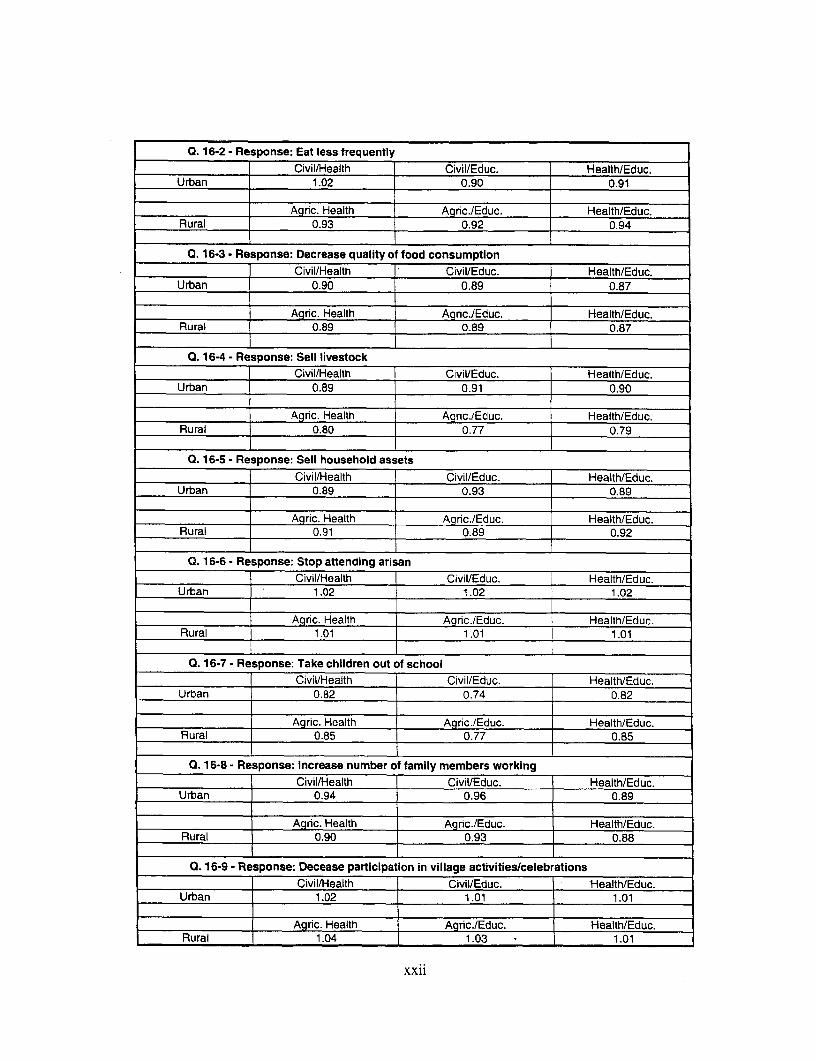
0. 16-2 - Response: Eat less frequently__________________ Civil/Health Civil/Educ. Health/Educ.Urban 1.02 0.90 0.91
Agric. Health Aqric.lEduc. Health/Educ.Rural 0.93 _ 0.92094
0. 16-3 - Response: Decrease quality of food consumption
Civil/Health Civil/Educ. Health/Educ.Urban 0.90 0.89 0.87
Agric. Health Agnc./Educ. Health/Educ.Rural 0.89 0.89 0.87
0. 16-4 - Response: Sell livestockCivil/Health Civil/Educ. Health/Educ.
Urban 0.89 0.91 0.90
Agrnc. Health Agnc./Educ. Health/Educ.Rural 0.80 0.77 0.79
0. 16-5 - Response: Sell household assetsCivil/Health _ Civil/Educ. Health/Educ.
Urban 0.89 0.93 0.89
Agric. Health Agric.lEduc. Health/Educ.Rural 0.91 0.89 0.92
0. 16-6 - Response: Stop attending arisanCivil/Health Civil/Educ. Health/Educ.
Urban 1.02 1.02 1.02
Agric. Health Agnc./Educ. Health/Educ.Rural 1.01 1.01 1.01
0. 16-7 - Response: Take children out of schoolCivillHealth CivillEduc. Health/Educ.
Urban 0.82 0.74 0.82
Agric. Health Agnc./Educ. Health/Educ.Rural 0.85 0.77 0.85
Q. 16-8 - Response: Increase number of family members workingCivil/Health Civil/Educ. Health/Educ.
Urban 0.94 0.96 0.89
Agric. Health Agric./Educ. Health/Educ.Rural 0.90 0.93 0.88
C0. 16-9 - Response: Decease participation in village activities/celebrationsCivil/Health Civil/Educ. L Health/Educ.
Urban 1.02 1.01 1.01
Agric. Health Agric./Educ. Health/Educ.Rural 1.04 1.03 1.01
xxii

Q. 16.10 - Response: Decrease contributions to village activites/celebrationsCivil/Health Civil/Educ. Health/Educ.
Urban 0.90 0.98 0.95
Agric. Health Agnc./Educ. Health/Educ.Rural 1.00 0.98 0.96
0. 20 - Change in price ot medium quality riceCivil/Health Civil/Educ. Health/Educ.
Urban 0.63 0.67 0.65
Agnc. Health Agrnc./Educ. Health/Educ.Rural 0.61 0.63 0.63
0. 21 - Change in number of stores going out of businessCivil/Health Civil/Educ. Health/Educ.
Urban 0.84 0.79 0.82
Agric. Health Agric./Educ. Health;Educ.Rural 0.66 0.71 0.70
xxiii

Table 2-4. Variable Classification Typology
Depdik- Doktor Mantriue..t.hz Yrzye Ran= Mantri Tani bud Puskesnas PUO Stalstik Index
Food Secuntv
Avadabilito
Production
Harveat tailure Quan. 1- e I5- 0 is-I 015-f a.1t-I
Change if orodtficon of main food crop Dual 1-5 022
Change y yield of man cnn Oan. 0 27 0.339
Change in farm omflts Oual. 15 Q.24
Stock
Chanoei navaliabilito ofstapefoodn shops Oual 1-S Q 1 2 0 105 0 2 Ind-td
Fintfine stanle food M an I1-8 Q 1S- Q I S-h 01 Sr-h Q I S-b
Accessbility
Quantitv/Quality
Change in popU abon shifting Irom stapte to
lower quality of tood cornsumpoon Qual t-S CS QS 0. 05 0 5 Ind-fdPopulaton shifong from staple to lowerQUaltV OftDoo cornsumotion 0-1a .- 01fi-t Q1fi-1 Otf-1t 01R.1 InrlfdPopulabon reducing 1requer-cy of loodconsumption Oual 1-5 01616- 2 6-2 Q16-2 0,16-2 Ind-IdPopulabon reducing quaJtry of foodconsumption ateach meal Opial I- 01 tf-1 016.3 Ot6-t1 Qi3- Ind-idChange in popUabon unable to aflord staplefood Oual. 1-5 0 13 0 13 013 013 Inp-fdChange in poputason unable to afford staplelood Ouan. 0Q30
Hunger Ouan 1-8 0 15-h 015-h QtS-h 0 15-hChange in numbers ot children in SD comingto school hunor Qul 1-S 0t30 Ind-td
I Change in numer otmlonhdciden oi 506Idf
Change in numIfemas o malnounshed chidren Qt
Pnce
Chanae in mnce trasito qal3to in SD ual 1-5 0 Q2n n 090 02n Ind-tdChange in mnce ot nestium qualits 3ce tuan 0 3R O 324
Chanae in pinmce entraint anonnc 1ro inD -u 1-5 0 2 ln-ed
Change in male entrant classc tinp 0D Dua 0- 05lrd-
Access to ,Canc. in mal SrocusFdrrf.-nn
FnrollmentChange in flemale tranSioon class 3 to 4 in
SD Oual. 1-S Q.22 Ind-edu
Chance in fmale dransioon class 3 to 4 in SD Ouan 0 31 0 3127Change in male transion cass 3 to 4 m SD Qual 1-5 023 Ind-eduChange in mais transition class 3 to 4 in SD Quan. 0.32 Q.328
Chanae in female entrasnts class t in SO Oual. 1 5 n 24 rInd-edu
Change in temale enrtnants ass I in SD Ouan 0 3329
Changen drmae entgants class 1 in SD Qal. 1 - 0 25 0nd-edChancie in maie entrants class t in SO Ouan 0.34 Q.330
Chnlen drompng doutf sc hD Qual. 1-5 0 .726 Ind-eduChange in male dropouts in SD) Ouan. 0.35 Q.33t-
Change in fremale dnonouts on SD Qual. 1 -S Q 77 Ind-edu
Change in female dropouts in SD Quan. 0 36 Q M1-
Ch ldren drappinc out ofschool Ouan 1 -8 0,15-c Q.15-C 0 Q1 5-c Q. 15-c
Ch4ldren dronnom out of school Qual. 1-S 0Q16-7 Q.16-7 O.t6-7 0Q16-7 Ind-edu'
OtherChange in receipt ot parental schoolcontnibutons Dual 1 5 o 2a In
Change in attendance of teachers Qual. 1-5 029 Ind-edu
xxiv

Depdik- DoRtor Mantri_ _ V..ia Type Range Mantri Tani bud Puskesmaas Pun Stastik Inder
Health
AneiaisPility
Change in avaiabtity of contraceptives Oual 1. 0AP Ind-hitChanpe in availabli!y of basic medicines Dial 1Is 0 2R Ind-hitChange in avaiability of services atDuskesmas Qual 1-S 0 27 Ind-hitReducti n heealtiservels Ouan 1-8 0 15- 0Q15- Q 015 0 15-g
AccessChange in numbers ot patents visitngpuskesmas OUAI I S O2 I9nd-hitChsnge in numbers of patents visibtngDuskesmas Ouan a 30 O 334Change in numbers of patients visitinghosPital,Olvclmic ODual 1-5 0 23 Ind-htChange in numbers of patents visitingholstalotlDvclinic Duan 0 31 0 335
Af1ordabiatlkt
Change In nceat contraChtveS Oual 15 024 nd-hlt
Change in pricolcontrenaives Ouan, 0 34 0 338
Change in numbers shiftna contraceptive type O-ion 0 33 0 337Change in abihty to purchase basicmedicines OUAI 1 .5 O9 Ind-ht
rhange in pnre nl bas, maixtcin-s ir)an 315
Job and Income Saclinly
FmalavmentChange in numbers workng more fobs oraonger hours -al i-5 0 n 0 n R 0 aO a Ind-mChange in numbers of informal sector workers Oual 1-S c 23Change in numbers of informal sector workers Ouan 0 76Chanac in number of child workers Ol-rn C P7
Change in numbers of streel chidren Oual 1-5 024 Ind-amnChange in numbers of street chidren Ouan 0 7b 0 34!AMore family members workina Qual I- s 1a- rnd-emp
UInemnloymant Ouan 1iB 015-1 n) 15-I o) 1-1 o) 15-1Mobility
Change in movement back to kec. - male OUAI. 1-5 0 1 01 0 1 0 1 Ind-rmn
Change in movement back to kec. - female Oual 1-5 0 2 0 2 0 2 0 2 Ind-amp
Change in movement out ot kec. - male Oual 1-5 0 3 0 3 0 3 0 3 Ind-emn
Change in movement out of kec. -female Oual 1-5 04 04 0 4 0.4 Ind-nmp
PovertyChange in sating of animalskonsumer
durables D-AI 1 5 0 7 0 7 0 7 0 7 Ind-emp
SoIfing annmal Oul 1.5 n 10a4 01Q-4 Mi) 1A4 01fi-4 lnr-ems
SoI1ing nansimor iirrbl- 0-s OUrAI 1-S C) 15 010A- 01f.-S 01fi-5 Ind-mp
Change in numbers requesting poavertv lener O- n 0 31 0 347Change in numbers requesting pemmission to
open business Oran 037 0 348
I nss of inroma Ouan 1-H 0 15 S 01 c C) 15-d 015-d
Community ACtivitv/Partkip onon
rhange in naorinatian in arisan Oul 1-5 008 0 a 0 A 0 A Ind-cam
Dranaing alit ot aris-n Oual 1-5 01-I 0 010-A 1fi-f 016f Ind-cam
Change in volume ot arisen unds Oual 1-5 059 009 0 9 059 Ind-com
Change in frequency t oeremonies Oual 1-5 01n 0in pin 01D Ind-com
Reducing tre-rmncy nt ceramrni -u(lI 1-S 016-4 016-9 0 16-9 01-5 Ind-cam
Change in volume of supnort for ceremonies OMal 14- 0 11 011 0 ID11 Ind-com
Redioing ,pOnal tafr crarrmnias OUPI 1-5 i) 1a-1n 01s-in 01a-1i n 1a-1n nd-cam
Cnmmuni t Crnditions
Chanos in closure of small shops/stores O Pl 1-5 0 71 0 21 0 21 021 Ind-emP
Change in closure of small shops/stores Orran o 75
Chanae in commuritv uikee- actvity -.-I 1 RO-
Change in hnhidenCe af thrit Dal 15 0 14 0 14 0 14 014
Change in incidne at tlheft Mian 029 0 A340
Incidence ofatheffcnriminality Ouan 1-8 0 1 5-e 0 15- 0A5 0Q15-ie
xxv

APPENDIX 3: CONSTRUCTION OF AN INDEX
Appendix 3 lists all variables included in the survey and Tables 3-1 - 3-5 indicatethose that contributed to the construction of each index. Note that, due to relatively highlevels of non-response on many of the quantitative questions, we exclude those variablesfor index construction.
Five indices were constructed: an index of food availability/accessibility(IND_FD); an index of employment impact (IND_EMP); an index of education impact(IND-EDU); an index of health impact (IND_HLT); and an index of community impactand coping mechanisms (IND_COPT).
Tables 3-1 - 3-5 show results of the principal component analysis, and Table 3-6shows correlation matrix among the five indices. As can be seen from the tables, the firstthree best indices were IND_FD and IND_COPT, followed by IND_EMP. Variables infood availability/accessibility are strongly weighted toward those reflecting difficulties inpurchasing an adequate diet of staple foods. Variables in coping reflect community andindividual level adjustments (such as reduction in participation of community activitiesand selling of households assets).

Table 3-1. Principal Components AnalysisFood AvailabilitylAccesibility Index
Number of Valid Pairs After Pairwise Deletion
Variable T 0.05 0.12 1 0.13 0.16-1 0.16-2 0.16-3 0.20 0. 26/3 Q. 30/ 4
Q.05 37550.12 3755 37550.13 3755 3755 3755
0.16-1 3755 3755 3755 33550.16-1 3755 3755 3755 3755 3
0.16-3 3755 3755 1 3755 3755 3755 3755
0. 20 3755 3755 3755 3755 3755 3755 3755
0.26 /3 3716 3716 3716 3716 3716 3716 | 3716 3716
0.30/4 3727 3727 3727 3727 3727 3727 ] 3727 3727 3727
Correlation Matrix
Variable 0. 05 Q.12 0Q.13 Q.16-1 0 0.16-2 0 Q.16-3 0.20 0.26/3 0.30/4
0.05 1.00000
Q.12 0.20444 1.00000
0.13 0.32476 0.41191 1.00000 _ _
0.16-1 0.34684 0.21590 0.30579 1.00000
0.16-2 0.19708 0.23383 1 0.32547 0.46087 1 1.00000 I _
Q.16-3 0.20360 0.20532 0.30072 0.42504 0.50716 1.0000 1 _ _ _
C0.20 0.11503 0.22355 0.24408 0.13664 0.16645 0.21151 11.00000 l I0.26/3 0.10529 0.13899 1 0.16771 0.14382 0.13545 0.16128 1 0.11649 1.00000
0.30 /4 0.22554 | 0.16342 0.23814 ! 0.20599 0.20700 0.16175 0.14061 0.07561 1.00000
Final Statistics and Factor Matrix (Factors with Eigenvalue > 1.00)
Variable Communality i Factor Eigen-value Pct. of Factor MatrixVariance
Factor 1 Factor 2
0. 05 0.29255 1 2.99148 32.3 0.53538 0.07696
0.12 0.51952 4 2 1.05991 11.8 0.54712 0.469230.13 0.55486 0.67787 0.30879
0.1t6-1 0.61648 0.68407 -0.38539
0.16-2 0.64999 0.68745 -0.42119
0.16-3 0.60955 0.66839 -0.40399
0. 20 0.36236 0.41807 0.43310
0. 26/3 0.14045 0.32832 0.18071
0 Q.30/4T 0.22523 1 0.44286 3 0.17059
11

! ~~~~~~~~~Reproduced Correlation MatrixVariable Q. 05 0.12 0.13 0.16-1 0.16-2 0.16-3 0.20 0.26/3 0.30/4
0. 05 0.29255 -0.12459 -0.06192 0.01026 -0.13856 -0.12316 -0.14213 -0.08574 ! -0.02492
0.12 0.32903 0.51952 -0.10386 0.02247 0.05534 0.02919 -0.20841 -0.12439 -0.16226
0.13 0.38668 0.51577 0.55486 -0.03892 -0.01048 -0.02761 -0.17305 -0.10970 -0.11704
0.16-1 0.33658 0.19344 0,34471 0.61648 -0.17172 -0.18787 0.01756 -0.01094 -0.03111
0.16-2 0.33563 0.17849 0.33595 0.63259 | 0.64999 -0.12247 0.06146 -0.01300 -0.02106
0.16-3 0.32675 0.17613 0.32833 0.61292 0.62964 0.60995 0.10704 0.01443 -0.06325
0.20 0.25716 0.43196 0.41714 0.11908 0.10499 0.10447 0.36236 -0.09779 -0.11817
0. 26 / 3 0.18969 0.26443 0.27836 0.15495 j 0.14959 0.14644 0.21553 0.14045 -0.10315
0. 3014 0.25023 0.32235 0.35288 0.23721 1 0.23260 J 0.22709 0.25903 0.17710 0.22838
Note: The lower left triangle contains the reproduced correlation matrix; the diagonal, reproducedcommonalities and the upper right triangle residuals between the observed correlations and thereproduced correlations.
iii

Table 3-2 Principal Components AnalysisAccess to Education
Number of Valid Pairs After Pairwise Deletion
Variable 0.16-7 0.22/4 0 0.23/4 0.24/4 i Q.25/4 0.26/4 0.27/4 0.28/4 0.29/4
0.16-7 3755
0.22/4 3727 3727Q. 23/4 3727 3727 3727
0.24/4 3727 3727 r 3727 37270.25/4 3727 3727 3727 3727 3727 _______
0.26/4 3727 3727 3 3727 3727 3727
Q. 2714 3727 3727 3727 3727 3727 3727 37270.28/ 4 3727 3727 3727 3727 3727 3727 3727 3727
0. 29/4 3727 3727 3727 3727 3727 3727 3727 3727
Correlation Matrix
Variable 0.16-7 Q.22(4 0Q.23/4 Q.24/4 Q.25/4 0.26/4 [Q.2714 0.2814 Q.2914
0.16-7 1.00000 _ 1 _ i
0.22/ 4 0.13877 1.00000
0.23/4 0.14107 0.71552 1.00000
0.24/4 0.06029 0.15283 I 0.16229 [ 1.00000
0.25/4 0.08232 0.12009 0.11389 0.49414 1.00000
0.26/4 0.15369 0.39766 0.41510 0.17473 i 0.16578 1.00000
Q.27/4 0.13347 0.39524 0.38866 0.13644 0.11562 0.60431 1.00000
0. 28/4 0.11356 0.09207 0.06677 0.04350 0.06833 0.13064 0.13239 1.00000
0. 29/4 0.07969 0.22964 0.24572 0.09008 ] 0.10226 | 0.22361 0.25665 0.11448 1.00000
Final Statistics and Factor Matrix (Factors with Eigenvalue > 1.00)
Variable Communality Factor Eigen-value | Pct. of Factor MatrixVariance _
Factor 1 Factor 2 Factor 3
0. 16-7 0.36765 1 2.83998 31.6 j 0.29660 0.00508 0.52882
0.22/4 0.68762 2 1.35374 15.0 0.75584 -0.22333 -0.25778
0. 23 / 4 0.70478 3 1.05270 j 11.7 0.76053 -0.22331 1 -0.27660
0.24/4 0.74607 _ _ _ 1 0.38726 0.76230 -0.12248
0.25/4 0.75197 0.35937 0.78883 -0.02404
0. 26/4 0.55614 _____ I 0.73704 -0.11239 0.01673
0.27 / 4 0.54974 - 0.71849 -0.18003 0.03321
0.28/4 0.63281 0.23783 0.01611 0.75894
0. 29 /4 0.24964 0.45517 1 -0.07297 0.19272
iv

Reproduced Correlation Matrix
Variable 0.16-7 0.22/4 Q.23/4 1 0.24/4 0Q.25/4 0.26/4 Q.2714 Q.28/4 0.29/4
0.16-7 0.36765 0.05203 0.06290 1 0.00632 -0.01557 -0.07320 -0.09629 -0.35840 -0.13886
0.221 4 0.08673 0.68762 0.01951 -0.00122 0.01843 -0.18021 -0.17946 0.10974 -0.08101
0.2314 0.07817 0.69601 0.70478 1 0.00412 0.01009 -0.16590 -0.18878 0.09941 -0.06343
Q. 24 1 4 0.05397 0.15404 0.15817 0.74607 -0.24929 -0.02297 -0.00051 0.03207 -0.00696
0.25/4 0.09788 0.10165 0.10380 i 0.74344 0.75197 -0.01003 0.00023 -0.01160 0.00089
Q 26 / 4 0.22689 0.57787 0.58101 0.19771 0.17581 0.55614 0.05397 -0.05553 -0.12329
0.2714 0.22976 0.57471 0.57745 0.13694 0.11539 0.55034 0.54794 -0.06080 -0.08992
0. 2814 0.47196 0.01947 -0.03264 0.01143 0.07993 0.18618 0.19319 0.63281 -0.13886
0. 29 / 4 0.23655 0.31065 0.30916 0.09704 0.10138 0.34690 0.34657 0.25334 0.24964
Note: The lower left triangle contains the reproduced correlation matrix; the diagonal,reproduced commnonalities and the upper right triangle residuals between the observedcorrelations and the reproduced correlations.
v

Table 3-3 Principal Components AnalysisCoping
Number of Valid Pairs After Pairwise DeletionVariable 0.7 Q. 8 0. 9 0. 10 0Q.11 Q. 16-4 I Q. 16-5 Q. 16-6 Q. 16-9 Q. 16-10
Q. 7 13755 _ _ _ _ _
0. 8 3755 3755Q. 9 3755 3755 3755 1Q. 10 3755 3755 3755 1 3755 1_I_____I0.11 3755 3755 3755 3755 3755Q.16-4 3755 3755 3755 3755 3755 I __ _
0. 16-5 3755 3755 3755 1 3755 3755 3755 37550. 16-6 3755 3755 3755 3755 3755 3755 3755 3755
I0.169 3755 3755 3755 3755 3755 1 3755 3755 3755 37550.16-10 3755 3755 3755 3755 3755 1 3755 3755 I 3755 3755 3755
Correlation Matrix
Variabl 0.7 0.8 0. 9 0. 10 Q.11 Q.16-4 0.16-5 Q.16-60 Q.16-9 0.16-10 Ie
0 .7 1.00000 _ ___ 0Q.8 0.45408 1.00000 _ - ___ I
9 10.32616 0.47981 1.000000.10 0.35196 0.36644 0.38863 1.00000 I
0.11 0.36549 0.37184 0.39000 0.64114 11.00000 I _ _ _I
Q. 16-4 0.30701 0.19953 0.18419 0.21945 0.21805 1.000000. 16-5 0.46942 0.31419 0.24882 0.31539 j 0.30499 0.51312 1.00000 I I0. 16-6 0.28710 1 0.43018 0.37066 0.28471 0.37066 1 0.29529 1 0.44337 11.00000 1 10.16-9 0.23473 1 0.26287 j 0.22241 0.40296 1 0.22241 10.23017 0.34948 0.37051 i 1.000000. 16- 0.26036 1 0.24845 0.19595 0.35050 1 0.19595 ! 0.24290 0.37582 0.37964 1 0.63905 1 1.00000
Vl
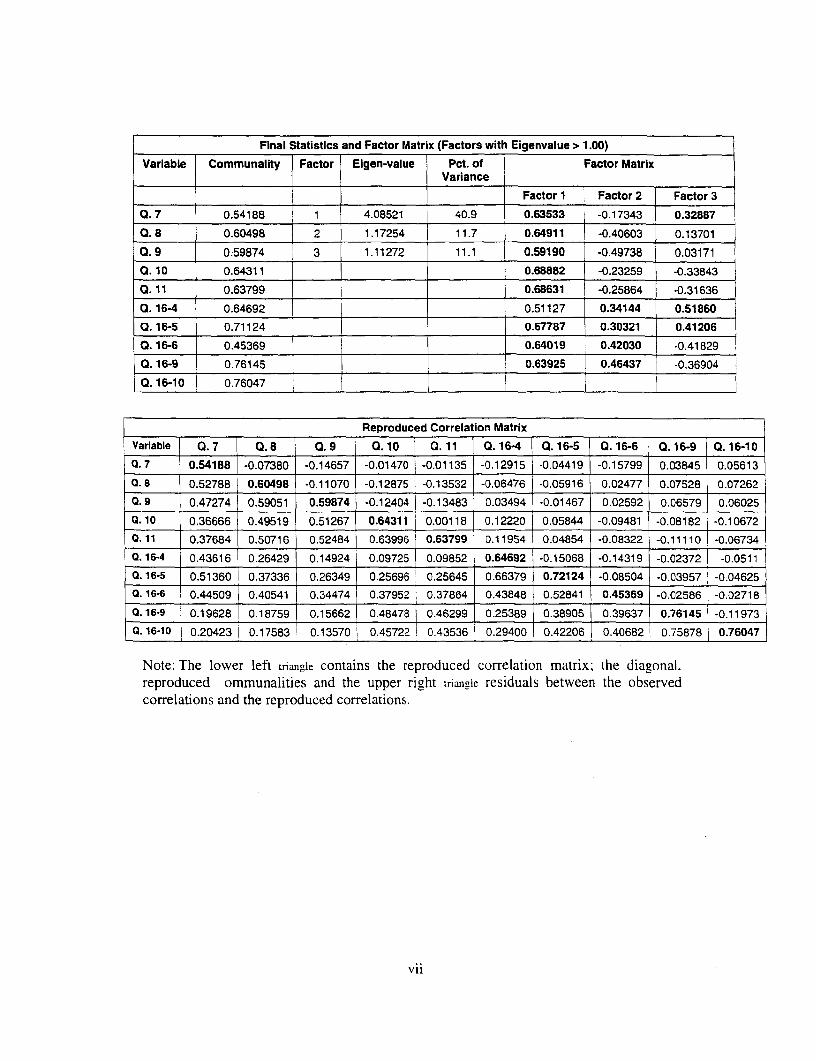
Final Statistics and Factor Matrix (Factors with Eigenvalue > 1.00)
Variable Communality Factor Eigen-value Pct. ot Factor MatrixVariance
Factor 1 Factor 2 Factor 3
Q. 7 0.54188 1 4.08521 40.9 0.63533 | -0.17343 0.328870.8 0.60498 2 1.17254 11.7 0.64911 -0.40603 0.13701
0. 9 0.59874 3 1.11272 11.1 0.59190 -0.49738 0.03171
0.10 0.64311 0.68882 -0.23259 -0.33843
0.11 0.63799 0.68631 -0.25864 *0.31636
0.16-4 0.64692 0.51127 0.34144 0.518600.16-5 0.71124 0.67787 0.30321 0.412060. 16-6 0.45369 0.64019 0.42030 .0.41829
0. 16-9 0.76145 0.63925 0.46437 -0.36904
Q.16-10 0.76047 _ __l
Reproduced Correlation MatrixVariable 0.7 Q. 8 0. 9 0.10 0. 11 Q. 16-4 q. 16-5 0.16-6 0.16-9 0.16-100. 7 0.54188 -0.07380 -0.14657 -0.01470 | -0.01135 -0.12915 -0.04419 -0.15799 0.03845 0.05613
Q. 8 0.52788 1 0.60498 -011070 -0.12875 -0.13532 -0.06476 -0.05916 0.02477 0.07528 0.072620. 9 0.47274 0.59051 0.59874 -0.12404 | -0.13483 0.03494 -0.01467 0.02592 0.06579 0.06025Q. 10 0.36666 0.49519 0.51267 0.64311 0.00118 | 0.12220 0.05844 -0.09481 -0.08182 -0.106720.11 0.37684 0.50716 0.52484 0.63996 0.63799 0.11954 0.04854 -0.08322 -0.11110 -0.067340.16-4 0.43616 0.26429 0.14924 0.09725 0.09852 0.64692 -0.15068 -0.14319 -0.02372 -0.05110.16-5 0.51360 0.37336 0.26349 0.25696 0.25645 0.66379 0.72124 -0.08504 -0.03957 -0.046250.16-6 0.44509 0.40541 0.34474 0.37952 0.37864 0.43848 0.52841 0.45369 -0.02586 -0.02718
0.16-9 | 0.19628 0.18759 0.15662 I 0.48478 j 0.46299 0.25389 0.38905 0.39637 0.76145 -0.11973
0. 16-10 0.20423 0.17583 0.13570 1 0.45722 0.43536 0.29400 0.42206 0.40682 j 0.75878 0.76047
Note: The lower left triangle contains the reproduced correlation matrix; the diagonal.reproduced ommunalities and the upper right triangle residuals between the observedcorrelations and the reproduced correlations.
vii

Table 3-4 Principal Components AnalysisAccess to Economic Activity
Number of Valid Pairs After Pairwise Deletion
Variable I 0.1 0.2 0.3 Q. 4 0.6 Q.16-8 Q. 210.1 3755 I
0. 2 3755 3755 __.
0. 3 3755 3755 3755
0. 4 3755 3755 3755 3755
0. 6 3755 3755 3755 3755 3755
0. 16-8 3755 3755 3755 3755 I 3755 3755
0. 21 3755 3755 3755 3755 3755 3755 3755
Correlation MatrixVariable 0 0.1 1 0.2 0.3 0.4 1 0.6 f 0.164 0.21
ble Q.~1 Q.203 .1 8r ~0.1 1.00000 I __ __
0. 2 0.63876 1.00000
0.3 0.07281 0.03638 1.00000
0. 4 0.07865 0.08504 0.62291 1.00000
0.6 0.01481 0.01155 0.13366 0.07412 1.00000
0. 16-8 0.09169 0.08025 0.08346 0.06069 0.12487 1.00000
0.21 0.17186 0.17202 0.11179 0.10897 0.06969 0.10396 1.00000
Final Statistics and Factor Matrix (Factors with Eigenvalue > 1.00)
Variable Communality Factor Eigen-value Pct. of T Factor MatrixVariance
0. 1 0.78705 1 1.92247 1 27.5 Factor 1I Factor2 Factor3} O.1 0.78705 1 1.92247 1 27.5 0.66171 -0.57610 -0.13151
a0.2 0.79093 2 1.51749 21.7 0.64579 -0.59606 -0.13640
0.3 0.80829 3 1.07800 15.4 0.60237 0.64130 -0.18486
0.4 0.81083 0.60935 0.60413 -0.27304
0.6 0.53038 ] 0.22834 1 0.21296 0.65795
0.16-8 0.53194 0.29697 0.01258 0.66603
0. 21 0.25854 - 0.43941 -0.09251 0.23853
viii

Reproduced Correlation Matrix
Variable 0.1 0 2 0.3 0.4 0. 6 0.16-8 0.210.1 0.78705 -0.14989 | 0.01936 -0.01243 0.07293 -0.00998 -0.14082
0. 2 0.78866 0.79093 0.00441 0.00988 0.08077 -0.01318 -0.13435
0.3 0.05345 0.03196 ! 0.80829 -0.18204 -0.01883 0.01963 -0.049480.4 0.09108 0.07066 0.80496 | 0.81083 -0.01403 0.05398 -0.03777
0.6 -0.05812 -0.06922 0.15249 0.08815 0.53038 -0.38383 -0.16789
0.16-8 0.10167 0.09343 0.06383 0.00671 0.50870 0.53194 -0.18423
0. 21 0.31269 0.30637 ' 0.16127 0.14674 0.23757 0.28819 0.25854
Note: The lower left triangle contains the reproduced correlation matrix; ihe diagonal, reproducedcommonalities and the upper right triangle residuals between the observed correlations and thereproduced correlations.
ix

Table 3-5 Principal Components AnalysisAccess to Health
Number of Valid Pairs After Pairwise DeletionVariable I Q.22/3 ! 0.23/3 i0.24/3 0 0.25/3 Q0.2613 0.2713 Q.28/3 0.2913
Q.22/3 37161 _ i
0.23/3 3716 3716
Q.24/3 3716 3716 ' 3716
Q. 25 / 3 3716 j 3716 3716 3716
0.26/3 3716 3716 3716 3716 3716 K0.27/3 3716 3716 3716 3716 3716 1 3716
0.28/3 3716 3716 3716 3716 3716 3716 3716
0.29/3 3716 3716 - 3716 3716 3716 3716 3716 3716
Correlation MatrixVariable Q0.22/3 Q.23/3 iQ.24/3 Q.25/3 Q0.26/3 0.27/3 Q.28/3 Q.29/3I
0. 22 /3 1.00000j0.23/3 -0.02826 1.00000 1
0.24 /3 0.08580 0.13023 1.00000
0.25/3 0.01757 0.10973 0.37484 | 1.00000 I
0.26 /3 0.07861 0.14924 0.16605 0.17010 1.00000 10.27/3 -0.11565 0.16095 I 0.06064 0.10758 0.17306 1.00000
0.28/3 0.00553 0.10008 0.12443 0.24101 0.12032 0.16306 1.00000
0.29/3 -0.03189 | 0.22553 0.12936 0.15774 0.25268 0.19740 0.32165 1.00000
Final Statistics and Factor Matrix (Factors with Eigenvalue > 1.00)Variable I Communality Factor | Eigen-value Pct. of Variance Factor Matrix
__________ IFactor 1 Factor 2
O.22/3 0.40356 1 2.05470 25.7 0.01399 0.63511
0.23/3 0.26431 1 2 1.19803 15.0 0.46067 I -0.22825Q.24 /3 0.55333 0.52349 0.52847
0. 25/3 0.50264 0.59143 0.390960. 26/3 0.28905 0.53558 0.04705Q. 27 /3 0.43541 0.45374 -'479100.28 /3 0.32823 _ 1 1 0.56609 9815
0.29/3 0.47619 _ __ 1 _0.63662 - 29
x
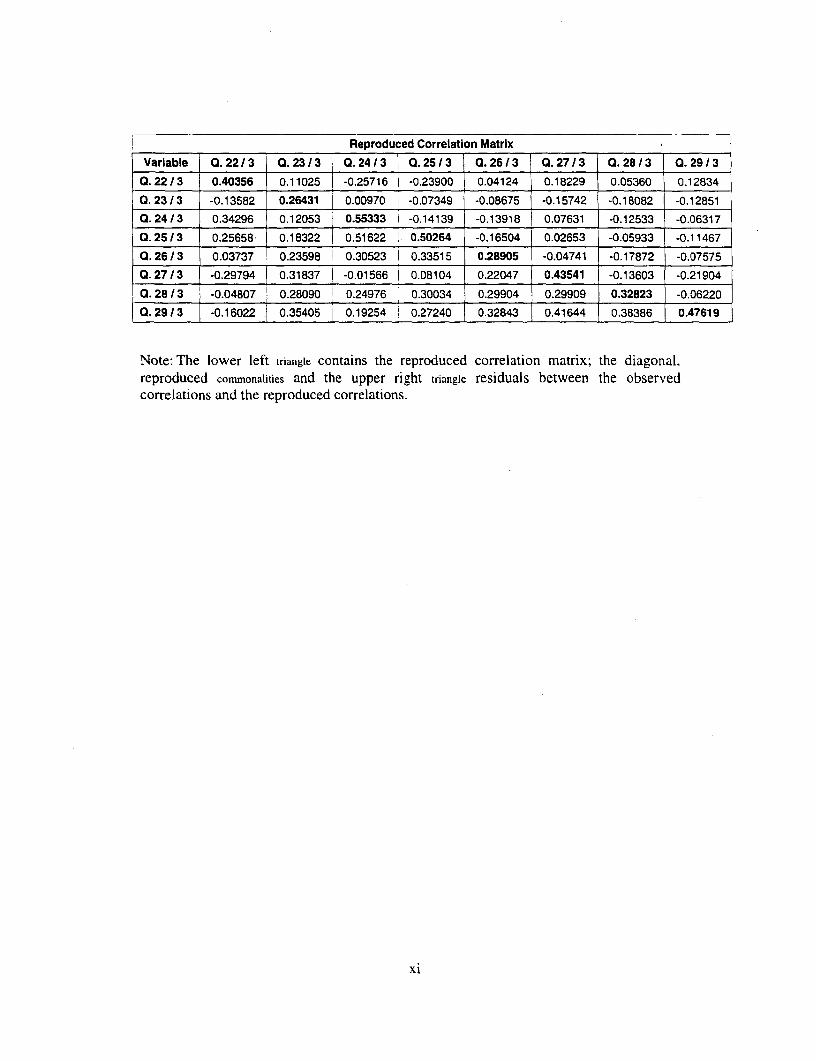
L_________ _________ _________ Reproduced Correlation Matrix
Variable 0.2213 0.23/3 |j7.24/3 |0Q.25 3 0. 26/3 0.27/3 0. 28/3 0. 29/3
Q. 22/3 0.40356 0.11025 -0.25716 I-0.23900 0.04124 0.18229 0.05360 0.12834
0.23 /3 -0.13582 0.26431 I 0.00970 -0.07349 -0.08675 -0.15742 -0.18082 -0.12851
0.24/3 0.34296 0.12053 0.55333 i -0.14139 -0.13918 0.07631 -0.12533 -0.06317
0. 25/3 0.25658- 0.18322 0.51622 0.50264 -0.16504 0.02653 -0.05933 -0.11467
0.26/3 0.03737 0.23598 0.30523 L 0.33515 0.28905 -0.04741 -0.17872 -0.07575
0. 27 / 3 -0.29794 0.31837 -0.01566 0.08104 0.22047 0.43541 -0.13603 -0.21904
0. 28 /3 -0.04807 0.28090 0.24976 0.30034 0.29904 0.29909 0.32823 -0.06220
0.29/3 -0.16022 0.35405 0.19254 0.27240 0.32843 0.41644 0.38386 0.47619
Note: The lower left tfiangle contains the reproduced correlation matrix; the diagonal.reproduced commonalities and the upper right triangle residuals between the observedcorrelations and the reproduced correlations.
xi

Table 3-6. Correlation Matrix of Indices
IND FD IND EDU IND COPT IND EMP IND HLTTotal
IND FD 1.000 0 1 _
IND EDU 0.273 1.000 _ IIND COPT _ 0.621 0.207 ! 1.000 IND EMP 0.421 0.193 0.452 1.000 IIND HLT 0.291 0.099 t 0.241 0.192 1.000
UrbanIND FD 1.000 1IND EDU 0.332 1.000 IIND COPT 0.589 0.239 1.000 iIND EMP 0.423 0.220 0.429 1.000 _
IND HLT 0.145 0.047 0.156 0.085 1.000
RuralIND FD 1IND EDU 0.263 1IND COPT 0.625 0.203 1IND EMP 0.422 0.188 0.459 1IND HLT 0.299 0.109 0.256 0.216 1
IND FD Availabilirv/Accessibility of FoodIND EDU Access to EducationIND COPT Financial CopingIND EMP Labor Markets/Access to EmploymentIND HLT Access to Heath
xi.

APPENDIX 4: SURVEY INDICATORS
Frequency Distributions and Summary Statistics - Combined by Kecamatan(Common questions 1-21 and respondent specific questions by urban/rural status)
I. Common Questions
Total Std Err StdStatus Response Code Total Cases Mean of Dev. Var.
1 2 3 4 5 Mean
0. 1 - ChanRe in males returning to kecamatan due to loss of work
Total 3.62 45.19 38.24 11.82 1.12 100.00 3755 2.62! 0.01 0.78 0.61Urban 4.24 43.64 37.21 13.19 1.73 100.00 637 2.65 0.03 0.83 0.68Rural 3.50 45.51 38.45 11.55. 0.99 100.00 3118 2.61 0.01 0.77 0.60
0. 2 - Chanme in females returnin2 to kecamatan due to loss of work
Total 0.75 8.23 _40.03 42.16 8.84 _100.00 3755 3.50 _0.01 0.80 0.64Urban 0.78 10.68 36.26 42.39 9.89 100.00 637 3.50 0.03 0.84 0.71Rural 0.74 7.73, 40.80 42.11 8.63 100.00 3118 3.50 0.01 0.79 0.62
0. 3 - Change in males leaving kecamatan to find work
Total 0.37 3.46, 30.63 42.96 22.58 100.00 3755 3.84 0.01 0.82; 0.68Urban 0.31 4.24 34.38 39.56 21.51 100.00 637. 3.78 0.03 0.84i 0.71Rural 0.38 3.30 29.86 43.65 22.80 100.00 3118 3.85 0.01 0.82' 0.67
0. 4 - Change in females leaving kecamatan to find work
Total 0.16 1.891 20.16 52.81 24.98 100.00 3755 4.01 0.01 0.74! 0.54Urban 0.31 2.20 21.51 52.75 23.23. 100.00 637 3.96 0.03 0.75 0.56Rural 0.13 1.831 19.88 52.82. 25.34 100.00 3118 4.01' 0.01 0.73 0.54
0. 5 - Change in population decreasing quality of intake of basic food
Total 0.48 2.29 20.08 61.73 15.42 100.00 3755 3.89 0.01 0.69 0.48Urban 0.47 2.51 19,78 59.65 17.58 100.00 637 3.91 0.03 0.71 0.51Rural 0.48 2.25 20.14 62.16 14.98 100.00 3118 3.89 0.01 0.69 0.47
0. 6 - Change in population working at more jobs/longer hours
Total 0.59 4.21 37.15 45.89 12.17 100.00 3755 3.65 0.01 0.77 0.59Urban 0.63 3.77 37.21 40.66: 17.74 100.00 637 3.71 0.03 0.82 0.67Rural 0.58 4.30i 37.14 46.95 11.03 100.00 3118 3.64 0.01 0.76 0.57
0. 7 - Change in population selling household goods to meet basic needs
Total 1.33 8.44! 51.48 29.43 9.32, 100.00 3755 3.37 0.01 0.82 0.671Urban 2.04 10.05. 63.27 17.43, 7.221 100.00 637 3.18_ 0.03 0.781 0.611Rural 1.19 8.11 49.07 31.88 9.75 100.00 3118; 3.41. 0.01 0.82 0.67
Q. 8 - Change in population leaving arisan due to lack of money
Total 0.80 4.66 39.79 47.88 6.871 100.00 3755 3.55i 0.01 0.73i 0.53Urban 0.78 4.40i 48.19 38.62 8.01 100.00 637. 3.491 0.03 0.741 0.55iRural 0.80, 4.71 38.07 49.78 6.64! 100.00 3118i 3.571 0.01 0.72Z 0.52
i

Status ,Total Std Err StdResponse Code Total Cases Mean ot Dev. Var.
1 2 3 4 5 Mean
0. 9 - Change in turnover of arisan
Total 1.25 7.46i 37.36 51.85 2.08 _100.00 3755 3.46 0.01 0.72 0.51Urban 1.10 6.75 43.17 48.04 0.94 100.00 637 3.41 0.03 0.68 0.46_ural 1.28: 7.601 36.18 52.63 2.31 100.00 3118 3.47 0.01 0.72' 0.52
Q. 10 - Change in level ot community activitieslcelebrations
Total 1.231 9.40 51.00 36.80 1.57 100.00 3755 3.28i 0.01 0.70 0.50Urban 0.31, 10.52: 61.54 27.47 0.16 100.00 637 3.17 0.02 0.611 0.37iRural 1.41; 9.171 48.85 38.71 1.86i 100.00 3118 3.30 0.01 0.72' 0.52
0. 11 - Change in level of community contributions
Total 2.16 11.74i 59.17 25.59 1.33 100.00 3755 3.12 o.o1 0.71 0.50'Urban 2.67 13.03; 66.56 17.43 0.31 100.00 637 3.00 0.03 0.651 0.42Rural 2.05 11.48i 57.67 27.26 1.54 100.00 3118 3.15 0.01 0.71 0.51
0. 12 - Change in availability of basic foods
Total __ 2.61 20.96i 60.64 15.34 0.45 100.00 3755 2.90 0.01 0.69 0.48Urban 2.98 20.41' 62.79 13.34 0.47 100.00 637 2.88 0.03 0.68 0.46Rural 2.53 21.07 60.20 15.75 0.45; 100.00 3118 2.91 0.01 0.69 0.48
Q. 13 - Change in ability to purchase basic foods
Total 2.08 14.06i 56.70 21.81 5.35 100.00 3755 3.14 0.01 0.80 0.64.Urban 2.20 14.91 60.91 16.64 5.34 100.00 637 3.08 0.03 0.78' 0.61Rural 2.05, 13.89 55.84 22.87 5.36 100.00 3118 3.16 0.01 0.80 0.64
0. 14 - Change in incidence of theft
Total 1.33 8.55 63.25 22.02 4.85 100.00 3755 3.21 0.01 0.71 0.51Urban 1.57 9.42 70.80 15.86 2.35, 100.00 637 3.08 0.03 0.64 0.40Rural 1.28. 8.37 61.71 23.28 5.36 100.00 3118 3.23, 0.01 0.73 0.53
Q. 15-a - Issue: Unemployment
Total 27.22 27.72 20.03 25.03 _ 100.00_ 3755 2.43 0.02 _1.14 1.29Urban 38.46 30.30 18.52 12.72 100.00 637 2.05 0.04 1.04 1.08Rural __ 24.92 27.20 20.33 27.55 100.00 3118 2.51 0.02 1.14 1.30
0. 15-b - Issue: Finding staple food
Total 20.77 19.25; 19.17 40.80 100.00 3755 2.80 0.02 1.181 1.39;Urban 20.25 22.61 21.51 35.64i 100.00 637 2.73 0.05 1.151 1.32Rural 20.88; 18.571 18.70 41.85 100.00 3118 2.82 0.02 1.19 1.41
V. Q. 15-c - Issue: Children dropping out out school
Total 1.84 6.231 10.97 80.96 100.00 3755 3.71 0.01 0.661 0.44Urban 2.04 6.441 13.34 78.18 100.00 637 3.68! 0.03 0.691 0.47Rural 1.80 6.19[ 10.49 81.53 100.00 3118 3.72 0.01 0.66 0.43
'0. 15-d - Issue: Loss of Income
:Total 24.74 40.69; 19.63 14.94 100.00 3755 2.25 0.02 0.99 0.98Urban 26.53, 39.87! 21.19 12.40 100.00 637 2.19! 0.04 0.97, 0.94s|Rural 24.37 40.861 19.31 15.46 100.00 3118 2.26i 0.02 0.99s 0.991
11
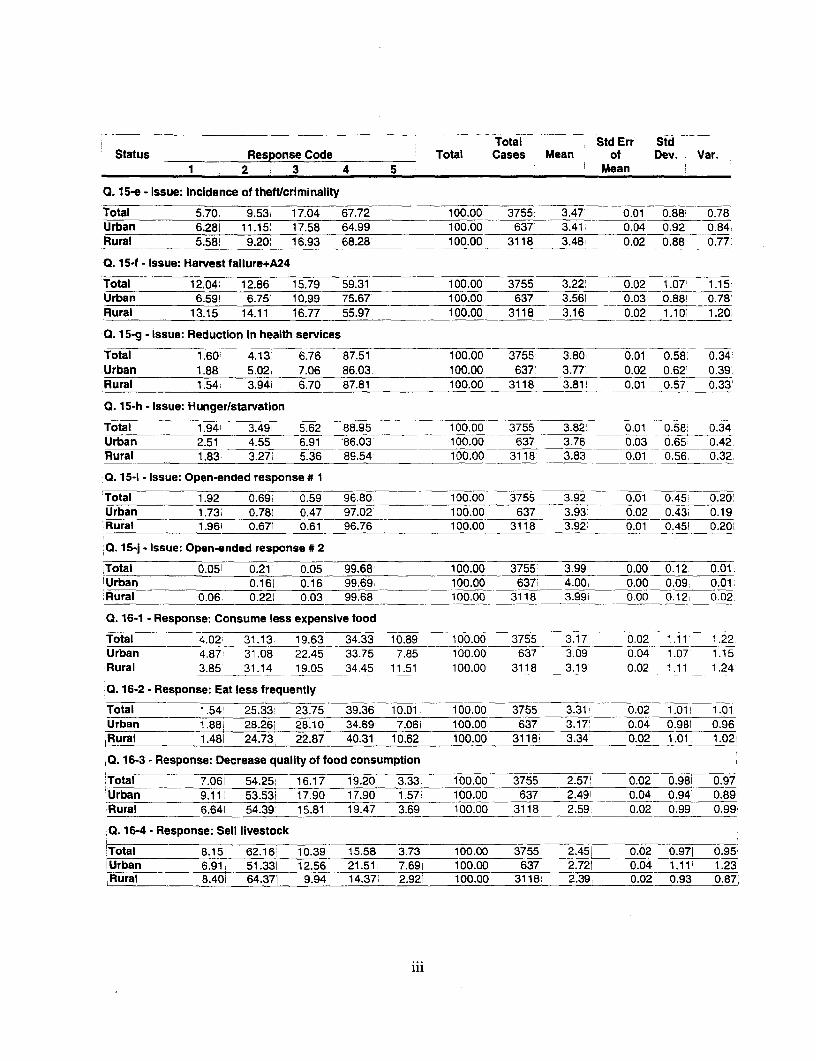
Total Std Err StdStatus Response Code Total Cases Mean of Dev. Var.
1 2 3 4 5 Mean
0. 15-e - Issue: Incidence of theft/criminality
Total 5.70 9.53 17.04 67.72 100.00 3755 3.47 0.01 0.88i 0.78Urban 6.281 11.15: 17.58 64.99 100.00 6371 3.41 0.04 0.92i 0.84Rural 5.58! 9.201 16.93 68.28 100.00 3118 3.481 0.02 0.88 0.77'
0. 15-f - Issue: Harvest tallure+A24
Total 12.04, 12.86 15.79 59.31 100.00 3755 3.22' 0.02 1.07 1.15Urban 6.591 6.751 10.99 75.67 100.00 637 3.561 0.03 0.88! 0.78rRural 13,15 14.11 16.77 55.97 100.00 3118 3.16 0.02 1.10 1.20:
0. 15-g - Issue: Reduction In health services
Total 1.60 4.13 6.76 87.51 100.00 3755 3.80 0.01 0.58 0.34Urban 1.88 5.021 7.06 86.03 100.00 637' 3.771 0.02 0.62 0.39Rural 1.54! 3.94s 6.70 87.81 100.00 3118 3.81! 0.01 0.57 0.33
0. 15-h - Issue: Hunger/starvation
Total 1.94 3.49 5.62 88.95 100.00 3755 3.82, 0.01 0.58; 0.34Urban 2.51 4.55 6.91 _86.03 100.00 637 3.76 0.03 0.65, 0.42Rural 1.83 3.27 5.36 89.54 100.00 3118 3.83 0.01 0.56 0.32
0. 15-I - Issue: Open-ended response # 1
Total 1.92 0.691 0.59 96.80 100.00 3755 3.92 0.01 0.45 0.20'Urban 1.73, 0.78i 0.47 97.02 100.00 637 3.93; 0.02 0.43i 0.19Rural 1.961 0.671 0.61 96.76 100.00 3118 3.92 0.01 0.45i 0.20.
0. 15-j - Issue: Open-ended response # 2
Total 0.051 0.21' 0.05 99.68 100.00 3755 3.99 0.00 0.121 0.01.Urban 0.161 0.16 99.69 100.00 637' 4.001 0.00 0.09 0.01Rural 0.06i 0.221 0.03 99.68 100.00 3118 3.99i 0.00 0.12 0.02
0. 16-1 - Response: Consume less expensive food
Total 4.02 31.131 19.63 34.33 10.89 100.00 3755 3.17 0.02 1.11 1.22Urban 4.87 31.08 22.45 33.75 7.85 100.00 637 3.09 0.04 1.07 1.15Rural 3.85 31.14 19.05 34.45 11.51 100.00 3118 3.19 0.02 1.11 1.24
Q. 16-2 - Response: Eat less frequently
Total 1.54 25.33 23.75 39.36 10.01 100.00 3755 3.31 0.02 1.01 1.01Urban 1.881 28.26: 28.10 34.69 7.061 100.00 637 3.17 0.04 0.981 0.96Rural 1.481 24.73 22.87 40.31 10.62 100.00 3118 3.34 0.02 1.01 1.02
Q. 16-3 - Response: Decrease quality of food consumption
Total 7.06 54.25 16.17 19.20 3.331 100.00 3755 2.57' 0.02 0.981 0.97Urban 9.11 53.53i 17.90 17.90' 1.57: 100.00 637' 2.491 0.04 0.941 0.89iRural 6.64: 54.391 15.81 19.47 3.69 100.00 3118 2.591 0.02 0.99 0.99
0. 16-4 - Response: Sell livestock
Total 8.15: 62.16 10.39 15.58 3.73 100.00 3755 2.451 0.02 0.971 0.95Urban 6.91 51.331 12.56 21.51; 7.69i 100.00 637 2.721 0.04 1.111 1.231Ru*ral 8.40Y 64.371 9.94-1437 2.921 100.00 3118 2.39. 0.02 0.93 0.87:
111

Total Std Err StdStatus Response Code Total Cases Mean of Dev. Var.
1 2 3 4 5 Mean
0. 16-5 - Response: Sell household assets
Total 6.92 46.981 17.63 24.71 3.75_ 100.00_ 3755 2.71' 0.02 103 1. 06Urban 10.36 54.95' 16.33 16.64 1.73 100.00 637 2.44 0.04 0.94 0.89Rural 6.22 45.35 17.90 26.36 4.17 100.00 3118 2.77 0.02 1.04 1.08
0. 16-6 - Response: Stop attending arisan
Total 4.45 36.80 18.96 33.42 6.36 100.00 3755 3.00: 0.02 1.07 1.14Urban 4.55 44.43 18.37 29.20 3.45 100.00 637 2.83 0.04 1.01 1.03Rural 4.43 35.25 19.08 34.28 6.96 100.00 3118 3.04 0.02 1.07 1.15
0. 16-7 - Response: Take children out of school
Total 0.48 5.03 13.02 53.16 28.31 100.00 3755 4.04' 0.01 0.81 0.66Urban 0.31 2.83. 12.40 54.00 30.46 100.00 637 4.11 0.03 0.75 0.56Rural 0.51 5.48 13.15 52.98 27.87 100.00 3118 4.02 0.01 0.82 0.68
Q. 16-8 - Response: Increase number of family members working
Total 4.39 58.75 14.91 19.04 2.90 100.00 3755 2.57 0.02 0.94 0.89Urban 4.24 55.57 18.37 19.47 2.35 100.00 637 2.60 0.04 0.93 0.86
.Rural 4.43. 59.40 14.21 18.95 3.01 100.00 3118 2.57 0.02 0.95 0.89
0. 16-9 - Response: Decease participation in village activities/celebrations
Total 3.09 32.30' 22.29 33.26 9.05 100.00 3755 3.13 0.02 1.06 1.13Urban 3.14 39.72 21.19 29.67 6.28 100.00 637 2.96 0.04 1.03 1.07Rural 3.08 30.79 22.51 34.00 9.62 100.00 3118 3.16 0.02 1.06 1.13
0. 16-10 - Response: Decrease contributions to village activites/celebrations
Total 5.54 44.21 20.19 25.30 4.77 100.00 3755 2.80i 0.02 1.03 1.07Urban 6.59 52.59 15.86 20.25 4.71 100.00 637. 2.64i 0.04 1.03 1.05Rural 5.32 42.50 21.07 26.33 4.78 100.00 3118 2.83 0.02 1.03 1.06
Q. 20 - Change in price of medium quality rice
Total 49.53 39.28 10.97 0.13 0.08 100.00 3755 1.62, 0.01 0.69 0.47Urban 48.82 41.13 10.05 100.00 637 1.61 0.03 0.66 0.44Rural 49.68 38.90 11.16 0.16 0.10 100.00 3118 1.62 0.01 0.69 0.48
0. 21 - Change in number of stores going out of business
Total 1.15 4.39 26.90 60.08 7.48. 100.00 3755 3.68. 0.01 0.72 0.52Urban 1.26 5.49. 37.83 45.84 9.58 100.00 637 3.57! 0.03 0.79 0.62Rural 1.12' 4.17' 24.66 62.99 7.06' 100.00 3118 3.711 0.01 0.71 0.50
iv

II. PMD
Total Std Err StdStatus Response Code Total Cases Mean of Dev. Var.
1 2 3 4 5 Mean
Q. 22 - Change in level of community upkeep activity
Total 0.48! 5.39 20.29 67.35 6.50 100.00 631 3.74 0.03 0.68 0.461Urban 0.48 5.39 20.29 67.35 6.50 100.00 631 3.74 0.03 0.681 0.46Rural 0
0. 23 - Change in number of Informal sector workers
Total 3.80 14.26 43.58 31.22 7.13 100.00 631 3.24! 0.04 0.92 0.84Urban 3.801 14.26 43.58 31.22 7.13 100.00 631 3.24' 0.04 0.92 0.84Rtural 0
0. 24 - Change in number of street children
Total 2.691 9.98 37.08 40.73 9.51 100.00 631 3.44 0.04 0.89 0.80Urban 2.69 9.98; 37.08 40.73 9.51 100.00 631 3.44 0.04 0.89 0.80Rural 0
Ill. Mantri Tani
Total Std Err StdStatus Response Code Total Cases Mean of Dev. Var.
1 2 3 4 5 Mean
0. 22 - Change in production of main food crop
Total 5.53 10.96; 40.63 28.09 14.80 100.00 3094 3.36 0.02 1.04 1.08'Urban 0Rural 5.53' 10.96 40.63 28.09 14.80 100.00 3094, 3.36, 0.02 1.04 1.08
0. 23 - Change in price of main non-rice crop
Total 17.61 31.42 42.60 6.53 1.84 100.00 3094 2.441 0.02 0.92 0.84Urban 0_Rural 17.61 31.42 42.60 6.53 1.84 100.00 3094 2.44 0.02 0.92 0.84
0. 24 - Change in level of farm profits
Total 3.04 8.40 21.62 17.49 49.45 100.00 3094 4.02 0.02 1.15' 1.32Urban 0Rural 3.04 8.401 21.62 17.49 49.45 100.00 3094 4.02i 0.02 1.15. 1.32,
Q. 25 - Change in wages for weeding
'Total 0.74 1.71i 2.88 9.47 85.201 100.00 3094 4.771 0.01 0.651 0.43)'Urban 0;Rural i 0.741 1.711 2.88 9.47 85.20! 100.00 3094 4.771 0.01 0.65i 0.43
Q. 26 - Change in wages for harvesting
Total 0.841 1.71 5.43 22.24 69.78: 100.00 3094 4.58, 0.01 0.75i 0.56,Urban 0Rural 0.84 1.71' 5.43 22.24 69.78 100.00 3094 4.581 0.01 0.751 0.56
v

IV. Doktor Puskesmas
Total Std Err StdStatus Response Code Total Cases Mean of Dev. Var.
1 2 3 4 5 Mean
0. 22 - Change in number of patients visiting puskesmas
Total 3.42 13.54 35.25 22.42 25.38 100.00_ 3716 3.53 0.02 1.11 1.24Urban 4.90' 20.38 39.97 16.11 18.64 100.00 633 3.231 0.04 1.12 1.25'Rural 3.11 12.13; 34.28 23.71 26.76 100.00 3083' 3.59 0.02 1.10 1.21'
0. 23 - Change in number of patients visiting hospital/polyclinic
Total 5.38; 9.66i 31.84 44.27 8.85 100.00 3716 3.42i 0.02 0.97 0.94Urban 4.74, 12.01. 44.55 27.17 11.53 100.00 633 3.29 0.04 0.98 0.96Rurai 5.51 9.18 29.22 47.78 8.30 - 100.00 3083 3.44, 0.02 0.96 093
0. 24 - Change in price of contraceptives
Total 25.03 31.22i 33.13 9.77 0.86 100.00 3716 2.30: 0.02 0.98 0.96Urban 23.22 35.86 33.49 6.79 0.63 100.00 633 2.26 0.04 0.91 0.83Rural _ 25.40 30.26 33.05 10.38 0.91 100.00 3083 2.31 0.02 0.99 0.98
Q. 25 - Change in availability of contraceptives
Total 14.24 29.49, 29.87 23.20 3.20 100.00 3716 2.72 0.02 1.07 1.14Urban 14.69 28.59 27.80 24.49 4.42 100.00 633 2.75' 0.04 1.11 1.24FRural 14.14 29.68 30.30 22.93 2.95 100.00 3083 2.71 0.02 1.06 1.13
Q. 26 - Change in number of malnourished children
Total 3.04 9,39! 45.29 30.92 11.36 100.00 3716 3.38i 0.01 0.91 0.83!Urban 3.63 10.90 47.24 29.86 8.37 100.00 633 3.28: 0.04 0.90 0.81'R;ural 2.92 9.08 44.89 31.14 11.97 100.00 3083 3.40 0.02 0.911 0.84
Q. 27 - Change in availability of services at puskesmas
Total 0.73 3.04 9.04 69.35 17.84 100.00 3716 4.01 0.01 0.68 0.46Urban 0.63 2.69 6.16 73.14 17.38 100.00 633 4.04 0.03 0.63 0.401Rural 0.75 3.11 9.63 68.57 17.94 100.00 3083 4.00 0.01 0.68 0.47
Q. 28 - Change in availability of basic medicines
Total 5.97 19.32 35.76 35.17 3.77 100.00 3716 3.11 0.02 0.96 0.92Urban 5.53 16.11 37.91 36.49 3.95 100.00 633 3.17 0.04 0.94 0.88Rural 6.07 19.98. 35.32 34.90 3.73 100.00 3083 3.10 0.02 0.96 0.93
Q. 29 - Change in price of basic medecines
Total 4.201 10.52, 35.04 47.55 2.69, 100.00 3716 3.34 0.01 0.86. 0.74.Urban 3.16: 9.16i 36.18 48.50 3.00! 100.00 633: 3.391 0.03 0.82 0.67'Rural 4.41 10.80 34.80 47.36 2.63 100.00 3083' 3.33! 0.02 0.87 0.75!
vi

V. Depikbud
Total Std Err StdStatus Response Code Total Cases Mean of Dev. Var.
1 2 3 4 5 Mean
IQ. 22 - Change in female transition class 3 - 4 in SD
Total 1.34 1.69 12.93 55.08 28.95' 100.00 3727 4.09 0.01 0.77 0.60lUrban 1.11 1.59 14.76 53.49 29.05 100.00 630 4.08 0.03 0.77 0.60Rural 1.39 1.71 12.56 55.41 28.93 100.00 3097 4.09' 0.01 0.78 0.60
0. 23 - Change in male transition class 3 - 4 in SD
Total 1.58 1.96 12.26 54.92 29.27 100.00 3727 4.08 0.01 0.79 0.63,Urban 1.43 1.11 14.29 54.13 29.05 100.00 630 4.08i 0.03 0.77 0.60Rural 1.61 2.13 11.85 55.09 29.32 100.00 3097 4.08 0.01 0.80 0.64
0. 24 - Change In female entrants to class 1 in SD
Total 0.70 2.52 24.23 39.66 32.90 100.00 3727 4.02 0.01 0.86 0.73Urban 0.79 1.43 23.33 40.79 33.65 100.00 630 4.05 0.03 0.83 0.70Rural 0.68 2.74 24.41 39.43 32.74 100.00 3097 4.01 0.02 0.86 0.74
0. 25 - Change in male entrants to class 1 in SD
Total 0.72 2.66 25.52 41.96 29.14 100.00 3727 3.96 0.01 0.85 0.72Urban 0.95 1.43 24.29 42.86 30.48 100.00 630 4.00 0.03 0.83 0.69Rural 0.68 2.91 25.77 41.78 28.87 100.00 3097 3.95 0.02 0.85 0.72
Q. 26 - Change in male dropouts in SD
Total 1.45 2.28 20.55 41.67 34.05 100.00 3727 4.05 0.01 0.88 0.77Urban 1.27 1.59 20.63 44.29 32.22 100.00 630 4.05 0.03 0.84 0.71Rural 1.49 2.42 20.54 41.14 34.42 100.00 3097 4.05 0.02 0.88 0.78
Q. 27 - Change in female dropouts in SD
Total 1.72 2.71 19.86 42.04 33.67 100.00 3727 4.03 0.01 0.89 0.80Urban 1.11 2.54 18.25 45.08 33.02 100.00 630 4.06 0.03 0.84 0.71Rural 1.84 2.74 20.18 41.43 33.81 100.00 3097 4.03 0.02 0.90 0.81
0. 28 - Change in receipt of parental school contributions
Total 6.14 12.05 36.65 37.43 7.73 100.00 3727 3.29 0.02 0.98 0.97Urban 6.83 14.44 39.21 30.48 9.05 100.00 630 3.20 0.04 1.02 1.04Rural __ 6.01 11.56 36.13 38.84 7.46 100.00 3097 3.30 0.02 0.98 0.95
.0. 29 - Change in attendance of teachers
Total 0.43 1.40 8.75 68.12 21.30 100.00 3727 4.08 0.01 0.63 0.39Urban 0.48 0.95 6.19 71.27 21.11 100.00 630 4.12 0.02 0.58 0.34Rural 0.42 1.49 9.27 67.48 21.34 100.00 3097 4.08 0.01 0.63 0.40
0. 30 - Change in numbers of children in SD coming to school hungry
Total 2.36 7.35 32.22 44.19 13.87 100.00 3727 3.60 0.01 0.90 0.81Urban 1.27 6.51 31.43 44.13 16.67 100.00 630 3.68 0.03 0.87 0.76Rural 2.58 7.52 32.39 44.20 13.30 100.00 3097 3.58 0.02 0.90 0.82
vii