julia martin-ortega and anil markandya november · pdf filejulia martin-ortega and anil...
TRANSCRIPT

The costs of drought: the exceptional
2007-2008 case of Barcelona
Julia Martin-Ortega and Anil Markandya
November 2009
BC3 WORKING PAPER SERIES
2009-09

The Basque Centre for Climate Change (BC3) is a Research Centre based in the Basque Country, which aims at contributing to long-term research on the causes and consequences of Climate Change in order to foster the creation of knowledge in this multidisciplinary science.
The BC3 promotes a highly-qualified team of researchers with the primary objective of achieving excellence in research, training and dissemination. The Scientific Plan of BC3 is led by the Scientific Director, Prof. Anil Markandya.
The core research avenues are:
• Adaptation to and the impacts of climate change
• Measures to mitigate the amount of climate change experienced
• International Dimensions of Climate Policy
• Developing and supporting research that informs climate policy in the Basque Country
See www.bc3research.org for further details.
The BC3 Working Paper Series is available on the internet at
http://www.bc3research.org/working_papers/view.html
Enquiries (Regarding the BC3 Working Paper Series):
Roger Fouquet
Email: [email protected]
www.bc3research.org
The opinions expressed in this working paper do not necessarily reflect the position of Basque Centre for Climate Change (BC3) as a whole.
Note: If printed, please remember to print on both sides. Also, perhaps try two pages on one side.

The costs of drought: the exceptional 2007-2008 case of Barcelona
Julia Martin-Ortega and Anil Markandya1
The drought affecting Catalonia between 2007 and 2008 was the most severe of the last century and
serves as a case study for the assessment of the economic costs of such an event. The main focus is the
drought affecting the so-called Ter-Llobregat system which serves the Metropolitan area of Barcelona
and where most of the population is concentrated (approximately 5.5 million people). The 2007-2008
drought is a good illustrative case study due to its extreme severity and the availability of economic
information both on the impacts (damages) and the measures taken. Besides, important communication
campaigns were put into place and led to significant reduction of the demand and the set up of
mechanisms for public participation for future water management. Direct costs of the affected sectors,
indirect costs of the Catalan economy and non-market welfare losses due to the worsening of the
environmental quality and restrictions on water supply to households due to scarcity conditions are
reported here. The total losses are estimated in 1,661 million Euros (for a one year period), almost 1% of
the Catalonian GDP. The results of this study point out the need for further research on the estimation of
the costs of drought (specially at the European level) that needs to be embedded into the assessment of
the costs of adaptation to climate change.
Keywords: drought, direct costs, indirect costs, non-market welfare losses, Barcelona
JEL Classification: Q25, Q54
Cite as: Martin-Ortega, J. and A. Markandya (2009) The costs of drought: the exceptional 2007-2008
case of Barcelona. BC3 Working Paper Series 2009-09. Basque Centre for Climate Change (BC3).
Bilbao, Spain.
1 Basque Centre for Climate Change (BC3). Gran Via, 35 – 2, 48009 Bilbao, Spain. Corresponding author: Julia Martin-Ortega: [email protected]

1
1. Introduction The economic assessment of natural hazard-induced losses such as droughts is a difficult and
under researched topic, fraught with uncertainty, intrinsic complexity and methodological challenges. The expected increase of the frequency and intensity of drought events due to climate change in some areas of the world, make it a high priority to improve the quality and reliability of the assessment exercises, so as to inform mitigation and risk management policies.
Prolonged dry and hot weather causing less than normal water availability has always been a challenging issue within parts of Europe. This will even be more so in the future with the predicted impacts of climate change suggesting a dryer and warmer Mediterranean region and a shift of climatic regimes in Europe northwards (e.g. Hutingford, 2003; IPCC, 2007). As a result there will be a considerable enhancement of inter-annual variability in the summer climate, associated with higher risks of heat-waves and droughts, already reflected in the experience of recent years. Over the last 20 years, four significant large scale droughts have occurred that have covered more than 800.000 km2 of EU territory (37%) and that had an effect on more than 100 million people (20%) (Working Group on Water Scarcity and Drought, 2006).
Most of the existing studies on the costs of drought currently available for developed countries focus on the United States and Australia (Markandya et al. 2009), and there is a need to get data for the European context specifically. At the end of 2006, warnings arose concerning a significant lack of precipitation that leaded to the most severe drought event in the last century affecting the Metropolitan area of Barcelona (approximately 5.5 million people) and threatening household supply. The emergency situation generated by this lack of precipitation led to important legal and policy actions at the regional and national level and created great social alarm, as reported by the international press (mainly due to the unusual nature of some of the taken actions, such as the transport of water by boat from France to Barcelona’s port).
The 2007-2008 drought event affecting the city of Barcelona serves us as a case study for the assessment of the economic costs of drought in Europe. The 2007-2008 episode is a good illustrative case due to its extreme severity and the availability of economic information both on the impacts (damage) and the measures taken. Besides, important communication campaigns were put into place and led to significant reduction of the demand and the set up of mechanisms for public participation for future water management, which could serve as example for coming situations.
This study is part of the 7th EU Framework Program Project XEROCHORE: An Exercise to Assess Research Needs and Policy Choices in Areas of Drought, a support action to the European Union aimed at contributing to the design of a road map towards a European Drought Policy by identifying research gaps. Here we follow the XEROCHORE approach, this means putting existing knowledge together and not on primary field research. The information presented here comes from different available sources and is analyzed and interpreted in the context of the socio-economic costs of drought in Europe.
It should be mentioned that water management in Spain has traditionally being a source of conflict. In the most recent years, as proved by the intense – and sometimes bitter- debates around the National Hydrologic Plan2
2 Law 10/2001 of the 5th July, derogated by the Royal Decree 2/2004 of the 18th of June by the subsequent Government.
proposed in 2001 and, more recently, the reform of the regional

2
“Constitutional Laws”3
2. Case study description
(estatutos), the “water issue” has become a matter of severe political controversy between the different territories and political parties in Spain. Water management decisions are not alien to this political controversy and it cannot be ruled out that, to some extent, some of the measures taken regarding water management in general, or drought in particular, could be guided not only by socio-economic efficiency but also by political interest. However, this judgement is out of the aim of this paper. In this study we estimate the economic costs of the measures that were actually taken to face the 2007-2008, although this political controversy needs to be taken into consideration when interpreting the results presented here.
The reminder of this paper is as follows. In section 2, the 2007-2008 drought event is put into the context of the rainfall pattern of the region and previous drought events and future expected events under climate change. Section 3 describes in detail the measures that were taken to face water shortage. Section 4 is dedicated to the economic information on the costs of the drought. Some conclusions from this case study and further research needs are presented in Section 5.
2.1. Catalonia’s hydrological network and regime The hydrological regime of Catalonia, located to the west of the Euro-Asian continent (Figure 1),
is characterized by the irregularity of its rainfall pattern, which, as is typical of the Mediterranean climate, varies greatly between years. This makes the region especially vulnerable to drought episodes, which are expected to increase due to climate change (Agència Catalana del’Aigua and Fundación Nueva Cultura del Agua, 2009).
Figure 1. Location of Catalonia in the map
Source: Catalan Water Agency www.gencat.cat/aca
The hydrographical network of Catalonia (31,896 km2) is composed of two sets of river basins: 1) the inland basins, and 2) the inter-communitarian and international basins. The former correspond to 28
3 See Garrido (2009) for a discussion on the fragmentation of river management in Spain.

3
hydrological units, basins, sub-basins or set of small basins4 that occupy a surface area of 16,600 km², 52% of the Catalan territory, which include 634 municipalities. They are the exclusive responsibility of the Catalan Government and their management is the responsibility of the Catalan Water Agency5.
The intercommunity basins are made up of the Catalan part of the basins of the rivers Ebro and Júcar. The Garona is part of an international basin. They occupy a surface area of about 14,000 km2, 48% of the Catalan territory, and include 312 municipalities. Management of the intercommunity basins is shared with other basin authorities: the Hydrographical Confederation of the Ebro River and the Hydrographical Confederation of the Júcar River. The river Garona is managed jointly in the Catalan part of its basin by the Agency and the Hydrographical Confederation of the Ebro, both depending on the central Spanish Government.
The main focus of this study is the drought affecting the so-called Ter-Llobregat system within the Catalonia Inland Basins, from which the Metropolitan area of Barcelona is fed and where most of the population is concentrated (approximately 5.5 million people).
Figure 2. Catalan River Basin Network
Source: Catalan Water Agency (2009) www.gencat.cat/aca
2.2. The 2007-2008 drought in context
In Catalonia the rainfall pattern is generally irregular and varies greatly between years, whichmakes the region especially vulnerable to drought episodes. In fact, Catalonia has endured various episodes of moderate and severe drought, as is evidenced in records that go back 90 years. One of the most important of such events affected the whole of the Iberian Peninsula between 1944 and 1950, 4 The rivers Llobregat, Ter, Muga, Daró, Fluvià, Francolí, Foix, Besòs, Gaià, Tordera and Riudecanyes, and the coastal streams between the French border and the river Sénia drainage area. 5 The Catalan Water Agency (ACA) is the public entity of the Government of Catalonia assigned to the Department of the Environment and Housing and founded in 1998 as the water authority in Catalonia.

4
leading to restrictions on the supply to various populations. In 1953 there was only half the normal amount of rainfall and restrictions to the service affected Barcelona. In the years 1973, 1985 and 1988 Catalonia endured several episodes of severe drought, which led to significant restrictions on supply (Generalitat de Catalunya, 2007). In the period 1998- 2003 even though it was not exceptionally dry, there were some alarming episodes that leaded to legal actions aimed at facing potential water shortcuts6
Figure 3
.
shows the rainfall evolution [measured through the Standardized Precipitation Index (SPI-12) as proposed by McKee et al. (1993) and elaborated for Catalonia by Altava-Ortiz et al. (2008)7
Figure 3. Rainfall evolution in Catalonia (SPI-12), 1916-2008
] in the region for the period 1916-2008. The last drought episode affecting Catalonia began in November 2004 and lasted until April 2008, when an extremely wet May (rainfall records at 200 mm in some areas) and subsequent rainy months put it to an end. The dry period was characterized by three peaks (summer 2005, winter 2007 and winter 2008) and two mild phases (end of 2005 and beginning of 2006). Therefore, it is concluded that the drought event lasted 42 months with different severity stages. The measurement of the costs of the damage and reactive measures in this study, however, covers only 2007-2008, time during which supply was threatened.
The red area (below zero) corresponds to negative SPI. A SPI between -0.99 to 0.99 corresponds to a normal water regime, below -0.99 is considered drought and below -2.00 is extreme drought (McKee, 1993).
Source: Altava-Ortiz et al. (2008)
Figure 4 shows the comparison of the cumulated precipitation with the climatic mean precipitations for the pluviometric years 2006-2007 and 2007-2008. Both years are classified by the Servei Meterologic de Catalunya as dry (between 30 and 90% of the climatic mean)8
6 These legal actions refer to three Decrees from the regional government (Decree 94/1999 of the 6th April 1999, Decree 168/2000 of the 2nd May 2000 and Decree 22/2002 of the 22nd January 2002). 7 The SPI is a drought index based on standardized precipitation. In this case monthly values for the period February 1915 to December 2008 were aggregated in periods of 12 months (first value in the graph corresponds then to February 1916). 8 The Servei Meteorologic de Catalunya classifies the pluviometric years in relation to the climatic mean in the following way: a period is considered as 1) very rainy when the total precipitations are over 190% with respect to the climatic mean, 2) rainy when total precipitations are 110 to 190% of the climatic mean, 3) normal, when the precipitation are between 90 and 110% of the climatic mean, 4) dry, when it rains between a 30 to 90% of the climatic mean (i.e. when it has rained between 70 and 10% less than with respect to the climatic mean) and 5) very dry, when it rains less than 30% of the climatic mean ( i.e. when it has rained a 70% or less with respect to the climatic mean).
for the major part of the territory, including the city of Barcelona and very dry in certain other areas.

5
Figure 4 Comparison of the precipitation registers of drought years with the climatic mean
Pluviometric year 2006-2007 Pluviometric year 2007-2008
Source: Catalan Meteorology Servic: www.meteo.cat
A comparison of the described event with previous ones recorded since 1916, shows that the 2004-2008 episode can be considered the most severe event, in terms of both duration (number of months with SPI in droughts categories < -0.99) and intensity (maximum SPI) in the last 92 years. Only the 1930’s episode lasted a comparable period of time. To illustrate the severity of the 2004-2008 drought, the area affected by SPI-12 <-2.00 in Northeast Iberia has been calculated (Altava-Ortiz et al, 2008). Results are presented in Figure 5. It is clearly observed how the 2004 to 2008 drought is, without doubt, the most severe episode since 1916 in Catalonia. No previous drought registers from instrumental data are comparable, although there is evidence of similar or even more severe drought records during the 16th, 17th, 18th an 19th centuries from documentary sources such as the rogation ceremonies records9
9 According to Martin-Vide and Barriendos (1995) ecclesiastical sources offer a variety of interesting weather information. The Catholic Church generated and preserved over the centuries a remarkable variety of important documents regarding weather and water phenomena. Of special interest here are the “pro pluvial” rogation ceremonies that each town would organize to pray for rain during dry periods.
(Martín-Vide and Barriendos 1995; Barrera-Escoda, 2008).

6
Figure 5. Affected area by extreme drought (SPI < -2.00) in Catalonia (1916-2008)
Source: Altava-Ortiz et al. (2008)
Looking specifically at the Metropolitan Area of Barcelona, the water scarcity was due to an important deficit of precipitation of the headwaters of the rivers Llobregat (North of the province of Barcelona) and Ter (at the province of Girona), affecting about 5,5 million people. In this particular area, the drought event is also considered the most severe (in terms of extension, magnitude and duration) of the last century since instrumental data are recorded. Figure 6 shows the rainfall evolution for the period 1916-2008 specifically for the Llobregat system. For this particular river basin, the relative severity of this last episode within this time period is even more extreme than for the whole of Catalonia. This is also the case for other main Catalan rivers, such as Ter and Segre.
Figure 6. Rainfall evolution in the Llobregat System (SPI-12), 1916-2008
Source: Altava-Ortiz et al. (2008)
2.3. Climate change projections
Drought events are expected to increase due to climate change. It has been observed that temperature in Catalonia has increased 0.15ºC per decade in the last thirty years. Calbó et al. (2009) project an increase of temperature from 2.9 to 4.4ºC – for the B2 and A2 SERS scenarios respectively – in the period 2071-2100 with the relation to the period 1961 - 199010
Projections under climate change suggest, with a high level of certainty, that the frequency of drought events may double and that their duration and intensity may increase (medium level of certainty) due to the decrease of the minimum rainfall and increased evaporation due to temperature rise (Agència
. Although there is no statistical proof of the reduction of the average year precipitation in the last 50 years, it is predicted (with medium degree of certainty) that under climate change, average rainfall will decrease from 5 to 15 percent within a long-term horizon (from 2040 to 2100). However, significant changes are expected for the short-medium term 2011-2040 (Llasat et al. 2009).
10 As usual in the field of climate change projections, authors warn about the uncertainty surrounding these figures.

7
Catalana del’Aigua and Fundación Nueva Cultura del Agua, 2009). Other factors associated with climate change, i.e. demand increase, are expected to magnify the effects of droughts.
3. Measures for facing the drought The main measures carried out to face the drought were adopted under the law passed by the
Regional Government of Catalonia: Decree 84/2007, 3rd April, on the adoption of exceptional and emergency measures regarding the use of water resources11
Other measures were contemplated but were not finally applied. This was the case of the Royal Law Decree 3/2008, 21st April, on the exceptional and urgent measures to guarantee water supply to the population affected for the drought in the province of Barcelona from the National Spanish Government
, including both demand and supply measures. The aim of this law was to promote exceptional and emergency measures to rationalize and economize the use of water in the whole territory of Catalonia, to ensure the water supply for human consumption.
12. The Royal Decree contemplated two measures: i) water supply to the Ter-Llobregat System from the low Ebro River, implying water transfers from nearby Tarragona for human consumption supply in the province of Barcelona and ii) authorization for the acquisition of water rights release from Ebro River’s irrigators, implying the use of the existing infrastructures. Although entered into force, the Royal Decree was derogated and the infrastructures for the water transfer were interrupted before finalization, due to the precipitations of the spring 2009. Other proposed measures, not implemented, regarded the transfer of water from the nearby Segre river, within the internal Catalan Basins13
The Catalan Decree established four different drought scenarios according to the reservoir levels: pre-alert, exceptional level 1, exceptional level 2 and emergency.
. Here we focus on the measures that actually took place and which were contemplated in the Catalan Decree.
Figure 1 shows the evolution of the water reserves from January 2006 to January 2009 for the Ter-Llobregat system. It is observed that the most critical moment was in April 2008 were the emergency level was almost reached. These scenarios determined the management measures to be applied (Table 1). The measures included municipal demand-control actions such as reducing the watering of gardens, closing ornamental fountains, reducing the cleaning of streets with drinkable water, controlling the filling of private swimming pools, the production of municipal contingency plans for municipalities but also supply measures, such as groundwater pumping and desalination.
11 Diari Oficial de la Generalitat de Catalunya Núm. 4860 – 12.4.2007. http://www.gencat.cat/dogc/ 12 www.boe.es, Martes 22 abril 2008 BOE núm. 97 13 It has been said (Garrido, 2009) that this transfer from the Segre river was vetoed by the Government of the Region of Aragon, where the Segre river dies.

8
Figure 7. Evolution of the water reserves in Ter-Llobregat system, drought scenarios
Agència Catana del’Aigua (2009a)
Table 1. Drought scenarios considered in the Regional Drought Decree Scenario Thresholds*
(reservoir levels)
Measures
Pre-alert - • Intensified monitoring of the evolution of reserves • Information and awareness-raising measures
Exceptional status 1 40%
• 15% reduction in the supply for irrigation in regulated systems • Cancellation of spillovers for purely hydroelectric uses • Intensified user controls • Intensified water-saving measures in the supply networks • Restrictions on discharges and non run-of-river systems
Exceptional status 2 23%
• A 45% reduction in the supply for irrigation in regulated systems • Greater intensification of water-saving measures in the supply networks • Restrictions on environmental uses
Emergency 20% • Restrictions to urban and household supply. Source: Elaborated with the information of the Decree 84/2007, 3 April of the Regional Government of Catalonia and Agència Catana del’Aigua (2009a)
*The threshold levels for the different scenarios are presented in % over the total reservoir capacity for the Ter-Llobregat system (620 Hm3). The levels differ among different periods of the year. Here an average is presented for a full year.
9
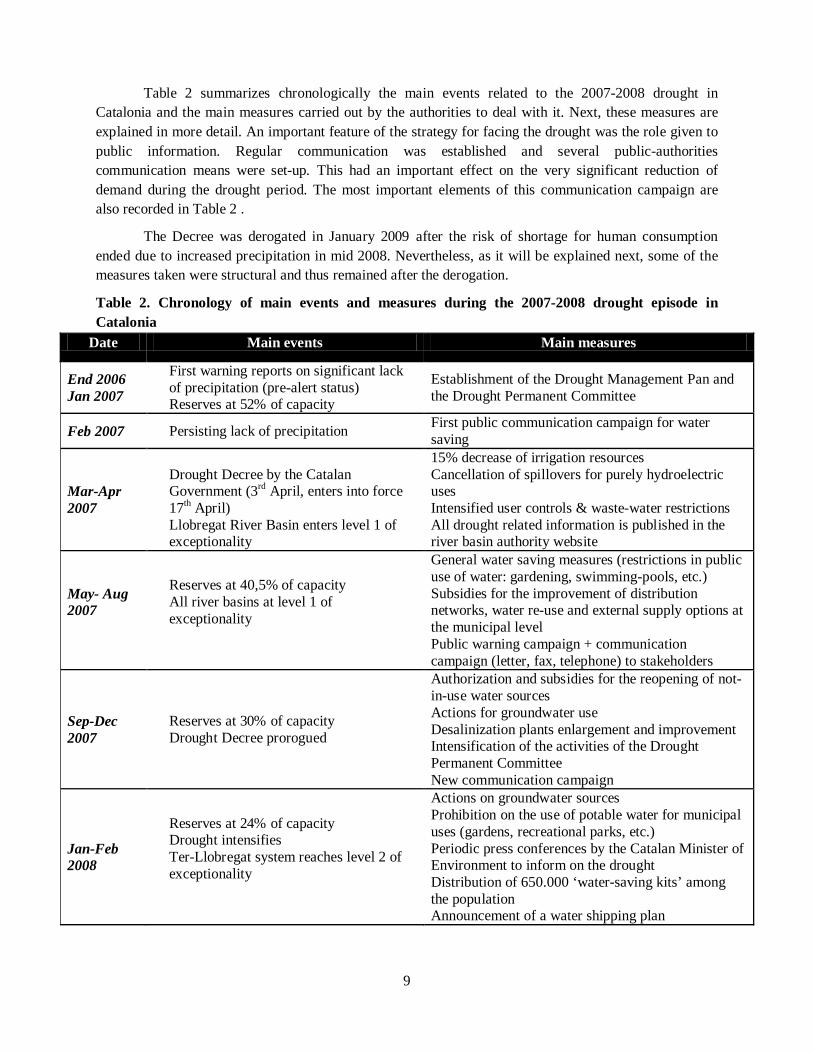
Table 2 summarizes chronologically the main events related to the 2007-2008 drought in Catalonia and the main measures carried out by the authorities to deal with it. Next, these measures are explained in more detail. An important feature of the strategy for facing the drought was the role given to public information. Regular communication was established and several public-authorities communication means were set-up. This had an important effect on the very significant reduction of demand during the drought period. The most important elements of this communication campaign are also recorded in Table 2 .
The Decree was derogated in January 2009 after the risk of shortage for human consumption ended due to increased precipitation in mid 2008. Nevertheless, as it will be explained next, some of the measures taken were structural and thus remained after the derogation.
Table 2. Chronology of main events and measures during the 2007-2008 drought episode in Catalonia
Date Main events Main measures
End 2006 Jan 2007
First warning reports on significant lack of precipitation (pre-alert status) Reserves at 52% of capacity
Establishment of the Drought Management Pan and the Drought Permanent Committee
Feb 2007 Persisting lack of precipitation First public communication campaign for water saving
Mar-Apr 2007
Drought Decree by the Catalan Government (3rd April, enters into force 17th April) Llobregat River Basin enters level 1 of exceptionality
15% decrease of irrigation resources Cancellation of spillovers for purely hydroelectric uses Intensified user controls & waste-water restrictions All drought related information is published in the river basin authority website
May- Aug 2007
Reserves at 40,5% of capacity All river basins at level 1 of exceptionality
General water saving measures (restrictions in public use of water: gardening, swimming-pools, etc.) Subsidies for the improvement of distribution networks, water re-use and external supply options at the municipal level Public warning campaign + communication campaign (letter, fax, telephone) to stakeholders
Sep-Dec 2007
Reserves at 30% of capacity Drought Decree prorogued
Authorization and subsidies for the reopening of not-in-use water sources Actions for groundwater use Desalinization plants enlargement and improvement Intensification of the activities of the Drought Permanent Committee New communication campaign
Jan-Feb 2008
Reserves at 24% of capacity Drought intensifies Ter-Llobregat system reaches level 2 of exceptionality
Actions on groundwater sources Prohibition on the use of potable water for municipal uses (gardens, recreational parks, etc.) Periodic press conferences by the Catalan Minister of Environment to inform on the drought Distribution of 650.000 ‘water-saving kits’ among the population Announcement of a water shipping plan

10
Mar 2008 Reserves at 21% of capacity Organization and contracting of water shipping from Tarragona and Marseille
Set up of an specific drought web-site www.sequera.gencat.cat + a telephone information system for users Public announcement of the water shipping program
Apr 2008
Precipitations Spanish Central Government Royal Decree
Plan of a water transfer from Ebro River and authorization of water rights acquisition from Ebro River’s irrigators Constitution of the Drought Committee
May 2008
Precipitations. Reserves at 29% of capacity Modification of the Catalan Drought Decree: Ter-Llobregat systems gets back to level 1 of exceptionality (Muga system remains at level 2)
Water shipping 13th may, first ship arrives to the port of Barcelona
June 2008
Partial recovery of water reserves (58,5% of capacity) Water shipping finishes Spanish Royal Decree derogated Water reserves increase (70% of reserve capacity for Ter-Llobregat system, Muga systems remains at 31,5%)
Water shipping ends (7th June) Water transfer from Ebro River cancelled
July-Sept 2008
Water reserves decrease due to summer lack of precipitations and increase on the water consumption
Irrigation in the Muga system is reduced to minimum. Change from irrigated crops to non-irrigated crops (e.g. sunflower)
Oct 2008 Reserves at 59% of capacity at the Ter-Llobregat system, 22,8% o at the Muga system
Nov 2008 Ter-Llobregat system recovers to pre-summer levels. Muga system's reserve continues to decrease
Specific measures for improving water supply at the Muga system (desalination, emergency sources, water transport by lorry)
Dec 2008 Jan 2009
Ter-Llobregat system gets back to 2004 levels Drought Decree prorogated for the Muga system (reserves at 22% of capacity) End of December: intense precipitations. General reserves at 77% of capacity. All river basins get back to normal (including Muga). Catalan Drought Decree derogated (13rd January)
Establishment of the Water Debate in Catalonia (public participation dialogue)
Elaborated with the information provided by the Agència Catalana de l’Aigua (2009a)
In general the measures carried out can be classified into three categories:
- Alleviation measures: which include the measures that were carried out specifically to face the drought period and that would have not been taken if this particular event would have not taken place. They include all the demand side measure plus those supply measures that were not related to the distributing networks (i.e. the water shipping).
- Structural measures brought-forward: include those structural measures that where already planned by the river basin authorities, but that were brought forward as a reaction to the
11
drought. They include: the set-up, enlargement and inter-connection of water desalination plants; the enlargement and improvement of drinking water and treatment plants and the development of infrastructures for water reuse. These programmed measures are designed to increase the water availability in Catalonia up to 300 hm3 by 2012.
- Additional structural measures implemented: refers to the measures that, having been planned during the 2007-2008 event, were aimed at ensuring the guarantee of water supply in the long run. They include the recovery of not-in-use wells, the opening of new wells and the set up of water treatment plants.
Next, the most important of these measures are described
3.1. Demand side measures
• Municipalities of over 20,000 inhabitants were obliged to submit contingency plans within a month of the declaration of exceptional status.
Measures concerning domestic supply
• Town councils and other competent authorities were required to specify the appropriate provisions to guarantee the conservation and rational use of water (public and private swimming pools, water parks, etc.).
• Local authorities were banned from using water that is suitable for human consumption for ornamental fountains.
Restrictions on use of water by local authorities for non-domestic purposes
• Water that is suitable for human consumption was only to be used for street cleaning purposes when absolutely necessary for hygiene and sanitary reasons.
• The use of water that is suitable for human consumption for watering public gardens had to be reduced to the necessary minimum (maximum: 450 m3/ha/month).
• Hydroelectric infrastructures that were not at the foot of a dam had to operate strictly as run-of-river installations without causing oscillations in the flow system circulating in the river.
Hydroelectric infrastructures
• Flow diversions for hydroelectric uses should always guarantee a flow level equal or greater than the flows laid down in Annex 4 of the Decree
• Table 2
Agricultural and livestock uses
shows the average percentage of restrictions for irrigation attained at different times (15% at level 1 and 45% al level 2). This is an average for the whole territory. In some areas, at some points, the restrictions attained the 100% (no irrigation allowed).
• Restrictions of sporting competitions affecting water resources quantitatively or qualitatively.
Recreational uses

12
• Golf courses that use water that does not come from a wastewater treatment plant for watering purposes were obliged to present a programme for improving their water conservation and efficiency to the Agency.
Perhaps one of the most ‘spectacular’ measures (due to its visibility and impact on the international press) has been the transport of water by boat. The water shipping contracts were foreseen with a length of three months, but they finally only took place between the 13th of May and the 7th of June 2008, due to the recovery of the water levels.
Environmental use of water
In case of risk of restrictions for human consumption, the lowering of the environmental flow was contemplated. Environmental flows refer to the minimum amount of water that is allocated to the environment (that should remain in the river, not used) to ensure the provision of environmental services. This measure was not finally implemented, but this does not imply that there was no environmental damage due to the low levels of water flow in the river basins (see section 4.3 on non-market welfare losses due to environmental damage).
3.2. Supply measures
Table 3 reports the total number of trips and the transported volume of water, which adds up to around less than 0.530 Hm3. This represents 18% of the actual 2008 demand taking into account the reduction of consumption during the drought period (2,940 Hm3/year).
Table 3. Water shipped to the port of Barcelona Ship name Origin Nº Trips Volume (m3)
Sichem Defender Tarragona 11 209,549 Sichem Contester Tarragona 7 133,504 Subtotal 8 343,053 Norient Solar Marseille 4 146,321 Sichem Defender Marseille 1 19,127 Sichem Contester Marseille 1 19,199
Subtotal 6 184,647 Total 21 527,700
Source: Agència Catalana del Aigua (2009a)
Other supply measures included the start-up of three desalination plants and the enlargement of an existing one. As well as intervention in other infrastructures, such as pipes extension, start-up and connection between water treatment plants and water-reuse systems and improvement of waste-water systems. In regard to groundwater, not-in-use wells were recuperated, new wells were open and water pumping from certain aquifers was intensified.
Water was exceptionally supplied by headwater cisterns (up to a maximum of 270 litre per inhabitant per day) for urban water use.
The total amount of water put into the system by the supply measures is estimated 14.82 Hm3 for the whole drought period (20 months).

13
3.3. Other management measures and public communication and participation
In addition to the Decree, the Catalan Water Agency put in place a series of instruments and management plans. At the end of January 2007, the Permanent Drought Committee (CPS, Catalan acronym) was set up within the Catalan Water Agency as the executive body for monitoring periods of scarce resources and for planning actions to be taken. The Drought Management Committee (CGS) was also set up in charge of the double task of drawing up the new Decree regarding exceptional and emergency measures for the management of probable future periods of drought, along with the writing and processing of the Drought Management Plan.
A campaign to encourage water conservation was also launched. In this context, the Water Debate in Catalonia was set up at the end of 2008 as an initiative for public participation, aiming at the establishment of a new management and financing model for water in Catalonia by 2010, coinciding with Water Framework Directive's Management Plans.
An important feature of the process of drought and its management is that, as a consequence of the communication campaigns and the social and institutional warning, an important reduction of water demand occurred during the drought period. Besides the intensive communication campaigns (see Table 2), water saving devices were distributed among the population to reduce the household consumption.
Figure 8 shows the evolution of the water savings over reference water demand (2005-2007) in the Ter-Llobregat system. The decrease of the water savings in the months of July-August corresponds with a certain relaxation on the restriction measures due to the recovery of the Ter-Llobregat system from level 2 to 1 of exceptionality (also in the summer period, due to the increased temperatures, it is common an increase of the water consumption). The period ended with 5.4% water saving with respect to the average values of 2005-2007. The average savings of the period from March 2007 to January 2009 is of about 14.45% with respect to this baseline, which yields to a cumulative saving of approximately 506 Hm3 for the whole drought period14
14 The water demand for the period 2005-2007 is of 3500 Hm3/year (www.gencat.cat/aca)
. Although this figure hides heterogeneity among the different municipalities, the Catalan Water Agency states that an approximately 5% water saving has remained after the drought on average for the region.

14
Figure 8. Evolution of the water savings in the Ter-Llobregat system
Source: Agència Catalana del’Aigua (2009a)
Positive percentages indicate ‘savings’, while negative percentages indicate consumption above
reference water demand.
4. The costs of the drought In this section we present an estimation of the costs of the drought both in terms of the cost of the
measures carried out to address the drought event and the effects in terms of the damage to the different economic sectors, the environment and the public. Most of the estimates presented here come from the assessment made by the Agència Catalana del’Aigua (2009b). Three types of costs are included in this section: the costs of the affected economic sectors, indirect costs of the effect of the drought in the Catalan economy and the non-market welfare losses of the population.
4.1. Direct costs of the main economic agents
In this section the direct costs suffered by the River Basin Authority (Agència Catalana del’Aigua), local authorities, water companies, irrigators and other affected sectors are presented. The costs are calculated on the basis of the measures carried out and the losses in terms of sales and agricultural production. In relation to the measures, only alleviation measures and structural measures specifically addressed to face the drought are included. As mentioned in section 3 of this document, this does not include some other structural measures that were already programmed before the drought event started but were brought forward or accelerated due to the extreme event are not accounted here, as they cannot be imputed to the 2007-2008 event. It should be mentioned that the structural measures specifically taken because of the 2007-2008 drought will, however, remain and in general will have served to improve the adaptation capacity of the region to water scarcity.
Table 4 summarizes the direct costs estimated by the Agència Catalana del’Aigua. The total amount of estimated direct costs adds up, for the whole drought period, to 878.09 millions of current

15
Euros. This corresponds to 526.85 per year, taking into account a total duration of the drought event of 20 months (from April 2007 to January 2009). This represents 0.27% of total Catalan GDP for those years.
Next we provide with some insights on the way these estimates where obtained. The table also includes the level of liability that the River Basin Authority itself gives to the exposed figures. It can be observed, that apart from their own expenses, the estimates have a medium to low level of reliability. However, we consider that these estimates are relatively comprehensive and provide with a first good overview of the costs of the 2007-2008 in the signaled economic sectors.
Table 4. Summary of directs costs of main economic agents due to the 2007-2008 event
Sector
Total direct costs
(million current €)
drought period (Ap’07 – Jan’09)
Direct costs (million
current € per year)
Description Reliability %
Catalan GDP*
River Basin Authority 129.02 77.41 Expenses for drought
related measures High 0.04%
Water suppliers 29.65 17.79 Expenses for drought related measures (extrapolation)
Medium 0.01%
Irrigators 104.6 62.76 Production losses Medium to low 0.03%
Gardening and flower companies
350.00 210.00 Production losses Very low 0.10%
Swimming pool and related companies
75.00 45.00 Sale losses Medium 0.02%
Hydroelectric production 212.17 127.30 Production looses Medium 0.06%
Total 900.44 540.26 Addition of above costs Medium 0.27% Source: Adapted from Agència Catalana del’Aigua (2009b) * Year direct costs divided by average GDP for years 2007 and 2008, from regional official statistics of Catalunya (GDP year 2007 = 196,536,908,000 current €; GDP year 2008: 204,127,688,000 current €).
In the case of the River Basin Authority the costs include the costs of the measures for increasing water availability and securing water supply, increasing water quality, monitoring and control activity, and public warning and communication campaigns expenses. The structural costs amount to more than 59 million Euros, the rest being alleviation measures (42 millions) and costs associated with income losses (due to the cut-off of the supply) – almost 27.5 million Euros-. The structural costs should ideally be amortized over future droughts as well, but this is difficult given a lack of data. The total losses of the River Basin Authority for one year period15 add up to 10.38% of its budget for 200816
15 The drought event lasted from April 2007 to beginning of 2009, thus 20 months. The total costs reported here have been calculated for a one year period (12 months), i.e. dividing the total cost figures by 20 and multiplying by 12. 16 Diari Oficial de la Generalitat de Catalunya. Num. 5038-31.12.2007: Budget of the Government of Catalonia assigned for 2009 to the Agència Catalana del’Aigua equals to a total amount of 745.963.245 €.
.

16
Local authorities and water companies (water suppliers) had to assume the purchase of water for contingency plans, communication campaigns and monitoring, as well as investments on the improvement of infrastructures and the delivery of the households’ water saving devices. The figure presented in Table 4 is calculated on the basis of the information provided by some water companies and extrapolated to the rest of Catalonia.
The information given for the rest of the sectors is much less reliable. In the case of irrigators the Agència Catalana del’Aigua (2009b) gathers the information published by the media on that period about different estimations on the losses of the farmers, making it almost impossible to identify the sources and asses the quality of the estimation. What seem the best estimations are for the losses on winter cereals for year 2008 coming from a report from the Farmers Union (Uniò de Pagesos, 2008) and it is what is shown in Table 4. Thus this figure does not include other crops and the year 2007.
In relation to the gardening and flower production companies, the report informs that the sector provided with losses based on a decrease of 20 to 30% of the sales that rise up to 700 to 1.050 million Euros. However the Agència Catalana del’Aigua consider these figures as an overestimation and provide its own numbers, based on the decrease on the Gross Added Value in relation to a pre-drought average. The information from other companies affected by the drought such as swimming-pool providers, saunas and SPAs companies come from information published in the media, vaguely citing the sector itself.
Finally, the estimations for the hydroelectric sector are based on the decrease on the production in relation to the yearly average production (2003-2006) multiplied by an average price obtained from the electricity market price of the company Red Eléctrica Española (70.72€/Mwh for 2007 and 98.59€/Mwh for 2009 ).
For the rest of the economic sectors, the Agència Catalana del’Aigua (2009b) only counts with some qualitative assessment of the possible effects due to the drought.
4.2. Indirect costs on the Catalan economy
The River Basin Authority has also estimated the indirect cost of the decrease on water availability affecting the Catalan economy during the dry period. These calculations are done on the basis of the Input-Output Tables approach (Leontief, 1941), following the approach proposed by Puig et al. (2008). This approach consists on the estimation of the Gross Added Value (GAV) losses due to the decrease on water supply of different economic sectors. The economic activities that received water supply by alternative methods (e.g. water tankers) were assumed not to suffer losses. Once the GAV losses obtained, the total production losses per sector was estimated using the Ghosh model (Ghosh 1958). Details on the specific application of this method to the case study can be found in Agència Catalana del’Aigua (2009b). Table 5 presents a summary of the average indirect losses of production in the different sectors.
It should be mentioned that the use of the Input-Output tables for the estimation of indirect costs implies not accounting for behavioural changes and input substitution and their results may be seen as an upper bound estimate of the losses (Markandya et al. 2009).
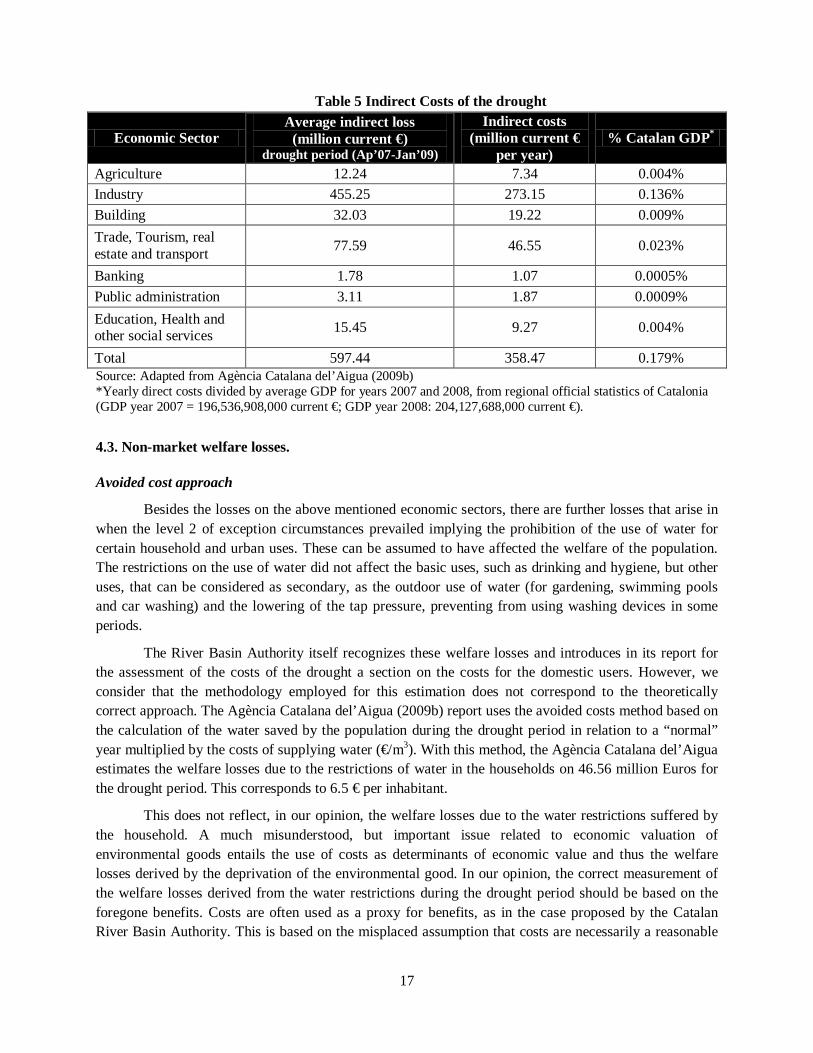
17
Table 5 Indirect Costs of the drought
Economic Sector Average indirect loss
(million current €) drought period (Ap’07-Jan’09)
Indirect costs (million current €
per year) % Catalan GDP*
Agriculture 12.24 7.34 0.004% Industry 455.25 273.15 0.136% Building 32.03 19.22 0.009% Trade, Tourism, real estate and transport 77.59 46.55 0.023%
Banking 1.78 1.07 0.0005% Public administration 3.11 1.87 0.0009% Education, Health and other social services 15.45 9.27 0.004%
Total 597.44 358.47 0.179% Source: Adapted from Agència Catalana del’Aigua (2009b) *Yearly direct costs divided by average GDP for years 2007 and 2008, from regional official statistics of Catalonia (GDP year 2007 = 196,536,908,000 current €; GDP year 2008: 204,127,688,000 current €).
4.3. Non-market welfare losses.
Avoided cost approach
Besides the losses on the above mentioned economic sectors, there are further losses that arise in when the level 2 of exception circumstances prevailed implying the prohibition of the use of water for certain household and urban uses. These can be assumed to have affected the welfare of the population. The restrictions on the use of water did not affect the basic uses, such as drinking and hygiene, but other uses, that can be considered as secondary, as the outdoor use of water (for gardening, swimming pools and car washing) and the lowering of the tap pressure, preventing from using washing devices in some periods.
The River Basin Authority itself recognizes these welfare losses and introduces in its report for the assessment of the costs of the drought a section on the costs for the domestic users. However, we consider that the methodology employed for this estimation does not correspond to the theoretically correct approach. The Agència Catalana del’Aigua (2009b) report uses the avoided costs method based on the calculation of the water saved by the population during the drought period in relation to a “normal” year multiplied by the costs of supplying water (€/m3). With this method, the Agència Catalana del’Aigua estimates the welfare losses due to the restrictions of water in the households on 46.56 million Euros for the drought period. This corresponds to 6.5 € per inhabitant.
This does not reflect, in our opinion, the welfare losses due to the water restrictions suffered by the household. A much misunderstood, but important issue related to economic valuation of environmental goods entails the use of costs as determinants of economic value and thus the welfare losses derived by the deprivation of the environmental good. In our opinion, the correct measurement of the welfare losses derived from the water restrictions during the drought period should be based on the foregone benefits. Costs are often used as a proxy for benefits, as in the case proposed by the Catalan River Basin Authority. This is based on the misplaced assumption that costs are necessarily a reasonable

18
approximation of benefits and that the benefits are at least as great as the costs involved in repairing, avoiding or compensating for damage. Such cost based measures of value are derived from the supply of goods and services and should not be confused with demand-based measures. Whereas demand based valuation techniques attempt to derive recognised measures of economic value, such as consumer surplus or the measures of welfare, cost based approaches do not. As such they do not correspond with the notion of total economic value and measures of willingness to pay. Instead, these approaches provide a proxy of value by considering supply-side aspects. Cost based estimates are widely applied due to the relative ease in their use and availability of data. However, it is important to be aware of the limitations in terms of the information they convey. Since costs do not really measure total economic value, application of cost based approaches risks the under-valuation of water resources and hence the under-valuation of related environmental damage. However, they can still be useful as long as they are considered as a lower bound of the true value of costs. Next we provide with some insights on an application of the benefit approach based on public’s willingness to pay for the estimation of the environmental costs of the damage to the environment and public associated to the drought event, through a value transfer exercise.
An additional element is that in the estimations of the River Basin Authority only the welfare losses due to the restrictions on the domestic use of water are considered. It has been shown (Martin-Ortega et al. 2009) that individuals also derive a welfare loss associated with the environmental damage occurred as a consequence of the negative effects of water scarcity in the river basin ecosystem. These losses are not accounted for in the Agència Catalana del’Aigua report. Next we try to account for this on the basis of the willingness to pay for avoiding household’s water restrictions.
Benefit approach for the estimation of the environmental costs
We propose a benefit approach in which the non-market welfare losses generated by the drought event in Catalonia are defined as the foregone benefits derived from the worsening of the environmental conditions of the river basin and the increase on the probability of restrictions to the household.
An alternative to carrying out a new original valuation study for the estimation of environmental costs (which is out of the scope of the Xerochore Project) is to use existing economic value estimates from previous studies – so called ‘benefits transfer’. This technique applies the results of previous environmental valuation studies to new policy or decision-making contexts. In the literature, benefits transfer is commonly defined as the transposition of monetary environmental values estimated at one site (study site) to another site (policy site) - Boyle and Bergstom (1992)-. The study site refers to the place where the original study took place, while the policy site is a new site where information is needed about the monetary value of similar benefits.
We propose for the estimation of the non-market costs of the drought damage to society in the Barcelona case to apply value transfer of the estimates based on the application of stated preferences techniques (Bateman et al. 2002) in a close-by river basin. These estimates are obtained from the 6th European Framework Project AquaMoney17
17 AQUAMONEY: Development and Testing of Practical Guidelines for the Assessment of Environmental and Resources Costs and Benefits in the WFD. EU 6th Framework Programme. Contract # SSPI-022723.
. The AquaMoney Project is aimed at the development and testing of guidelines for the estimation of environmental and resource costs and benefits from the Water Framework Directive. These Guidelines aim at providing guidance on key issues in economic valuation related to the implementation of the European norm. The Guidelines look at the application of the
http://www.aquamoney.org.

19
valuation methods and techniques to value water resources in the specific context of the WFD and practical case studies are carried out. A particular set of case studies in the Mediterranean Region look at the values of environmental damage due to water scarcity. A stated preferences choice experiment [(Train (2003), Hanley et al. (2001), Bateman et al. (2002), Hensher and Johnson(1981)] was applied in four river basins in Southern Europe: the Serpis, Guadalquivir and Tajo river basins in Spain, the Po River basin in Italy and the Lesvos Island in Greece. A common valuation design was applied to all river basins, allowing for the testing of transferability of values. Besides the environmental benefits of allocating enough water to the environment to ensure the provision of ecosystem services, the value of water availability for households was also estimated, in terms of the reduction of the probability of water restrictions. This set up makes it particularly attractive for its use in the Barcelona drought case study, as there was both a lowering of the environmental flows in the river basin and household water restrictions for secondary uses due to the water scarcity conditions provoked by the drought episode.
Next we present a description of the AquaMoney valuation exercise and then, how the values were transfer for the Barcelona case.
- Poor (status quo): Expected future situation of low water levels and environmental quality status. This is a large deviation from the natural situation due to the increased water scarcity conditions. Many fish species will disappear and riverbanks will lose most of their vegetation. As a result most birds and insects will disappear too.
Valuation of environmental damage and household water restrictions with choice experiment
A non-labeled fractional factorial orthogonal design was elaborated with the combination of two attributes (environmental status related to the water flow in the river basin and probability of water restrictions in the household) plus a monetary attribute (amount of money to be added to the water bill per year per household). Respondents from a representative sample of each of the different river basins were asked to select the most preferred alternative out of three (in four choice occasions per person), in which different scenarios of water allocation to the environment and different probabilities of water restrictions to the households were presented. One of the options was always the baseline situation (future expected probability of water restrictions to households and poor environmental status in the river basin if no measures are taken in a horizon of 10 years). Options A and B were always presented as an improvement in relation to the baseline situation.
Respondents were informed that securing future water supply for the environment means that water levels in rivers and aquifers increase, reducing the risk that they will dry out forever and improving living conditions for a variety of fish, plants and other animals living in and near the water. Three possible levels of improvement were proposed, corresponding to the WFD categorization (section 1.2.1 Annex V) and compared to the expected ‘poor’ situation (status quo) with low water levels and environmental quality:
- Moderate: less than average water levels and environmental quality status under natural conditions. This is still a substantial deviation from the natural situation. A limited number of fish species are present. Riverbanks have some vegetation supporting a limited number and variety of birds and other wildlife. - Good: water levels and environmental quality status are close to their average natural levels. This is a small deviation from the natural situation. Under these conditions riverbanks have a lighter than natural vegetation cover. As a result the breeding and nesting conditions for a number of species are limited.

20
- Very good: water levels and environmental quality status are in their natural state where there is almost no pressure from human activities. Conditions for wildlife are optimal under these circumstances.
Household water restrictions were defined in terms of probability of restriction for sprinkling gardens, washing machines and other secondary uses of water during certain hours in dry summers. The improved environmental conditions and the reduction of the likelihood of restrictions could be obtained in exchange of an increase of the water bill for households in the next ten years. Four levels of probability of restrictions were established in terms of numbers of years within the next 10 years in which there will be water restrictions (1, 2, 3 or 4 years in the next 10 years). More details of the experimental design and the implementation of this valuation exercise can be found at www.aquamoney.org.
Results of the choice modelling for all case studies show that the river basin populations attach significant positive values for the reduction of household water restrictions and the improvement of the environmental quality of the river basin related to the maintenance of certain levels of water in the river. The aim of the AquaMoney assessment is the estimation of the environmental benefits derived from the improvement of the river basin status. The transfer of these values to be used as non-market costs of the drought episode in Barcelona is based here on the consideration of the costs as the foregone benefits of the worsening of the ecological status of the river basin due to the low flow of water and of to not assuring household water supply. Next the details of the value transferability are explained.
For the purpose of transferability to the Barcelona drought study, we use the results of the AquaMoney case study of the Serpis river basin. The choice of this particular river basin, among the five AquaMoney case studies, is based on its proximity to Catalonia, and thus the assumed sharing of environmental and, to some extent, socio-demographic characteristics. The Serpis River Basin is located at the East of Spain (as well as Catalonia), within the domain of the Jucar River Basin District. The basin often suffers droughts, which can be classified as moderate, severe, and critical.
Value transfer for the Barcelona case study
Figure 9 illustrates the way in which the value transfer was approached for these two attributes.
Figure 9. Example of choice card of the AquaMoney Water Scarcity Case Studies
Adapted from Martin-Ortega et al. (2009)

21
After a pre-testing process, a total number of 395 interviews, applying the above described choice experiment, were carried out face-to-face to a cross-sample of the river basin population during the months of June and July 2008.
Figure 9 shows how we approximate the welfare loss due to the environmental damage as the welfare loss from passing from a situation in which there is enough water to maintain the good and moderate ecological status of the river basins to a situation of poor ecological status due to the lack of water in the river basin that is assumed during the drought period. In the case of the water restrictions, what is available from the Serpis river basin is the welfare loss derived from the passing from a situation of low probability of restriction sin secondary domestic uses to a high probability18
The attribute ‘reduction of household water supply’ is modelled as a continuous variable reflecting the probability of water restrictions (from the baseline, 4 years out of 10, to 1 year out of 10). The results of the MNL for the Serpis River Basin are presented on
. This is not exactly the situation that we have in the Barcelona case study, in which we have a situation (prior to the drought) with no restrictions (although with a certain probability of restrictions), to a situations with indeed restrictions. Total avoidance of probability of restrictions is, however, not possible even in normal conditions under normal Mediterranean climate. So we assume that the WTP for reducing the probability of restrictions is as reasonable approximation of the value of the foregone benefits in case of restrictions. We are aware that this can only be an approximation and results should be interpreted with care, although they can serve as an illustration of the magnitude of this type of non-market welfare losses.
A Multinominal Logit Model (MNL) was estimated by including the different levels of improvement for the environmental quality as dummy variables (i.e. variable ‘moderate’ takes value 1 for the improvement from the baseline (poor level of environmental quality) to the moderate level, and 0 otherwise; variable ‘good’ takes value 1 for the improvement from the baseline to the good level, and 0 otherwise). We look at these two levels of improvements as it is what corresponds to the changes identified in during the drought event affecting Barcelona. We have thus allowed for two levels of baseline (moderate and good) that are assumed to go down to the lowest level of quality (poor) during the drought period. We assume that we can use these values as they are yearly values, and according to the report on the consequences elaborated by the Agència Catalana del’Aigua (2009a) the environmental flows were below average from November 2007 to December 2008, thus one year.
Table 5.
The coefficients on Table 5 should be interpreted as followed: the coefficient for the domestic supply represents the change in utility related to the change of probability of water restrictions to the household of one year out of ten. The negative sign indicates that people derive positive utility from the decrease of the probability. The coefficients for the environmental quality attributes represent the utility changes derived from the change from the ‘poor’ level of water quality to the ‘moderate’ and ‘good’ levels respectively19
18 In the AquaMoney approach, low probability of water restrictions is defined as that there would be water restrictions in one year within the next 10 years and high probability is defined as a probability of water restrictions in 4 years within the next 10. 19 It should be noticed that in the AquaMoney case study this change is observed in this direction, from ‘poor’ to ‘moderate’ and to ‘good’ as the study was aimed at obtaining the benefits of improving the water status. In the Barcelona case study we use these estimates in the opposite direction: we estimate the welfare loss derived from the ‘moderate’ and ‘good’ levels (baseline prior to the drought event) to the ‘bad’ level attained during the drought. These are assumed as foregone benefits, i.e. costs.
.

22
Table 5. MNL model of the attributes for the AquaMoney Serpis River Basin
Variable Coef. Std. Error P[|Z|>z]
ASC 1.31 0.17 0.00 Domestic Supply -3.84 0.44 0.00 Moderate Environmental Quality 0.83 0.09 0.00 Good Environmental Quality 1.34 0.10 0.00 Cost -0.01 0.00 0.00 Log likelihood function -1570.82 Number of obs.* 1576 Source: www.aquamoney.org *1576 observations correspond to 395 interviews times 4 choice occasions (1580) minus some missing values.
The methods used for transfer can be broadly categorized into two types (Navrud and Ready, 2007). The simplest approach is to transfer mean values from the study site to the policy site (e.g. Muthke and Holm-Mueller, 2004). Such ‘univariate’ transfers are frequently used in practical decision making but are crucially dependent upon the pertinence of differences between transfer sites. Clearly at some level all sites are dissimilar (e.g. the spatial pattern of substitutes around a site is unique) and the degree of this dissimilarity affects values and determine the appropriateness of univariate transfers. It is because of such concerns that multivariate transfer approaches have been developed in which not mean values but value functions are used for the transfer. While parameters are kept constant, the values of the explanatory variables to which they apply are allowed to vary in line with the policy site (Bateman et al. 2009).
In this case, we base the transfer on the mean values estimated for the Serpis River Basin, as we do not have specific information on the policy site for using the value function approach. The corresponding consumer surplus values have been derived from the above model, using expression (1):
p
qCS ββ−
= (1)
Were βq corresponds to the coefficients of the attributes and βp is the coefficient of the monetary attribute. The standard errors were calculated using the Delta Method (Greene, 2003) and the results are shown on Table 6.
Table 6. Consumer surplus of the AquaMoney Serpis case study
Consumer Surplus (€ per
household/year) Standard
Error Domestic Supply 297.65 43.50 Moderate Environmental Quality 64.067 10.09 Good Environmental Quality 104.00 13.13
Source: www.aquamoney.org

23
The value of improving the environmental quality of the river basin by assuring a certain water flow in the river basin has been estimated in the model as 64 € per household per year from the ‘poor’ level to the ‘moderate’ level and of 104 € per household per year from the poor level to the good level. In the application to the Barcelona study this is treated as in the baseline (prior to the drought episode) the Catalan river basins are assumed to be at the moderate and good level and during the drought episode they are assumed to be at the poor level. This mean that the costs in terms of public’s welfare losses are between 64 and 104 € per household per year. It should be noticed that this approximation implies the assumption that the environmental damage only last one year, which is probably not the case and the environmental consequences can remain on the system or only come out later by accumulative effect.
The value of reducing the probability of water restrictions for secondary uses in the households (from 4 years out of 10 to 1 year of 10) in the AquaMoney study is of 297.65 € per household per year. Here we assume this figure as to be the welfare loss from a situation with no restrictions to a situation which restrictions in the secondary uses of water.
We now need to aggregate this individual (household) values for the whole population affected by the drought in the study area (social cost). A total of 5.5 million people is said to have been affected by the water scarcity conditions. According to the Official Regional Catalan Statistics Office, there is an average of 2.7 persons per household20. This adds up to a total of 2,037,037 households. Taking in to account a 2% of protest answers21 Table 7 in the Serpis study, the aggregated values are shown on . As the time period in which the water environmental flow was below average conditions is one year, this values can be aggregated for the population affected (no need to add up for several years).
Table 7 Aggregated non-market costs of drought in the Barcelona Case Study - November 2007 to December 2008
Total number of households 2,037,037 Protest answers 2% Total number of WTP households 1,996,296 Costs due to restrictions in the domestic supply (million €) 594.19
Environmental costs (million €) 127.89 - 207.61 Total non-market costs due to the drought (million €)
722.09 - 801.81
We observe that the benefit approach shows an order of magnitude higher numbers that the ones estimated by the avoided costs method by the Agència Catalana del’Aigua for the welfare losses related to the restrictions in the water supply for households (595.19 million € face to 46.56 million € respectively). The application of the value transfer is not exempt of limitation, and the existence of very important transfer error has been identified by the literature. However, even if we apply a range of transfer errors as the ones reported by Brouwer (2000) for the transfer of adjusted means (from 20 to 40%), we still obtain 20 http://www.idescat.cat/ 21 Protest answers refer to the individuals that state not to be willing to pay for proposed environmental change but cannot be consider to allocate a zero value to the good or service (legitimate zero), but who reject the valuation exercise for ethical reasons (Hanley , 1996) or have concerns about the payment vehicle (Morrison et al. 2000), among other reasons. In the Serpis case study Protest answers were excluded from the WTP analysis, as common practice in the literature (Dziegielewska and Mendelsohn, 2007).

24
significantly higher losses (356.514 million €). Even if we assume a transfer error of 80%, the losses would still be on the hundreds million € (118.83 million €); suggesting clearly an under-estimation of the losses with the avoided cost approach.
On the top of this, there are the welfare losses derived from the loss of environmental quality in the river basins during the drought period, that we have estimated between 128 to 207 million €.
4.4. Summary of the 2007-2008 drought costs and cost-effectiveness considerations
In Table 8 we summarize the total costs estimated for the drought period. They have been estimated for a one year period and related to the Catalan GDP. The direct and indirect costs add up to 898.73 million € (0.45% of total Catalan GDP). Adding the non-market welfare losses estimated for the water restrictions in households for secondary uses, and the social costs related to the worsening of the environmental conditions of the river basin due to water scarcity, this figure almost doubles, up to 1660 million €, almost reaching 1% of the regional GDP22
Table 8. Total cost of the drought event in Barcelona for one year period
. This figure is similar to the one estimated for the drought affecting Australia in 2006-2007 (RBA, 2006).
Cost (million €
per year)
% Catalan
GDP Direct costs 540.26 0.27% Indirect costs 358.47 0.18% Non-market welfare losses 761.95 0.38% Total costs 1660.68 0.83%
In Table 9 the total costs are presented distinguishing between the costs of the measures implemented to deal with the drought (expenditures of the River Basin Authority and water suppliers) and the costs of the drought itself (direct losses, indirect losses and non-market losses). From the expenditures of the River Basin Authority and the water suppliers (shown in Table 4), the income losses due to the cut-off of the supply (18.67 million €) have been deducted and attributed to the drought losses. It is worth noting how small are the outlays on the measures relative to the total value of the losses. It would appear that the authorities depend much more heavily on passing the burden of adjustment to the users than in undertaking actions themselves. Whether this is the appropriate division or not will depend on how much each expenditure relates to the volume of water – i.e. on its cost effectiveness. We consider this below.
Comparing the estimates reported here with the total annual costs of drought estimated for whole of Europe by the Directorate General of Environment for the recent years, 6.2 billion Euros (0.05% of the Euroarea’s GDP) as reported in Markandya et al. (2009), suggests a possible underestimation of the European figures: even if we do not consider the non-market losses, the costs add up to almost 1 billion Euros for this single drought event affecting a relatively small region, while it is known that other areas of Europe have also been affected in the recent years, if only the rest of Spain.
22 The total non-market welfare losses have been calculated by using the mid-point estimates for the environmental attribute (127.89 - 207.61 million €).

25
Table 9. Costs of the measures and costs of the losses for one year period
Cost (million € per year)
Cost of the measures 76.52 Total value of the losses 1584.15
Water Agency and suppliers income losses 18.67 Direct losses affected economic sectors 445.06
Economy indirect losses 358.47 Non-market welfare losses 761.95
In order to increase the relevancy of this costs assessment, a cost-efficiency analysis of the measures should be carried out. This analysis requires data (not yet fully available) on the total amount of water put into the system by each of the supply measures; the total amount of water saved by demand side measures and detailed costs of each of the measures. Table 10 gives a preliminary idea of the cost-efficiency ratio of demand side measures and some of the supply side measures for which there is information available. The demand side cost-efficiency ratio is calculated relating the estimated welfare loss due to water restrictions in the secondary uses of water (594.19 million €), plus the public expenditures in communication and awareness rising campaigns (3.65 million €), to the total amount of water saved by the restriction measures (506 Hm3), obtaining a ratio of 1.18 €/m3. On the supply side, we include the cost-efficiency of the water shipping, the carry out of water by lorry, the recovery of wells and ground water supply, and the supply of desalinated water via the enlargement of an existing desalination plant -all economic information coming from Agència Catalana del’Aigua (2009b)-. It can be observed that, in general, the constraint of the demand is significantly more cost-efficient that the supply measures implying the provisioning of water by transport -the case of the water shipping is dramatic (above 32 € per m3)-. Other supply-side measures implying infrastructure interventions have lower cost-efficiency ratios due to their duration on time. It should be taken into account that these measures are not only alleviation measures but imply an increase on the adaptative capacity for facing water scarcity and drought.
Table 10. Cost-efficiency ratio of some of the implemented measures
Measure Cost-efficiency ratio (€/m3)
Demand constraint 1.18 Water shipping 32.59 Water transport by lorry 2.3 Well recovery and groundwater supply* 0.18 Desalinated water supply (desalination plant enlargement)**
0.48
Elaborated from Agència Catalana del’Aigua (2009b). *Average cost for different wells and groundwater exploitation
**Cost reported for the enlargement of the desalination plant of La Tordera in 10 additional Hm3

26
5. Conclusions and further research
The Barcelona exceptional drought event taking place between spring 2007 and the end of 2008 serves us as an illustrative case study for the assessment of the economic costs of drought in Europe. The main focus is the drought affecting the so-called Ter-Llobregat system within the Catalonia Inland Basins, from which the Metropolitan area of Barcelona is fed and where most of the population is concentrated (approximately 5.5 million people). This drought event can be considered the most severe event, in terms of both duration and intensity, affecting this area in almost the last century. Besides, climate change projections suggest, with a high level of certainty, that the frequency of drought events may double and that their duration and intensity may increase (medium level of certainty) due to the decrease of the minimum rainfall and increased evaporation due to temperature rise in the region.
The Government of Catalonia displayed an important set of measures to face the drought, aimed at avoiding the restrictions for human consumption in the household including both demand and supply measures. The measures included municipal demand-control actions such as reducing the watering of gardens, closing ornamental fountains, reducing the cleaning of streets with drinkable water, controlling the filling of private swimming pools, the production of municipal contingency plans for municipalities but also supply measures, such as groundwater pumping and desalination and the shipping of water from France. An important feature of the process of drought and its management is that, as a consequence of the communication campaigns and the social and institutional warning, an important reduction of water demand occurred during the drought period (5%).
In this paper the total costs attributable to this drought event have been reported. The direct costs have been obtained from the River Basin Authority (Agència Catalana del’Aigua) and correspond to expenses for drought related measures of the River Basin Authority itself (adding up to more than 10% of its budget) and public water companies. The direct production losses of affected sectors (such as farming, gardening, swimming-pool companies and others) have also been reported. Total direct costs have been estimated more than 540 million of Euros for one year period.
The River Basin Authority has also estimated the indirect cost of the decrease on water availability affecting the Catalan economy during the dry period. These calculations are done on the basis of the Input-Output Tables approach and losses of the Gross Added Value of different economic sectors. The total indirect losses have been estimated in almost 360 million Euros for one year period. The addition of the direct and indirect costs calculated by the River Basin Authority sums up to almost 900 million €, a 0.45% of the Catalan GDP.
Finally, in this study we have incorporated the non-market welfare losses occurred as a consequence of the drought. Two types of non-market costs have been identified: those related to the decrease of the ecological status of the river basin due to the lowering of water flows (reduction of the provisioning of ecosystem services) and those related to the social welfare losses due to the restrictions of water supply in the households for secondary uses (outdoor use, use of washing machines, etc.). These costs have been estimated on the basis of value transferability of a stated preference valuation of environmental costs in a nearby river basin and add up to 762 million Euros for both types of costs.
In the overall, the total costs of the extreme drought event of 2007-2008 have been estimated as 1661 million € for one year period, representing almost 1% of the Catalan’s GDP, from which 95% corresponds to actual losses and the rest to the measures taken to avoid restrictions to human consumption. The order of magnitude of these estimates is similar to the ones reported for the United

27
States and Australia in the recent years, showing the level of magnitude of this drought event. This calculation also suggests that the current estimation of costs done at the European level may suffer from underestimation and pointing out the necessity of carrying out more specific and accurate studies at the European level.
The study presented here is not exempt of limitations. Firstly, not all the direct costs reported here have been estimated with a high level of reliability. This is particularly the case for the costs on the agricultural sector and the gardening and swimming-pool companies sectors for which the information reported by the River Basin Authority does not allow for a proper identification of sources and assessment on the quality of the data. Regarding the calculations of the indirect costs, the limitations of the Input-Output Tables approach should be taken into account when interpreting the results.
As far as the non-market welfare losses for the environmental damage and the restrictions to household water supply are concerned, as any value transferability exercise, the estimates reported here are expected to be subject to significant transfer errors, due to the differences on the environmental conditions of the policy and study site and the socio-demographic differences of the involved population, but also due to the fact that the valuation exercise was not explicitly designed for the purposes for which is used here, and thus some adjustments and assumptions have been made. This is why these estimates should be interpreted with caution. However, we believe that they can provide with an illustrative idea of the magnitude and importance of these costs; which are normally not accounted for when using the approach of the avoided costs, leading to under-estimation of cost assessment.
Long term and some higher-order effects are not necessarily reflected in this analysis, including both market and not-market losses. As it is known, drought losses can become fully observable only in months and years after the end of the drought event.
In order to increase the relevancy of this costs assessment, a cost-efficiency analysis of the measures should be carried out. This analysis requires data (not yet fully available) on the total amount of water put into the system by each of the supply measures; the total amount of water saved by demand side measures and detailed costs of each of the measures. A CEA would provide with insights on the appropriateness of the different kinds of measures. However, the available information present in this study already supports the claim that demand side measures are significantly more cost-effective as alleviation measures (face to water transport).
Another topic that requires further research is the issue of how to attribute the costs of the structural measures to individual drought events. It has been shown in this study that supply-side measures that imply infrastructure intervention have lower cost-efficiency ratios due to the duration on time of the provisioning of the service. This points out that structural measures that increase the adaptative capacity face to water scarcity and drought are less costly than alleviation measures. Water scarcity in general and the expected increase on frequency and intensity of drought events due to climate change will require the implementation of structural measures to increase the adaptative capacity of the territories. The estimation of the costs of adaptation to climate change is still and under-researched area and any future assessment of the costs of drought should to be embedded in this process.
An important feature of the Barcelona case study, is relevancy of the awareness rising and public communication campaigns, leading to significant reductions of the demand that are maintained after the drought event ended. This measures have been set in the development of a whole set of public participation initiatives that are met to be integrated in the process of implementation of the Water

28
Framework Directive. The monitoring of this process should contribute to improve the knowledge on the potentiality of public participation as a tool for socially oriented governance of drought management policies.
Finally, in this paper we have estimated the costs of the Barcelona drought event considering the measures that were actually carried out to face water restrictions to current normal demand. This does not imply that these measures were necessarily the most appropriate according to all criteria and that political controversy regarding water management in Spain has not played a role in the decision making process. Moreover, the costs of the measures to avoid restrictions are obviously dependant on the baseline of water demand to which it is calculated. It could be argued that the increase of the demand of the recent year sets up an “unreasonable” or unsustainable baseline and that the welfare losses derived from not reaching the “upgraded normal” demand represent an over estimation. Both debates, both relevant and appealing, were out of the scope of this paper but constitute interesting material for future research and debate.

29
References
Agència Catalana del’Aigua (2009a). Treballs de recolzament a l’àrea d’inspecciò i control per a la recopilaciò de dades, resum i tancament de l’episodi de sequera del 2008 a Catalunya. CTN0802017. Generalitat de Catalunya. Departament de Mediambient i Habitage. http://aca-web.gencat.cat/aca/appmanager/aca/aca/.
Agència Catalana del’Aigua (2009b).Valoració dels costos econìmcs de la sequera a Catalunya 2007-2008. Generalitat de Catalunya. Departament de Mediambient i Habitage.
Agència Catalana del’Aigua and Fundación Nueva Cultura del Agua (2009). Aigua i canvi climàtic. Diagnosis dels impactes previstos a Catalunya. Generalitat de Catalunya. Departament de Mediambient i Habitage. http://aca-web.gencat.cat/aca/appmanager/aca/aca/.
Altava-Ortiz V, Barrera-Escoda A, Llasat MC, 2008. Monitoratge, classificació i reconstrucció de registres de sequera a Catalunya. Primeres Jornades de Meteorologia i Climatologia de la Mediterrània Occidental. Barcelona, 28th November 2008.
Calbó, H., Cunillera, J., Llasat, C.M., Llebot, J.E., and Martín-Vide, J. (2009). Projeccions climàtiques per a Catalunya. In: Agència Catalana del’Aigua and Fundación Nueva Cultura del Agua (2009). Aigua i canvi climàtic. Diagnosis dels impactes previstos a Catalunya. Generalitat de Catalunya. Departament de Mediambient i Habitage. http://aca-web.gencat.cat/aca/appmanager/aca/aca/ Barrera-Escoda, A. (2008): Evolución de los extremos hídricos en Catalunya en los últimos 500 años y su modelización regional. PhD thesis, Departament of Astronomy and Meteorology, University of Barcelona, Barcelona, Spain. Internal Publication, 319 pp. (http://www.zucaina.net/Publicaciones/Barrera-Escoda-TESIS-2008.pdf).
Bateman, I. J., B. Carson, B. H. Day, N. Hanemann, N. Hanley, T. Hett, M. Lee, G. Loomes, S. Mourato, Ozdemiroglu E., D. W. Pearce, R. Sudgen, and J. Sawanson, (2002). Economic Valuation with Stated Preference Techniques: Summary Guide. Edgar Elgar, Massachussets
Boyle, K. J., and J. C. Bergstrom, (1992). Benefit Transfer Studies: Myths, Pragmatism and Idealism. Water Resources Research, 28; 657-663.
Dziegielewska, D.A. and Mendelsohn, R. (2007). Does “No” mean “No”? A protest methodology. Environmental and Resource Economics, 38: 71-87.
Garrido, A. (2009). La fragementación de los ríos en España. Soitu Medioambiente. www.soitu.es
Generalitat de Catalunya (2007). La situació actual d’exceptionalitat en el context històric. http://aca-web.gencat.cat/aca/documents/ca/sequera/introduccio.pdf.
Ghosh, A. (1958). Input-Out Approach in an Allocation System. Economica, 25 (97); 58-64.
Greene, W. H., (2003). Econometric Analysis. Prentice Hall, New Jersey.
30
Hanley, N., S. Mourato, and R. Wright, (2001). Choice Modelling Approaches: a Superior Alternative for Environmental Valuation? Journal of Economic Surveys, 15 (3); 435-462.
Hanley, N., (1996). Ethical Beliefs and Behaviour in Contingent Valuation Surveys. Journal of Environmental Planning and Management, 39(2); 255-272.
Hensher, D., and L. Johnson, (1981). Applied Discret Choice Modelling. Wiley, New York.
Huntingford, C., Jones, R. G., Prudhomme, C., Lamb, R., Gash, J. H. C. & Jones, D. A. (2003) Regional climate-model predictions of extreme rainfall for a changing climate, Quart J. Roy. Met. Soc. 129: 1607–1621.
IPCC (2007) Working Group I Fourth assessment report ‘The Physical Science Basis’. Geneva, Switzerland.
Llasat , M.C., Martín-Vide, J. and López Bustins, J.A. (2009). Constatacions de carácter meteorològic a Catalunya. In: Agència Catalana del’Aigua and Fundación Nueva Cultura del Agua (2009). Aigua i canvi climàtic. Diagnosis dels impactes previstos a Catalunya. Generalitat de Catalunya. Departament de Mediambient i Habitage. http://aca-web.gencat.cat/aca/appmanager/aca/aca/.
Leontief, W. (1941). The structure of american Economy, 1919-1939. Oxford University Press. New York.
Markandya, A., Mysiak, J., Palatnik, Breil, M., Balzarolo, D. and Martin-Ortega, J., (2009). Economic and Social Impacts of Drought and Demand Side Options – State of the art review. Xerochore Project Background Document. http://www.feem-project.net/xerochore/
Martin-Ortega, J., Brouwer, R., Pulido, M., Raggi, M. Viaggi, D., Álvarez-Farizo, B., Skourtos. M., Kontogianni, K. , Andreu, J. , Berbel, J., Sardonini, L., Ronchi, D., Machleras, T., and Lopez-Nicolas, A. (2009). Modelling Water Security Choices in the Face of Increasing Water Scarcity in South Europe and Tests of Transferability. Water Conference of the European Association of Environmental and Resource Economist. Amsterdam, 24 June. Amsterdam.
Martín-Vide, J., M. Barriendos (1995): “The use of rogation ceremony records in climatic reconstruction: A case study from Catalonia (Spain)”. Climatic Change, 30, pp. 201–221.
McKee TB, Doesken NJ, Kleist J (1993). The relationship of drought frequency and duration to time scales. In: Proc. 8th conference on applied climatology. Anaheim, California, pp 179–184.
Morrison, M. D., R. K. Blamey, and J. W. Bennett, (2000). Minimising Payment Vehicle Bias in Contingent Valuation Studies. Environmental and Resource Economics, 16(3); 407-422
Muthke, T. and Holm-Mueller, K. (2004). National and international benefit transfer testing with a rigorous test procedure. Environmental and Resource Economics, 29: 323-336.
Navrud, S. and Ready, R. (2007). Review of methods for value transfer. In: Navrud, S. and Ready, R. (eds.), Environmental value transfer: Issues and methods. Springer, Dordrecht, The Netherlands.

31
Puig. I., J. Freire and M. Mestre (2008). Valoració dels costos economics d’una contingencia en l’abastement d’aigua. Agència Catalan de l’ÇAigua. Departament de Medi Ambient i Habitage. Generalitat de Catalunya.
Train, K., (2003). Discrete Choice Methods with Simulation. Cambridge University Press, Cambrigde.
Uniò de Pagesos (2008). Avaluació econòmica dels efectes de la sequera 2008 en el conreu del cereal d’hivern a Catalunya-dades definitives.
Working Group on Water Scarcity and Drought (2006). Water scarcity management in the context of WFD.
Acknowledgement This study is part of the 7th EU Framework Program Project XEROCHORE: An Exercise to Assess Research Needs and Policy Choices in Areas of Drought.: http://www.feem-project.net/xerochore/.
The authors are deeply grateful to the Agència Catalana del’Aigua, whose help was crucial for the elaboration of this study. In particular we acknowledge the valuable assistance of Jordi Pastor (Director of the Management of Water Resources Department and Coordinator of the Drought Management Committee), Andreu Manzano (Hydraulic Engineering), Jorge Helmbrecht (Management of Water Resources Department, Freshwater Section Director), and Gemma Iturbe Iglesias from the Fresh Water Unit.
We also thank Toni Barreda-Escoda (Servei Meteorologic de Catalunya) and Vicent Altava (Astronomy and Meteorology Department, University of Barcelona) for their help with the physical characterization of the drought event.
We are thankful to the AquaMoney Project for the use of non-market values of water under scarcity conditions used in this study for transferability. Particularly to Roy Brouwer, project leader, and Manuel Pulido, Serpis River Basin Case Study leader.
This study was presented at the Xerochore Workshop on the Socio-Economic and Environmental Impacts on Droughts, held in Venice between 5-7th of October 2009, where it got very relevant feedback from the Xerochore network experts, to whom we are thankful.
Only the authors are responsible of the content of this document.

BC3 WORKING PAPER SERIES
Basque Centre for Climate Change (BC3), Bilbao, Spain
The BC3 Working Paper Series is available on the internet at the following address:
http://www.bc3research.org/working_papers/view.html
BC3 Working Papers available:
2009-01 Valentina Bosetti, Ruben Lubowski, Alexander Golub and Anil Markandya: Linking Reduced Deforestation and a Global Carbon Market: Impacts on Costs, Financial Flows, and Technological Innovation
2009-02 Mikel González-Eguino: Market Instruments and CO2 Mitigation: A General Equilibrium Analysis for Spain
2009-03 Aline Chiabai: Analysis and Use of Information and Communication Tools in Economics of Climate Change
2009-04 Ibon Galarraga, Mikel González-Eguino and Anil Markandya: The Role of Regions in Climate Change Policy
2009-05 M.C. Gallastegui and Ibon Galarraga: Climate Change and Knowledge Communities
2009-06 Ramon Arigoni Ortiz and Anil Markandya: Literature Review of Integrated Impact Assessment Models of Climate Change with Emphasis on Damage Functions
2009-07 Agustin del Prado, Anita Shepherd, Lianhai Wu, Cairistiona Topp, Dominic Moran, Bert Tolkamp and David Chadwick: Modelling the Effect of Climate Change on Environmental Pollution Losses from Dairy Systems in the UK
2009-08 Ibon Galarraga and Anil Markandya: Climate Change and Its Socioeconomic Importance
2009-09 Julia Martin-Ortega and Anil Markandya: The Costs of Drought: the Exceptional 2007-2008 Case of Barcelona
2009-10 Elena Ojea, Ranjan Ghosh, Bharat B. Agrawal and P. K. Joshi: The Costs of Ecosystem Adaptation: Methodology and Estimates for Indian Forests
2009-11 Luis M. Abadie, José M. Chamorro, Mikel González-Eguino: Optimal Investment in Energy Efficiency under Uncertainty