jpmorgan japan smaller companies trust plc smaller hy... · detracted from performance over the six...
TRANSCRIPT

JPMorgan Japan Smaller Companies Trust plcHalf Year Report & Financial Statements for the six months ended 30th September 2018
K E Y F E A T U R E S
Your Company
Investment ObjectiveThe Company’s objective is to achieve long-term capital growth through investment in small and medium-sized Japanese companies. Itsbenchmark is the S&P Japan SmallCap NR (in sterling terms).
Investment PolicyIn order to achieve its investment objective and to seek to manage risk, the Company invests in a diversified portfolio of investmentsalmost wholly invested in Japan, emphasising capital growth rather than income. To obtain this exposure, investment is permitted in Japanese quoted companies other than the largest 200 measured by marketcapitalisation, Japanese domiciled or unquoted companies, Japanese domiciled companies quoted on a non-Japanese stock exchangeand non-Japanese domiciled companies which have at least 75% of their revenues derived from Japan. Investment is also permitted inUK and Japanese government bonds. Borrowings may be utilised to enhance shareholder returns.
Dividend PolicyThe Company’s distribution policy is to pay, in the absence of any unforseen circumstances, a regular quarterly dividend equal to 1% ofthe Company’s NAV on the last business day of the preceding financial quarter, being the end of March, June, September and December.
Investment Restrictions and GuidelinesThe Board seeks to manage the Company’s risk by imposing various limits and restrictions as follows: The Company will not invest more than 5% of its assets in any one individual stock, at the time of its acquisition. The Company’s current gearing policy is to operate within a gearing range of 5% net cash to 15% geared in normal market
conditions with maximum levels of 10% net cash or 25% geared. The use of derivatives and currency hedging transactions are permitted with the prior approval of the Board. Such transactions,
when used, will be for the purposes of efficient portfolio management and not for speculative purposes.Compliance with investment restrictions and guidelines is monitored by JPMorgan Funds Limited (‘JPMF’ or the ‘Manager’) and isreported to the Board on a monthly basis. The benchmark index, as well as the limits and restrictions described above, may be variedby the Board at any time at its discretion, although any material changes to the investment policy must be approved by Shareholders inaccordance with the Listing Rules.
BenchmarkS&P Japan SmallCap Net Return (in sterling terms). Comparison of the Company’s performance is made with the benchmark as stated,although investors should note that there is no recognised benchmark that closely reflects the Company’s stated investment policy.
Capital Structure As at 30th September 2018, the Company’s issued share capital comprised 55,944,560 Ordinary shares of 10p each, of which 1,434,221were held in Treasury.
Currency The Company does not currently hedge the currency exposure that arises from having assets and bank debt denominated in Japanese yen.
Management CompanyThe Company employs the Manager as its Alternative Investment Fund Manager. JPMF delegates the management of the Company’sportfolio to JPMorgan Asset Management (Japan) Limited through JPMorgan Asset Management (UK) Limited.
Association of Investment Companies (‘AIC’)The Company is a member of the AIC and complies with both the AIC Code of Corporate Governance and the Financial ReportingCouncil’s UK Corporate Governance Code.
WebsiteThe Company’s website can be found at www.jpmjapansmallercompanies.co.uk and includes useful information about the Company,such as daily prices, factsheets and current and historic half year and annual reports.
FCA Regulation of ‘Non-Mainstream Pooled Investments’The Company conducts its affairs in a way which enables the shares that it issues to be recommended by Independent FinancialAdvisers to ordinary retail investors in accordance with the rules of the Financial Conduct Authority (‘FCA’) in relation tonon-mainstream investment products.The shares are excluded from the FCA’s restrictions which apply to non-mainstream investment products because they are shares in aninvestment trust.
J P M O R G A N J A PA N S M A L L E R C O M PA N I E S T R U S T P L C . H A L F Y E A R R E P O R T & F I N A N C I A L S TA T E M E N T S 2 0 1 8
C O N T E N T S
C O N T E N T S | 1
Half Year Performance 3 Financial Highlights
Chairman’s Statement 6 Chairman’s Statement
Investment Review 9 Investment Managers’ Report
12 Ten Largest Equity Investments 13 Sector Analyses
Financial Statements 15 Statement of Comprehensive Income 16 Statement of Changes in Equity
17 Statement of Financial Position 18 Statement of Cash Flows
19 Notes to the Financial Statements
Interim Management 22 Report
Shareholder Information 24 Glossary of Terms and Alternative
Performance Measures (‘APMs’)
26 Where to buy J.P. Morgan Investment Trusts
29 Information about the Company

Half Year Performance

F I N A N C I A L H I G H L I G H T S
H A L F Y E A R P E R F O R M A N C E | 3
TOTAL RETURNS (INCLUDING DIVIDENDS REINVESTED) TO 30TH SEPTEMBER 2018
1 Source: Morningstar.2 Source: Morningstar/J.P.Morgan, using cum income net asset value per share.3 Source: Morningstar. The Company’s benchmark is the S&P Japan SmallCap Net Return Index (in sterling terms).
A glossary of terms and alternative performance measures is provided on pages 24 and 25.
3 Years 5 Years 10 Years 6 months Cumulative Cumulative Cumulative
Return to shareholders1
Return on net assets2
Benchmark return3
+6.4% +97.3% +122.6% +237.7%
+2.9% +86.9% +120.3% +233.6%
+4.1% +79.8% +96.6% +244.7%
F I N A N C I A L H I G H L I G H T S
4 | J PMORGAN J A PAN SMAL L E R C OMPAN I E S T RU S T P L C . H A L F Y E AR R E POR T & F I N ANC I A L S T A T EMEN T S 2 0 1 8
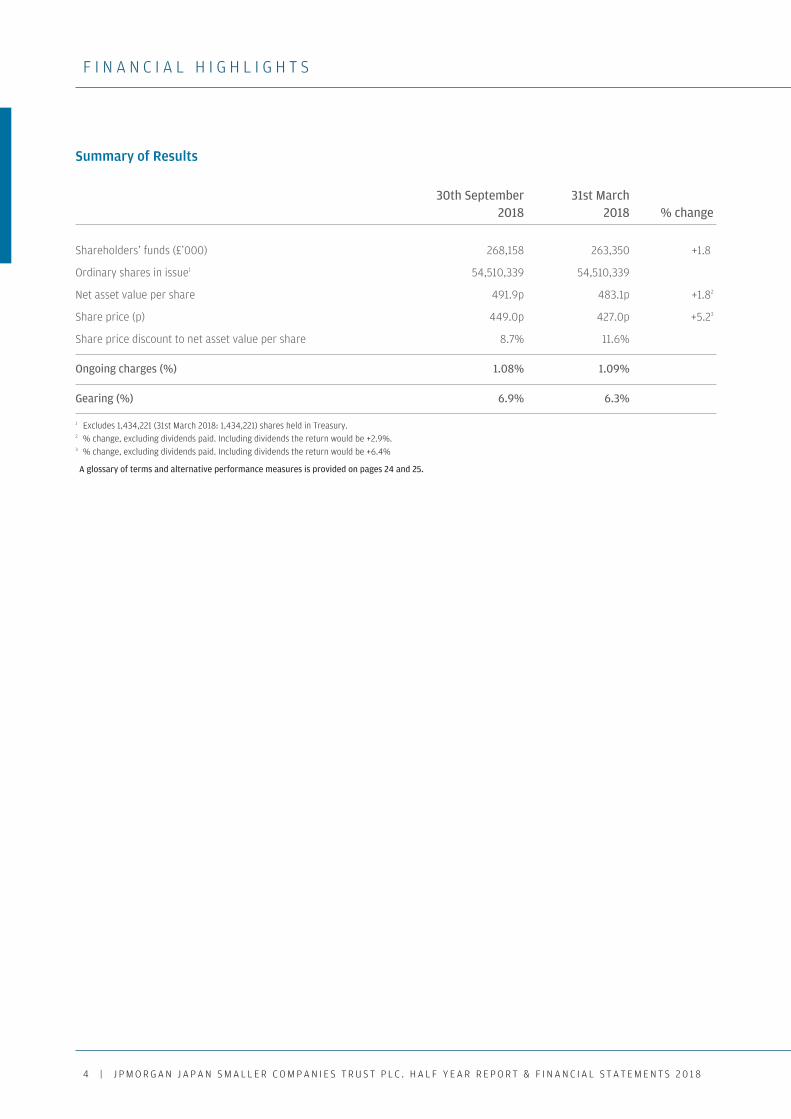
Summary of Results
30th September 31st March 2018 2018 % change
Shareholders’ funds (£’000) 268,158 263,350 +1.82
Ordinary shares in issue1 54,510,339 54,510,339
Net asset value per share 491.9p 483.1p +1.82
Share price (p) 449.0p 427.0p +5.23
Share price discount to net asset value per share 8.7% 11.6%
Ongoing charges (%) 1.08% 1.09%
Gearing (%) 6.9% 6.3%
1 Excludes 1,434,221 (31st March 2018: 1,434,221) shares held in Treasury.2 % change, excluding dividends paid. Including dividends the return would be +2.9%.3 % change, excluding dividends paid. Including dividends the return would be +6.4%
A glossary of terms and alternative performance measures is provided on pages 24 and 25.

Chairman’s Statement

C H A I R M A N ’ S S T A T E M E N T
6 | J PMORGAN J A PAN SMAL L E R C OMPAN I E S T RU S T P L C . H A L F Y E AR R E POR T & F I N ANC I A L S T A T EMEN T S 2 0 1 8
Dear Shareholders,
This is my first report to you as Chairman following the retirement of Alan Clifton after our Annual GeneralMeeting held in July this year.
Investment Performance
The first half of the financial year proved to be a positive period for the shareholders of the Company.Despite the Japanese market experiencing significant volatility resulting from a range of US related andother global issues, the Company’s portfolio was able to deliver positive returns.
In the six months to 30th September 2018, the total return on net assets per share (net of fees andexpenses) in sterling terms was +2.9%. This compares with the total return from the Company’sbenchmark, the S&P Japan SmallCap Net Return Index in sterling terms, of +4.1%. The return to Ordinaryshareholders in sterling terms was +6.4%, reflecting a narrowing of the Company’s discount to net assetvalue per share (‘NAV’) at which it traded at the end of the period.
Performance was mainly a result of sector allocation positioning and gearing while stock selectiondetracted from performance over the six months period. A market review, summary of portfolio activity,performance appraisal and portfolio positioning, together with their outlook, can be found in theaccompanying Investment Managers’ report.
Dividend Policy and Discount Management
Following the announcement and shareholders’ approval of a change in dividend policy earlier in the year,the Company declared two interim dividends of 4.9 pence per share each. It is important to reiterate thatthe Company’s objective remains the same (to achieve long-term capital growth through investment insmall and medium sized Japanese companies) and the investment approach has not changed.
It is pleasing to report that the Company’s share price discount to NAV has continued to narrow, signallingthe increased appeal of the Company’s shares following the dividend policy change. Over the period, theCompany’s discount narrowed from 11.6% to 8.7%. The Company did not need to repurchase any sharesduring the six months. The Board continues to monitor the discount closely with its advisers and isprepared to repurchase shares when it feels that it is appropriate, taking into account market conditions.At the time of writing, the discount stands at 11.0%.
Borrowing
The Company has in place a two-year revolving floating rate loan facility of yen 4.0 billion with Scotiabank,which is due to expire in September 2019 when the position will be reviewed by the Board.
The credit facility with Scotiabank is flexible and provides the Investment Managers with the ability to geartactically. The Company’s investment policy permits gearing within a range of 10% net cash to 25% geared.However, the Board requires the Investment Managers, in normal market conditions, to operate in therange of 5% net cash to 15% geared. The level of gearing is reviewed by the Directors at each Boardmeeting. During the six months, the Company’s gearing level ranged between 3.9% and 9.9%, and finishedthe half year at 6.9%.
Robert WhiteChairman

F E A T U R E S
C H A I R M A N ’ S S T A T E M E N T | 7
Outlook
Shareholders will understandably be wary of the recent sell off in equity markets and the risks associatedwith this period of global uncertainty. Although the Board is aware of the impact of global macroeconomicand political challenges on businesses in Japan, it believes that the companies held in the portfolio havehealthy balance sheets, good growth prospects and are well managed to deliver strong long-term returns.The Board is therefore confident that the Investment Managers’ robust investment process and extensiveinternal research resources will continue to be able to identify attractively priced high quality companies inwhich to invest.
Robert WhiteChairman 7th November 2018

Investment Review

I N V E S T M E N T M A N A G E R S ’ R E P O R T
I N V E S T M E N T R E V I E W | 9
Market Review
Over the six months to September, the Company’s benchmark, the Standard & Poor’s Japan SmallCap NetReturn Index (in sterling terms) returned 4.1%. The Company’s net assets underperformed the index by1.2 percentage points for the same period, delivering a return on net assets of 2.9% in sterling terms. TheCompany is ahead of the benchmark by 1.3 percentage points over three years and 2.3 percentage pointsover five years annualised.
In common with many global markets, the Japanese equity market had a volatile six months but ended theperiod with a positive return. A major source of this volatility was US-China trade friction and the prospectof US interest rates rising more rapidly than had previously been expected.
Economic indicators released during the quarter were generally positive. The core consumer price index(CPI) rose over the period, real GDP for the April-June quarter was up 0.7% quarter-on-quarter, and thelabour market continued to be tight, with a job-to-applicant ratio of 1.63 for August 2018. Business resultsfor the fiscal year 2017/18, as well as for the April-June quarter, were generally robust.
On the political front, Prime Minister Shinzo Abe was re-elected Liberal Democratic Party leader in theparty leadership election held on 20th September, providing political continuity.
Performance Review
During the six months under review, our stock selection had a negative impact. This was mitigated to someextent by positive contributions from sector selection, notably software and services, and from the effectsof gearing.
Stocks that contributed most positively included Grace Technology (commercial & professional services),Net One Systems (software & services) and Bengo4.com (online legal and consulting services) which wasa new purchase during the period. All performed well, reflecting strong earnings growth supported bya tight labour market and the increasing use of online services to improve labour productivity in Japan.
Grace Technology is an outsourcing company that specialises in business-to-business repair andmaintenance manuals for large manufacturers, who are starting to outsource the production of suchmanuals that had previously been written in-house at a significant cost. Grace Technology is the marketleader, with over 30 years’ experience in the field.
Net One Systems is a systems integrator whose main service includes network integration. ManyJapanese enterprises have begun using cloud computing services, and Net One Systems is benefitingfrom increasing demand for internet infrastructure integration.
SUMCO, Taiyo Yuden and Mercari were among stocks that contributed negatively to relative performance.Semiconductor and technology hardware companies like SUMCO and Taiyo Yuden underperformed due toconcerns over the US-China trade war and current levels of stock held by manufacturers. We believedemand for semiconductor and electronics parts will grow in response to innovation and the increased useof technology in the automotive industry and the emerging ‘internet-of-things’. We have, therefore, keptthese holdings even in the face of short-term headwinds.
Portfolio Activity
The company maintains its focus on stocks that we believe will be able to compound earnings growth overthe long term, supported by strong management teams and healthy cash flow. We avoid stocks that haveno clear differentiation and operate in industries plagued by excess supply. Many stocks in the financial andreal estate sectors fall into this category.
Over the period, the portfolio’s largest overweight positions were in the information technology andhealthcare sectors. We increased our weighting in information technology, favouring companies with highearnings growth potential.
Shoichi MizusawaInvestment Manager
Eiji SaitoInvestment Manager
Naohiro OzawaInvestment Manager
Michiko SakaiInvestment Manager

I N V E S T M E N T M A N A G E R S ’ R E P O R T
1 0 | J PMORGAN J A PAN SMAL L E R C OMPAN I E S T RU S T P L C . H A L F Y E AR R E POR T & F I N ANC I A L S T A T EMEN T S 2 0 1 8
Three of our largest purchases in the sector were Mercari, Taiyo Yuden and Bengo4.com. We expect thesestocks to benefit from technological innovation in the retail and automotive industries, and also froma tighter labour market, which will increase internet service usage in Japan.
Mercari operates the top consumer-to-consumer (C2C) marketplace in Japan. It recently launcheda mobile C2C flea market service, and we believe the company has significant potential as the C2C marketgrows, with further possible upside from overseas growth. Another source of growth comes from thecompany’s efforts to broaden its offering to consumers through a new payment service called Merpay.
Taiyo Yuden manufactures large-size multi-layer ceramic capacitors (MLCC). The automotive industry isin the middle of significant technological innovations related to connected cars (cars that use mobileinternet technology), autonomous driving, shared services and electric vehicles, which will translate intohuge potential markets for MLCC manufactures.
Bengo4.com operates an online legal consulting service. As the top website in the legal sector, withnearly 11 million users, Bengo4.com is an attractive marketing tool for lawyers. The company also runsa website called Zeiri4.com, which offers similar services for tax accountants, and has a business calledCloudsign, a cloud service that shifts contract paperwork to digital format, reducing time, paper andpostal charges.
Three of our largest divestments were Sanwa Holdings (industrials), Yamabiko (industrials), and NipponShinyaku (healthcare). We sold Sanwa Holdings as we now believe it will take longer than expected toimprove margins in its US subsidiary ODC, which manufactures doors and openers. We sold Yamabiko inresponse to tougher competition in the battery outdoor power equipment products, a key area in which itoperates. Nippon Shinyaku is a mid-sized pharmaceutical company, and develops drugs for ‘orphan’diseases such as Duchenne Muscular Dystrophy (DMD). We sold it as we consider an experimental genetherapy for DMD, developed by a US pharmaceutical company, will be a serious threat to Nippon Shinyakuin the long term.
The company’s gearing level rose from 6.3% to 6.9% over the six months to 30 September 2018.
Portfolio Strategy and Outlook
We aim to invest in companies that have strong balance sheets and healthy cash flows, with sustainablecompetitive advantages. While it is possible, even likely, that they will face occasional short-term setbackscaused by either wider economic issues or more company-specific challenges, we believe their strong anddurable competitive positions will allow them to substantially increase their intrinsic value over the longterm. Companies exhibiting these attributes combine to form a portfolio with a bias towards quality andgrowth. At the aggregate level, the companies in which we have invested have returns on equitysubstantially above the benchmark, with significantly lower leverage. Their historic earnings growth hasbeen faster than that of the benchmark and we expect these portfolio attributes to continue.
While our decisions are based on company-specific dynamics, there are also structural and long-termtrends, or themes, that underlie much of our stock selection. These trends include changing demographics,technological innovations and international trade, including tourism. Japan faces slower economic growthdue to changing demographics, but some Japanese companies are working to improve the quality of life foran ageing population. Technological innovation is now happening everywhere in Japan. Although Japanesecompanies are often by nature very conservative, due to the tight labour market caused by a shrinkingworkforce, many old-fashioned Japanese companies are having to pursue innovation. Moreover, Japan is ina good position to capture the benefits of high economic growth across Asia, as this creates new customersfor Japanese goods, services and brands.
Another important change that has taken place in Japan over the past five years has been the improvementin corporate governance, which began with the adoption of a stewardship code and was followed bya corporate governance code.

I N V E S T M E N T M A N A G E R S ’ R E P O R T
I N V E S T M E N T R E V I E W | 1 1
This has resulted in steady increases in both dividends and share buybacks, a rise in the number of outsidedirectors sitting on company boards, and more companies specifying returns on equity and/or assettargets. Although the pace of change is moderate, we believe this trend will endure. We will continue toengage with companies in order to establish constructive dialogue.
The outlook for Japanese equities remains positive. We believe that global economic growth will continueat a healthy rate, though this may slow due to the US-China trade war. The lack of inflationary pressuresuggests that the risk of aggressive tightening in monetary policies around the world is low. Although theJapanese equity market has performed well in the last three to five years, this is largely attributable toearnings growth rather than increasing valuation measures and so the market remains attractively priced.
Eiji SaitoShoichi MizusawaNaohiro OzawaMichiko SakaiInvestment Managers 7th November 2018

P O R T F O L I O A N A L Y S I S
1 2 | J P M O R G A N J A P A N S M A L L E R C O M P A N I E S T R U S T P L C . H A L F Y E A R R E P O R T & F I N A N C I A L S T A T E M E N T S 2 0 1 8
ValuationCompany Sector £’000 %1
Benefit One Services 7,276 2.5
Bengo4.com Services 6,605 2.3
MISUMI Wholesale Trade 6,145 2.2
DTS Information & Communication 6,094 2.1
Miura Machinery 5,567 1.9
Nohmi Bosai Electric Appliances 5,449 1.9
Grace Technology Services 5,413 1.9
SMS Services 5,360 1.9
Mercari Information & Communication 5,273 1.8
Aica Kogyo Chemicals 4,806 1.7
Tosho Services 4,788 1.7
Mitsubishi UFJ Lease & Finance Other Financing Business 4,617 1.6
NET One Systems Information & Communication 4,559 1.6
GMO Payment Gateway Information & Communication 4,461 1.6
Taiyo Yuden Electric Appliances 4,417 1.5
Cosmos Pharmaceutical Retail Trade 4,397 1.5
Litalico Services 4,324 1.5
FP Chemicals 4,278 1.5
Chiba Bank Banks 4,160 1.5
Mitsui Chemicals Chemicals 4,053 1.4
Total top twenty investments 102,042 35.6
1 Based on total investments of £286.7m (31st March 2018: £279.9m).
TOP TWENTY INVESTMENTS
at 30th September 2018
P O R T F O L I O A N A L Y S I S
I N V E S T M E N T R E V I E W | 1 3
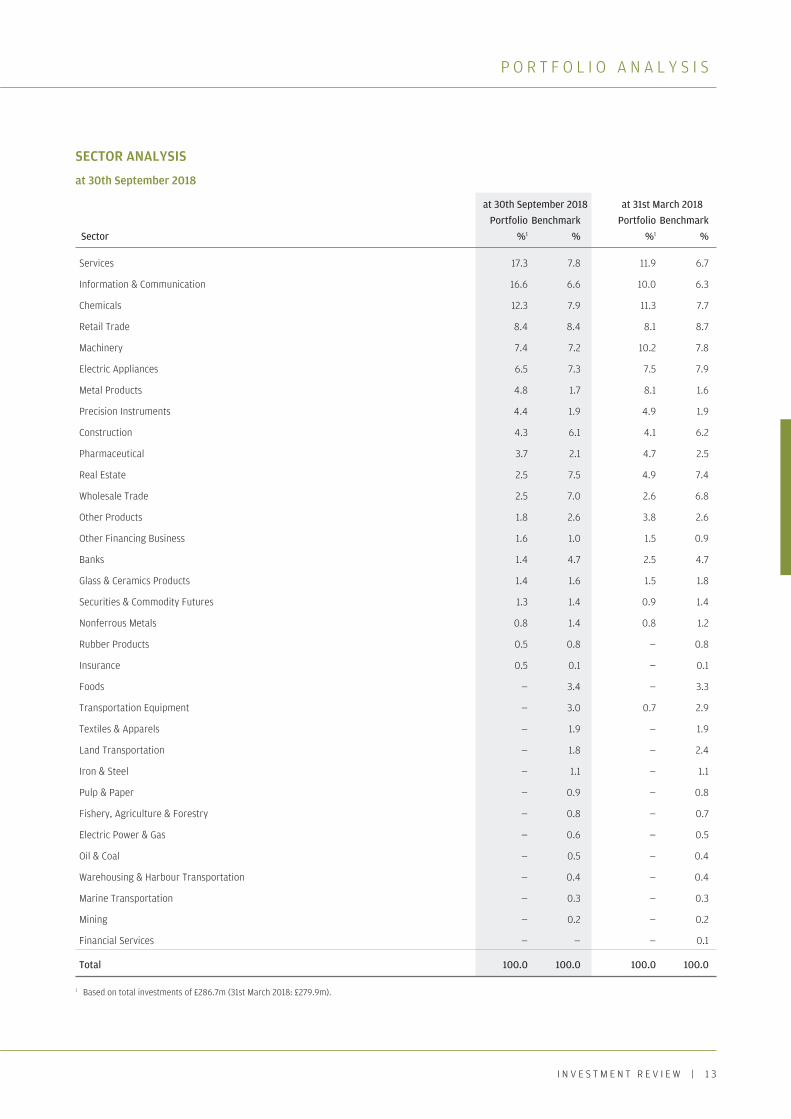
SECTOR ANALYSIS
at 30th September 2018
at 30th September 2018 at 31st March 2018 Portfolio Benchmark Portfolio BenchmarkSector %1 % %1 %
Services 17.3 7.8 11.9 6.7
Information & Communication 16.6 6.6 10.0 6.3
Chemicals 12.3 7.9 11.3 7.7
Retail Trade 8.4 8.4 8.1 8.7
Machinery 7.4 7.2 10.2 7.8
Electric Appliances 6.5 7.3 7.5 7.9
Metal Products 4.8 1.7 8.1 1.6
Precision Instruments 4.4 1.9 4.9 1.9
Construction 4.3 6.1 4.1 6.2
Pharmaceutical 3.7 2.1 4.7 2.5
Real Estate 2.5 7.5 4.9 7.4
Wholesale Trade 2.5 7.0 2.6 6.8
Other Products 1.8 2.6 3.8 2.6
Other Financing Business 1.6 1.0 1.5 0.9
Banks 1.4 4.7 2.5 4.7
Glass & Ceramics Products 1.4 1.6 1.5 1.8
Securities & Commodity Futures 1.3 1.4 0.9 1.4
Nonferrous Metals 0.8 1.4 0.8 1.2
Rubber Products 0.5 0.8 — 0.8
Insurance 0.5 0.1 — 0.1
Foods — 3.4 — 3.3
Transportation Equipment — 3.0 0.7 2.9
Textiles & Apparels — 1.9 — 1.9
Land Transportation — 1.8 — 2.4
Iron & Steel — 1.1 — 1.1
Pulp & Paper — 0.9 — 0.8
Fishery, Agriculture & Forestry — 0.8 — 0.7
Electric Power & Gas — 0.6 — 0.5
Oil & Coal — 0.5 — 0.4
Warehousing & Harbour Transportation — 0.4 — 0.4
Marine Transportation — 0.3 — 0.3
Mining — 0.2 — 0.2
Financial Services — — — 0.1
Total 100.0 100.0 100.0 100.0
1 Based on total investments of £286.7m (31st March 2018: £279.9m).

Financial Statements

F I N A N C I A L S T A T E M E N T S | 1 5
S T A T E M E N T O F C O M P R E H E N S I V E I N C O M E
FOR THE SIX MONTHS ENDED 30TH SEPTEMBER 2018
(Unaudited) (Unaudited) (Audited)Six months ended Six months ended Year ended
30th September 2018 30th September 2017 31st March 2018Revenue Capital Total Revenue Capital Total Revenue Capital Total
£’000 £’000 £’000 £’000 £’000 £’000 £’000 £’000 £’000
Gains on investments held at fair value through profit or loss — 7,585 7,585 — 23,824 23,824 — 55,519 55,519
Net foreign currency(losses)/gains — (72) (72) — 1,385 1,385 — 1,224 1,224
Income from investments 1,673 — 1,673 1,484 — 1,484 3,735 — 3,735
Gross return 1,673 7,513 9,186 1,484 25,209 26,693 3,735 56,743 60,478Management fee (1,213) — (1,213) (1,025) — (1,025) (2,199) — (2,199)Other administrative expenses (215) — (215) (202) — (202) (415) — (415)
Net return on ordinary activities before finance costs and taxation 245 7,513 7,758 257 25,209 25,466 1,121 56,743 57,864
Finance costs (109) — (109) (78) — (78) (170) — (170)
Net return on ordinary activities before taxation 136 7,513 7,649 179 25,209 25,388 951 56,743 57,694
Taxation (167) — (167) (148) — (148) (373) — (373)
Net (loss)/return on ordinary activities after taxation (31) 7,513 7,482 31 25,209 25,240 578 56,743 57,321
(Loss)/return per share (note 3) (0.06)p 13.78p 13.72p 0.06p 46.01p 46.07p 1.06p 103.70p 104.76p
All revenue and capital items in the above statement derive from continuing operations. No operations were acquired or discontinuedin the period.
The ‘Total’ column of this statement is the profit and loss account of the Company and the ‘Revenue’ and ‘Capital’ columns representsupplementary information prepared under guidance issued by the Association of Investment Companies.
Net (loss)/return on ordinary activities after taxation represents the (loss)/profit for the period/year and also Total ComprehensiveIncome.

1 6 | J PMORGAN J A PAN SMAL L E R C OMPAN I E S T RU S T P L C . H A L F Y E AR R E POR T & F I N ANC I A L S T A T EMEN T S 2 0 1 8
S T A T E M E N T O F C H A N G E S I N E Q U I T Y
FOR THE SIX MONTHS ENDED 30TH SEPTEMBER 2018
Called up Capital share Share redemption Other Capital Revenue capital premium reserve reserve1 reserves1 reserve1 Total £’000 £’000 £’000 £’000 £’000 £’000 £’000
Six months ended 30th September 2018 (Unaudited)At 31st March 2018 5,595 33,978 1,836 311,237 (77,039) (12,257) 263,350 Repurchase of shares into Treasury — — — (3) — — (3)Net return/(loss) on ordinary activities — — — — 7,513 (31) 7,482 Dividends paid in the period (note 4) — — — (2,671) — — (2,671)At 30th September 2018 5,595 33,978 1,836 308,563 (69,526) (12,288) 268,158
Six months ended 30th September 2017 (Unaudited)At 31st March 2017 5,595 33,978 1,836 313,004 (133,782) (12,835) 207,796Repurchase of shares into Treasury — — — (1,130) — — (1,130)Net return on ordinary activities — — — — 25,209 31 25,240 At 30th September 2017 5,595 33,978 1,836 311,874 (108,573) (12,804) 231,906
Year ended 31st March 2018 (Audited)At 31st March 2017 5,595 33,978 1,836 313,004 (133,782) (12,835) 207,796Repurchase of shares into Treasury — — — (1,767) — — (1,767)Net return on ordinary activities — — — — 56,743 578 57,321At 31st March 2018 5,595 33,978 1,836 311,237 (77,039) (12,257) 263,350
1 These reserves form the distributable reserves of the Company and may be used to fund distributions to investors via dividend payments.
F I N A N C I A L S T A T E M E N T S | 1 7
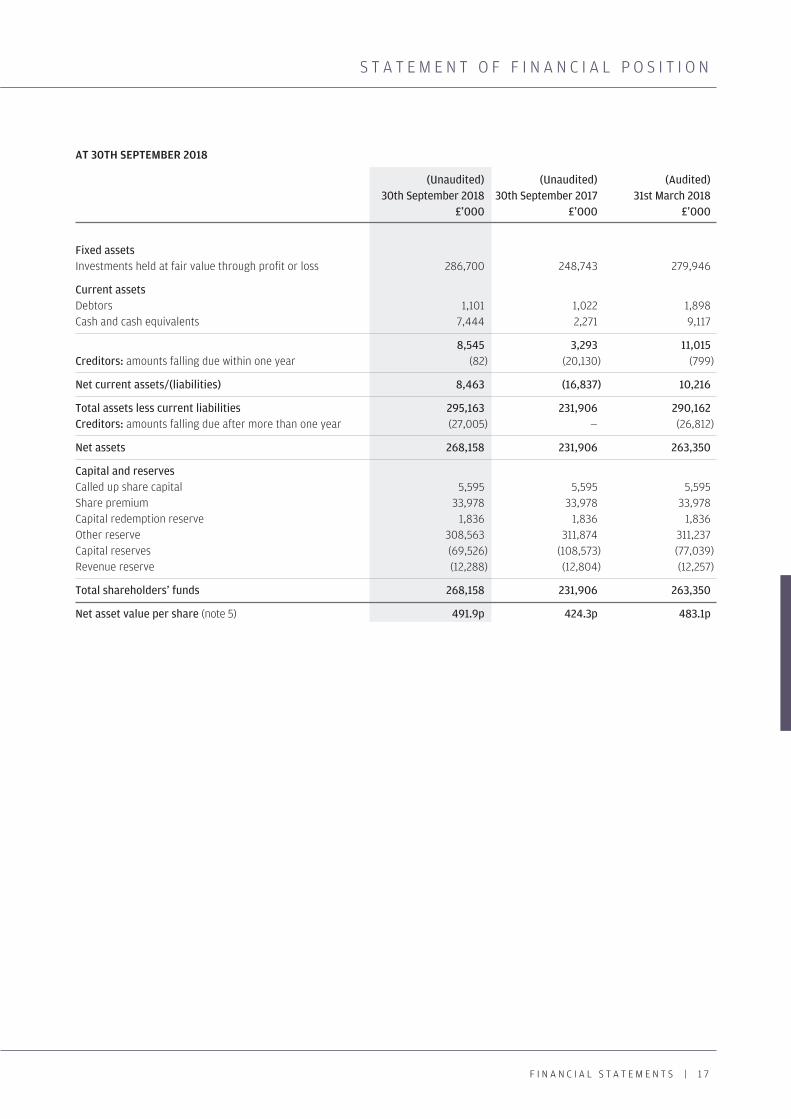
S T A T E M E N T O F F I N A N C I A L P O S I T I O N
AT 30TH SEPTEMBER 2018
(Unaudited) (Unaudited) (Audited)30th September 2018 30th September 2017 31st March 2018
£’000 £’000 £’000
Fixed assetsInvestments held at fair value through profit or loss 286,700 248,743 279,946
Current assetsDebtors 1,101 1,022 1,898Cash and cash equivalents 7,444 2,271 9,117
8,545 3,293 11,015Creditors: amounts falling due within one year (82) (20,130) (799)
Net current assets/(liabilities) 8,463 (16,837) 10,216
Total assets less current liabilities 295,163 231,906 290,162Creditors: amounts falling due after more than one year (27,005) — (26,812)
Net assets 268,158 231,906 263,350
Capital and reservesCalled up share capital 5,595 5,595 5,595Share premium 33,978 33,978 33,978Capital redemption reserve 1,836 1,836 1,836Other reserve 308,563 311,874 311,237Capital reserves (69,526) (108,573) (77,039)Revenue reserve (12,288) (12,804) (12,257)
Total shareholders’ funds 268,158 231,906 263,350
Net asset value per share (note 5) 491.9p 424.3p 483.1p
1 8 | J PMORGAN J A PAN SMAL L E R C OMPAN I E S T RU S T P L C . H A L F Y E AR R E POR T & F I N ANC I A L S T A T EMEN T S 2 0 1 8
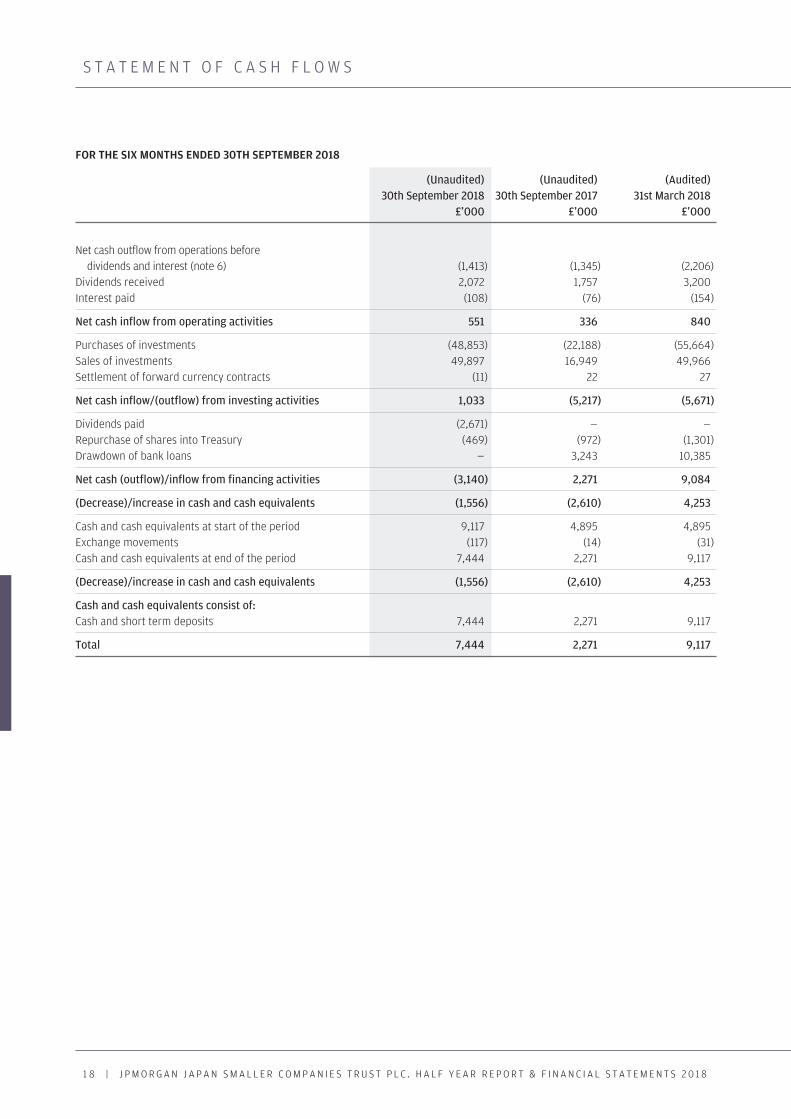
S T A T E M E N T O F C A S H F L O W S
FOR THE SIX MONTHS ENDED 30TH SEPTEMBER 2018
(Unaudited) (Unaudited) (Audited)30th September 2018 30th September 2017 31st March 2018
£’000 £’000 £’000
Net cash outflow from operations beforedividends and interest (note 6) (1,413) (1,345) (2,206)
Dividends received 2,072 1,757 3,200Interest paid (108) (76) (154)
Net cash inflow from operating activities 551 336 840
Purchases of investments (48,853) (22,188) (55,664)Sales of investments 49,897 16,949 49,966Settlement of forward currency contracts (11) 22 27
Net cash inflow/(outflow) from investing activities 1,033 (5,217) (5,671)
Dividends paid (2,671) — —Repurchase of shares into Treasury (469) (972) (1,301)Drawdown of bank loans — 3,243 10,385
Net cash (outflow)/inflow from financing activities (3,140) 2,271 9,084
(Decrease)/increase in cash and cash equivalents (1,556) (2,610) 4,253
Cash and cash equivalents at start of the period 9,117 4,895 4,895Exchange movements (117) (14) (31)Cash and cash equivalents at end of the period 7,444 2,271 9,117
(Decrease)/increase in cash and cash equivalents (1,556) (2,610) 4,253
Cash and cash equivalents consist of:Cash and short term deposits 7,444 2,271 9,117
Total 7,444 2,271 9,117

F I N A N C I A L S T A T E M E N T S | 1 9
N O T E S T O T H E F I N A N C I A L S T A T E M E N T S
FOR THE SIX MONTHS ENDED 30TH SEPTEMBER 2018
1. Financial statements
The information contained within the financial statements in this half year report has not been audited or reviewed by theCompany’s auditors.
The figures and financial information for the year ended 31st March 2018 are extracted from the latest published financialstatements of the Company and do not constitute statutory accounts for that year. Those financial statements have been deliveredto the Registrar of Companies, including the report of the auditors which was unqualified and did not contain a statement undereither section 498(2) or 498(3) of the Companies Act 2006.
2. Accounting policies
The financial statements have been prepared in accordance with the Companies Act 2006, FRS 102 ‘The Financial ReportingStandard applicable in the UK and Republic of Ireland’ of the United Kingdom Generally Accepted Accounting Practice (‘UK GAAP’)and with the Statement of Recommended Practice ‘Financial Statements of Investment Trust Companies and Venture Capital Trusts’(the revised ‘SORP’) issued by the Association of Investment Companies in November 2014 and updated in February 2018.
FRS 104, ‘Interim Financial Reporting’, issued by the Financial Reporting Council (‘FRC’) in March 2015 has been applied in preparingthis condensed set of financial statements for the six months ended 30th September 2018.
All of the Company’s operations are of a continuing nature.
The accounting policies applied to this condensed set of financial statements are consistent with those applied in the financialstatements for the year ended 31st March 2018.
3. Return per share(Unaudit ed) (Unaudited) (Audited)
Six months ended Six months ended Year ended30th September 2018 30th September 2017 31st March 2018
£’000 £’000 £’000
Return per share is based on the following:Revenue (loss)/return (31) 31 578Capital return 7,513 25,209 56,743
Total return 7,482 25,240 57,321
Weighted average number of shares in issue 54,510,339 54,787,042 54,717,778Revenue (loss)/return per share (0.06)p 0.06p 1.06pCapital return per share 13.78p 46.01p 103.70p
Total return per share 13.72p 46.07p 104.76p
4. Dividend paid(Unaudit ed) (Unaudited) (Audited)
Six months ended Six months ended Year ended30th September 2018 30th September 2017 31st March 2018
£’000 £’000 £’000
First quarterly dividend of 4.9p (2017: n/a) 2,671 n/a n/a
Total dividend paid in the period 2,671 n/a n/a
The dividend paid in the period has been funded from the other reserve.
A second quarterly dividend of 4.9p (2017: n/a) per share, amounting to £2,671,000 (2017: nil) has been declared payable in respectof the year ending 31st March 2019. It will be paid on 7th November 2018 to shareholders on the register at the close of business on12th October 2018.
2 0 | J PMORGAN J A PAN SMAL L E R C OMPAN I E S T RU S T P L C . H A L F Y E AR R E POR T & F I N ANC I A L S T A T EMEN T S 2 0 1 8
N O T E S T O T H E F I N A N C I A L S T A T E M E N T S
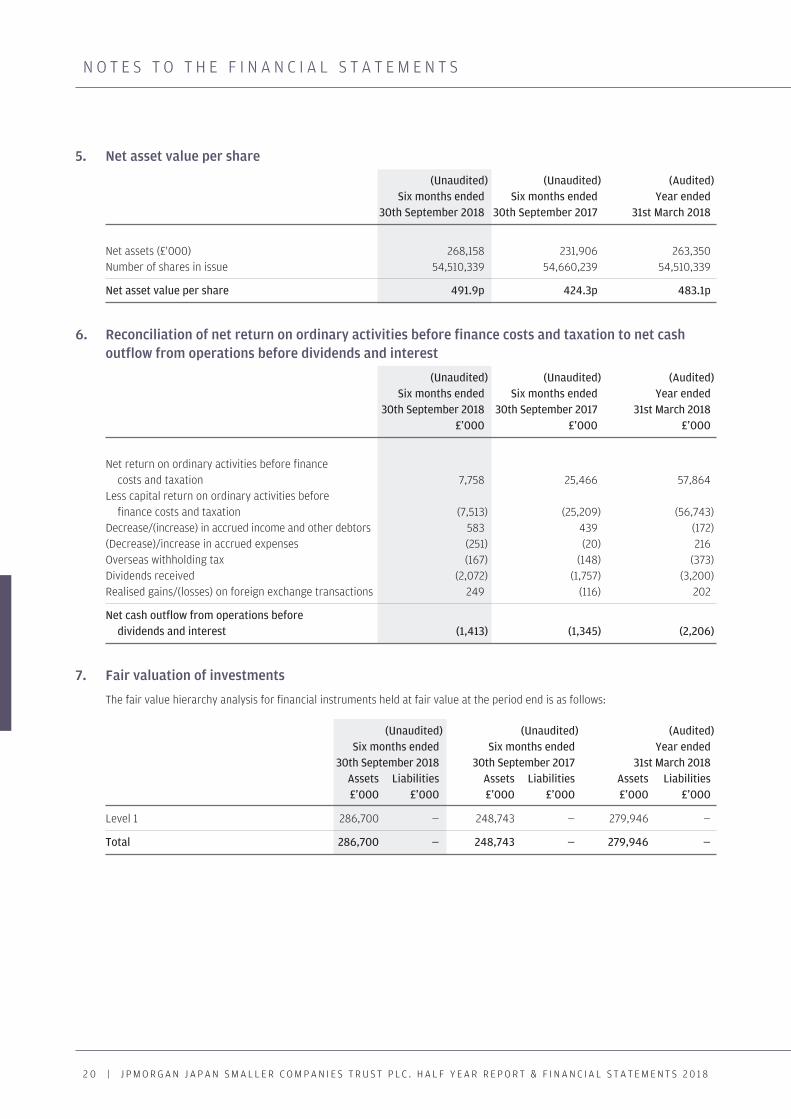
5. Net asset value per share
(Unaudit ed) (Unaudited) (Audited)Six months ended Six months ended Year ended
30th September 2018 30th September 2017 31st March 2018
Net assets (£'000) 268,158 231,906 263,350Number of shares in issue 54,510,339 54,660,239 54,510,339
Net asset value per share 491.9p 424.3p 483.1p
6. Reconciliation of net return on ordinary activities before finance costs and taxation to net cashoutflow from operations before dividends and interest
(Unaudit ed) (Unaudited) (Audited)Six months ended Six months ended Year ended
30th September 2018 30th September 2017 31st March 2018£’000 £’000 £’000
Net return on ordinary activities before financecosts and taxation 7,758 25,466 57,864
Less capital return on ordinary activities beforefinance costs and taxation (7,513) (25,209) (56,743)
Decrease/(increase) in accrued income and other debtors 583 439 (172)(Decrease)/increase in accrued expenses (251) (20) 216Overseas withholding tax (167) (148) (373)Dividends received (2,072) (1,757) (3,200)Realised gains/(losses) on foreign exchange transactions 249 (116) 202
Net cash outflow from operations beforedividends and interest (1,413) (1,345) (2,206)
7. Fair valuation of investments
The fair value hierarchy analysis for financial instruments held at fair value at the period end is as follows:
(Unaudited) (Unaudited) (Audited)Six months ended Six months ended Year ended
30th September 2018 30th September 2017 31st March 2018Assets Liabilities Assets Liabilities Assets Liabilities£’000 £’000 £’000 £’000 £’000 £’000
Level 1 286,700 — 248,743 — 279,946 —
Total 286,700 — 248,743 — 279,946 —

Interim Management Report

I N T E R I M M A N A G E M E N T R E P O R T | 2 2
I N T E R I M M A N A G E M E N T R E P O R T
The Company is required to make the following disclosures in its half year report.
Principal Risks and Uncertainties
The principal risks and uncertainties faced by the Company have not changed and fall into the following broad categories: investmentand strategy; discount; operational; loss of investment team; and political and economic. Information on each of these areas is given inthe Business Review within the Annual Report and Financial Statements for the year ended 31st March 2018.
Related Parties Transactions
During the first six months of the current financial year, no transactions with related parties have taken place which have materiallyaffected the financial position or the performance of the Company during the period.
Going Concern
The Directors believe, having considered the Company’s investment objectives, risk management policies, capital management policiesand procedures, nature of the portfolio and expenditure projections, that the Company has adequate resources, an appropriatefinancial structure and suitable management arrangements in place to continue in operational existence for the foreseeable future and,more specifically, that there are no material uncertainties pertaining to the Company that would prevent its ability to continue in suchoperation existence for at least twelve months from the date of the approval of this half yearly financial report. For these reasons, theyconsider that there is reasonable evidence to continue to adopt the going concern basis in preparing the financial statements.
Directors’ Responsibilities
The Board of Directors confirms that, to the best of its knowledge:
(i) the condensed set of financial statements contained within the half yearly financial report has been prepared in accordance withFRS 104 ‘Interim Financial Reporting’ and gives a true and fair view of the state of the affairs of the Company and of the assets,liabilities, financial position and net return of the Company as at 30th September 2018, as required by the UK Listing AuthorityDisclosure and Transparency Rule 4.2.4R; and
(ii) the interim management report includes a fair review of the information required by DTRs 4.2.7R and 4.2.8R of the UK ListingAuthority Disclosure and Transparency Rules.
In order to provide these confirmations, and in preparing these financial statements, the Directors are required to:
• select suitable accounting policies and then apply them consistently;
• make judgements and accounting estimates that are reasonable and prudent;
• state whether applicable UK Accounting Standards have been followed, subject to any material departures disclosed andexplained in the financial statements; and
• prepare the financial statements on the going concern basis unless it is inappropriate to presume that the Company will continuein business;
and the Directors confirm that they have done so.
For and on behalf of the BoardRobert WhiteChairman 7th November 2018

Shareholder Information
2 4 | J PMORGAN J A PAN SMAL L E R C OMPAN I E S T RU S T P L C . H A L F Y E AR R E POR T & F I N ANC I A L S T A T EMEN T S 2 0 1 8
GLOSSARY OF TERMS AND ALTERNATIVE PERFORMANCE MEASURES ( ‘APMs’ )
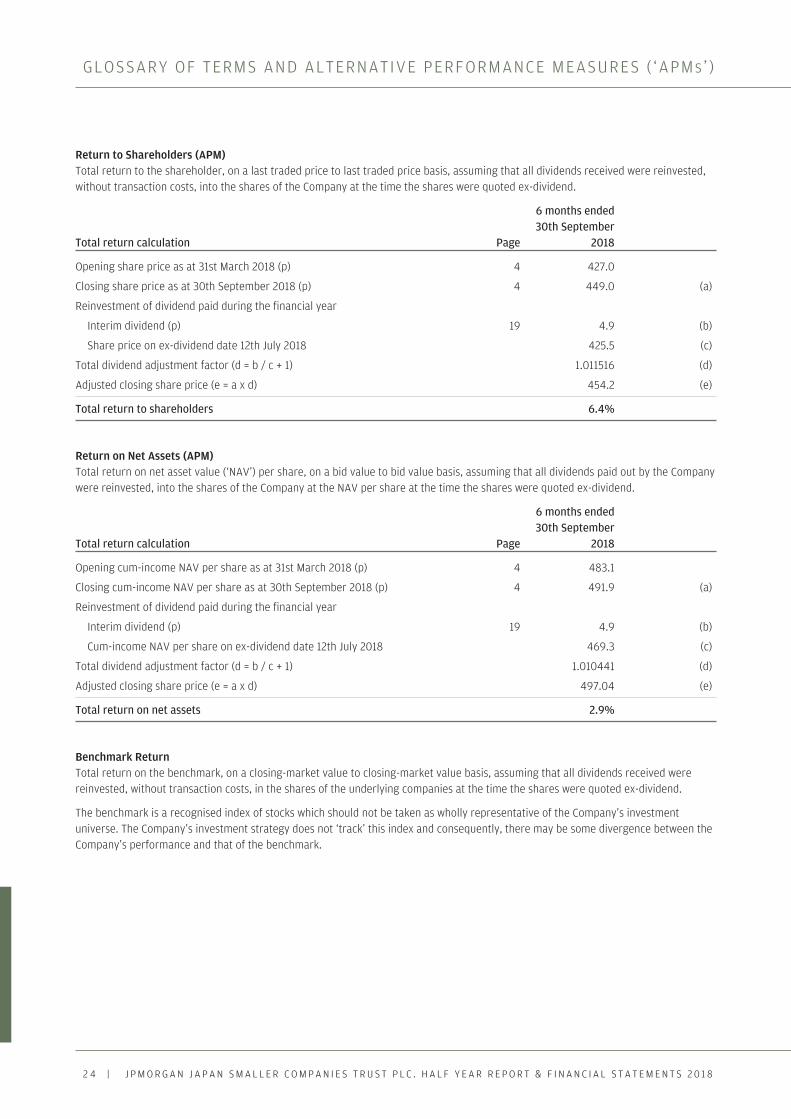
Return to Shareholders (APM)Total return to the shareholder, on a last traded price to last traded price basis, assuming that all dividends received were reinvested,without transaction costs, into the shares of the Company at the time the shares were quoted ex-dividend.
6 months ended 30th September Total return calculation Page 2018
Opening share price as at 31st March 2018 (p) 4 427.0
Closing share price as at 30th September 2018 (p) 4 449.0 (a)
Reinvestment of dividend paid during the financial year
Interim dividend (p) 19 4.9 (b)
Share price on ex-dividend date 12th July 2018 425.5 (c)
Total dividend adjustment factor (d = b / c + 1) 1.011516 (d)
Adjusted closing share price (e = a x d) 454.2 (e)
Total return to shareholders 6.4%
Return on Net Assets (APM)Total return on net asset value (‘NAV’) per share, on a bid value to bid value basis, assuming that all dividends paid out by the Companywere reinvested, into the shares of the Company at the NAV per share at the time the shares were quoted ex-dividend.
6 months ended 30th September Total return calculation Page 2018
Opening cum-income NAV per share as at 31st March 2018 (p) 4 483.1
Closing cum-income NAV per share as at 30th September 2018 (p) 4 491.9 (a)
Reinvestment of dividend paid during the financial year
Interim dividend (p) 19 4.9 (b)
Cum-income NAV per share on ex-dividend date 12th July 2018 469.3 (c)
Total dividend adjustment factor (d = b / c + 1) 1.010441 (d)
Adjusted closing share price (e = a x d) 497.04 (e)
Total return on net assets 2.9%
Benchmark ReturnTotal return on the benchmark, on a closing-market value to closing-market value basis, assuming that all dividends received werereinvested, without transaction costs, in the shares of the underlying companies at the time the shares were quoted ex-dividend.
The benchmark is a recognised index of stocks which should not be taken as wholly representative of the Company’s investmentuniverse. The Company’s investment strategy does not ‘track’ this index and consequently, there may be some divergence between theCompany’s performance and that of the benchmark.

S H A R E H O L D E R I N F O R M A T I O N | 2 5
GLOSSARY OF TERMS AND ALTERNATIVE PERFORMANCE MEASURES ( ‘APMS’)
Gearing/Net Cash (APM)Gearing represents the excess amount above shareholder’s funds of total investments, expressed as a percentage of the shareholders’funds. Previously gearing represented the excess amount above shareholders’ funds of total assets expressed as a percentage ofshareholders’ funds. Total assets included total investments and net current assets/liabilities less cash and cash equivalents andexcluding bank loans of less than one year. If the amount calculated is negative, this is shown as a ‘net cash’ position.
30th September 31st March 2018 2018 Gearing calculation Page £’000 £’000
Investments held at fair value through profit or loss 17 286,700 279,946 (a)
Net assets 17 268,158 263,350 (b)
Gearing (c = a / b – 1) 6.9% 6.3% (c)
Ongoing Charges (APM)The ongoing charges represent the Company’s management fee and all other operating expenses excluding finance costs payable,expressed as a percentage of the average of the daily cum-income net assets during the year and is calculated in accordance withguidance issued by the Association of Investment Companies.
The figure as at 30th September 2018 is an estimated annualised figure based on the numbers for the six months ended 30thSeptember 2018.
30th September 31st March 2018 2018 Ongoing charges calculation Page £’000 £’000
Management Fee 15 2,426 2,199
Other administrative expenses 15 430 415
Total management fee and other administrative expenses 2,856 2,614 (a)
Average daily cum-income net assets 264,180 240,081 (b)
Ongoing charges (c = a / b) 1.08% 1.09% (c)
Share Price Discount/Premium to Net Asset Value (‘NAV’) per Share (APM)If the share price of an investment trust is lower than the NAV per share, the shares are said to be trading at a discount, meaning thereare more sellers than buyers.
The discount is shown as a percentage of the NAV per share. The opposite of a discount is a premium. It is more common for aninvestment trusts’ shares to trade at a discount than at a premium (see page 4).

2 6 | J PMORGAN J A PAN SMAL L E R C OMPAN I E S T RU S T P L C . H A L F Y E AR R E POR T & F I N ANC I A L S T A T EMEN T S 2 0 1 8
W H E R E T O B U Y J . P . M O R G A N I N V E S T M E N T T R U S T S
You can invest in a J.P. Morgan investment trust through thefollowing;
1. Directly from J.P. Morgan
Investment Account
The Company’s shares are available in the J.P. Morgan InvestmentAccount, which facilitates both regular monthly investments andoccasional lump sum investments in the Company’s ordinaryshares. Shareholders who would like information on theInvestment Account should call J.P. Morgan Asset Managementfree on 0800 20 40 20 or visit its website atam.jpmorgan.co.uk/investor
Stocks & Shares Individual Savings Accounts (ISA)
The Company’s shares are eligible investments withina J.P. Morgan ISA. For the 2018/19 tax year, from 6th April 2018and ending 5th April 2019, the total ISA allowance is £20,000.The shares are also available in a J.P. Morgan Junior ISA. Detailsare available from J.P. Morgan Asset Management free on0800 20 40 20 or via its website at am.jpmorgan.co.uk/investor
2. Via a third party provider
Third party providers include;
Please note this list is not exhaustive and the availability ofindividual trusts may vary depending on the provider. Thesewebsites are third party sites and J.P. Morgan Asset Managementdoes not endorse or recommend any. Please observe each site’sprivacy and cookie policies as well as their platform chargesstructure.
3. Through a professional adviser
Professional advisers are usually able to access the products of allthe companies in the market and can help you find an investmentthat suits your individual circumstances. An adviser will let youknow the fee for their service before you go ahead. You can findan adviser at unbiased.co.uk
You may also buy investment trusts through stockbrokers, wealthmanagers and banks.
To familiarise yourself with the Financial Conduct Authority (FCA)adviser charging and commission rules, visit fca.org.uk
AJ BellAlliance Trust SavingsBarclays StockbrokersBestinvestCharles Stanley DirectFundsNetwork
Hargreaves LansdownInteractive InvestorJames BrearleyJames HaySelftradeThe Share Centre

S H A R E H O L D E R I N F O R M A T I O N | 2 7
W H E R E T O B U Y J . P . M O R G A N I N V E S T M E N T T R U S T S
Avoid investment fraud1 Reject cold calls
If you’ve received unsolicited contact about an investment opportunity, chances are it’s a high risk investment or a scam. You should treat the call with extreme caution. The safest thing to do is to hang up.
2 Check the FCA Warning List The FCA Warning List is a list of �rms and individuals we know are operating without our authorisation.
3 Get impartial advice Think about getting impartial �nancial advice before you hand over any money. Seek advice from someone unconnected to the �rm that has approached you.
Report a ScamIf you suspect that you have been approached by fraudsters please tell the FCA using the reporting form at www.fca.org.uk/consumers/report-scam-unauthorised-�rm. You can also call the FCA Consumer Helpline on 0800 111 6768
If you have lost money to investment fraud, you should report it to Action Fraud on 0300 123 2040 or online at www.actionfraud.police.uk
Find out more at www.fca.org.uk/scamsmart
Investment scams are designed to look like genuine investmentsSpot the warning signs
Have you been:
• contacted out of the blue• promised tempting returns
and told the investment is safe• called repeatedly, or• told the offer is only available
for a limited time?
If so, you might have been contacted by fraudsters. Remember: if it sounds too good to be true,
it probably is!
Be ScamSmart

2 8 | J PMORGAN J A PAN SMAL L E R C OMPAN I E S T RU S T P L C . H A L F Y E AR R E POR T & F I N ANC I A L S T A T EMEN T S 2 0 1 8
N O T E S

I N F O R M AT I O N A B O U T T H E C O M PA N Y
FINANCIAL CALENDAR
Financial year end 31st March
Final results announced June
Half year end 30th September
Half year results announced November
Annual General Meeting July
Quarterly Interim Dividends paid February, May, August, November
HistoryThe Company and its predecessor, JF Fledgeling Japan Limited, have beeninvesting in Japanese smaller companies since 1984. In early 2000, JF FledgelingJapan Limited was placed into voluntary liquidation and JPMorgan FlemingJapanese Smaller Companies Investment Trust plc was incorporated and tookover its assets and undertakings. Dealings on the new Company began on theLondon Stock Exchange on 11th April 2000. The Company changed its name toJPMorgan Japan Smaller Companies Trust plc in July 2010.
DirectorsRobert White (Chairman) Deborah GuthrieAlexa HendersonYuuichiro Nakajima
Company NumbersCompany registration number: 3916716
Ordinary SharesLondon Stock Exchange Sedol number: 0316581ISIN: GB0003165817Bloomberg ticker: JPS LNLEI: 549300KP3CRHPQ4RF811
Market InformationThe Company’s unaudited net asset value (‘NAV’) per share is published daily,via the London Stock Exchange. The Company’s shares are listed on the LondonStock Exchange and are quoted daily in the Financial Times, The Times, TheDaily Telegraph, The Scotsman and on the Company’s website atwww.jpmjapansmallercompanies.co.uk, where the share price is updatedevery fifteen minutes during trading hours.
Websitewww.jpmjapansmallercompanies.co.uk
Share TransactionsThe Company’s shares may be dealt in directly through a stockbroker orprofessional adviser acting on an investor’s behalf. They may also be purchasedand held through the J.P. Morgan Investment Account, J.P. Morgan ISA andJ.P. Morgan Junior ISA. These products are all available at jpmorgan.co.uk/onlinefor an on line service.
Manager and Company SecretaryJPMorgan Funds Limited
Company’s Registered Office60 Victoria EmbankmentLondon EC4Y 0JPTelephone number: 020 7742 4000
For company secretarial matters, please contact Divya Amin.
Depositary The Bank of New York Mellon (International) Limited1 Canada SquareLondon E14 5AL
The Depositary has appointed JPMorgan Chase Bank, N.A. as the Company’scustodian.
RegistrarsEquiniti LimitedReference 2093Aspect HouseSpencer RoadLancingWest Sussex BN99 6DATelephone: 0371 384 2539
Lines are open from 8.30 a.m. to 5.30 p.m., Monday to Friday. Calls to the helplinewill cost no more than a national rate call to a 01 or 02 number. Callers fromoverseas should dial +44 121 415 0225.
Notifications of changes of address and enquiries regarding share certificatesor dividend cheques should be made in writing to the Registrars quotingreference 2093.
Registered shareholders can obtain further details on individual holdings on theinternet by visiting www.shareview.co.uk.
Independent AuditorGrant Thornton UK LLP Chartered Accountants and Statutory Auditor30 Finsbury Square London EC2P 2YU
Brokers Canaccord Genuity Limited88 Wood StreetLondon EC2V 7QR
Savings Product AdministratorsFor queries on the J.P. Morgan Investment Account and J.P. Morgan ISA,see contact details on the back cover of this report.
A member of the AIC
S H A R E H O L D E R I N F O R M AT I O N | 2 9

Telephone calls may be recorded and monitored for security and training purposes.
GB I118 | 11/18
CONTACT J.P. MORGAN
Freephone 0800 20 40 20 or +44 (0) 1268 444470.Telephone lines are open Monday to Friday, 9.00am to 5.30pm.
www.jpmjapansmallercompanies.co.uk