the global market - nanotech · pdf filethe global market forecast from 2010 ... companies 36...
TRANSCRIPT
APPLICATIONSSemiconductors and data storage,
materials research, nanotechnology and life sciences.
THE GLOBAL MARKETForecast from 2010 to 2020Revenues, future projections and end user markets for scanning probe and electron microscopes.
COMPANIESAll the leading
companies profiled.
MARKETSEnd user markets
including revenues.
PRODUCTSCurrent product
offerings.
EDITION 5FEBRUARY 2014£900
MICROSCOPESFUTURE MARKETS
www.futuremarketsinc.com
ADVANCED

MIC
ROSC
OPE
S • O
CTO
BER
2013
02
EDITOR’S LETTER
4 EXECUTIVE SUMMARYThe advanced microscopy market con-tinues to grow in developing markets.
9 ELECTRON MICROSCOPES (EM)Analysis of the transmission electron microscopy (TEM), scanning electron microscopy (SEM) and dual beam markets through 2018 including unit sales, and conservative and optimistic revenue estimates.
16 SCANNING PROBE MICROSCOPES (SPM)Analysis of the scanning probe mi-croscopy (SPM) market through 2018 including conservative and optimistic revenue estimates.
19 REGIONAL MARKETSAnalysis of regional markets for EM and SPM including conservative and optimistic revenue estimates in North America, Asia-Pacific, Europe and the Rest-of-the-World.
MARKETS24 SEMICONDUCTORS
AND DATA STORAGEAnalysis of the semiconductors and data storage market for EM and SPM including conservative and optimistic revenue estimates.
28 MATERIALS AND NANOMATERIALS RESEARCHAnalysis of the academic and industrial materials and nanomaterials research market for EM and SPM including conservative and optimistic revenue estimates.
32 LIFE SCIENCESAnalysis of the life sciences market for EM and SPM including conservative and optimistic revenue estimates.
COMPANIES36 MARKET STRUCTURE
Market structure summary for EM and SPM.
37 PROFILESOver 30 profiles of EM and SPM manu-facturers including product descrip-tions and contact details.
16
24
32
contentsADVANCED MICROSCOPES: THE GLOBAL MARKET TO 2018
Market focus : Semicon-
ductors

TABLESTable 1: Global Electron Microscopes Market Revenues 2010-2018, (US$)Table 2: Global Scanning Probe Microscopes Market Revenues 2010-2020, (US$)Table 3: Global Electron Microscopes Market Revenues 2010-2020, (US$)Table 4: Global Non-Analytical Scanning Electron Microscope Unit Sales, 2010-2020Table 5: Global Non-Analytical Scanning Electron Microscope Revenues, 2010-2020 (US$)Table 6: Global Analytical Scanning Electron Microscope Unit Sales, 2010-2020Table 7: Global Analytical Scanning Electron Microscope Revenues, 2010-2020 (US$)Table 8: Global Transmission Electron Micro-scope Unit Sales, 2010-2020 (US$)Table 9: Global Transmission Electron Micro-scope Revenues, 2010-2020 (US$)Table 10: Global Dual Beam (FIB-SEM) Unit Sales, 2010-2020Table 11: Global Dual Beam (FIB-SEM) Rev-enues, 2010-2020 (US$)Table 12: Global Scanning Probe Micro-scopes Market Revenues 2010-2020, (US$)Table 13: Global Atomic Force Microscopes Market Revenues 2010-2020, (US$)Table 14: Global R&D Expenditure 2012, Billion US$ Table 15: Global R&D Expenditure 2012 Top 10 countries, Billion US$Table 16: Market for electron microscopes, by region, 2010-2020, Conservative esti-mate, (US$)Table 17: Market for electron microscopes, by region, 2010-2020, Optimistic estimate, (US$)Table 18: Market for scanning probe microscopes, by region, 2010-2020 (US$), Conservative estimateTable 19: Market for scanning probe microscopes, by region, 2010-2020 (US$), Optimistic estimate
SUBSCRIBEto Nanotech Magazine today!www.futuremarketsinc.com
£100/year
Table 20: Global market for scanning electron microscopes, in semiconduc-tors and data storage, 2010-2020 (US$), Conservative estimateTable 21: Global market for scanning electron microscopes, in semiconduc-tors and data storage, 2010-2020 (US$), Optimistic estimateTable 22: Global market for transmission electron microscopes, in semiconduc-tors and data storage, 2010-2020 (US$), Conservative estimateTable 23: Global market for transmission electron microscopes, in semiconduc-tors and data storage, 2010-2020 (US$), Optimistic estimateTable 24: Global market for scanning probe microscopes, in semiconductors and data storage, 2010-2020 (US$), Conservative estimateTable 25: Global market for scanning probe probe microscopes, in semicon-ductors and data storage, 2010-2020 (US$), Optimistic estimateTable 26: Global market for scanning electron microscopes, in materials and nanomaterials research, 2010-2020 (US$), Conservative estimateTable 27: Global market for scanning electron microscopes, in materials and nanomaterials research, 2010-2020 (US$), Optimistic estimateTable 28: Global market for transmis-sion electron microscopes, in materials and nanomaterials research, 2010-2020 (US$), Conservative estimateTable 29: Global market for transmis-sion electron microscopes, in materials and nanomaterials research, 2010-2020 (US$), Optimistic estimateTable 30: Global market for scanning probe microscopes, in materials and nanomaterials research, 2010-2020 (US$), Conservative estimateTable 31: Global market for scanning
probe microscopes, in materials and nanomaterials re- search, 2010-2020 (US$), Optimistic estimateTable 32: Global market for scanning electron microscopes, in life sciences, 2010-2020 (US$), Con- servative esti-mateTable 33: Global market for scanning electron microscopes, in life sciences, 2010-2020 (US$), Opti- mistic estimateTable 34: Global market for transmission electron microscopes, in life sciences, 2010-2020 (US$), Conservative estimateTable 35: Global market for transmission electron microscopes, in life sciences, 2010-2020 (US$), Optimistic estimateTable 36: Global market for scanning probe microscopes, in materials and nanomaterials research, 2010-2020 (US$), Conservative estimateTable 37: Global market for scanning probe microscopes, in materials and nanomaterials research, 2010-2020 (US$), Optimistic estimateTable 38: Scanning probe microscopy market structureTable 39: Electron microscopy market structure
Future Markets, Inc.Future Markets, Inc. (www.futuremarketsinc.com) is an advanced technology consul-tancy with a focus on the development and commercialisation of nanomaterials and nanotechnology.
Tel +44 (0) 131 478 0921Fax +44 (0) 872 115 4084 Email: [email protected].
© Future Markets, Inc. 2014

MIC
ROSC
OPE
S • O
CTO
BER
201
3
4
EXECUTIVE SUMMARY The advanced microscopes market contin-ues to grow in developing markets.
F uture research and devel-opment needs are depen-dent upon the capacity of
instrumentation to measure, sense, fabricate, and manipulate matter at the nanoscale. Advanced micros-copy has the advantage over other characterisation techniques (e.g., bulk spectroscopy or electrical test-ing) in that it is descriptive, pro-ducing images of objects that are directly related to their structure, morphology, and composition, and hence it directly uncovers spatial heterogeneities. This is crucial in semiconductors, nanomaterials science, industrial R&D and life sciences. The total global micros-copy market in 2012 was over $4 billion. Scanning probe (SPM) and electron microscopes (EM) make up a significant proportion of this market. Market drivers for advanced microscopy include the increase in the complexity and performance level of devices used in electronic products, reduction of manufac-turing costs, increased resolution, increasing device complexity and shrinking geometries in materials research.
T rends in the scanning probe and electron microscopes market in 2012 were:
Revenues and sales (Electron Micro-scopes)• The electron microscopes market
in 2012 generated approximately US$2.08 billion in revenues (conser-vative estimate)• Approximately 2, 700 analytical Scanning Electron Microscopes (SEM) were sold in 2012. This is up from approximately 2,000 in 2010 and 2, 500 in 2011.• Approximately 1,600 non-analyt-ical SEMs (Critical Dimension SEMs utilized in semiconductors and electronics) were sold in 2012.• Approximately 345 Transmission Electron Microscopes were sold in 2012. More than 300 units have been sold per annum since 2009. Biotechnology is the fastest grow-ing market for TEM.• Approximately 163 Dual Beams were sold in 2012.• The total global electron beam
imaging instruments market was approximately $3.1 billion in 2012, including SEMs, TEMs, Dual-beam, FIB and Defect-Review SEM (FIB and DR-SEM are not covered in this report). • The Electron Microscopes market is dominated by global companies such as FEI, Hitachi, Carl Zeiss and JEOL Ltd. These companies sell the majority of their products to semiconductor and FA labs, with medium-high growth markets in the nanomaterials research and biomedical and life sciences sec-tors. Hitachi High-Technologies are the market leader in the world SEM market. FEI is the market leader in TEM.• The total serviceable available market for analytical techniques
EXECUTIVE SUMMARY

MIC
ROSC
OPE
S • O
CTO
BER
201
3
5
in 2012 was approximately $7.7 billion.
Revenues and sales (Scanning Probe Microscopes)• The SPM market in 2013 generated between $375million (conservative estimate) and $476 million (Opti-mistic) in revenues. Atomic Force Microscopes (AFM) accounted for the majority of this market with Scanning tunneling microscope (STM) making up less than 10%. STM and NSOM are more or less exclusively used in industrial and materials research. Main players in the market are Agilent Technolo-gies, Bruker Nano, Hitachi High-Tech Science Corporation (buy-out of SII Nanotechnology), NT-MDT, Oxford Instruments (buy-out of Asylum Research and Omicron Nanotech-nology) and Park Systems.
Competition• The advanced microscopy industry is highly competitive and character-ized by rapid technological change. There has been a major shift in SPM and EM design away from generic stands toward systems more dedi-cated to specific application areas and incorporating 3D imaging. Biology and natural resources such as oil, gas, and minerals have both been major targets for these new designs. In targeting the natural resources industry companies are also seeking to address a need for on-site rather than laboratory-based analysis.• Significant competitive factors include technical capability and differentiation (performance, range of features, reliability), productivity and cost-effectiveness. • Competitors range from small companies that compete with a single product and/or in a single region, to global, diversified compa-
nies with a range of products.
The market in 2013• There was a ‘‘mixed’’ market envi-ronment in 2013. While industrial markets appear to be stabilizing and academic markets outside of the United States remain mostly solid, there are weaknesses in mar-kets such as the semiconductor and data storage industries, the applied markets, and continued uncertainty in U.S. academic markets. • The US research sector has been hit by $85.4 billion in sequestration-related budget cuts and negative growth has returned to several key European states in early 2013. • Developing regions are of increas-ing importance in advanced mi-croscopy, with growing science and technology markets in India, Latin America, China, and Singapore.• Growth in electron microscopes, in 2013 is likely to be modest overall, as expansion in demand from new energy, new materials and other cutting-edge fields ahead of the next-generation of products in these sectors will counter falling demand from semiconductor and LCD-related sectors.
Target markets• The semiconductor and LCD-related sectors are cyclical and have experienced significant economic downturns at various times in the last decade. Such downturns have been characterized by diminished product demand, accelerated ero-sion of average selling prices and production overcapacity. There is expected decline 2013-2014 in this market, offset by growth new en-ergy and new materials markets. • The materials science market segment is also affected by overall economic conditions, but is not as
cyclical as the electronics market segment. • A weakness in semiconductor equipment spending was witnessed in the early part of 2012 and is ex-pected to continue into mid 2013. Industry decline was estimated at 8% in this end user sector in 2012, although some companies expe-rienced modest growth. This was primarily due to increased demand for certain products as the industry shifts to smaller semiconductor manufacturing process nodes. Cus-tomers are migrating from SEM-based to more TEM-based lab analysis. As nodes shrink in the semiconductors industry advanced microscopy will continue to grow; as a corollary to this 3D imaging is also becoming extremely impor-tant.• The Life Sciences market seg-ment is a smaller and still emerging market for advanced microscopes, and the tools companies sell to this market have average selling prices ranging from $0.1 million to over $5.0 million. There is an increased penetration in electron microscopy in Life Sciences market. This market has good potential for long-term growth despite occasional short-term revenues shortfalls. The Life Sciences market is heavily depen-dent on government funding for re-search grant. Historically there has been volatility in the sale of high-end microscopes for Life Sciences.• A significant portion of Materials Science and Life Sciences revenue for advanced microscopes com-panies is dependent on govern-ment investments in research and development of new technology. To the extent that governments, especially in Europe or the U.S., reduce their spending in response to budget deficits and debt limita-tions, demand for products could
MIC
ROSC
OPE
S • O
CTO
BER
201
3
6
be affected. AFM has also become important in nanomedicine, which focuses on imaging, early diagnosis, pathological tissue analysis, and drug delivery. A number of SPMmanufacturers produce AFMs for biological research.• Companies witnessed growth in sales in the materials science sector in 2012. • Companies witnessed growth in sales in the mining, oil and gas industries with automated mineral-ogy solutions that help those com-panies improve yields and lower costs. These are new solutions for both laboratory and on-site applica-tions that are in the early stages of penetration in these markets.• Growth has primarily come from developing countries such as China as these economies continue to invest in education infrastructure, offsetting potential weakness in the United States due to political uncertainty and a mixed economic picture in Europe.
Main players financial results 2012Agilent• Revenues for electronic measure-ment were $3.3 billion in 2012. • Electronic measurement orders declined 1% in 2012. • Orders increased 13% in Ameri-cas but declined 3% in Japan, 7% in Europe and 11% in Asia-Pacific excluding Japan• Year-over-year changes in commu-nications test demand contributed to the order growth in the Americas and the decline in Asia Pacific ex-cluding Japan. Electronic measure-ment orders increased 10 percent in 2011 compared to 2010. • Order growth in wireless manufac-turing, industrial, and computers and semiconductor test • Electronic measurement revenue increased 19 percent in 2011 com-
pared to 2010 on strong demand from industrial, computers and semiconductor, and wireless com-munications test • General purpose test revenue, rep-resenting approximately 63 percent of electronic measurement revenue, reflected slight growth in comput-ers and semiconductor business, flat industrial test demand, and a slight decline in aerospace and defense. • Growth in the computers and semiconductor business reflected continuing demand for digital test driven in part by the proliferation of high speed data transmission and increased investments in new semi-conductor processes and technol-ogy partially offset by a decline in semiconductor manufacturing.
Bruker Corporation• The mix of products sold in the Scientific Instruments segment dur-ing 2012 reflects increased demand from academic, government and industrial customers. • Increased revenue in 2012 on a year-over-year basis, but a softening in demand, particularly in Europe. • Weakening in global industrial and applied markets, as well as in the semiconductor and data stor-age metrology markets. • Continued growth in Bruker Nano Analytics division.
Carl Zeiss• The Microscopy business group, in which the light and electron micros-copy businesses have been com-bined since the beginning of fiscal year 2011/12, ended the reporting period with revenue totaling EUR 650m.• Revenue in the Microscopy busi-ness group rose five percent to EUR 650m (prior year on a like-for-like basis: EUR 620m). This development
was attributable not only to organic growth, but also to the integration of the electron microscopy business – previously part of the Semicon-ductor Manufacturing Technology business group – and to positive currency effects. • The Microscopy business group was faced with a difficult market environment in the debt-ridden industrial nations: many states re-duced their research and education budgets, with the funding of basic biomedical research suffering most from the cuts. Investments into ap-plied research, on the other hand, were increased. • The business with systems for ma-terials analysis and quality inspec-tion in industry continued to show a positive trend.• The business group was able to compensate for the subdued business trend in the established markets through strong growth in Asia – and in China, above all. • With correlative microscopy – the combination of light and electron microscopy – Carl Zeiss is offering a supplement to super-resolution microscopes. Super-resolution systems enable resolution of down to 20 nanometers compared to 250 nanometers in traditional light microscopes, allowing researchers to advance into totally new dimen-sions.
FEI• Revenue for 2012 was $891.7 mil-lion, compared with $826.4 million in 2011. • The largest segment in 2012 was Materials Science, which recorded 8% revenue growth to $315.5 million, along with 24% bookings growth. The Materials Science seg-ment includes traditional research customers and the emerging Natu-ral Resources business.

MIC
ROSC
OPE
S • O
CTO
BER
201
3
7
• Electronics revenue grew 13% to $293.1 million based on increasing demand for solutions as node sizes continue to shrink for semiconduc-tor customers. • Life Sciences revenue was $82.9 million, down 19% from 2011 with essentially level bookings. • Revenue from Asia and Japan made up 40% of the total and grew 15%. • North American revenue made up 33% of the total• European revenue made up 27% of the total.
Hitachi High-Technologies• Japan accounted for 42.4% of international sales, North America 12.9%, Europe 13.8%, Asia 28.6%, Other 2.3%• Science & Medical Systems posted a significant year on year increase in both sales and operating profit, as sales of scientific instruments grew as a result of the strong sales of new equipment, particularly electron mi-croscopes, and the biotechnology products/clinical analyzers business posted a large increase in sales, especially to overseas markets.
• Sales of scientific instruments rose sharply in fiscal 2011, buoyed by brisk sales of electron microscopes and other new products, particu-larly to emerging markets.
JEOL Ltd. • Net sales up 10% on previous years• Main markets remain China and Asia• Solid-growth in China • Lack of growth in Europe and the US due to financial problems in sev-eral south European countries and the downgrading of the US credit
Table 1: Global Electron Microscopes Market Revenues 2010-2020, (US$)
Year Conservative estimate Optimistic estimate
2010 1,902,500,000 2,462,500,000
2011 2,099,350,000 2,728,850,000
2012 2,208,000,000 2,873,050,000
2013 2,264,320,500 2,947,029,700
2014 2,322,820,385 3,023,951,215
2015 2,387,214,139 3,108,926,131
2016 2,457,171,629 3,201,250,876
2017 2,524,715,188 3,300,455,078
2018 2,613,183,240 3,407,380,037
2019 2,696,855,529 4,529,920,605
2020 2,783,397,190 4,841,346,108
Table 2: Global Scanning Probe Microscopes Market Revenues 2010-2020, (US$)
Year Revenues (Conservative) Revenues (Optimistic)
2010 355,000,000 450,000,000
2011 375, 000, 000 465,000,000
2012 385, 000, 000 480,000,000
2013 375,000,000 476,000,000
2014 384,000,000 480,000,000
2015 391,680,000 494,400,000
2016 403,430,400 509,232,000
2017 415,533,312 529,601,280
2018 430,076,978 558,729,350
2019 445,129,672 592,253,111
2020 460,709,211 630,749,564

MIC
ROSC
OPE
S • O
CTO
BER
201
3
8
T he research methodology initially encompassed a comprehensive and exhaustive search of the literature on advanced (electron and scanning
probe) microscopes, including annual reports. Second-ary sources included journals and related books, trade literature, marketing literature, technology roadmaps, other product/promotional literature, annual reports, analyst reports, conference proceedings and other pub-lications. An extensive patent analysis was conducted to gauge technological innovation and to determine research activity as it applies to new product develop-ment.
A series of interviews were conducted via email and phone with electron and scanning probe microscope company representatives, aca-
demics, technology suppliers, technical experts, trade association officials, and consulting companies. In addi-tion, service providers and end users were contacted to evaluate current and future demands. The market was then quantified relevant application impact and the main prerequisites for commercial success were identi-fied including performance of the technology, supplier distribution, legislation, pricing of competing products, sale of complementary products, industry environment and demographics of the customer. Market estimates and projections were based on the following:• Annual sales figures extrapolated from annual reports
from 2008-2013 and subsequently verified with micro-scope company representatives• Percentage of regional markets sold to, based on interviews with company representatives and available market data• Number of Electron and Scanning Probe Microscopes sold per annum based on interviews with microscope company representatives• Percentage of end user markets sold to, based on interviews and available market data• Future market projections based on interviews with company executives and growth rates extrapolated from historical data and projected government and private funding for end user markets.
Report methodology
METHODOLOGY

MIC
ROSC
OPE
S • O
CTO
BER
201
3
9
Electron microscopes (EM) use a beam of highly energetic electrons to examine objects on a very fine scale. Information is gathered from electrons transmitted through the sample, and from the charge absorbed by the sample. It is used mainly for objects with dimensions smaller than the wavelengths of vis-ible light, with linear magnification, approaching or exceeding a million. The electron microscopes market covers the following segments: • Scanning electron microscope (SEM)• Transmission electron microscope (TEM)• DualBeam Instruments
Electron microscopes meet broad-ranging demand not only in re-
search and development in nano-technology but also for material verification, evaluation, fault analy-sis, and quality control. In the last few years there has been the devel-opment of dedicated designs and modifications to electron micro-scope columns and also significant improvement of auxiliary attach-ments such as dedicated holders, stages, and reaction cells for various in situ processes. Vendors focus on providing advanced systems with special sampling handling capabili-ties in order to enable analysis of living cells. There is a growing demand for such systems with special environmental chambers from the biological and life sciences industries. In addition, the market has witnessed signif-
icant demand for integrated systems and custom solutions that provide additional capabilities to suit the needs of specific end-user applications.
Scanning Electron Microscopes (SEM)FEI, JEOL Ltd., Carl Zeiss MST A.G, Hitachi High Technologies and Tescan, A.S. are the main vendors selling SEMs. SEM account for the majority of electron microscopes sold at present, comprising over 75% of units sold globally in 2012. There is a high demand for SEMs across all major end-user groups. SEMs are also cheaper than TEMs and DuelBeams. However, TEMs are starting to take market share from SEMs as customers migrate from
Electron Microscopes
ELECTRON MICROSCOPES

MIC
ROSC
OPE
S • O
CTO
BER
201
3
10
SEM-based to more TEM-based lab analysis in semi-conductors, materials research and life sciences as the demand to image on an increasingly small scale continues.
PricePrices in the electron microscopes market have been rather steady since 2004, as the higher image resolu-tion and performance of this technique have led to increased acceptance, prominence, and popularity. SEMs are priced in the range of $100,000 to $1.25 mil-lion. Non-analytical SEMs (typically Critical Dimension SEMS used in Semiconductors and failure analysis labo-ratories, such as Hitachi’s CD-SEM) sell for approximate-ly $700,000 (FEI and Zeiss sell in this range). Analytical SEMs (typically FE-SEMs) sell from $370,000 (Carl Zeiss EVO HD 25 LS) to $610,000 (FEI Quanta 650 FEG). Prices can fluctuate depending on specification and augmen-tation of the particular model and is also negotiable in most instances, and when tendering for contracts com-panies often offer their product below regular market price. Purchase prices for SEMs are primarily dictated by resolution. Other factors that determine the price are automation, chamber size, and optional SEM accesso-ries, such as an elemental dispersive spectroscopy (EDS) system. The price difference between new and used SEMs can approach 50 percent or more, depending on the circumstances.
Benchtop SEMsBenchtop SEMs are priced at a relatively lower price, ranging from $65,000 to $125,000, since they are mainly targeted at the educational and academic institutions end user markets. Main players in the benchtop SEM market are Hitachi (TM‐1000) and Nikon/JEOL (Neo-Scope Benchtop SEM) and FEI (Phenom Desktop SEM). Delong (LVEM5), Pemtron (PS-230 and PS-250) and Agi-lent (8500 SEM) also produce benchtop SEMs. Agilent sell their system for approximately $175,000. In 2012, FEI acquired Aspex Corporation, a producer of the pSEM and Agilent Technologies bought over Novelx (mySEM) in 2010. Main end user market for benchtops are the physical/biological/chemical science research market, automotive manufacturers and pharmaceutical com-panies. Although benchtop SEMs offer a magnification range that is ahead of the range of traditional optical microscopes, they are not expected to replace existing
SEMs due to relatively lower performance in terms of sample specimen size and image resolution. However, being comparatively less expensive than the existing SEMs, these can be used in a variety of applications such as academic and educational research that usually utilize optical microscopes. These SEMs are most likely to suit the analysis of micro- and nano-scale structures of specimens in fields such as pathology and biology, and opportunities are expected to be created in indus-trial applications as well.
Market shareHitachi High-Technologies dominate the world SEM market. In 2012, it was estimated that Hitachi’s share of the critical dimension scanning electron microscope (CD-SEM) market was over 66%. CD-SEMs may expe-rience problems in semiconductors in the next few years due to scaling problems, with critical dimensions shrinking to the low nanometer level but will continue to be widely used. The main market for SEMs and semi-conductor manufacturing and failure analysis is in Asia, a market Hitachi also dominates in CD-SEM.
Transmission Electron Microscopes (TEM)Transmission Electron Microscopes (TEM) are much more expensive than SEMs, and are mainly utilized in high-end research such as molecular research, biologi-cal research, cancer research, and semiconductor re-search. A typical commercial microscope TEM costs $4-5 for each electronvolt(eV) of energy in the beam and with accessories up to $10 per eV. Most research uses beam energies in the range from 100,000 to 400,000 eV, making the TEM an extremely expensive piece of equipment, with total costs ranging between $1.3mil-lion-$13million. However depending on the specific-tions and contract tendered for, prices can be as low as $400,000. As of 2011 typical prices for TEMs from the main suppliers are $2.2-$2.9 million from FEI (Titan ChemiSTEM) and $2.8 million from Carl Zeiss (Libra 200HR). FEI is the market leader in TEM. The com-pany’s TEMs sell for up to $4.5million, their SEMs from $125,000. The company’s Titan TEM prices range from $1.5million to $4million, with average selling price of around $2,750,000. Including SEM, the company has over 10, 000 systems installed worldwide and over 3, 500 customers and has grown quickly in the last 5 years.

MIC
ROSC
OPE
S • O
CTO
BER
201
3
11
Total bookings were approximately $700 million in 2010. Approximate prices of other models are:• JEOL JEM-ARM 200FT: $3.4 million• FEI TITAN KRIOS S/TEM: $5million• FEI TECNAI T12 TEM: $1million• JEOL JEM 3010: $1.2 million
TEMs are in demand from a variety of sectors, with the main markets in semiconductors and data stor-age, materials failure analysis, materials R&D, quality control and growing markets in life sciences and oil and gas (natural resources) exploration. Semiconduc-tor manufacturers use TEMs to monitor product yield and process control, analyze defects, and investigate interface layer morphology. Generally, the TEM resolu-tion is about an order of magnitude greater than the SEM resolution, however, because the SEM image relies on surface processes rather than transmission it is able to image bulk samples and has a much greater depth of view, and so can produce images that are a good repre-sentation of the 3D structure of the sample. The only companies currently operating in the TEM market are Hitachi HIgh-Technologies, FEI Company, JEOL, and Carl Zeiss. FEI is the current market leader in TEM. The main drawback is that despite the advanced tech-nological capabilities of TEMs, the number of organiza-tions performing such high-end research is relatively small, resulting in low unit shipments and demand.Most TEM equipment providers have sought to imple-ment DualBeam systems and automate this process with software, significantly improving the sample con-sistency and overall throughput.
Dual Beam instruments (FIB-SEM)All major producers of electron microscopes produce these systems that have SEM and focus ion beam (FIB) capabilities on a single platform. Main products are• Dual Beam (FEI)• CrossBeam (Carl Zeiss)• MultiBeam (JEOL).
FIB-SEM represent the smallest market in terms of revenues for advanced microscopy at present, but their unit sales have been increasing. The segment is rela-tively new, and also higher in cost than both SEMs and TEMs. The application base for these instruments is also
currently small and they are mainly used in material characterization, industrial failure analysis and process control applications. However, it is expected to expand significantly during the next four years, which will increase the market share for DualBeam instruments. There has been a growing interest in dual beams for different areas related to renewables, as well as oil and gas.Dual beam prices vary-Laboratory level DuelBeams are sold by FEI from $300k up to $3,000,000 for wafer-level models. The Carl Zeiss Auriga CrossBeam sells for ap-proximately $1million. FEI’s market share in DualBeam systems, a product that the company invented, is esti-mated at over 75% in 2012. They have a large installed base in companies globally.
Market outlookIn the Materials Science sector there has been steady growth in 2012, with increased demand in Asia-Pacific. In the Life Sciences sector, growth has been variable among TEM and SEM manufacturers, but the market remains one of the key medium-term end user seg-ments and growth has been higher in the last few years than in other sectors. In semiconductors, companies are witnessing cyclical industry recovery that they expect to continue through 2014. Increased demand is ex-pected medium-to-long term as companies continue to shrink the dimensions of their products, develop new structures and use new materials. The natural resources market which has grown significantly in the last few years has levelled off in 2013 as mining customers cut back on their capital spending due to lower commodity prices and global uncertainty. In oil and gas there has been a similar pattern.

MIC
ROSC
OPE
S • O
CTO
BER
201
3
12
Table 3: Global Electron Microscopes Market Revenues 2010-2020, (US$)
Year Conservative estimate Optimistic estimate
2010 1,902,500,000 2,462,500,000
2011 2,099,350,000 2,743,650,000
2012 2,208,000,000 2,845,000,000
2013 2,264,320,500 3,062,051,100
2014 2,322,820,385 3,340,142,765
2015 2,387,214,139 3,522,247,949
2016 2,457,171,629 3,725,766,974
2017 2,524,715,188 3,930,674,813
2018 2,613,183,240 4,239,506,285
2019 2,696,855,529 4,529,920,605
2020 2,783,397,190 4,841,346,108
Table 4: Global Non-Analytical Scanning Electron Microscope Unit Sales, 2010-2020
Year Units
2010 1,500
2011 1,550
2012 1, 600
2013 1,634
2014 1,668
2015 1,703
2016 1,740
2017 1,780
2018 1,823
2019 1,867
2020 1,912
Table 5: Global Non-Analytical Scanning Electron Microscope Revenues, 2010-2020 (US$)
Year Conservative estimate* Optimistic estimate**
2010 787,500,000 975,000,000
2011 813,750,000 1,007,500,000
2012 840,000,000 1,040,000,000
2013 857,640,000 1,154,400,000
2014 875,650,440 1,310,244,000

MIC
ROSC
OPE
S • O
CTO
BER
201
3
13
Table 5: Global Non-Analytical Scanning Electron Microscope Revenues, 2010-2020 (US$)
Year Conservative estimate* Optimistic estimate**
2015 894,039,099 1,349,551,320
2016 913,707,959 1,396,785,616
2017 934,723,242 1,466,624,897
2018 957,156,600 1,542,889,392
2019 980,128,359 1,623,119,640
2020 1,003,651,439 1,707,521,861* Based on average price of $525, 000** Based on average price of $650, 000
Table 6: Global Analytical Scanning Electron Microscope Unit Sales, 2010-2020
Year Units
2010 2,000
2011 2,500
2012 2,700
2013 2,786
2014 2,878
2015 2,988
2016 3,107
2017 3,238
2018 3,380
2019 3,529
2020 3,684
Table 7: Global Analytical Scanning Electron Microscope Revenues, 2010-2020 (US$)
Year Conservative estimate* Optimistic estimate**
2010 500,000,000 700,000,000
2011 625,000,000 875,000,000
2012 675,000,000 945,000,000
2013 696,600,000 1,000,755,000
2014 719,587,800 1,060,800,300
2015 746,932,136 1,124,448,318
2016 776,809,422 1,191,915,217* Based on average price of $250, 000** Based on average price of $350, 000es, 2010

MIC
ROSC
OPE
S • O
CTO
BER
201
3
14
Table 7: Global Analytical Scanning Electron Microscope Revenues, 2010-2020 (US$)
Year Conservative estimate* Optimistic estimate**
2017 809,435,418 1,263,430,130
2018 845,050,576 1,345,553,089
2019 882,232,801 1,433,014,039
2020 921,051,045 1,526,159,952-2018 (US$)
Table 8: Global Transmission Electron Microscope Unit Sales, 2010-2020 (US$)
Year Units
2010 300
2011 327
2012 345
2013 354
2014 362
2015 372
2016 382
2017 393
2018 404
2019 416
2020 428
Table 9: Global Transmission Electron Microscope Revenues, 2010-2020 (US$)
Year Conservative estimate* Optimistic estimate**
2010 390,000,000 510,000,000
2011 425,100,000 555,900,000
2012 448,500,000 527,000,000
2013 459,712,500 553,350,000
2014 471,205,313 590,203,110
2015 483,456,651 641,314,699
2016 496,509,980 698,391,708
2017 510,412,260 761,945,353
2018 525,214,215 832,501,493
2019 540,445,427 909,591,131
2020 556,118,345 993,819,270* Based on average price of $1, 300, 000** Based on average price of $1, 700, 000enue
MIC
ROSC
OPE
S • O
CTO
BER
201
3
15
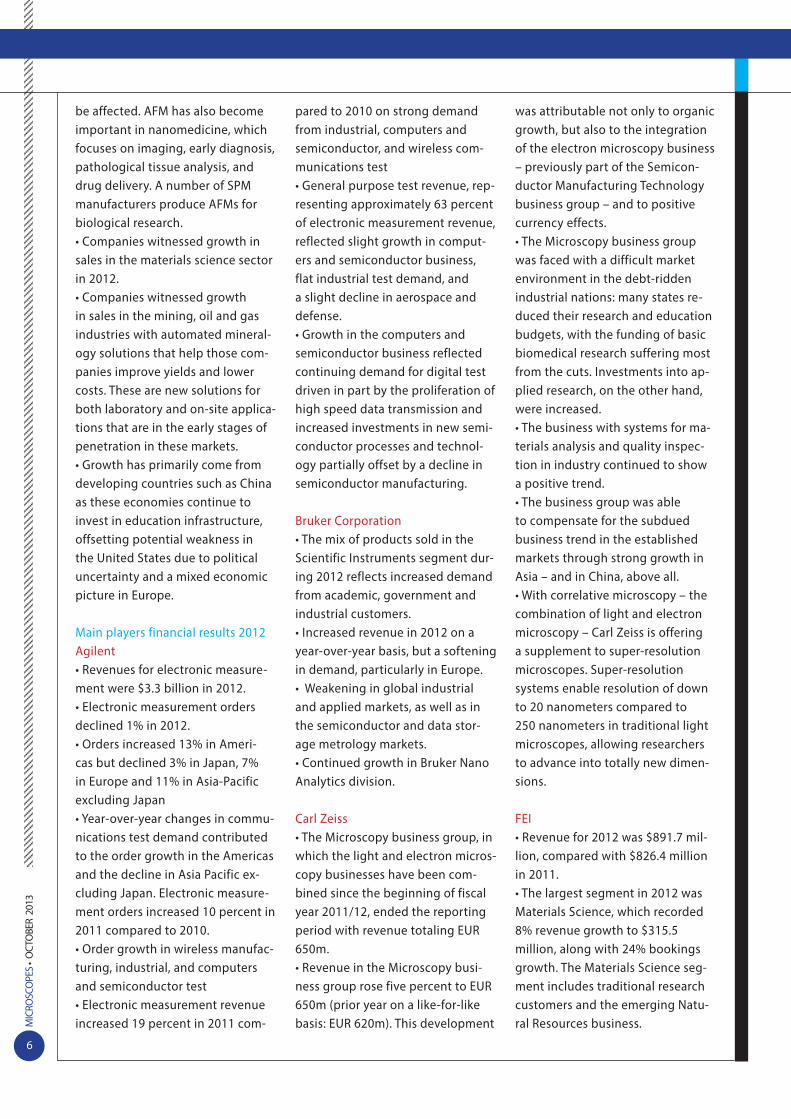
Table 10: Global Dual Beam (FIB-SEM) Unit Sales, 2010-2020
Year Conservative estimate Optimistic estimate
2010 150 150
2011 157 165
2012 163 180
2013 167 191
2014 171 205
2015 175 220
2016 180 237
2017 185 258
2018 191 280
2019 196 305
2020 202 332
Table 11: Global Dual Beam (FIB-SEM) Revenues, 2010-2020 (US$)
Year Conservative estimate Optimistic estimate
2010 225,000,000 277,500,000
2011 235,500,000 305,250,000
2012 244,500,000 333,000,000
2013 250,368,000 353,546,100
2014 256,376,832 378,895,355
2015 262,786,253 406,933,612
2016 270,144,268 438,674,433
2017 277,708,307 476,619,772
2018 285,761,848 518,562,312
2019 294,048,942 564,195,795
2020 302,576,361 613,845,025* Based on average price of $1, 500, 000** Based on average price of $1, 850, 000

MIC
ROSC
OPE
S • O
CTO
BER
201
3
16
The enormous and growing need to analyze three-dimensional topo-graphic images and resolve sur-face roughness on the nanometer scale has made AFMs essential in a wide range of end-user industries. AFM systems provide atomic or near-atomic resolution of material surface topography using a nano-scale probe that is brought into light contact with the sample being investigated. In addition to present-ing a surface image, AFM can also provide quantitative nanoscale measurements of feature sizes, ma-terial properties, electrical informa-tion, chemical properties and other sample characteristics. AFM systems are used for applications in mate-rials and biological research and semiconductor, data storage hard drive, LED, battery, solar cells, poly-mers and pharmaceutical product development and manufacturing.The scanning probe microscope market covers the following seg-
ments:• Atomic force microscopes (AFM)• Scanning tunneling microscopes (STM);• Near-field scanning optical micro-scopes (NSOM).
AFM is the most widely used sub-set of SPM, which can be used in ambient conditions with minimum sample preparation. The market share of AFMs/STMs is about 90% of all SPMs. Several tens of thou-sands of AFM instruments are in use worldwide. Prices for scanning probe micro-scopes range from under $100, 000 (AIST-NT SmartSPM-1000 Scanning Probe Microscope) to approxi-mately $290, 000 (Bruker Dimension Icon) for general purpose material science and device analysis instru-ments and around the same figure for SPMs for biological applica-tions. JPK Instruments AFMs sell for approximately $215, 000. THe JPK
Nanowizard 3 BioScience costs around $280,000 and the Oxford In-struments Atomic Force MFP 3D-Bio sells for around $305,000.
Market outlookThe majority of SPM users are in academia and government labora-tories. Nanotechnology measure-ment has boosted the market signif-icantly over the past decade. Academic customers in the typically rely on government agencies (e.g. in the United States the National Science Foundation, the National Institutes of Health, the Depart-ment of Energy and the Depart-ment of Defense) for funding. Most countries and the European Union have similar organizations that fund academic research. Materials research accounts for approximately 50% of SPM business globally with life sciences and semiconductors customers accounting for the rest of the market.
Scanning Probe Microscopes
SCANNING PROBE

MIC
ROSC
OPE
S • O
CTO
BER
201
3
17
In the research sector a significant trend is the in-creased requirement for instrumentation capable of measuring materials and their associated properties at the nanoscale. The ability to design and control material structures from the atomic to the micron scale is fun-damentally important to the creation of new materials and structures which have potential to reduce emis-sions, increase manufacturing yields and contribute to a longer and improved quality of life. Nanoscience continues to receive significant funding from the U.S. and other governments as well as from industry. Initia-tives in 2D nanomaterials will also contribute to growth. Government funding for science research in developing countries will also rise in the coming years. In 2012, demand from industrial and microelectronics/semiconductor customers in SPM was relatively flat. AFMs are used in the semiconductors to provide surface measurements on thin film magnetic heads and semiconductors. They are used to monitor the prod-ucts throughout the manufacturing process in order to improve product quality and reduce costs in industrial applications. Due to the ever increasing metrology re-quirements for 1X nm node fabrication, measurements of sub-10 nm defects are required and recognized as one of the challenges for blank and patterned wafers and masks. Scanning probe microscopy (SPM) has been
suggested as one of the technologies that can fulfil the future metrology and inspection requirements, because it has the distinct advantage of being able to discern in 3D the atomic structure of the substrate.AFMs are used in the manufacturing process to monitor product quality, process accuracy, and data repeatabil-ity. There is also a demand for SPM from polymer and metallurgy industries to determine characteristics such as molecular structure and polymer chains, corrosion resistance, defects, faults, cracks, and fatigue.The biomedical and life sciences sector is high growth market for SPM. With the development of sharper probe tips, there has been a huge improvement in resolu-tion and different imaging methods, due to which the technique has become highly suitable for the study and analysis of DNA structures.Main suppliers of vacuum STM/AFM are RHK-Technolo-gy, Omicron (Oxford Instruments), SPS-CreaTec GmbH, SPECS Surface Nano Analysis GmbH and Unisoku.
Table 12: Global Scanning Probe Microscopes Market Revenues 2010-2020, (US$)
Year Revenues (Conservative) Revenues (Optimistic)
2010 355,000,000 450,000,000
2011 375, 000, 000 465,000,000
2012 385, 000, 000 480,000,000
2013 375,000,000 476,000,000
2014 384,000,000 480,000,000
2015 391,680,000 494,400,000
2016 403,430,400 509,232,000
2017 415,533,312 529,601,280
2018 430,076,978 558,729,350
2019 445,129,672 592,253,111
2020 460,709,211 630,749,564* Due to fluctuations in prices of units sold, figures are based on total company revenues rather than number of units sold.

MIC
ROSC
OPE
S • O
CTO
BER
201
3
18
Table 13: Global Atomic Force Microscopes Market Revenues 2010-2020, (US$)
Year Revenues (Conservative) Revenues (Optimistic)
2010 323,050,000 409,500,000
2011 341,250,000 423,150,000
2012 350,350,000 436,800,000
2013 341,250,000 433,160,000
2014 349,440,000 436,800,000
2015 356,428,800 449,904,000
2016 367,121,664 463,401,120
2017 378,135,314 481,937,165
2018 419,245,382 508,443,709
2019 405,068,002 538,950,331
2020 419,245,382 573,982,103

MIC
ROSC
OPE
S • O
CTO
BER
201
3
19
Markets by region
T he North America advanced microscopy market is considered mature. Developing Asian markets such as China, Korea, India, and Taiwan are ex-
periencing good growth. The developments in nano-technology, material science and life sciences, heavily backed by government investment, drive interest in advanced microscopy, in addition to the improvements in software design and increased degrees of automa-tion in end-user industries. The main regional market for EM and SPM is Asia-Pacif-ic, and it is also the fastest growing market, with robust sales in Japan and China and an emerging market in India. Brazil and Russia are also emerging forces backed by increased budgets for scientific infrastructure and nanotechnology and nanomaterials research. The growth in the advanced microscopy sector has been aided by continued government R&D spending despite the fallout from the financial crisis. Most countries with significant R&D budgets will either increase or main-tain the same level of R&D spending in the coming years. Spending levels with only decrease in relatively insignificant markets for advanced microscopy. Global R&D spending increased in 2012 with continued strong growth in emerging economies and stable growth in established economies. The US market however will be affected by significant budget cuts for research.
Electron MicroscopesMost companies witnessed renewed growth in the North American market in 2010. The United States after Japan, is the second largest country market for elec-tron microscopes. In 2005, developed regions (North America, Western Europe and Japan) constituted 2/3rds of the the market for electron microscopes. In 2012, the ratio is around 50/50 with developing regions (Asia, Eastern Europe, Middle East, Latin America, Africa).Prior to the economic recession, Europe was the market most likely to experience reasonable growth to 2017. Nanotechnology and life sciences are key funding areas for the EU and countries such as Germany, the Nether-lands and the UK. Developing markets in Asia-Pacific for EM include Chi-na, India, South Korea. A number of EM suppliers have
expanded into BRICs (Brazil, Russia, India, and China) countries. The semiconductors market in Asia recovered remarkably quickly from the economic downturn. Asia-Pacific will remain the main market for the fore-seeable future. As result of the abundant material and manpower resources, countries such as China, South Korea, India, Taiwan, and Thailand have been growing in prominence in the industrial segment. With the need to develop and improve infrastructure in the region, demand for electron microscopes has been steadily increasing. The region is considered to be the manufac-turing hub of the world at present, offering significant opportunities for electron microscopes especially in the semiconductors market. Companies are witnessing increased revenues to smaller, developing countries where nanotechnology is being funded by govern-ments.Latin America is an emerging market for electron micro-scopes, although starting from a low base. Government towards development and promotion of nanotechnol-ogy research and growing interest of pharmaceutical and biotechnology companies towards expansion of their global clinical trials projects to the Latin American region are drivers for this market. Main markets are in Brazil, Mexico and Argentina. The Middle East is also a relatively new market for advanced microscopy prod-ucts with growing research, nanotechnology, education and industrial sectors. Companies are selling products in these regions for use in the mining and oil and gas exploration market. Oil and gas is a relatively small proportion of the advanced microscopes market, but is likely to grow in the coming years. 5% of FEI’s micros-copy sales are in this market (natural resources). More than $1 billion a year is now spent on analyzing par-ticles of rock brought up from the surface. Restructuring and consolidation has led to a new focus for the semiconductor manufacturers in Japan. As a re-sult, the semiconductor equipment market in Japan will experience double-digit growth in both 2013 and 2014, driven by higher spending for memory production and in spending increases planned for the manufacturing of power semiconductors and “More than Moore” semicon-ductor technologies .
REGIONS

MIC
ROSC
OPE
S • O
CTO
BER
201
3
20
Total equipment spending in Japan is estimated to reach $4.6 billion by 2014. Combining this with the $8 billion-plus spending on semiconductor materials, Japan represents a $12 billion market in 2014 for the suppliers of equipment and materials.
Scanning Probe MicroscopesThe United States is the second-largest market for scanning probe microscopes, behind Japan. There are numerous government, academic and industrial activi-ties in nanotechnology, material sciences research, and life sciences and bio in these countries. Asia-Pacific is the largest and fastest-growing market for SPM. China and Russia are growth markets backed by increased budgets for scientific infrastructure and nanotechnology/nanomaterials research. The govern-ment strategy in these countries is aimed at building an innovative economies that support IT-related industries and scientific institutions and academia. China is now
a significant world player in science and technology, the third largest R&D performer. Other growing mar-kets are in South Korea and of India with government’s providing larger R&D budgets year-on-year. Demand is increasing in these countries for easy to operate sys-tems in the sub-micron to nanometer range, for use in materials development and inspection applications. The main markets for SPM in Latin America and the Middle East are in universities and research centers. Improvement in economic conditions in the Latin American markets is a key driver for AFM demand in the region. Increased manufacturing and inspection activi-ties in Brazil, Mexico, South Africa, and the Middle East are other key factors driving growth.Asia-Pacific accounts for approximately 35-40% of SPM sales. North America and Europe make up approxi-mately 55%. Broad market share for SPM is 40% from applied/industrial customers and 60% from academic/government customers.
Table 14: Global R&D Expenditure 2012, Billion US$ (Source: Battelle)
Americas Total 505.6
U.S. 436.0
Asia 514.4
Japan 157.6
China 198.9
India 41.3
Europe 338.1
Rest of World 44.5
Table 15: Global R&D Expenditure 2012 Top 10 countries, Billion US$ (Source: Battelle)
1. United States 436.0
2. China 198.9
3. Japan 157.6 494,650,000
4. Germany 90.6
5. South Korea 56.4
6. France 51.1
7. UK 42.4
8. India 41.3
9. Brazil 30
10. Canada 28.6

MIC
ROSC
OPE
S • O
CTO
BER
201
3
21
Table 16: Market for electron microscopes, by region, 2010-2020, Conservative estimate, (US$)
YEAR North America Asia-Pacific Europe RoW
2010 494,650,000 951,250,000 418,550,000 38,050,000
2011 524,837,500 1,091,662,000 440,863,500 41,987,000
2012 511,011,997 1,174,137,314 470,485,329 52,365,360
2013 498,150,510 1,222,733,070 486,828,908 56,608,013
2014 511,020,485 1,277,551,211 464,564,077 69,684,612
2015 525,187,111 1,312,967,776 477,442,828 71,616,424
2016 540,577,758 1,351,444,396 491,434,326 73,715,149
2017 557,101,430 1,392,753,575 506,455,845 88,629,773
2018 574,900,313 1,424,184,866 522,636,648 91,461,413
2019 593,308,216 1,456,301,986 539,371,106 107,874,221
2020 612,347,382 1,503,034,483 556,679,438 111,335,888
Table 17: Market for electron microscopes, by region, 2010-2020, Optimistic estimate, (US$)
YEAR North America Asia-Pacific Europe RoW
2010 640,250,000 1,231,250,000 541,750,000 49,250,000
2011 685,912,500 1,426,698,000 573,058,500 54,873,000
2012 654,350,000 1,507,850,000 597,450,000 85,350,000
2013 673,651,242 1,653,507,594 658,340,987 76,551,278
2014 734,831,408 1,837,078,521 668,028,553 100,204,283
2015 774,894,549 1,937,236,372 704,449,590 105,667,438
2016 819,668,734 2,049,171,836 745,153,395 111,773,009
2017 873,096,433 2,182,741,084 793,724,030 119,058,605
2018 932,691,383 2,310,530,925 847,901,257 148,382,720
2019 996,582,533 2,446,157,127 905,984,121 181,196,824
2020 1,065,096,144 2,614,326,898 968,269,222 193,653,844

MIC
ROSC
OPE
S • O
CTO
BER
201
3
22
Scanning Probe MicroscopesThe United States is the second-largest market for scanning probe microscopes, behind Japan. There are numerous government, academic and industrial activi-ties in nanotechnology, material sciences research, and life sciences and bio in these countries. Asia-Pacific is the largest and fastest-growing market for SPM. China and Russia are growth markets backed by increased budgets for scientific infrastructure and nanotechnology/nanomaterials research. The govern-ment strategy in these countries is aimed at building an innovative economies that support IT-related industries and scientific institutions and academia. China is now a significant world player in science and technology, the third largest R&D performer. Other growing mar-kets are in South Korea and of India with government’s
providing larger R&D budgets year-on-year. Demand is increasing in these countries for for easy to operate systems in the sub-micron to nanometer range, for use in materials development and inspection applications. The main markets for SPM in Latin America and the Middle East are in universities and research centers. Improvement in economic conditions in the Latin American markets is ae key driver for AFM demand in the region. Increased manufacturing and inspection activities in Brazil, Mexico, South Africa, and the Middle East are other key factors driving growth.Asia-Pacific accounts for approximately 45% of SPM sales. North America and Europe make up approxi-mately 52%. Broad market share for SPM is 40% from applied/industrial customers and 60% from academic/government customers.
Table 18: Market for scanning probe microscopes, by region, 2010-2020 (US$), Conservative estimate
YEAR North America Asia-Pacific Europe RoW
2010 71,000,000 170,400,000 106,500,000 7,100,000
2011 75,000,000 180,000,000 112,500,000 7,500,000
2012 80,850,000 180,950,000 115,500,000 7,700,000
2013 85,900,000 172,400,000 108,050,000 8,650,000
2014 88,320,000 176,640,000 107,520,000 11,520,000
2015 90,539,095 181,078,191 106,285,025 13,777,688
2016 92,788,992 185,577,984 108,926,208 16,137,216
2017 95,572,662 191,145,324 108,038,661 20,776,666
2018 98,917,705 197,835,410 111,820,014 21,503,849
2019 97,928,528 204,759,649 120,185,011 22,256,484
2020 101,356,026 211,926,237 124,391,487 23,035,461
Table 19: Market for scanning probe microscopes, by region, 2010-2020 (US$), Optimistic estimate
YEAR North America Asia-Pacific Europe RoW
2010 90,000,000 216,000,000 135,000,000 9,000,000
2011 93,000,000 223,200,000 139,500,000 9,300,000
2012 100,800,000 225,600,000 144,000,000 9,600,000
2013 109,035,733 218,833,067 137,151,467 10,979,733
2014 110,400,000 220,800,000 134,400,000 14,400,000
2015 114,283,417 228,566,834 134,158,794 17,390,955

MIC
ROSC
OPE
S • O
CTO
BER
201
3
23
Table 19: Market for scanning probe microscopes, by region, 2010-2020 (US$), Optimistic estimate
2016 117,123,360 234,246,720 137,492,640 20,369,280
2017 121,808,294 243,616,589 137,696,333 26,480,064
2018 128,507,751 257,015,501 145,269,631 27,936,468
2019 130,295,685 272,436,431 159,908,340 29,612,656
2020 138,764,904 290,144,799 170,302,382 31,537,478

MIC
ROSC
OPE
S • O
CTO
BER
201
3
24
The semiconductor industry is the primary market for EM and a major market for SPM. Demand in the semiconductors industry is from customers in semiconductor inte-grated circuit manufacturing and related industries such as manufac-turers of data storage equipment and other technologies. The market is extremely volatile; recently year-to-year variation has been a factor of three.Growth is driven by shrinking line widths and process nodes of 32 nanometers and smaller, increasing complexity in their materials such as high-k metal gates and low-k dielectrics and increasing device complexity such as 3D transis-tor architectures. There is also an increased demand for TEM-FIB for sample preparation and analysis.Advanced microscopy products are used primarily in laboratories or near the fabrication line to speed new product development and in-crease yields by enabling 3D wafer metrology, defect analysis, root cause failure analysis and circuit edit for modifying device function-ality. Trends in semiconductors and data storage that impact EM and SPM include: • Need for defect free IC• Decreasing feature size (22 nm towards 10 nm Node)• Wafers are getting bigger• Equipment should be better de-signed to avoid contamination• Increase in complexity and perfor-mance level of devices
Global semiconductors marketTotal semiconductor revenue world-
wide will see improved growth this year of 6.9%, reaching $320 billion, according to the mid-year 2013 up-date from International Data Corp. IDC also forecasts that semiconduc-tor revenues will grow 2.9% year over year in 2014 to $329 billion and log a compound annual growth rate (CAGR) of 4.2% from 2012-2017, reaching $366 billion in 2017. The semiconductor equipment sector is between $3-$4billion. Gartner has predicted that semiconductor equipment spending is expected to fall by 6% in 2013, but will pick up by the end of the year and is ex-pected to increase by 14% in 2014. The advanced microscopy market will benefit from both the cyclical rebound in overall semiconduc-tor spending as well as the secular trend of increased capital intensity for process control in advanced semiconductor nodes.Although it is forecast in 2013 that overall semiconductor equipment spending will be down , most microscopy companies believe that the downturn has bottomed and that the industry is at or near the beginning of the next investment upswing.Process control has emerged as a secular trend within the overall cyclical semiconductor capital equipment industry, driven by com-plex chip architectures, geometry shrinks and wafer migration. Companies anticipate a recovery in the last quarter of 2013, driven by growth in mobile and an upsurge in consumer/enterprise spending. There will also be an increase in semiconductor spending in Ja-
pan which is expected to show double-digit growth in both 2013 and 2014, driven by higher spend-ing for memory production and in spending increases planned for the manufacturing of power semicon-ductors and “More than Moore” semiconductor technologies. Leading the investment activity in Japan is Flash Alliance, a joint-ven-ture between Toshiba and Sandisk. According to the SEMI World Fab Forecast database, equipment spending for Flash Alliance could approach $2 billion this year and even more in 2014 because of the overall strong market demand for NAND flash in mobile products. Toshiba has announced plans to spend up to $300 million (30B yen) to construct the Fab 5 phase 2 at the Yokkaichi plant location. This fab will ramp for production of sub-20 nm/3D flash memories, with building construction completed by 2014 summer.In the next ten years the semicon-ductor market has been predicted to grow by approximately 14% per year in the silicon area, while the complexity will keep increasing with a rapid pace. The number of process steps and use of diverse materials will increase, which will helped to continue the growth in the advanced microscopy markets. As a result of “more Moore”, me-trology and characterization of semiconductor products become more critical since the features to be observed are becoming so small that imaging requires advanced microscopy equipment. Although the semiconductor equip-
Semiconductors and data stor-age
SEMICONDUCTORS

MIC
ROSC
OPE
S • O
CTO
BER
201
3
25
ment industry is highly cyclical there is an overall growth trend (excluding the fallout from the 2008/2009 financial crisis)- succes-sive peak and trough are higher than the preceding peaks and troughs. The requirement for more sophisticated equipment for each successive node creates these growth cycles in semiconductor
capital equipment.Hitachi-High Technologies is the lead supplier in CD-SEM in semi-conductors with over 66% of the market in 2012; FEI has the largest market share in TEM and is aggres-sively expanding in this market with a number of new product launches in 2013; and Park Systems has a significant market share in AFM in
semiconductors and data storage. According to the company they dominate the AFM hard disc market with a 90% market share.
SEMICONDUCTORS
Table 20: Global market for scanning electron microscopes, in semiconductors and data storage, 2010-2020 (US$), Conservative estimate
YEAR Revenues (US$)
2010 912,500,000
2011 951,250,000
2012 988,500,000
2013 1,003,926,000
2014 1,026,763,878
2015 1,050,894,848
2016 1,069,069,844
2017 1,104,704,680
2018 1,134,617,221
2019 1,165,397,247
2020 1,197,072,159
Table 21: Global market for scanning electron microscopes, in semiconductors and data storage, 2010-2020 (US$), Optimistic estimate
YEAR Revenues (US$)
2010 1,150,000,000
2011 1,200,000,000
2012 1,247,900,000
2013 1,364,558,550
2014 1,533,012,063
2015 1,585,685,467
2016 1,635,168,660
2017 1,466,624,922
2018 1,825,455,540
2019 1,963,975,624
2020 2,028,015,451

MIC
ROSC
OPE
S • O
CTO
BER
201
3
26
SEMICONDUCTORS
Table 22: Global market for transmission electron microscopes, in semiconductors and data stor-age, 2010-2020 (US$), Conservative estimate
YEAR Revenues (US$)
2010 148,200,000
2011 161,538,000
2012 170,430,000
2013 165,496,500
2014 169,633,913
2015 169,209,828
2016 173,778,493
2017 178,644,291
2018 183,824,975
2019 189,155,900
2020 194,641,421
Table 23: Global market for transmission electron microscopes, in semiconductors and data stor-age, 2010-2020 (US$), Optimistic estimate
YEAR Revenues (US$)
2010 193,800,000
2011 211,242,000
2012 200,260,000
2013 199,206,000
2014 212,473,120
2015 224,460,145
2016 244,437,098
2017 266,680,874
2018 291,375,522
2019 318,356,896
2020 347,836,744

MIC
ROSC
OPE
S • O
CTO
BER
201
3
27
SEMICONDUCTORS
Table 24: Global market for scanning probe microscopes, in semiconductors and data storage, 2010-2020 (US$), Conservative estimate
YEAR Revenues (US$)
2010 99,400,000
2011 105,000,000
2012 107,800,000
2013 100,300,000
2014 96,000,000
2015 94,003,200
2016 96,823,296
2017 95,572,662
2018 98,917,705
2019 102,379,825
2020 105,963,118
Table 25: Global market for scanning probe probe microscopes, in semiconductors and data storage, 2010-2020 (US$), Optimistic estimate
YEAR Revenues (US$)
2010 112,500,000
2011 120,900,000
2012 116,250,000
2013 123,950,000
2014 120,000,000
2015 118,656,000
2016 122,215,680
2017 121,808,294
2018 128,507,751
2019 136,218,216
2020 145,072,400

MIC
ROSC
OPE
S • O
CTO
BER
201
3
28
The materials and nanomaterials cience market segment includes universities, public and private research laboratories and custom-ers in a wide range of industries, including natural resources (mining and oil and gas), petrochemicals, metals, automobiles, aerospace, fiber optics, polymers, ceramics, solar, thin films and forensics. Ad-vanced microscopy is fundamental for the exploitation and control of nanostructures and -systems.
DriversGrowth in the materials and nano-materials academic and industrial research segment is driven by a number of factors. In the academic research segment these include:• Worldwide government and pri-vate spending • The number of nanotech centers continues to grow and they have equipment requirements for char-acterization, prototyping and in-situ process development• Third world using tech to move to the first world• Increased global nanotechnology investment. Nanotech research is also linked to important govern-ment societal issues (energy, sus-tainability, environment)• Research institutes demanding leading-edge tools.Materials researchers seek to understand the structure-function relationships and chemical compo-sition down to the atomic level. Full characterization is more difficult due to decreasing feature sizes and increasingly complex architectures. Growth in these markets is driven
by global corporate and govern-ment funding for research and de-velopment in materials science and by development of new products and processes based on innovations in materials at the nanoscale. Ad-vanced microscopy enables scien-tific discovery and advancement for researchers and help manufacturers develop, analyze and produce ad-vanced products. Usage is growing mining for automated mineralogy and their are increased opportu-nities in oil and gas exploration and laboratory analysis. Advanced microscopy products are also used in root cause failure analysis and quality control applications across a range of industries.
NanotechnologyGrowth in nanotechnology and nanomaterials applications is having a significant impact on most high-tech industries, creat-ing opportunities for advanced microscopes. Nanostructured materials are becoming increas-ingly important in micromechanical, electronic, and magnetic devices. Low dimensional materials, such as nanotubes, nanowires, and other nanoparticles have properties that could provide solutions for emerg-ing research devices, lithography, front end process, interconnects, and assembly and packaging for the semiconductors. Nanotechnology requires removal and deposition to produce features of 100nm or less, which is within the range of most failure analysis technology. AFM, SEM and TEM are key instruments for the nanotechnology/nanomate-
rials market. The enormous need to analyze three-dimensional topo-graphic images and resolve surface roughness on the nanometer scale has made AFMs essential in a wide range of end-user industries. Trends in metrology that impact SPM include:• Throughput of current state-of-the-art SPMs are extremely low• Increased metrology requirements at the nanoscale• Amount of necessary metrology steps is increasing, it needs to be fast and simple.
Market outlookThe materials and nanomaterials research (academic and industrial) segment is a prime market for ad-vanced microscopy and will remain stable in the coming years with continued investment in develop-ing countries, stable funding in developed countries and new ap-plications in the coming years. The natural resources sector is viewed as a key medium-term growth mar-ket as the need for sophisticated analysis to improve yields becomes greater as resources deplete.
Materials and nanomaterials re-search
MATERIALS RESEARCH

MIC
ROSC
OPE
S • O
CTO
BER
201
3
29
MATERIALS RESEARCH
Table 26: Global market for scanning electron microscopes, in materials and nanomaterials research, 2010-2020 (US$), Conservative estimate
YEAR Revenues (US$)
2010 325,000,000
2011 406,250,000
2012 438,750,000
2013 459,756,000
2014 474,927,948
2015 485,505,889
2016 504,926,124
2017 518,038,667
2018 540,832,369
2019 564,628,993
2020 589,472,669
Table 27: Global market for scanning electron microscopes, in materials and nanomaterials research, 2010-2020 (US$) Optimistic estimate
YEAR Revenues (US$)
2010 455,000,000
2011 568,750,000
2012 614,250,000
2013 660,498,300
2014 700,128,198
2015 730,891,407
2016 774,744,891
2017 808,595,283
2018 861,153,977
2019 1,038,799,190
2020 976,742,369
Table 28: Global market for transmission electron microscopes, in materials and nanomaterials research, 2010-2020 (US$), Conservative estimate
YEAR Revenues (US$)
2010 195,000,000
2011 212,550,000
2012 224,250,000
2013 225,259,125

MIC
ROSC
OPE
S • O
CTO
BER
201
3
30
MATERIALS RESEARCH
Table 28: Global market for transmission electron microscopes, in materials and nanomaterials research, 2010-2020 (US$), Conservative estimate
2014 221,466,497
2015 227,224,626
2016 228,394,591
2017 234,789,639
2018 241,598,539
2019 248,604,897 9
2020 255,814,439
Table 29: Global market for transmission electron microscopes, in materials and nanomaterials research, 2010-2020 (US$), Optimistic estimate
YEAR Revenues (US$)
2010 255,000,000
2011 277,950,000
2012 263,500,000
2013 271,141,500
2014 277,395,462
2015 301,417,909
2016 321,260,185
2017 350,494,862
2018 382,950,687
2019 418,411,920
2020 457,156,864
Table 30: Global market for scanning probe microscopes, in materials and nanomaterials re-search, 2010-2020 (US$), Conservative estimate
YEAR Revenues (US$)
2010 191,700,000
2011 202,500,000
2012 200,200,000
2013 200,900,000
2014 211,200,000
2015 219,340,800
2016 225,921,024
2017 236,853,988
2018 245,143,877
2019 253,723,913

MIC
ROSC
OPE
S • O
CTO
BER
201
3
31
MATERIALS RESEARCH
Table 30: Global market for scanning probe microscopes, in materials and nanomaterials re-search, 2010-2020 (US$), Conservative estimate
2020 262,604,250
Table 31: Global market for scanning probe microscopes, in materials and nanomaterials re-search, 2010-2020 (US$), Optimistic estimate
YEAR Revenues (US$)
2010 256,500,000
2011 260,400,000
2012 264,000,000
2013 256,850,000
2014 264,000,000
2015 276,864,000
2016 285,169,920
2017 301,872,730
2018 318,475,730
2019 337,584,274
2020 359,527,251

MIC
ROSC
OPE
S • O
CTO
BER
201
3
32
The Life Sciences market segment includes universities, government laboratories and research institutes engaged in biotech and life sciences applications, as well as pharmaceu-tical, biotech and medical device companies and hospitals. The majority of the market is made up by research institutes and uni-versities; however there is a grow-ing market in pharma and biotech.Ultrahigh resolution imaging al-lows structural biologists to create detailed 3D reconstructions of complex biological structures such as proteins and viruses.
Electron microscopesCellular biologists use electron microscopes to correlate wide-field, lower resolution optical images with higher resolution electron microscope imaging. Products are also used by drug researchers and in particle analysis and a range of pathology and quality control ap-plications.TEM and SEM seek to simplify atomic level structural analyses in
biology, medicine, pharmaceuti-cals. The particle and size distribu-tion characteristics of a drug will often have an impact on the rate of delivery in the body. Regulatory bodies (e.g. FDA) have a stringent requirement of understanding the chemical and physical characteris-tics of drug particles and potential contaminants as part of the drug validation process. Historically, optical light microscopy has been sufficient, however in the last few years the regulatory authorities are increasingly insisting on character-izing finer particles and agglomer-ates unresolvable in transmission or reflection by optical microscopy. FEI, JEOL, Hitachi, and Carl Zeiss SMT all produce electron micro-scopes for life science research. There has been faster percentage growth in the life sciences market than any other in the past 4 years.
Scanning probe microscopesBiophysics is driving new interest in both the cell membrane and in measuring the cell’s nano-mechan-
ical properties, both at the cellular and molecular level. This shift is opening new life science opportuni-ties for atomic force microscopy (AFM). AFM is used widely with biological specimens and in drug discovery for the visualization, probing and manipulation of biological systems from living cells down to single molecules. AFM measurements can be carried out in buffer solution under physiological conditions, which is crucial to study the structure and function of bio-logical objects. AFM is used in cell biology, biochemistry, biomedicine, molecular biology, pharmaceutical industry, cancer research, virology, microbiology, etc. • AFM offers a number of advan-tages in life sciences:• it requires no dehydration, sample labelling or surface coating• operates well in liquids and on live cells• can detect at the single-molecule level• extends XY resolution to the na-noscale.
Life Sciences
LIFE SCIENCES
Table 32: Global market for scanning electron microscopes, in life sciences, 2010-2020 (US$), Con-servative estimate
YEAR Revenues (US$)
2010 50,000,000
2011 81,250,000
2012 87,750,000
2013 90,558,000
2014 93,546,414
2015 104,570,499
2016 116,521,413
2017 121,415,313
2018 126,757,586

MIC
ROSC
OPE
S • O
CTO
BER
201
3
33
LIFE SCIENCES
Table 32: Global market for scanning electron microscopes, in life sciences, 2010-2020 (US$), Con-servative estimate
2019 132,334,920
2020 138,157,657
Table 33: Global market for scanning electron microscopes, in life sciences, 2010-2020 (US$), Opti-mistic estimate
YEAR Revenues (US$)
2010 70,000,000
2011 113,750,000
2012 122,850,000
2013 130,098,150
2014 137,904,039
2015 157,422,765
2016 178,787,283
2017 189,514,520
2018 201,832,963
2019 243,468,560
2020 228,923,993
Table 34: Global market for transmission electron microscopes, in life sciences, 2010-2020 (US$), Conservative estimate
YEAR Revenues (US$)
2010 46,800,000
2011 51,012,000
2012 53,820,000
2013 68,956,875
2014 84,816,956
2015 87,022,197
2016 94,336,896
2017 96,978,329
2018 99,790,701
2019 102,684,631
2020 105,662,486

MIC
ROSC
OPE
S • O
CTO
BER
201
3
34
LIFE SCIENCES
Table 35: Global market for transmission electron microscopes, in life sciences, 2010-2020 (US$), Optimistic estimate
YEAR Revenues (US$)
2010 61,200,000
2011 66,708,000
2012 63,240,000
2013 83,002,500
2014 100,334,529
2015 115,436,646
2016 132,694,424
2017 144,769,617
2018 158,175,284
2019 172,822,315
2020 188,825,661
Table 36: Global market for scanning probe microscopes, in materials and nanomaterials re-search, 2010-2020 (US$), Conservative estimate
YEAR Revenues (US$)
2010 191,700,000
2011 202,500,000
2012 200,200,000
2013 200,900,000
2014 211,200,000
2015 219,340,800
2016 225,921,024
2017 236,853,988
2018 245,143,877
2019 253,723,913
2020 262,604,250
Table 37: Global market for scanning probe microscopes, in materials and nanomaterials re-search, 2010-2020 (US$), Optimistic estimate
YEAR Revenues (US$)
2010 256,500,000
2011 260,400,000
2012 264,000,000
2013 256,850,000
2014 264,000,000

MIC
ROSC
OPE
S • O
CTO
BER
201
3
35
LIFE SCIENCES
Table 37: Global market for scanning probe microscopes, in materials and nanomaterials re-search, 2010-2020 (US$), Optimistic estimate
2015 276,864,000
2016 285,169,920
2017 301,872,730
2018 318,475,730
2019 337,584,274
2020 359,527,251

MIC
ROSC
OPE
S • O
CTO
BER
201
3
36
Table 38: Scanning probe microscopy market structure
Category Description
Competitors Leading companies (alphabetical order)• Agilent Technologies• Bruker Nano• Hitachi High-Tech Science Corporation• NT-MDT• Oxford Instruments/Asylum Research• Park Systems
Other manufacturers• AIST-NT• Anasys Instruments• Anfatec• Angstrom Advanced Inc. • APE research srl• JPK Instruments• Kleindiek Nanotechnik• Multiprobe, Inc.• Nanonics Imaging• Nanoscan• Nanosurf• Nanotec Electronica• RHK Technology • Shimadzu• SPECS Surface Nano Analysis GmbH (Vacuum STM/AFM)• SPS-CreaTec (LT-STM)• Techscience Ltd.• Unisoku• Witec
Types of competitors • Large instrumentation companies marketing and selling products on a global basis and via distributors• Medium-sized and small private companies mainly selling on a regional basis or on a price competitive basis in niche microscope markets
Means of distribution • Direct sales by companies • Distribution through third parties usually on a regional basis
End user markets • Semiconductors and electronics• Biomedical research and life sciences• Nanotechnology and nanomaterials research• Industrial R&D• Research labs and academia • Failure analysis labs
Scanning Probe Microscopy mar-ket structure

MIC
ROSC
OPE
S • O
CTO
BER
201
3
37
Table 39: Electron microscopy market structure
Category Description
Competitors Leading companies (alphabetical order)• Carl Zeiss SMT• FEI Company• Hitachi High-Technologies• JEOL
Other manufacturers• Agilent (FE-SEM)• Tescan s.r.o.
Types of competitors • Large instrumentation companies marketing and selling products on a global basis and via distributors (Plus Tescan)
Means of distribution • Direct sales by companies • Distribution through third parties usually on a regional basis
End user markets • Semiconductors and electronics • Biomedical research and life sciences• Nanotechnology and nanomaterials research• Industrial R&D• Research labs and academia • Failure analysis labs
Electron Microscopy market structure

MIC
ROSC
OPE
S • O
CTO
BER
201
3
38
Markets and applications compa-nies target their products at are:
Semiconductors and data storage• Semiconductor components• Si or III-V technology• 3D Metrology• Wafers• Data storage devices and medias• Integrated circuits (ICs)• Power modules• Printed circuit boards• Discrete components• Magnetic materials• MEMS/NEMS• Flexible printed circuit board materials• MPU• MCU• DSP• CMOS Logic• Opto components• Passive components• Transistors• Capacitors• Resistors• LEDs/HPLEDs• Flat panel liquid crystal displays (LCDs)• Solar photovoltaic cells and mod-ules (solar PVs)• Commercial FA laboratories
Life sciences and bio• Pharmaceuticals• Biotechnology• Proteomics• Agricultural biotechnology• Molecular diagnostics• Microbiology• Medical devices (catheters, artifi-cial joints)• Biosensors
• Biochips
Nanotechnology and nanomaterials research• Nanopowders• Nanoporous materials• Nanostructures• Fullerenes• Nanotubes• Nanoelectronics• Quantum dots• Nanowires• Quantum structures• Nanomachining• AFM lithography• STM lithography• Nanomanipulations• University laboratories• Research institutes• Government laboratories
Industrial R&D• Optical Fiber and Optical Fiber Cable• Optoelectronic Devices Used in Telecommunications Equipment• Fiber Optic Attenuators• Fiber Optic Switches• Optical Fiber Connectors• Passive Optical Components• Splices• Connectors• Ceramic materials and powders• Steel• Aluminium• Combinatorial materials• Spherulites and dendrites• Polymer monocrystals• Polymer nanoparticles• LB-films• Thin organic films• Composites• Thermoplastics and resins
• Power generation• Electrochemicals• Fine chemicals• Mining• Oil and gas exploration• Petrochemicals• Geology• Adhesives• Paint and coatings
Advanced Microscopy Compa-nies
COMPANIES
MIC
ROSC
OPE
S • O
CTO
BER
201
3
39
Advanced Technologies Cen-terDESCRIPTIONAdvanced Technologies Center manufactures the FemtoScan series of scanning probe microscope.
PRODUCTSThe company has established an R&D center where it will conduct research to perfect technology, carry out engineering development, and test prototypes and models. The center will supply software to work in instrument-managing and image-processing modes.
The scanning probe microscopes that ATC produces are capable of a variety of research regimes—con-tact atomic force microscopy, resonance atomic force microscopy, scanning frictional microscopy, scanning resistance microscopy, scanning tunneling microscopy, electrostatic microscopy, magnetic force microscopy, force curve analysis, and nanolithography among them. Combining compact size with software packages, ATC instruments can be accessed through the Internet with open architecture.
NUMBER OF EMPLOYEES1-5
ESTIMATED ANNUAL REVENUES$1 million-$5million
ADDRESSAdvanced Technologies Center Stroiteley str. 4-5-47 Moscow, 119311 Russian FederationTel: +7(495)926-3759
WEBwww.nanoscopy.ru
PROFILE

MIC
ROSC
OPE
S • O
CTO
BER
201
3
40
Agilent TechnologiesDESCRIPTIONAgilent Technologies is a global diversified technology company that provides enabling solutions to high growth markets within the communications, electronics, healthcare and life sciences industries. The company has four primary businesses: test and measurement, semiconductor products, healthcare solutions and chemical analysis. Agilent Technologies offers high-precision, modular AFM solutions for research, industry, and education. Exceptional worldwide support is provided by experienced application scientists and technical service personnel. Agilent’s leading-edge R&D laboratories ensure the continued, timely introduction and optimization of innovative, easy-to-use AFM technologies. The company’s 16,000 employees serve customers in more than 110 countries. The company also manufactures a U9320A 8500 Field Emission Scanning Electron Microscope. On Sept. 19, 2013, Agilent announced plans to separate into two publicly traded companies through a tax-free spinoff of its electronic measurement business. The new company is named Keysight Technologies, Inc. The separation is expected to be completed in early November 2014.
PRODUCTS
Product Imaging Modes Applications
6000ILM Atomic Force Micro-scope (AFM) (N9436S)
· LFM· MAC Mode· Contact Mode· Phase Imaging· Acoustic AC Mode
- Cell Membranes- Single DNA/RNA- Individual Proteins- Single Molecules- Biopolymers- Surface Struct./Cells
5420 Atomic Force Microscope (AFM) (N9498S)
· STM· LFM· EFM· MFM· SMM· KFM· MAC Mode· Contact Mode· Phase Imaging · Current Sensing· Force Modulation· Acoustic AC Mode
- Electronic Materials- Polymers- Materials Science- Surface Characteriz.- Education
5500 Atomic Force Microscope (AFM) (N9410S)
· STM· LFM· EFM· MFM· KFM· MAC Mode· Contact Mode· Phase Imaging· Current Sensing· Force Modulation· Acoustic AC Mode
- Electrochemistry- Polymers- Nanolithography- Nanografting- Life Science- Materials Science
PROFILE

MIC
ROSC
OPE
S • O
CTO
BER
201
3
41
5600LS Atomic Force Microscope (AFM) (N9480S)
· STM· SMM· LFM· EFM· MFM· KFM· MAC Mode· Contact Mode· Phase Imaging· Current Sensing· Force Modulation· Acoustic AC Mode
- Electronic Materials- Semiconductor- Data Storage- Material Science- Polymers
5500ILM Atomic Force Microscope (AFM) (N9435S) 5100 Atomic Force Microscope (AFM) (N9420A)
· STM· LFM· EFM· MFM· KFM· MAC Mode· Contact Mode· Phase Imaging· Current Sensing · Force Modulation · Acoustic AC Mode
- Life Sciences
5100 Atomic Force Microscope (AFM) (N9420A)
· STM· LFM· KFM· EFM· MFM· MAC Mode· Contact Mode· Phase Imaging· Current Sensing · Force Modulation · Acoustic AC Mode
- Material Science- Polymers - Electrochemistry
NUMBER OF EMPLOYEES20,600 (Total)
ESTIMATED ANNUAL REVENUES (SPM)Electronic measurement: $3 billion plusSPM: $25 million-$50 million
ADDRESSAgilent Technologies395 Page Mill Road
PROFILE

MIC
ROSC
OPE
S • O
CTO
BER
201
3
42
Palo AltoCA 94306USAT: +1 6507525000
WEBhttp://nano.tm.agilent.comwww.keysight.com
PROFILE

MIC
ROSC
OPE
S • O
CTO
BER
201
3
43
AIST-NT Inc.DESCRIPTIONAIST-NT Co. is start-up founded by former employees of NT-MDT.
PRODUCTS• SmartSPM™ 1000• CombiScope™ 1000• OmegaScope™ 1000
NUMBER OF EMPLOYEES5-10
ESTIMATED ANNUAL REVENUES $1 million-$5 million
ADDRESSAIST-NT Inc.359 Bel Marin Keys Blvd., Suite 20 NovatoCA 94949USAT: +1 415-884-9500
WEBwww.aist-nt.com
PROFILES

MIC
ROSC
OPE
S • O
CTO
BER
201
3
44
Anasys InstrumentsCOMPANY DESCRIPTIONAnasys Instruments designs breakthrough, award-winning products that provide nanoscale probe based analytical techniques while providing high quality AFM imaging. The company introduced the nano-TA in 2006 which launched the field of nanoscale thermal property measurement. In 2010, Anasys introduced the nanoIR Platform which developed the field of nanoscale IR measurement. In 2012, Anasys introduced Lorentz Contact Resonance.
PRODUCTSThe afm+® from Anasys is a full featured Atomic Force Microscope (AFM).
NUMBER OF EMPLOYEES25-50
ESTIMATED ANNUAL REVENUES $5 million-$10 million
ADDRESSAnasys Instruments325 Chapala StSanta Barbara, CA 93101USATel: +1 (805) 730 3310
WEBwww.anasysinstruments.com
PROFILES

MIC
ROSC
OPE
S • O
CTO
BER
201
3
45
Anfatec Instruments AGCOMPANY DESCRIPTIONThe company produces entry-level AFMs.
PRODUCTSThe company’s product range covers scanning probe instruments like AFM (Atomic Force Microscopes) systems and STM. The company produces a Level AFM product.
NUMBER OF EMPLOYEES1-10
ESTIMATED ANNUAL REVENUES $1 million-$5 million
ADDRESSAnfatec Instruments AGMelanchthonstr. 28 08606 Oelsnitz (V) Germany Phone: +49 (0)37421 24212
WEBwww.anfatec.de
PROFILES

MIC
ROSC
OPE
S • O
CTO
BER
201
3
46
A.P.E. Research NanotechnologyCOMPANY DESCRIPTIONA.P.E. Research develops and produces very high-resolution probe microscopes (SPM), systems and instrumentation for surface and condensed matter physics. The company was established in 1996. The company started at the AREA Science Park in 1997 and since 1999 is officially recognized as a spin-off from the INFM (Italian National Institute for Condensed Matter Physics).
PRODUCTSThe A.P.E. Research catalog contains a standard version of Scanning Tunneling Microscopes (STM), Atomic Force Microscopes (AFM) and Near Field Optical Microscopes (SNOM). All these products can be provided with many additional tools and customized to meet the needs of the customer.
NUMBER OF EMPLOYEES10-15
ESTIMATED ANNUAL REVENUES $1 million-$5 million
ADDRESSA.P.E. ResearchArea Science ParkBasovizza Campus, s.s. 14, Km 163,5Building Q34149 TriestePhone +39.040.3757905
WEBwww.aperesearch.com/products/index.html
PROFILES

MIC
ROSC
OPE
S • O
CTO
BER
201
3
47
Applied Materials, Inc. COMPANY DESCRIPTIONApplied Materials, Inc. is a leading capital equipment producer serving the semiconductor, TFT LCD Display, Glass, WEB and solar (crystalline and thin film) manufacturing industries. Applied Materials creates and commercializes nanomanufacturing technology used in the production of: semiconductor (integrated circuit) chips for electronic gear, flat panel displays for computers and television, glass coat-ings for homes and buildings, web (flexible substrate) coatings for industry and photovoltaic solar cells and modules using both thin film and crystalline (aka wafer or bulk) photovoltaic technology. Applied is organized into four major business sectors: Silicon Systems Group, Display, Energy and Environmental Solutions (EES) and Service. The company is to merge with Tokyo Electron in 2014
PRODUCTSThe Applied VeritySEM® 4i metrology system uses proprietary SEM imaging technology to enable precise control of the lithography and etching processes, measuring CDs at a precision of less than 0.3nm.
Applied VeritySEM4i Metrology Designed for sub-32nm metrology VeritySEM4i, delivers high SEM resolution on the order of 1.5nm, high detection efficiency, powerful image processing and metrology algorithms. VeritySEM4i ensures minimal ArF resist shrinkage, accurate high aspect ratio contact / via measurement, proven Self-Aligned Double Patterning (SADP) capability, and robust handling of charged wafers.
Applied SEMVision G3 HP STAR Defect AnalysisThe product has throughput up to 1,800 defects per hour and sensitivity down to 30nm.
Applied SEMVision G3 FIB STAR Defect AnalysisWith a focused ion beam (FIB) integrated into the SEM review system, Applied SEMVision G3 FIB STAR De-fect Analysis is used for inline root cause analysis. Immediately available after SEM review, the integrated FIB performs local cross section of defects, providing inline defect root cause identification and real-time corrective action.
SEMVision G4 Defect AnalysisApplied SEMVision is used for SEM defect review and analysis systems for 45nm manufacturing and be-yond.
NUMBER OF EMPLOYEES13, 700 (Total)
ESTIMATED ANNUAL REVENUES Total: $7.5 billion Silicon Systems Group Segment: $4.7 billionSEM: $25 million-$50 million
ADDRESSApplied Materials, Inc.3050 Bowers AvenueP.O. Box 58039
PROFILES

MIC
ROSC
OPE
S • O
CTO
BER
201
3
48
Santa ClaraCA 95054-3299USAT: + 1 4087275555
WEBwww.appliedmaterials.comwww.appliedmaterials.com/technologies/library/veritysem4i-metrology
PROFILES

MIC
ROSC
OPE
S • O
CTO
BER
201
3
49
Being Nano-Instruments LTDCOMPANY DESCRIPTIONThe company was founded in 1988 and is a producer of scanning probe microscopes.
PRODUCTSThe company produces the CSPM5500 Scanning Probe Microscope. They sell most of their instruments to the academic community in China.
NUMBER OF EMPLOYEES1-10
ESTIMATED ANNUAL REVENUES $1 million-$5 million
ADDRESSBeing Nano-Instruments LTDSanCaiTang,ZhongGuangCun, Beijing 100080ChinaTel: +86 10 5166 2332
WEBwww.spm.com.cn
PROFILES

MIC
ROSC
OPE
S • O
CTO
BER
201
3
50
Bruker CorporationDESCRIPTIONThe company are organized into four operating segments: the Bruker BioSpin group, the Bruker CALID group, the Bruker MAT group, and Bruker Energy & Supercon Technologies division. The Bruker BioSpin group is in the business of designing, manufacturing and distributing enabling life science tools based on magnetic resonance technology. The Bruker CALID group combines the Bruker Daltonics, Bruker Chemical and Applied Markets (CAM), Bruker Detection and Bruker Optics divisions and is in the busi-ness of designing, manufacturing, and distributing mass spectrometry and chromatography instruments and solutions for life sciences, including proteomics, metabolomics, and clinical research applications. Our mass spectrometry and chromatography instruments also provide solutions for applied markets that include food safety, environmental analysis and petrochemical analysis. Bruker CALID also designs, manufactures, and distributes various analytical instruments for CBRNE detection and research, as well as analytical, research and process analysis instruments and solutions based on infrared and Raman molecular spectroscopy technologies. The Bruker MAT group combines the Bruker AXS, Bruker Nano Surfaces, Bruker Nano Analytics and Bruker Elemental divisions and is in the business of manufacturing and distributing advanced analytical X-ray technologies and spark-optical emission spectroscopy, atomic force microscopy and stylus and optical metrology instrumentation used in non-destructive molecular, materials and elemental analysis.
PRODUCTS
Product Description Applications
Dimension FastScan® This tip-scanning system pro-vides measurements on both large and small size samples in air or fluids. With the FastScan you can achieve immediate atomic force microscopy images with the expected high resolu-tion of a high-performance AFM, all in a single system.
- Material and Polymer Science- Biological Research- High Throughput- Industrial Applications
MultiMode 8 PeakForce QNM®, which analyzes each tip-sample interaction to extract nanomechanical proper-ties including modulus, adhe-sion, deformation, and dissipa-tion. This can be combined with the new PeakForce TUNA™ mode to perform conductivity map-ping on even the most delicate samples.
- Material and Polymer Science- Quantitative NanoMechanical and NanoElectrical- Biological Research- Electrochemistry
PROFILES

MIC
ROSC
OPE
S • O
CTO
BER
201
3
51
PROFILES
Dimension Icon - Material Mapping- Electrical Characterization- Nanomanipulation- Heating and Cooling
BioScope Catalyst™ - Mechanobiology and Cell Mechanics- Single Molecules and Mem-branes- Live Cells and Tissues- Biomaterials and Biotechnology
Dimension FastScan Bio™ - Molecular Biology- Membrane Dynamics- Cell Dynamics- Biomaterials and Biotechnology
NUMBER OF EMPLOYEES6, 700 (Total)
ESTIMATED ANNUAL REVENUES Scientific Instruments: $1,354 millionBruker Nano Surfaces: $184 millionSPM: $100 million-$150 million
ADDRESSBruker Nano GmbHKaiserstr. 100 52134 HerzogenrathGermanyT: +49 240756420
WEBwww.bruker-axs.de/atomicforcemicroscopy.html

MIC
ROSC
OPE
S • O
CTO
BER
201
3
52
Carl Zeiss SMT DESCRIPTIONCarl Zeiss SMT is a leading global provider of electron- and ion-beam imaging and analysis solutions.
PRODUCTS
Product Description Applications
EVO High Definition SEM for Work-flow Automation
Natural Resources· Study the morphology and investigate the mineral-ogy of natural resources· Analyze the chemical composition of minerals and rocksManufacturing· Perform routine analysis to ensure manufactured components meet quality and durability require-ments· Conduct automated analysis of particles to meet ISO 16232 standardAnalyze component defects and particle wearForensics· Analyze criminal evidence including gunshot resi-due, coin forgery and toxicologyMaterials Research· Investigate and develop materials· Analyze material properties such as corrosion, tem-perature resistance and coating performanceLife Sciences
Merlin Field Emission Scanning Electron Microscope (FE-SEM) platform MERLIN. Customers can choose between the systems MERLIN Compact, MERLIN VP Compact and MERLIN and configure them individually.
· Electronics and Materials and Nanomaterials Re-search· Life Sciences
SIGMA FE-SEM for nanoscale analytics · Electronics and Materials and Nanomaterials Re-search· Life Sciences
PROFILES
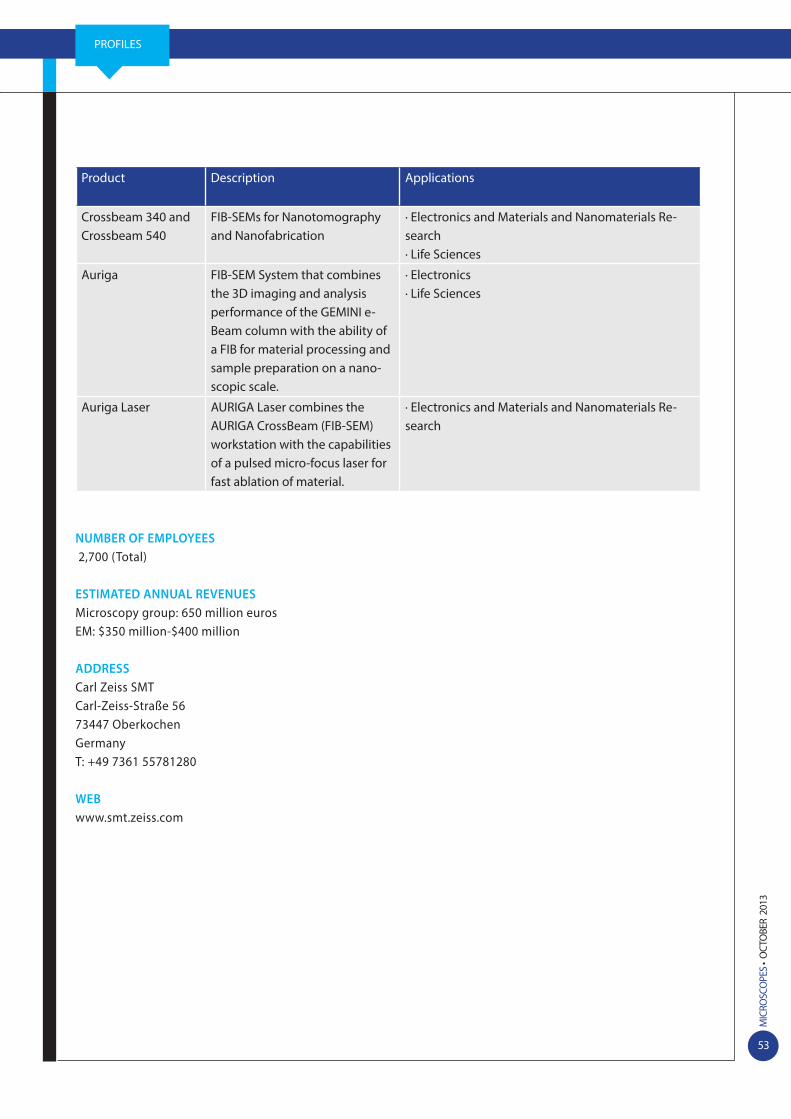
MIC
ROSC
OPE
S • O
CTO
BER
201
3
53
Product Description Applications
Crossbeam 340 and Crossbeam 540
FIB-SEMs for Nanotomography and Nanofabrication
· Electronics and Materials and Nanomaterials Re-search· Life Sciences
Auriga FIB-SEM System that combines the 3D imaging and analysis performance of the GEMINI e-Beam column with the ability of a FIB for material processing and sample preparation on a nano-scopic scale.
· Electronics· Life Sciences
Auriga Laser AURIGA Laser combines the AURIGA CrossBeam (FIB-SEM) workstation with the capabilities of a pulsed micro-focus laser for fast ablation of material.
· Electronics and Materials and Nanomaterials Re-search
NUMBER OF EMPLOYEES 2,700 (Total)
ESTIMATED ANNUAL REVENUES Microscopy group: 650 million eurosEM: $350 million-$400 million
ADDRESSCarl Zeiss SMTCarl-Zeiss-Straße 5673447 OberkochenGermanyT: +49 7361 55781280
WEBwww.smt.zeiss.com
PROFILES
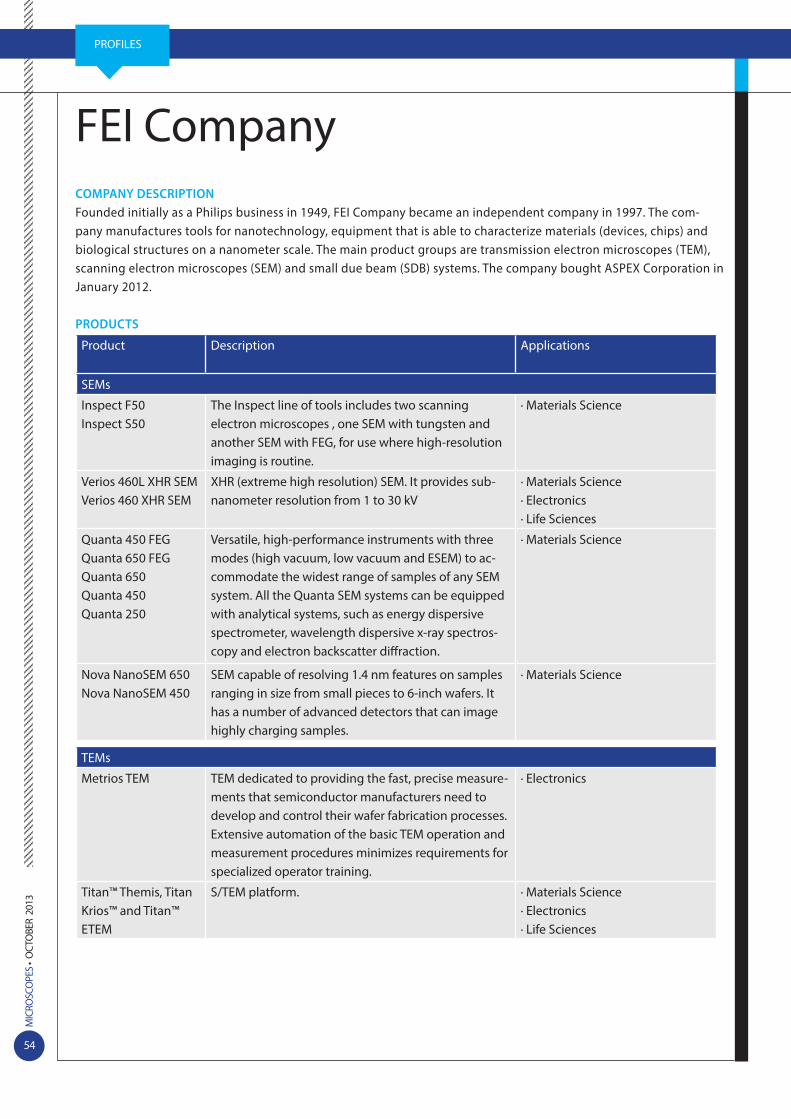
MIC
ROSC
OPE
S • O
CTO
BER
201
3
54
FEI CompanyCOMPANY DESCRIPTIONFounded initially as a Philips business in 1949, FEI Company became an independent company in 1997. The com-pany manufactures tools for nanotechnology, equipment that is able to characterize materials (devices, chips) and biological structures on a nanometer scale. The main product groups are transmission electron microscopes (TEM), scanning electron microscopes (SEM) and small due beam (SDB) systems. The company bought ASPEX Corporation in January 2012.
PRODUCTS
Product Description Applications
SEMs
Inspect F50Inspect S50
The Inspect line of tools includes two scanning electron microscopes , one SEM with tungsten and another SEM with FEG, for use where high-resolution imaging is routine.
· Materials Science
Verios 460L XHR SEMVerios 460 XHR SEM
XHR (extreme high resolution) SEM. It provides sub-nanometer resolution from 1 to 30 kV
· Materials Science· Electronics· Life Sciences
Quanta 450 FEGQuanta 650 FEGQuanta 650Quanta 450Quanta 250
Versatile, high-performance instruments with three modes (high vacuum, low vacuum and ESEM) to ac-commodate the widest range of samples of any SEM system. All the Quanta SEM systems can be equipped with analytical systems, such as energy dispersive spectrometer, wavelength dispersive x-ray spectros-copy and electron backscatter diffraction.
· Materials Science
Nova NanoSEM 650Nova NanoSEM 450
SEM capable of resolving 1.4 nm features on samples ranging in size from small pieces to 6-inch wafers. It has a number of advanced detectors that can image highly charging samples.
· Materials Science
TEMs
Metrios TEM TEM dedicated to providing the fast, precise measure-ments that semiconductor manufacturers need to develop and control their wafer fabrication processes. Extensive automation of the basic TEM operation and measurement procedures minimizes requirements for specialized operator training.
· Electronics
Titan™ Themis, Titan Krios™ and Titan™ ETEM
S/TEM platform. · Materials Science· Electronics· Life Sciences
PROFILES

MIC
ROSC
OPE
S • O
CTO
BER
201
3
55
DualBeam
Scios Ultra-high-resolution analytical DualBeam™ system that delivers outstanding 2D and 3D performance for a broad range of samples, including magnetic mate-rial.
· Materials Science
CLM-3D 300mm FGull wafer autoloading system for automated, digital 3D analysis of semiconductor devices in a clean room environment.
· Electronics
Versa 3D DualBeam Versa 3D offers state-of-the-art imaging and analytical performance to deliver a greater range of 3D data.
· Materials Science· Electronics
Certus-3D The Certus-3D shortens time to market by enabling critical engineering and development faster than other electron and/or ion-beam technologies. With its TEMLink™ 100 option, the Certus-3D also can auto-mate TEM sample preparation for higher-resolution imaging and analysis.
· Electronics
NanoLab™ Dual-Beam
The Helios NanoLab 660 DualBeam system provides one of the highest imaging resolution and contrast SEMs, combined with one of the fastest and most precise FIB milling performances of any commercially-available focused ion beam/scanning electron micro-scope (FIB/SEM) system.
· Materials Science· Electronics
EMPLOYEES2,518
ESTIMATED ANNUAL REVENUES$890 millionElectron Microscopes: $500 million-$550 million
ADDRESSFEI Company5350 NE Dawson Creek DriveHillsboroOR 97124-5793USAT: +1 5037267500
WEBwww.feico.com
PROFILES

MIC
ROSC
OPE
S • O
CTO
BER
201
3
56
Hitachi High-Technologies COMPANY DESCRIPTIONHitachi High-Technologies was formed in 2001 through a merger of three The Instruments Group; the Semiconductor Manufacturing Equipments Group of Hitachi, Ltd.; and Nissei Sangyo Co., Ltd. Further mergers added the chip mount-er business in 2003 and the flat panel and hard disk related manufacturing systems experience of Hitachi Electronics Engineering Co., Ltd. in 2004. Hitachi High-Technologies now aims to be the global leader in high-tech solutions in its four business segments: electronic device systems, life sciences, information systems and electronic components, and advanced industrial products.
PRODUCTS
Product Description Applications
SEMs
SU3500 · Large sample up to 300mm in diameter· Observable area up to 203mm in diameter· Observation and EDS analysis on a sample up to 110mm tall· Versatile port layout for various analytical applica-tions
· Life Sciences
S-3700N · Analytical SEM for Studying Large, Heavy & Tall Samples.
· Materials Science
S-3400N · Revolutionary automatic axis-alignment functions(Auto Beam Setting, Auto Axial Alignment, etc.)· Even better resolution of 10nm at 3kV
· Materials Science· Electronics
SU1510 Medium size chamber Variable Pressure SEM with the same performance and features as the S-3400N and S-3700N model.
· Materials Science· Electronics
SU9000 Designed for high resolution imaging, even for beam sensitive specimens and advanced semiconductor de-vices that require stable observation at magnifications up to 3,000,000 times.
· Electronics
SU8200 Series Novel CFE gun employs a Hitachi patented “Mild flashing” technique and a new vacuum system which greatly minimizes gas molecule deposition on the emitter tip.
· Electronics
SU8000 Family Ultra high resolution imaging technology (1.3nm/1.0kV), wide ranges of signal detecting system, and user-friendly operationality.
· Materials Science
SU-70 SEM incorporating field proven Hitachi’s semi-in-lens technology for ultra high resolution, and Schottky electron gun.
· Materials Science· Electronics
SU6600 Advanced Variable Pressure(VP) technology and allows accommodation of EDX,WDX and EBSP system for versatile material analysis.
· Materials Science· Electronics
PROFILES

MIC
ROSC
OPE
S • O
CTO
BER
201
3
57
TEMs
HF-3300 Combination of high reputation Hitachi cold field emission electron source and 300 kV accelerating voltage realizes both ultrahigh resolution imaging and high sensitivity analysis.
· Materials Science· Electronics
H-9500 Atomic resolution 300kV transmission electron micro-scope
· Materials Science· Electronics
HD-2700 Scanning transmission microscope (STEM) HD-2700, equipped with spherical aberration
· Materials Science· Electronics
HT7700 Transmission Electron Microscope developed for both biological and nano-materials.
· Materials Science· Electronics· Life Sciences
EMPLOYEES10,436 (Total)
ESTIMATED ANNUAL REVENUES$7,858 billion (Science and medical systems $1.78 billion)Electron Microscopes: $675 million-$750 million
ADDRESSHitachi High-Technologies Europe GmbHNanotechnology Equipment Dept. Europark Fichtenhain A1247807 KrefeldGermanyT: +49 2151 64350
WEBwww.hitachi-hitec.com
PROFILES

MIC
ROSC
OPE
S • O
CTO
BER
201
3
58
Hitachi High-Tech Science Cor-poration COMPANY DESCRIPTIONSII NanoTechnology became a wholly owned subsidiary of Hitachi High Technology Corporation on Janu-ary 1st, 2013, which changed its name to “Hitachi High-Tech Science Corporation”.
PRODUCTS• AFM5400L: High precision Stage type AFM • AFM5300E: Environment control type SPM• AFM5200S: Small general-purpose multi-function unit that is able to easily perform high resolution observation in air and liquids. • AFM5100N: General purpose small SPM equipped with high resolution sensor built-in lever for manual operation.
NUMBER OF EMPLOYEES10,436 (Total)
ESTIMATED ANNUAL REVENUES Scientific & Medical Systems: $1, 295 millionSPM: $75 million-$100 million
ADDRESSHitachi High-Tech Science Corporation24-14, Nishi-Shimbashi 1-chome, Minato-ku, Tokyo105-0003Japan Tel: 03-3504-3966
WEBwww.hitachi-hitec-science.com/en/
PROFILES

MIC
ROSC
OPE
S • O
CTO
BER
201
3
59
JEOL Ltd.COMPANY DESCRIPTIONJEOL is a leading manufacturer of electron microscopes and other scientific instruments. Its headquarters are in To-kyo, Japan, with 25 subsidiaries and two associated companies. JEOL Ltd. has four business segments. Electron Optics manufactures scanning electron microscopes, transmission electron microscopes and scanning probe microscopes, along with related equipment. The Analytical Instruments section’s products include mass spectrometers, nuclear magnetic resonance and electron spin resonance equipment. The Industrial Equipment segment covers a range of equipment particularly targeted at the semiconductor industry, such as electron beam sources, wafer process moni-tors, and plasma gun series. Finally, the Medical Equipment segment manufactures automatic analysis devices, clinical diagnostic systems and amino acid analyzers.
PRODUCTS
Product Description Applications
TEMs
JEM-1000 Ultra-High Voltage Electron Microscope
JEM-1000 is the ultra-high voltage (accelerating voltage: 1,000 kV) transmission electron microscope among those used in universities and research insti-tutes worldwide.
· Materials Science· Life Sciences
JEM-3100F 300 kV Field Emission Elec-tron Microscope
EM-3100F, a high-resolution, analytical electron micro-scope, can achieve sub-nanometer resolution imaging of structure and nanometer scale analysis of materials.
· Materials Science
JEM-3200FS Field Emission Energy Filter Electron Micro-scope
· Revolutionary automatic axis-alignment functions(Auto Beam Setting, Auto Axial Alignment, etc.)· Even better resolution of 10nm at 3kV
· Materials Science· Life Sciences
JEM-ARM200F Atomic Resolution Analytical Electron Microscope
JEM-ARM200F is an Atomic Resolution Analytical Electron Microscope, which boasts the world’s highest level STEM-HAADF resolution of 78 pm with a STEM Cs corrector incorporated as standard.
· Materials Science· Electronics
JEM-2200FS Field Emission Electron Microscope
JEM-2200FS, is equipped with a 200kV field emission gun (FEG) and the in-column energy filter (Omega filter) that allows a zero-loss image, where inelastic electrons is eliminated, resulting in clear images with high contrast.
· Materials Science· Electronics· Life Sciences
JEM-2100F Field Emission Electron Microscope
JEM-2100F is a multipurpose, 200 kV FE (Field Emis-sion) analytical electron microscope.
· Materials Science
JEM-2100 Electron Microscope
The JEM-2100 is a multipurpose, 200 kV analytical electron microscope.
· Materials Science· Life Sciences
JEM-2800 High Throughput Electron Microscope
JEM-2800 is a versatile TEM/STEM that offers superior usability, while simultaneously achieving high-resolu-tion, high throughput and highly sensitive analysis.
· Materials Science· Electronics· Life Sciences
PROFILES

MIC
ROSC
OPE
S • O
CTO
BER
201
3
60
SEMs
JSM-7800F Schottky Field Emission Scanning Electron Microscope
The newly-developed Super Hybrid Lens (SHL) is used to achieve the next-generation high-resolution SEM, without sacrificing operability. The adoption of the Schottky type electron gun delivers stable analysis with large probe current.
· Materials Science· Electronics
JSM-7610F Schottky Field Emission Scanning Electron Microscope
JSM-7610F is an ultra high resolution Schottky Field Emission Scanning Electron Microscope which has semi-in-lens objective lens.
· Materials Science· Electronics
JSM-7500F Field Emission Scanning Electron Microscope
A field emission SEM with a semi-in-lens and equipped with a Gentle Beam to deliver high-resolu-tion.
· Electronics
JSM-7100F Schottky Field Emission Scanning Electron Microscope
Schottky type SEM with a highly-versatile out-lens and High Power Optics.
· Materials Science· Electronics
JSM-6510 Series Scanning Electron Microscope
General-purpose, thermal type SE. · Materials Science
JASM-6200 Clair-Scope Atmospheric Pressure Scanning Electron Microscope
ClairScope is an instrument to observe specimens by using an Atmospheric Scanning Electron Microscope (ASEM) and an optical microscope.
· Materials Science
JSM-6010LA A multifunctional general-purpose SEM with a new intuitive user interface making use of an operation screen and touch panel.
· Materials Science· Electronics
EMPLOYEES2,742
ESTIMATED ANNUAL REVENUES2012: $818 million (Scientific and measurement instruments: $521 million)Electron Microscopes $250 million-$350 million
ADDRESSJEOL Ltd.1-2, Musashino 3-chome AkishimaTokyo 196-8558JapanT: +81 425431111
WEBwww.jeol.com
PROFILES
n n

MIC
ROSC
OPE
S • O
CTO
BER
201
3
61
JPK InstrumentsCOMPANY DESCRIPTIONJPK Instruments AG is a manufacturer of nano-analytic instruments for life sciences and soft matter ap-plications. Up to 80% of the company’s turnover is generated by sales of AFM instruments and consum-ables, while the optical tweezer line, contributes 20% to revenues. The optical tweezer technology was part of the 2006 acquisition of LPI Lightpower Instruments, whose business has been fully integrated into JPK. Approximately 75% of JPK’s products go outside the German market.
PRODUCTSNanoWizard® 3 NanoOptics AFM Comprehensive solution for advanced experiments combining AFM and optical spectroscopy such as TERS, Aperture SNOM and sSNOM, confocal microscopy and nano manipulation in optical fields.
NanoWizard® 3 NanoScience AFM For applications in materials and polymer science reaching from single molecule experiments and elec-trochemistry to organic electronics.
NanoWizard® 3 BioScience AFM For applications in Soft Matter and Life Science research reaching from biophysics and cell biology to surface science and biomedicine. BioMAT™ Workstation For opaque samples combining upright optical microscopy with AFM for surface science and life science. NanoWizard® II AFM The predecessor AFM that set new standards for soft matter and life science atomic force microscopy.
NUMBER OF EMPLOYEES70
ESTIMATED ANNUAL REVENUES $10 million-$15 million
ADDRESSJPK Instruments AGBouchéstrasse 12Haus 2, Aufgang C12435 BerlinGermanyTel: +49 30533112070
WEBwww.jpk.com
PROFILES
n n

MIC
ROSC
OPE
S • O
CTO
BER
201
3
62
Nanonic Imaging, Ltd.COMPANY DESCRIPTIONManufacturer of SPM, AFM, NSOM, SNOM and Confocal systems and associated products.
PRODUCTS• MultiView 2000™: ultra-sensitive scanned probe microscope with a variety of modes of AFM/SPM/NSOM imaging.• Academia™: affordable AFM system with all the functionality of a research AFM microscope which can function effectively for teaching laboratories.• Hydra™ Bio-SPM: Hydra’sTM open design can be integrated into any microscope (unlike other BioAFMs which are limited by geometric or optical obstruction), including advanced concepts in optical micros-copy such as 4pi configurations and many non-linear optical protocols.
NUMBER OF EMPLOYEES50-75
ESTIMATED ANNUAL REVENUES $5 million-$10 million
ADDRESSNanonic Imaging, Ltd.Manhat Technology Park, MalchaJerusalem 91487IsraelT: +972 26789573
WEBwww.nanonics.co.il
PROFILES

MIC
ROSC
OPE
S • O
CTO
BER
201
3
63
NanoscanCOMPANY DESCRIPTIONMain focus of NanoScan AG is on research and development of high-resolution and versatile magnetic and non-contact scanning force microscopes. : ION-TOF GmbH is the main shareholder in the company.
PRODUCTSAtomic Force Microscopes (AFM) for high-resolution magnetic and non-contact imaging:- The high-resolution Magnetic Force Microscope (hr-MFM) operates with low-moment magnetic tips in high-vacuum and guarantees 10 nm magnetic resolution and minimum disturbance of magnetic pat-terns. It offers a large sample stage with 100 nm positioning repeatability.- The PPMS®-AFM fits into the PPMS® (Physical Properties Measurement System) of Quantum Design and offers 15 nm resolution for magnetic imaging.
NUMBER OF EMPLOYEES1-5
ESTIMATED ANNUAL REVENUES $1 million-$5 million
ADDRESSNanoScan AGUeberlandstrasse 129CH-8600 DuebendorfSwitzerlandTel: +41 43 931 02 40
WEBwww.nanoscan.ch
PROFILES

MIC
ROSC
OPE
S • O
CTO
BER
201
3
64
Nanosurf AGCOMPANY DESCRIPTIONNanosurf, founded in 1997, has developed the easyScan STM (scanning tunneling microscope) system, the easyScan AFM (atomic force microscope) system and the easyScan DFM (dynamic force mode) sys-tem. These microscopes aid in surface characterization, study of thin films and defect analysis. The com-pany has also developed a sensor controller and digital FM detector unit that can work as stand-alone tools or partner with Nanosurf microscopes to help users achieve target resonance frequency. Key users of Nanosurf ’s technology are research labs and manufacturing quality control groups. The company has over 2400 Installations worldwide.
PRODUCTSNanosurf NaniteAFM: Mountable Atomic Force Microscope for Industry• Reliable and fully automated AFM surface inspections• High-resolution 3D surface data dramatically improve the quality of QC• A 3-point mount and its compact size make for easy integration into other analysis systems
NUMBER OF EMPLOYEES50-75
ESTIMATED ANNUAL REVENUES $5 million-$10 million
ADDRESSNanosurf AGGrammetstrasse 14 4410 LiestalSwitzerlandT: +41 619275646
WEBwww.nanosurf.com
PROFILES

MIC
ROSC
OPE
S • O
CTO
BER
201
3
65
Nanotec Electronica COMPANY DESCRIPTIONNanotec Electronica develops Scanning Probe Microscopes (SPM). The company also designs and manu-factures control systems for Scanning Probe Microscopes.
PRODUCTSCervantes FullMode AFM SystemNanotec´s Cervantes FullMode Atomic Force Microscope (AFM) in its several configurations allows not only imaging samples with atomic precision but also the study of magnetic, electronic and mechanical properties at the nanoscale. Nanotec Electronica also provides Dulcinea Control Systems, with an open and modular design that facili-tates interfacing with any other standard AFM/SNOM/STM system available in the market.
NUMBER OF EMPLOYEES10-20
ESTIMATED ANNUAL REVENUES $1 million-$5 million
ADDRESSNanotec ElectronicaCentro Empresarial Euronova 3, Ronda de Poniente 2Tres Cantos (Madrid)E28760SpainTel: +34 (91) 8043347
WEBwww.nanotec.es
PROFILES

MIC
ROSC
OPE
S • O
CTO
BER
201
3
66
NT-MDT Co.COMPANY DESCRIPTIONNT-MDT produces different equipment lines: Scanning Probe Nanolaboratories, Scanning Probe Micro-scopes, SPM accessories, modular nanofactories. The company was founded in 1989.
PRODUCTS• NTEGRA Spectra: integrates SPM with Raman spectrometry and laser confocal microscopy.• SPECTRUM: Automated AFM-Raman-SNOM system.• LIFE: Fully automated AFM integrated with Inverted Light Microscope for biological research.• NTEGRA Prima: Modular SPM (AFM, STM) system.• NTEGRA Aura: AFM for studies in the conditions of controlled environment, low vacuum, external mag-netic fields.• NEXT: Automated monoblock AFM/STM measurement system with a built-in video microscope.
The company also manufactures a benchtop AFM called OPEN.
NUMBER OF EMPLOYEES350 plus
ESTIMATED ANNUAL REVENUES $75 million-$100 million (Approximately $60 million in 2010)
ADDRESSNT-MDT Co. Building 100ZelenogradMoscow 124482RussiaT: +7 4997357777
WEBwww.ntmdt.ru
PROFILES

MIC
ROSC
OPE
S • O
CTO
BER
201
3
67
Oxford InstrumentsCOMPANY DESCRIPTIONThe company bought Asylum Research in December 2012. The company was a leading producer of SPMs and was acquired from its management for an initial debt free, cash free consideration of US$32.0 million with a deferred element of up to US$48.0 million payable over three years dependent on its performance over that period. Asylum Research’s high performance AFM product line include the Cypher™ and MFP-3D™ Families. In June 2011, the company bought Omicron NanoTechnology GmbH for a cash consideration of €32.4 million. The company was also a manufacturer of SPM systems.
PRODUCTSOmicron Nanoscience• LT STM: The Omicron LT STM is the first commercial low temperature UHV SPM with proven and guar-anteed atomic resolution in STM and QPlus AFM mode at 5 K, now with more than 130 units delivered around the world.• Cryogenic STM & SFM: The Cryogenic STM & SFM UHV system is designed for low temperature 3He and 4He SPM operation in high magnetic fields of up to 12 T and allows for SPM operation from 2.5 K up to 300 K.• VT SPM: The Variable Temperature UHV SPM (VT SPM) offers a heating cooling concept for SPM in a tem-perature range from 25 K to 1500 K and many other features.• Fermi SPM: The Fermi SPM is a compact solution for UHV SPM in a temperature range from 30 K to 40 0K. It has been developed to close the gap between the established Omicron LT STM for ultimate spectros-copy performance and the flexible concept of the Omicron VT SPM series.• UHV AFM/STM: combines UHV STM and Beam Deflection AFM at room temperature.• UHV STM 1: with integrated eddy current damping was the first commercial UHV STM.
Asylum Research The Cypher AFM family, the highest resolution fast scanning AFMs, now include environmental control. Cypher provides low drift, closed-loop atomic resolution for the most accurate images and measure-ments, point defect atomic resolution, >20X faster AC imaging with small cantilevers, automated laser and photodetector alignment for easy setup, integrated thermal, acoustic and vibration control, and supports all major AFM/SPM scanning modes/capabilities. Four configurations now comprise the MFP-3D family. The MFP-3D Origin™, the most affordable member, offers performance and full upgrade poten-tial. The full MFP-3D provides performance with the maximum versatility of a wide range of modes and accessories. The MFP-3D-BIO™ is the only full capability AFM integrated with commercial inverted optical microscopes for advanced bioscience research.
NUMBER OF EMPLOYEES75-100
ESTIMATED ANNUAL REVENUES Nanotechnology Tools: $80 millionSPM: $25 million-$35 million
ADDRESSOxford Instruments plcTubney WoodsAbingdon, Oxfordshire
PROFILES

MIC
ROSC
OPE
S • O
CTO
BER
201
3
68
Oxford InstrumentsOX13 5QXUnited KingdomT: +44 (0)1865 393200
WEBwww.asylumresearch.comwww.oxford-instruments.com
PROFILES

MIC
ROSC
OPE
S • O
CTO
BER
201
3
69
Park SystemsCOMPANY DESCRIPTIONPark Systems is an industry player in AFM/SPM technology. Park Systems provides advanced AFM/SPM/NSOM products for industry and research. Park Systems, Inc. is headquartered in Santa Clara, California with its global manufacturing, and R&D headquarters in Korea. Park’s products are sold and supported worldwide with regional headquarters in the US, Korea, Japan, and Singapore, and distribution partners throughout Europe, Asia, and America.
PRODUCTSResearch AFM• Park NX20• Park NX10 • Park XE7 • XE-Bio• XE-150• XE-120• XE-100
Industrial AFM• Park HDM Series • XE-3DM• XE-Wafer• XE-PTR• XE-LCD
NUMBER OF EMPLOYEES120
ESTIMATED ANNUAL REVENUES $18 million-$20 million ($15 million in 2010)
ADDRESSPark SystemsKANC 4F, Iui-Dong, 906-10Suwon 443-270KoreaT: +82 315466800
WEBwww.parkafm.com
PROFILES

MIC
ROSC
OPE
S • O
CTO
BER
201
3
70
RHK TechnologyCOMPANY DESCRIPTIONThe company is a producer of SPMS.
PRODUCTSThe company produces the Beetle VT AFM/STM. The VT Beetle microscopes offer STM and beam-deflec-tion Contact and NC-AFM, and sample temperatures from 25 K to >1500 K on the sample stage.
NUMBER OF EMPLOYEES20-30
ESTIMATED ANNUAL REVENUES $5 million-$7.5 million
ADDRESSRHK Technology1050 East Maple RoadTroy, MI 48083 USATel: +1 248-577-5426
WEBhttp://rhk-tech.com/products/scanning-probe-microscopes
PROFILES

MIC
ROSC
OPE
S • O
CTO
BER
201
3
71
Shimadzu CorporationCOMPANY DESCRIPTIONShimadzu Corporation is a manufacturer of precision instruments, measuring instruments and medical equipment, based in Kyoto, Japan. Revenues in their analytical equipment division were $1.7billion in 2010.
PRODUCTSThe company produces the SPM-9700 scanning probe microscope.
NUMBER OF EMPLOYEES10,395 (Total)
ESTIMATED ANNUAL REVENUES Analytical and measuring instruments: $1. 4 billionSPM: $10 million-$20 million
ADDRESSShimadzu Corporation1 Nishinokyo-Kuwabaracho Nakagyoku Kyoto CityJapanT: +81758231128
WEBwww.shimadzu.com
PROFILES
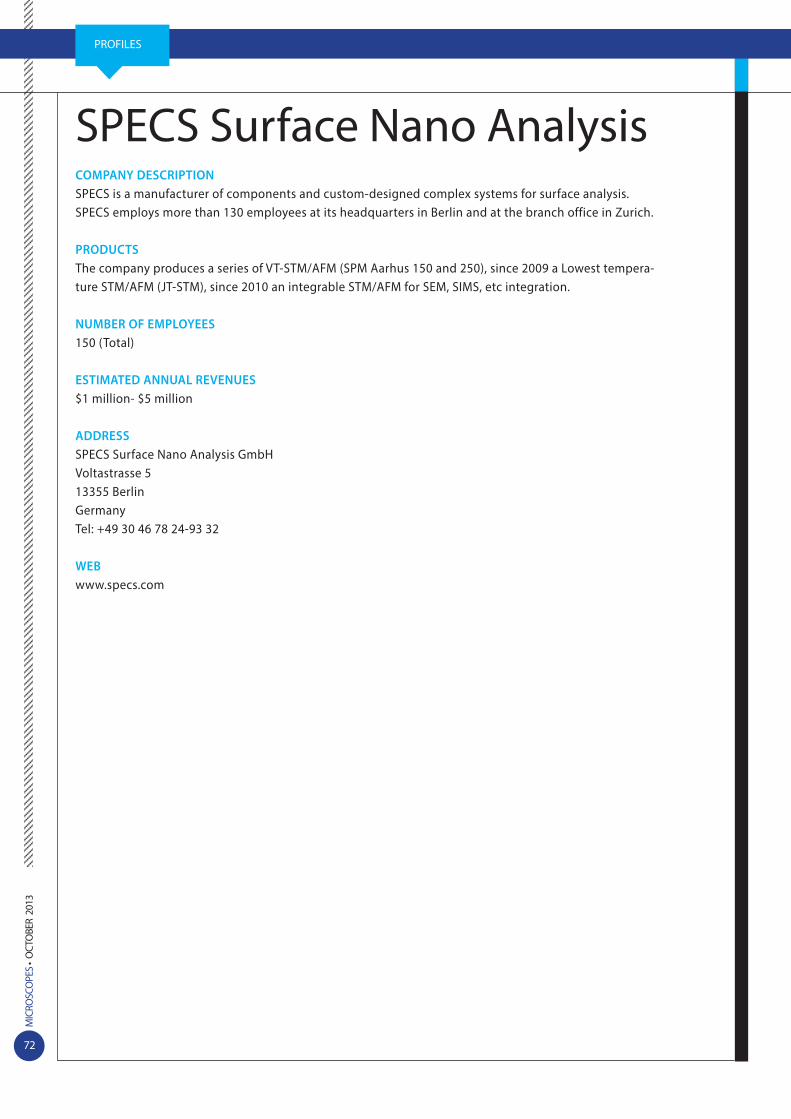
MIC
ROSC
OPE
S • O
CTO
BER
201
3
72
SPECS Surface Nano Analysis COMPANY DESCRIPTIONSPECS is a manufacturer of components and custom-designed complex systems for surface analysis. SPECS employs more than 130 employees at its headquarters in Berlin and at the branch office in Zurich.
PRODUCTSThe company produces a series of VT-STM/AFM (SPM Aarhus 150 and 250), since 2009 a Lowest tempera-ture STM/AFM (JT-STM), since 2010 an integrable STM/AFM for SEM, SIMS, etc integration.
NUMBER OF EMPLOYEES150 (Total)
ESTIMATED ANNUAL REVENUES $1 million- $5 million
ADDRESSSPECS Surface Nano Analysis GmbHVoltastrasse 513355 BerlinGermanyTel: +49 30 46 78 24-93 32
WEBwww.specs.com
PROFILES

MIC
ROSC
OPE
S • O
CTO
BER
201
3
73
SPS-CreaTec GmbHCOMPANY DESCRIPTIONSPS-CREATEC GmbH is a subsidary of Createc Fischer & Co. GmbH. It was established in 2003 to develop, build and service scanning probe microscopes.
PRODUCTSAbstract LT-STMThe LT-STM is specially designed for working at atomic scale at low temperature (i.e. to perform atomic / molecular manipulation or local spectroscopy). The STM has a modified Besocke beetle design which ensures its high stability (dz<1pm) and only a small drift.
NUMBER OF EMPLOYEES30-40 (Total for Createc Fischer & Co. GmbH.)
ESTIMATED ANNUAL REVENUES $5 million -$10 million
ADDRESSSPS-CreaTec GmbHMagnusstr. 1112489 BerlinGermanyTel: +49 (30) 6392-3650
WEBwww.sps-createc.com
PROFILES

MIC
ROSC
OPE
S • O
CTO
BER
201
3
74
Techscience Ltd.COMPANY DESCRIPTIONTechscience provide Advanced Surface evaluation & Analysis instruments.
PRODUCTSThe company produces the compact NaioAFM/STM and the easyscan FlexAFM.
NUMBER OF EMPLOYEES10
ESTIMATED ANNUAL REVENUES $1 million -$5 million
ADDRESS2-64 Miyamotocho, KoshigayaSaitama 343-0806JapanTel: +81-48-964-3111
WEBwww.techsc.co.jp
PROFILES

MIC
ROSC
OPE
S • O
CTO
BER
201
3
75
Tescan S.A. COMPANY DESCRIPTIONThe company manufactures scanning electron microscopes; supplementary accessories for SEMs; light opti-cal microscopy accessories and image processing; special vacuum chambers and custom systems; detection systems; scientific hardware and software development.
PRODUCTS• VEGA3 SB: A fully PC controlled SEM with conventional tungsten heated cathode intended both for high vacuum as well as for low vacuum operations.• VEGA3 SB - EasyProbe: a compact scanning electron microscope (SEM) fully integrated with a selected energy dispersive X-ray microanalyser (EDX). • VEGA3 LM: A fully PC controlled SEM with conventional tungsten heated cathode intended for both - for high vacuum as well as for low vacuum operations.• VEGA3 XM: A fully PC controlled SEM with conventional tungsten heated cathode intended both for high vacuum as well as for low vacuum operations.• MIRA3 LM: A fully PC controlled FE SEM intended for both – for high vacuum as well as for low vacuum opera-tions. • MIRA3 XM: A fully PC controlled FE-SEM – for high vacuum as well as for low vacuum operations. • VELA3 XM: A fully PC controlled SEM with conventional tungsten heated cathode in combination with gallium Focused Ion Beam (FIB) column and optionally with Gas Injection System (GIS).• VELA3 GM: A fully PC controlled SEM with conventional tungsten heated cathode in combination with gallium Focused Ion Beam (FIB) column and optionally with Gas Injection System (GIS).• LYRA3 XM: A fully PC controlled SEM with Schottky field emission cathode in combination with gallium Fo-cused Ion Beam (FIB) column and optionally with Gas Injection System (GIS).• LYRA3 GM: A fully PC controlled SEM with Schottky field emission cathode in combination with gallium Fo-cused Ion Beam (FIB) column and optionally with Gas Injection System (GIS).• InduSEM: a versatile scanning electron microscope for various applications. It is based on a variable pressure SEMwith an extra-large specimen chamber and a robust motorized manipulator.• TIMA - Mineral Analyzer: based either on MIRA Schottky field emission or VEGA thermal emission scanning electron microscope. Special VEGA column design with permanent gun high-vacuum and the isolation valve significantly increases emission stability and tungsten filament lifetime. The system is available in high-vacuum version as the standard, low-vacuum version as an option.• FERA3 XM: A fully PC controlled SEM with Schottky field emission cathode in combination with Xe Plasma Focused Ion Beam (i-FIB) column and optionally with Gas Injection System (GIS).• FERA3 GM: A fully PC controlled SEM with Schottky field emission cathode in combination with Xe Plasma Focused Ion Beam (i-FIB) column and optionally with Gas Injection System (GIS).• MAIA3: analytical scanning electron microscope which demonstrates ultra-high resolution of 1 nm at 15 kV.
EMPLOYEES250
ESTIMATED ANNUAL REVENUES$50 million-$60 million
ADDRESSTescan S.A.Libusina tr. 21 623 00 Brno
PROFILES

MIC
ROSC
OPE
S • O
CTO
BER
201
3
76
Czech RepublicT: +420 547130411
WEBwww.tescan.com
PROFILES

MIC
ROSC
OPE
S • O
CTO
BER
201
3
77
Unisoku Co., Ltd.COMPANY DESCRIPTIONThe company manufactures scanning electron microscopes; supplementary accessories for SEMs; light optical microscopy accessories and image processing; special vacuum chambers and custom systems; detection systems; scientific hardware and software development..
PRODUCTS
Category Product
UHV STM / AFM UHV Room Temperature STM System USM-1000Light angle excitation by LASER beam is possible to sample. Optical access or light emis-sion detection are possible. Sample specimen can be heat up to 400 degrees.
UHV STM / AFM Ultrahigh Vacuum and Ultra Low Temperature Scanning SPM USM-1200USM-1200 series makes it possible to observe the sample surface in UHV at ultra-low tem-perature by STM and/or AFM.
UHV ULT High Mag-netic Fields SPM
UHV, ULT and High Magnetic Field SPM USM-1300It can observe the sample surface at low temperature in UHV by STM or AFM and analyze surface electronic properties using various methods.
UHV ULT SPM UHV Ultra Low Temperature SPM system USM-1400System of USM-1400 series adopted newly designed cryostat of which liquid helium reser-voir is built under the SPM stage.
LT 4 Probe SystemLow Temperature 4-probe
System USM-1400-4PThis system was developed for the electrical and physical research on nano structure at low temperature. It can be applied to various kinds of STM, AFM and multi-probing mea-surements.
UHV LT SPMUHV LT SPM System
USM-1500Advanced UNISOKU SPM technology completed a new series of the Ultra Low Temperature SPM. Compact design, easy operation and reasonable cost.
UHV ULT High Mag-netic Fields SPM
NEWUHV Ultra Low Temperature STM Sysytem with Dilution Refrigerator USM 1600High-End Model STM in Low Temperature and High Magnetic Field. Continuous cooling lower than 40mK (target 30mK).
NUMBER OF EMPLOYEES35
ESTIMATED ANNUAL REVENUES $3 million -$5 million
ADDRESSUNISOKU Co., Ltd.2-4-3, Kasugano, HirakataOsaka 573-0131JapanTel: +81-72-858-6456
WEBwww.unisoku.com
PROFILES

MIC
ROSC
OPE
S • O
CTO
BER
201
3
78
WITec WissenschaftlicheCOMPANY DESCRIPTIONWITec is a manufacturer of high resolution optical and scanning probe microscopy solutions for scientific and industrial applications. A modular product line allows the combination of different microscopy tech-niques such as Raman, NSNOM or AFM in one single instrument for comprehensive and flexible analyses of optical, chemical and structural properties of a sample.
PRODUCTSThe company’s alpha300 product line features a Near-field Scanning Optical Microscope, using unique cantilever technology, a Confocal Raman Microscope designed for highest sensitivity and resolution and an AFM for material research and nanotechnology.
NUMBER OF EMPLOYEES25 plus.
ESTIMATED ANNUAL REVENUES $5 million -$7.5 million
ADDRESSWITec WissenschaftlicheInstrumente und Technologie GmbHLise-Meitner-Str. 6D-89081 UlmGermanyTel: +49 (0) 731 140 700
WEBwww.witec.de
PROFILES