journal of travel research
TRANSCRIPT

http://jtr.sagepub.com/Journal of Travel Research
http://jtr.sagepub.com/content/50/2/198The online version of this article can be found at:
DOI: 10.1177/0047287510362780
2011 50: 198 originally published online 19 March 2010Journal of Travel ResearchSvetlana Stepchenkova and James S. Eales
Destination Image as Quantified Media Messages: The Effect of News on Tourism Demand
Published by:
http://www.sagepublications.com
On behalf of:
Travel and Tourism Research Association
can be found at:Journal of Travel ResearchAdditional services and information for
http://jtr.sagepub.com/cgi/alertsEmail Alerts:
http://jtr.sagepub.com/subscriptionsSubscriptions:
http://www.sagepub.com/journalsReprints.navReprints:
http://www.sagepub.com/journalsPermissions.navPermissions:
http://jtr.sagepub.com/content/50/2/198.refs.htmlCitations:
at UNIV OF NORTH DAKOTA on March 7, 2011jtr.sagepub.comDownloaded from
Journal of Travel Research50(2) 198 –212© 2011 SAGE PublicationsReprints and permission: sagepub.com/journalsPermissions.navDOI: 10.1177/0047287510362780http://jtr.sagepub.com
Destination Image as Quantified Media Messages: The Effect of News on Tourism Demand
Svetlana Stepchenkova1 and James S. Eales2
Abstract
This study proposes to quantify media messages about a tourist destination in the form of time series and then use these series as variables representing a qualitative factor of destination image in models of tourism demand. Quantified media messages, or Dynamic Destination Image Index series, are obtained applying content analysis methodology to media materials that reflect news volume, topics raised about the destination, and favorability of coverage. The methodology of quantifying media messages is demonstrated using articles about Russia published in three influential U.K. newspapers—the Times, the Guardian, and the Independent. To test whether media messages account for variance not captured by traditional econometric variables, the series were used in models of total and leisure U.K. arrivals to Russia for the period of 1993-2007. Four DDII-Russia news series were found to be significant factors in consumer destination choice.
Keywords
consumer decision making, destination choice, Dynamic Destination Image Index (DDII), media messages, tourism demand
Introduction
The purpose of this study is twofold. First, the study introduces numerical measures of change in a destination’s perception through time, which is called the Dynamic Destination Image Index (DDII; Stepchenkova 2009). Essentially, DDII reflects positive and negative events that happened at a destination, the destination’s natural resources and culture, how safe it is for tourists, how well developed its infrastructure is, and other important attributes, as they are presented in mass media in the destination market. Media messages published about a destina-tion are quantified in a time series that reflects changes in destination image through time. The presumption is that such quantifications should be based on the volume of media mate-rials in the source country about the destination, topics raised, and the favorability of that media coverage. Second, as evi-dence of the value of these series, they are used as variables representing qualitative factors of destination image in models of tourism demand.
The construction of DDII is guided by content analysis methodology. It has precursors in previous social science and econometric studies, where a wealth of textual materials is summarized as an index that is then used as an explanatory variable in a model. The procedure of quantifying media mes-sages is demonstrated using Russia as a destination and the United Kingdom as a source market. The DDII series are con-structed for the 1992-2007 period, quarterly, and tested in a model of total and leisure U.K. arrivals to Russia. The
research was motivated, in part, by previous work modeling U.K. demand for travel to Russia and to China (Stepchenkova and Ismail 2007). The Chinese model performed well both in terms of fit and in agreement with economic theories. The model of U.K. leisure arrivals to Russia was problematic; the effect of the Russian price variable was positive and signifi-cant. It was hypothesized that this result was due to the recent opening up of Russia to the world, which generated so much excitement that travelers were willing to overlook high prices, underdeveloped infrastructure, and complicated visa proce-dures. Thus, the current study extends this previous work for U.K. arrivals to Russia by introducing the quantified news series reflecting the presentation of Russia as a destination in the U.K. mass media.
Contribution of this study lies in testing the feasibility of deriving destination image as quantified media messages and using them in models of tourism demand to determine if their introduction better explains behavior with respect to destina-tion selection process. Practical significance of the study lies in potential improvement of modeling tourism arrivals.
1University of Florida, Gainesville2Purdue University, West Lafayette, Indiana
Corresponding Author:Svetlana Stepchenkova, Department of Tourism, Recreation and Sport Management, College of Health and Human Performance, University of Florida, P.O. Box 118208, Gainesville, FL 32611-8208Email: [email protected]
at UNIV OF NORTH DAKOTA on March 7, 2011jtr.sagepub.comDownloaded from

Stepchenkova and Eales 199
Study BackgroundIndices in Social SciencesThere are some notable examples of social science studies that involved constructing indices from textual data. Mahl (1959) suggested an index of patient anxiety during a psychi-atric interview as a ratio of the number of speech disturbances in a word sample to the total number of “words” in the sample. McClelland (1958) took the frequency of a category of assertions or images related to action, goals, and progress to indicate their producer’s achievement motive. The index was derived from ancient Greek literary documents and cor-related with periods of prosperity of the ancient Greek society. Merritt (1966) developed an index of the rising national consciousness among the 13 original American col-onies based on newspaper accounts for years 1735-1775. The researcher found a shift in the use of the names of places in colonial England to the names of places in America and concluded this showed a rising national consciousness. Let-ters of complaints to city halls were used by Krendel (1970) to develop an index of citizen dissatisfaction. The study sug-gested that the index of citizen complaints could be as good an indication of the urban quality of life as more conven-tional statistics on health, social mobility, income, or the physical environment. A study by Gerbner et al. (1979) cre-ated a television violence index based on the number of violent scenes in fictional TV programs.
Flesch’s (1951) “readability yardstick” gradually devel-oped in several studies; the final formula used average sentence length measured in number of words and average number of syllables per word as a combined measure of text readability. A version of Flesch’s yardstick is used by gov-ernment contractors to finalize instructions to military personnel and by insurance companies to evaluate contracts (Krippendorff 2004). Danielson, Lasorsa, and Im (1992) applied a computer version of the Flesch index to compare readability of printed novels and news for a 100-year period. The study found that while novels had become easier to read, printed news had become harder to read, primarily because of the use of longer words. Namenwirth (1973) used frequencies of value variables to describe value change in America for a period of 120 years. He analyzed platforms of the Republican and Democratic parties for the period of 1844-1964 to test a hypothesis that a society’s concern with various values (e.g., wealth or power) is cyclical. A thematic content analysis where theme prevalence was examined over time was conducted by Danielson and Lasorsa (1997). The researchers wanted to tap the perceptions of social change in the United States as reflected through two promi-nent newspapers, the New York Times and the Los Angeles Times, over the 100-year period.
Indices that have been used in previous research can be divided into five classes—those based on (1) frequency, (2) favorability, (3) intensity, (4) word co-occurrences, and (5)
presence or absence of a concept (Holsti 1969; Krippendorff 2004). Of the five, the first two are used most often. The frequency with which a symbol, idea, reference, or topic occurs in a stream of messages is taken to indicate the importance of, attention to, or emphasis on that symbol, reference, idea, or topic in the messages (Lasswell, Lerner, and Pool 1952). Lasswell and his colleagues explained the symbolic character of communication using examples from political science. They stated that
as a means of surveying the significant features of a vast body of symbol materials, it is convenient to focus upon key symbols occurring in the flow of political statements. The role of key symbols in polit-ical life is deeply woven into the texture of the body politic, since symbols enter into the experience of everyone, irrespective of status. (Lasswell, Lerner, and Pool 1952, p. 14)
All indices described earlier in this section incorporated frequency counts in some way. Favorability analysis is based on the theory of attitude, which is sometimes defined as an evaluative response toward an entity, a predisposition to respond in a certain way (Cohen and Areni 1991). As formulated by Eagly and Chaiken (1993), attitude is “a psychological tendency that is expressed by evaluating a particular entity with some degree of favor or disfavor” (p. 1). The number of favorable and unfavorable characteristics attributed to a symbol or idea is often viewed as an indicator of the attitudes held by writers, readers, or their common culture toward that symbol or idea. Attitude objects are valued, “liked,” or “disliked” in degrees ranging from positive to neutral to negative. According to Osgood, Suci, and Tannenbaum (1957), “attitudes can be ascribed to some basic bipolar continuum with a neutral or zero reference point, implying that they have both direction and intensity and providing a basis for the quantitative indexing of attitudes” (p. 189). The suitability of the index type to answer a particular research question should be considered prior to constructing the index (Krippendorff 2004; Rapoport 1969). There is also an issue with index validity, and a simple declaration of the index value is not enough. The researcher has to validate their indices by designing suitable tests, for example, establishing correlation of indices derived from the textual materials with some external phenomenon.
Demand Models with Qualitative FactorsThe idea of using variables representing qualitative factors in modeling demand has been applied to better understand con-sumer behavior. Brown and Schrader (1990) investigated how scientific information about cholesterol levels and its connection to heart disease influenced egg consumption in the United States. The researchers developed two data series:
at UNIV OF NORTH DAKOTA on March 7, 2011jtr.sagepub.comDownloaded from

200 Journal of Travel Research 50(2)
one that indicated the cumulative sum of articles appearing in medical journals that support the link between blood serum cholesterol and heart disease (“negative information”) and another that indicated the cumulative number of articles that attacked or questioned the link (“positive information”). They reasoned that consumers received health information from many sources, including physicians, neighbors, and the popular press. The hypothesis was that consumers’ attitudes toward cholesterol changed slowly as scientific information accumulated; thus, a lagged index based on articles in medi-cal journals could serve as a proxy for information reaching consumers from many sources. Results showed that the increasing information on the links between cholesterol and heart disease led to a decrease in per capita shell egg con-sumption in the United States.
A number of papers have focused on advertising effects in modeling demand. A study by Kinnucan et al. (1997) investigated whether generic advertising and health infor-mation have detectable effects on U.S. meat demand. These scholars constructed a health information index based on Brown and Schrader’s (1990) cholesterol index. The study found that health information had a significant effect in each of four equations (beef, pork, poultry, and fish), while the estimated effects of generic advertising were found to be modest. Chang and Kinnucan (1991) examined the roles of cholesterol and advertising in explaining consumption trends for fats and oils, focusing on butter. Results sug-gested that increased consumer awareness of the health effects of cholesterol had contributed to changes in butter consumption. Green, Carman, and McManus (1991) found that generic advertising effects for dried fruit are generally weak when compared to price and total expenditure effects. Empirical finding from advertising studies supported the hypothesis that advertising has carryover, or lagged, effects; unfortunately, theory provides little information as to the structure and length of these dynamic processes (Brester and Schroeder 1995).
Researchers have been aware that unfavorable product information appears to have a much stronger influence than similar amounts of favorable information on consumers’ decision-making process (Weinberger, Allen, and Dillon 1981). Mizerski (1982) summarizes research on the dispro-portionate cognitive weighting of positive and negative information by consumers from marketing, consumer behav-ior, and psychology disciplines. Menzel and Katz (1955) followed by Rogers (1962) noted that unfavorable informa-tion tended to slow new product adoption; however, these authors did not present any quantifiable evidence. Reynolds and Darden (1972) found evidence that consumers did not buy products as a result of the unfavorable information. The outcome of a study by Wright (1974) indicated that consum-ers placed more weight on negative information if time for their decision making is limited. All this evidence highlights the importance of information processing by consumers.
Tourism scholars agree that econometric models of tourism demand lack explanatory variables that account for qualitative factors pertinent to tourists’ decision-making process (Li, Song, and Witt 2005; Lim 1997; Song and Witt 2000). These factors have been previously included in models of tourism demand in the form of “dummy” variables. However, such an approach is limited for two reasons. First, the period of influence of a particular “dummy” variable is difficult to define; thus, it is seldom more than arbitrary. Second, “dummy” variables cannot reflect dynamic changes in qualitative variables; rather, they indicate presence or absence of a certain factor. Tour-ism scholars have been making econometric models more and more complex in both functional form and estimation methods used; however, overall model performance is still inadequate (Li, Song, and Witt 2005; Song, Witt, and Jensen 2002). Quantified media messages or the DDII series is an attempt to address these inadequacies.
Travel Information SourcesIn the past 30 years, extensive research has been done on tourist information search strategies and its potentially large role in understanding, predicting, and influencing travel behavior (Ajzen and Driver 1992; Fodness and Murray 1997, 1998; Mayo and Jarvis 1981; Moutinho 1987; Sirakaya and Woodside 2005). Several typologies of information sources have been proposed by tourism researchers, such as com-mercial versus noncommercial (Gartner 1993), external versus internal (Raitz and Dakhil 1989), or personal versus impersonal (Engel, Blackwell, and Miniard 1995). Fodness and Murray (1997) defined two approaches to information search—those based on combination of the information sources used (the “strategic” model by Snepenger et al. 1990) and those based on the effort made, that is, number of sources used and time spent (the “contingency” model by Schul and Crompton 1983). According to Moutinho (1987), travelers use routine, limited, or extended information search strate-gies when they search for travel-related information. One of the factors affecting strategy choice is perceived risk. For example, in high-risk situations involving large amounts of money, a larger number of information sources are consulted and time spent on search for relevant information increases (Sirakaya and Woodside 2005).
The research has yet to settle on a single model of travel information search behavior. A meta-analysis of information search behavior studies conducted by Sirakaya and Wood-side (2005) found many limitations. In general, surveyed models depended heavily on rationality of tourism behavior and viewed potential travelers as aiming to maximize utility (e.g., Schmoll 1977; Wahab, Crompton, and Rothfield 1976). However, human decisions are not perfectly rational (Bettman, Luce, and Payne 1998; Tversky and Kahneman 1974); travel decisions are influenced by a host of noneconomic
at UNIV OF NORTH DAKOTA on March 7, 2011jtr.sagepub.comDownloaded from

Stepchenkova and Eales 201
factors such as images, long-term desires to visit a particular country, or cultural interest that are unknown to the researcher and may make travelers appear to act irrationally. The approach taken in this study acknowledges the complexities and multifactorial nature of information search strategies used by potential tourists. Using content analysis, this study attempts to quantify the amount and favorability of destina-tion information that reaches potential travelers from all sources by selecting information transmitted by influential newspapers as a proxy to all potential tourists’ information.
MethodSource Selection
Selecting communication sources is the first sampling decision in a procedure that “may involve as many as three steps: selecting sources of communication, sampling docu-ments, and sampling within documents” Holsti (1969, p. 130). Lasswell, Lerner, and Pool (1952) make a strong case for newspapers as suitable sources for content analysis research. Newspapers appear regularly and frequently, they have uni-form formats and many of their parameters, such as circulation, geographical area of distribution, social and political orienta-tion, and ownership are known. The researcher is relatively sure who controls and who reads the news and it is easy to distinguish newspaper editorials from news, from letters to editors, and other types of materials. Newspapers are conve-niently accessible from electronic databases, and archives date well back into the past. Analyses often focus on “prestige” newspapers and journals because they are felt to represent most adequately the views of the political elite (Lasswell, Lerner, and Pool 1952; Namenwirth 1969; Wells and King 1994) and, therefore, are considered “more influ-ential” than local papers.
In this study, three influential and widely distributed U.K. newspapers that focus on serious journalism—the Times, the Guardian, and the Independent—were chosen as sources of textual material for constructing the DDII series. Since the U.K. Internet penetration rate was below 26.2% before the year of 2000 (www.internetworldstats.com/eu/uk.htm), selec-tion of print media for the study was judged appropriate. All three newspapers are placed within the top 10 British news-papers with the highest circulation: as of January 2009, the Times, the Guardian, and the Independent had circulation figures of 617,483, 358,844, and 215,504 copies, respec-tively, according to the Audit Bureau of Circulation (www.abc.org.uk). “The Big Three” have different political agen-das; they are oriented to different social strata and considered national newspapers. Each newspaper has an online version, which would provide an even wider distribution of newspa-per materials. It was posited that the Big Three could be used to represent not only all U.K. newspapers but all sources of information for potential U.K. tourists.
Sample Selection
Textual data for the period of 1992-2007 were taken from the LexisNexis Academic database, one of the world’s largest general news databases. LexisNexis Academic has a built-in language that allows selecting and sorting documents within sources; for instance, by headline, section, subject, or page. Since format, structure, and content classification system of the three selected newspapers differ, it was decided to start searching for the articles that had the words Russia, Moscow, or Petersburg in headlines, making the first round of the search as wide as possible. The selected articles were then examined to determine the most relevant sections of each newspaper to help refine the search. “When using relevance sampling, analysts proceed by actually examining the texts to be analyzed, even if only superficially, often in a multistage process” (Krippendorff 2004, p. 119). Sections that contained relevant articles were identified for each of the newspapers. It was decided that the front pages of each newspaper were to be searched as well because they report natural disasters, ter-rorist attacks, airlines crashes, infrastructure failures, and political riots. These themes are all directly related to percep-tion of important destination attributes—political stability, safety from harm, sanitary conditions, and level of infrastruc-ture development (Crompton 1979; Echtner and Ritchie 1993). The process resulted in a unique search string for each of the newspapers (Stepchenkova 2009).
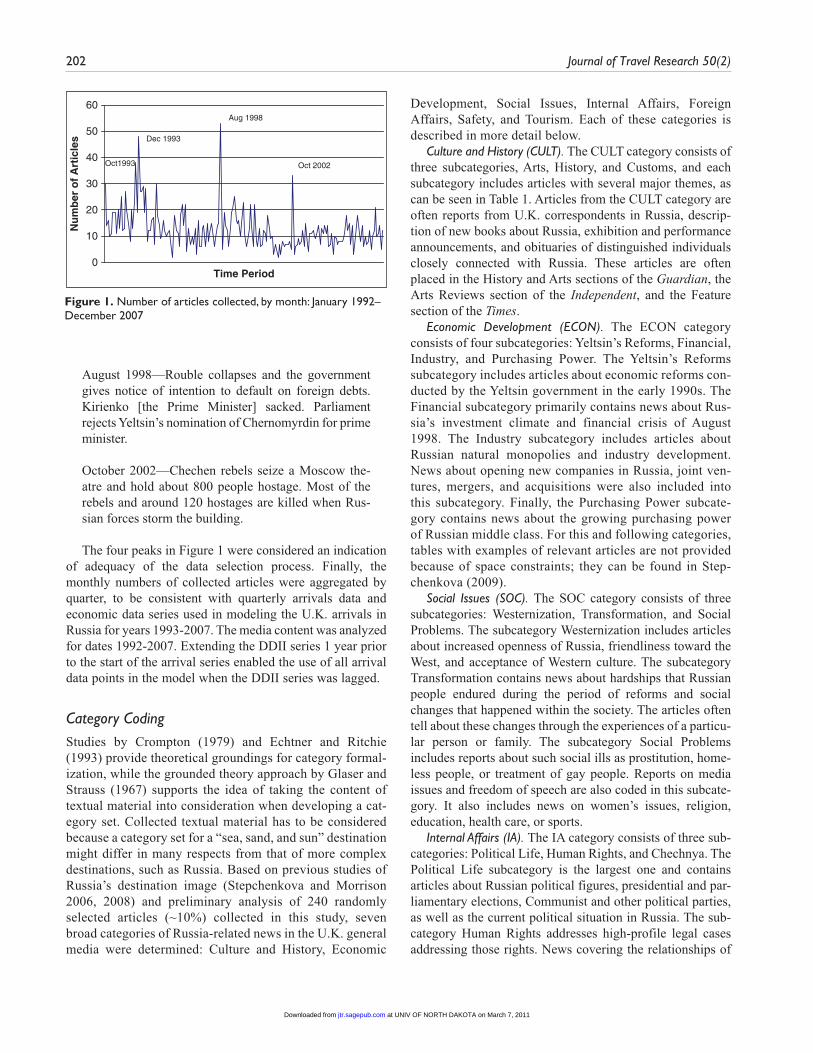
Sample DescriptionThe search resulted in the selection of 2,493 articles. They
were organized by source, year, month, date, day of the week, title, newspaper section, length (in number of words), and text body. The LexisNexis Academic database sometimes includes duplicates of the articles (Deacon 2007). Two selected articles were considered duplicates if all their above-mentioned fields were the same. Duplicates from the Times (12), the Guardian (17), and the Independent (25) were excluded from analysis. The final sample contained 2,439 articles: 921,910, and 608 from the Times, the Guardian, and the Independent, respec-tively. Monthly distribution of all collected articles is given in Figure 1. It clearly shows four peaks—October 1993, December 1993, August 1998, and October 2002. In the BBC version of modern Russia’s timeline (http://news.bbc.co.uk/2/hi/europe/country_profiles/1113655.stm), the events that happened in these months are described as follows:
October 1993—Yeltsin orders the army attack on par-liament, which is recaptured following a bloody battle. In December Russians approve a new constitution which gives the president sweeping powers. Commu-nists and ultra-nationalists make large gains in elections to the new legislature, the State Duma, which replaces the former parliament, the Supreme Soviet.
at UNIV OF NORTH DAKOTA on March 7, 2011jtr.sagepub.comDownloaded from
202 Journal of Travel Research 50(2)
August 1998—Rouble collapses and the government gives notice of intention to default on foreign debts. Kirienko [the Prime Minister] sacked. Parliament rejects Yeltsin’s nomination of Chernomyrdin for prime minister.
October 2002—Chechen rebels seize a Moscow the-atre and hold about 800 people hostage. Most of the rebels and around 120 hostages are killed when Rus-sian forces storm the building.
The four peaks in Figure 1 were considered an indication of adequacy of the data selection process. Finally, the monthly numbers of collected articles were aggregated by quarter, to be consistent with quarterly arrivals data and economic data series used in modeling the U.K. arrivals in Russia for years 1993-2007. The media content was analyzed for dates 1992-2007. Extending the DDII series 1 year prior to the start of the arrival series enabled the use of all arrival data points in the model when the DDII series was lagged.
Category CodingStudies by Crompton (1979) and Echtner and Ritchie (1993) provide theoretical groundings for category formal-ization, while the grounded theory approach by Glaser and Strauss (1967) supports the idea of taking the content of textual material into consideration when developing a cat-egory set. Collected textual material has to be considered because a category set for a “sea, sand, and sun” destination might differ in many respects from that of more complex destinations, such as Russia. Based on previous studies of Russia’s destination image (Stepchenkova and Morrison 2006, 2008) and preliminary analysis of 240 randomly selected articles (~10%) collected in this study, seven broad categories of Russia-related news in the U.K. general media were determined: Culture and History, Economic
Development, Social Issues, Internal Affairs, Foreign Affairs, Safety, and Tourism. Each of these categories is described in more detail below.
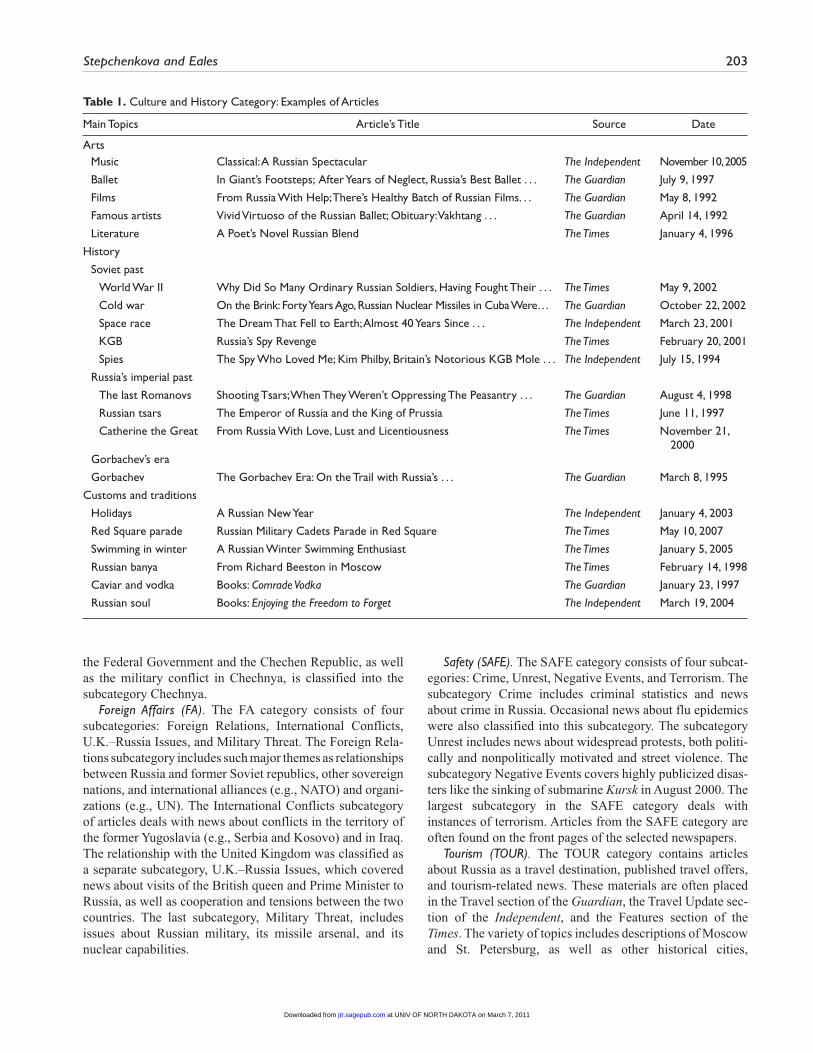
Culture and History (CULT). The CULT category consists of three subcategories, Arts, History, and Customs, and each subcategory includes articles with several major themes, as can be seen in Table 1. Articles from the CULT category are often reports from U.K. correspondents in Russia, descrip-tion of new books about Russia, exhibition and performance announcements, and obituaries of distinguished individuals closely connected with Russia. These articles are often placed in the History and Arts sections of the Guardian, the Arts Reviews section of the Independent, and the Feature section of the Times.
Economic Development (ECON). The ECON category consists of four subcategories: Yeltsin’s Reforms, Financial, Industry, and Purchasing Power. The Yeltsin’s Reforms subcategory includes articles about economic reforms con-ducted by the Yeltsin government in the early 1990s. The Financial subcategory primarily contains news about Rus-sia’s investment climate and financial crisis of August 1998. The Industry subcategory includes articles about Russian natural monopolies and industry development. News about opening new companies in Russia, joint ven-tures, mergers, and acquisitions were also included into this subcategory. Finally, the Purchasing Power subcate-gory contains news about the growing purchasing power of Russian middle class. For this and following categories, tables with examples of relevant articles are not provided because of space constraints; they can be found in Step-chenkova (2009).
Social Issues (SOC). The SOC category consists of three subcategories: Westernization, Transformation, and Social Problems. The subcategory Westernization includes articles about increased openness of Russia, friendliness toward the West, and acceptance of Western culture. The subcategory Transformation contains news about hardships that Russian people endured during the period of reforms and social changes that happened within the society. The articles often tell about these changes through the experiences of a particu-lar person or family. The subcategory Social Problems includes reports about such social ills as prostitution, home-less people, or treatment of gay people. Reports on media issues and freedom of speech are also coded in this subcate-gory. It also includes news on women’s issues, religion, education, health care, or sports.
Internal Affairs (IA). The IA category consists of three sub-categories: Political Life, Human Rights, and Chechnya. The Political Life subcategory is the largest one and contains articles about Russian political figures, presidential and par-liamentary elections, Communist and other political parties, as well as the current political situation in Russia. The sub-category Human Rights addresses high-profile legal cases addressing those rights. News covering the relationships of
0
10
20
30
40
50
60
Time Period
Nu
mb
er o
f A
rtic
les
Oct1993
Dec 1993
Aug 1998
Oct 2002
Figure 1. Number of articles collected, by month: January 1992–December 2007
at UNIV OF NORTH DAKOTA on March 7, 2011jtr.sagepub.comDownloaded from
Stepchenkova and Eales 203
the Federal Government and the Chechen Republic, as well as the military conflict in Chechnya, is classified into the subcategory Chechnya.
Foreign Affairs (FA). The FA category consists of four subcategories: Foreign Relations, International Conflicts, U.K.–Russia Issues, and Military Threat. The Foreign Rela-tions subcategory includes such major themes as relationships between Russia and former Soviet republics, other sovereign nations, and international alliances (e.g., NATO) and organi-zations (e.g., UN). The International Conflicts subcategory of articles deals with news about conflicts in the territory of the former Yugoslavia (e.g., Serbia and Kosovo) and in Iraq. The relationship with the United Kingdom was classified as a separate subcategory, U.K.–Russia Issues, which covered news about visits of the British queen and Prime Minister to Russia, as well as cooperation and tensions between the two countries. The last subcategory, Military Threat, includes issues about Russian military, its missile arsenal, and its nuclear capabilities.
Safety (SAFE). The SAFE category consists of four subcat-egories: Crime, Unrest, Negative Events, and Terrorism. The subcategory Crime includes criminal statistics and news about crime in Russia. Occasional news about flu epidemics were also classified into this subcategory. The subcategory Unrest includes news about widespread protests, both politi-cally and nonpolitically motivated and street violence. The subcategory Negative Events covers highly publicized disas-ters like the sinking of submarine Kursk in August 2000. The largest subcategory in the SAFE category deals with instances of terrorism. Articles from the SAFE category are often found on the front pages of the selected newspapers.
Tourism (TOUR). The TOUR category contains articles about Russia as a travel destination, published travel offers, and tourism-related news. These materials are often placed in the Travel section of the Guardian, the Travel Update sec-tion of the Independent, and the Features section of the Times. The variety of topics includes descriptions of Moscow and St. Petersburg, as well as other historical cities,
Table 1. Culture and History Category: Examples of Articles
Main Topics Article’s Title Source Date
ArtsMusic Classical: A Russian Spectacular The Independent November 10, 2005
Ballet In Giant’s Footsteps; After Years of Neglect, Russia’s Best Ballet . . . The Guardian July 9, 1997
Films From Russia With Help; There’s Healthy Batch of Russian Films. . . The Guardian May 8, 1992
Famous artists Vivid Virtuoso of the Russian Ballet; Obituary: Vakhtang . . . The Guardian April 14, 1992
Literature A Poet’s Novel Russian Blend The Times January 4, 1996
History
Soviet past
World War II Why Did So Many Ordinary Russian Soldiers, Having Fought Their . . . The Times May 9, 2002
Cold war On the Brink: Forty Years Ago, Russian Nuclear Missiles in Cuba Were… The Guardian October 22, 2002
Space race The Dream That Fell to Earth; Almost 40 Years Since . . . The Independent March 23, 2001
KGB Russia’s Spy Revenge The Times February 20, 2001
Spies The Spy Who Loved Me; Kim Philby, Britain’s Notorious KGB Mole . . . The Independent July 15, 1994
Russia’s imperial past
The last Romanovs Shooting Tsars; When They Weren’t Oppressing The Peasantry . . . The Guardian August 4, 1998
Russian tsars The Emperor of Russia and the King of Prussia The Times June 11, 1997
Catherine the Great From Russia With Love, Lust and Licentiousness The Times November 21, 2000
Gorbachev’s era
Gorbachev The Gorbachev Era: On the Trail with Russia’s . . . The Guardian March 8, 1995
Customs and traditions
Holidays A Russian New Year The Independent January 4, 2003
Red Square parade Russian Military Cadets Parade in Red Square The Times May 10, 2007
Swimming in winter A Russian Winter Swimming Enthusiast The Times January 5, 2005
Russian banya From Richard Beeston in Moscow The Times February 14, 1998
Caviar and vodka Books: Comrade Vodka The Guardian January 23, 1997
Russian soul Books: Enjoying the Freedom to Forget The Independent March 19, 2004
at UNIV OF NORTH DAKOTA on March 7, 2011jtr.sagepub.comDownloaded from

204 Journal of Travel Research 50(2)
geographical zones like Siberia and Far East, architectural and natural attractions, and infrastructure.
Not Relevant (NR). In the coding process, one more cate-gory of articles was identified, which was named Not Relevant (NR). After the search strings for material selec-tion were perfected and the sample of 2,439 articles selected, it was possible that some of the articles were still not rele-vant to the proposed research question. For example, a few articles had the word combination “Russian roulette” in the headline, but they were not about Russia at all. Therefore, in the coding process, the researcher had to assess any single article for relevance to the study. Less than 4.0% of textual material was classified as irrelevant. The low rate was con-sidered another indicator that the initial article selection criteria were adequate.
In addition to determining the categories, the researcher must designate the textual units (sampling, recoding, and context) for coding. Sampling units, for example, an article or a book, provide a basis for identifying textual populations relevant to the research questions and selecting a sample for content analysis (Neuendorf 2002). Recording units are typi-cally contained in sampling units, at most coinciding with them but never exceeding them, and constitute “the specific segment of content that is characterized by placing it in a given category” (Holsti 1969, p. 116). To classify a recording unit into one of the established categories, a context unit also
needs to be determined. In this study, the sampling unit coin-cided with the recoding unit, which was a single article. Classification of the articles into a certain category was based on the headline or, if the headline was inconclusive, on the first paragraph (5-10 sentences) of the text.
Favorability AssessmentCoded articles were assigned one of three “favorability” values based on whether the coverage of a topic in the article was mostly negative (–1), neutral (0), or positive (+1). To reduce subjectivity, several subcategories were assigned a constant favorability value: for example, articles from the sub-category Soviet Past were always coded as –1, since previous research by Stepchenkova and Morrison (2008) indicated that among potential U.S. travelers to Russia, the country’s Soviet past was a negative factor in an overall image perception. In the same manner, news from the Safety category (SAFE) was always coded as –1. Articles from the Tourism category (TOUR) were never coded as neutral: it was reasoned that as long as news from this category were not clearly unfavorable, travel-related materials increased visibility of Russia as a des-tination and should be counted as positive.
In the instances when a favorability score was not deter-mined by category or subcategory, assignment of the score involved two main considerations: (1) the issue itself and (2)
Table 2. Favorability Coding: Tourism Category
Category Favorable Unfavorable
Cities Time Off: Must-See Moscow; The Guardian, September 4, 1997Natural resources
and wildlifeSomething to Declare: Destination of the Week: Russia’s Far East; The
Independent, July 24, 2004Russian threat; The Times, June 5, 2007
Accessibility Travel: City Break: Moscow: Russian Around: Way to Go; The Guardian, November 3, 2001
Roman Catholic Clergy Refused Entry to Russia; The Times, August 31, 2002
Packages All Aboard for Russian Experience; the Best Deals, the Latest Hot-Spots and What’s New in Travel; The Independent, June 26, 2004
Tours and cruises Trees, Trees and More Trees; Visiting the former USSR Is Not Cheap But It Is a Challenge. Here, Martin Varley Boards the Trans-Siberian Railway; The Independent, May 6, 1995
Russia’s Luxury Arctic Tours Risk Nuclear Disaster; The Independent, June 26, 2004
Airlines and airports Aeroflot Courts Russian High-Flyers; The Times, August 26, 1998 US Fear of Flying Russian Airlines; The Independent, July 22, 1994
Transportation How Do They Do It? Moscow Has Mosaics and Chandeliers; The Guardian, August 22, 2001
Russian Answer to Road Congestion; The Times, August 7, 2002
Hotels 24-Hour Room Service; Hotel Astoria, St Petersburg; The Independent, May 10, 2003
Cuisine Food & Drink: Bites; Russian; The Independent, June 26, 2004 “. . . If Communism Really Ruined the Russian Cuisine, As You Suggest in Your Editorial, ‘’The Wolf’s Feast,” Russian cuisine; The Times, September 11, 1995
Joint travel G2: Shortcuts: From Moscow to Vietnam, via Redcar; The Guardian, August 23, 2006
at UNIV OF NORTH DAKOTA on March 7, 2011jtr.sagepub.comDownloaded from

Stepchenkova and Eales 205
the attitude to this issue expressed in the article. Articles about such social ills as prostitution, alcoholism, or homeless people were always coded as negative. In cases when the issue itself was insufficient to decide about favorability, the headlines and the first 5 to 10 sentences of an article were examined for author’s attitudes. For instance, headlines like “From Russia with Love” or “Why Russian Schools Are Cool” were considered as indicators of positive attitudes. Articles about the political crisis of October 1993, economic hardships and social turmoil during the Yeltsin reforms, financial default of August 1998, military conflict in Chech-nya, and the Moscow theatre siege by Chechen terrorists were consistently assessed unfavorably in their respective categories. Table 2 provides examples of favorability coding in the Tourism (TOUR) category; for examples from other categories, see Stepchenkova (2009).
Interrater ReliabilitySince coding is always susceptible to the researcher’s biases, control coding was conducted. This control coding was done to estimate whether the categories and favorability guidelines were formulated in such a way that the articles could be “objectively” placed in categories and rated as to their favor-ability. Rater 1 was the first author of this paper, the one who examined the 240 articles to identify categories and formu-lated guidelines for the coding process. Rater 2 was an experienced researcher with a PhD degree. Being of Russian descent, he was familiar with the host of issues that con-fronted Russia in the period selected for study. Prior to control coding, two randomly selected articles from each quarter were coded together by the raters. In this preliminary process a few ambiguities were noted and resolved. For the control coding, three articles from each quarter were randomly selected, for the total of 184 articles.
In favorability coding, the researchers agreed on 159 cases of 184, which gives an 86.4% rate of agreement. The raters
differed in assessing favorability in two ways: “favorable versus neutral” or “neutral versus unfavorable.” There was not a single instance where an article was assessed as “favor-able” by one researcher and placed into the “unfavorable” category by the other rater. In the category coding, because of a relatively large number of categories, the discrepancies were larger: the raters differed in 44 of 184 cases. Thus, the rate of agreement was 76.1%. In certain cases it was difficult to classify an article into a single category, since some articles touched on issues belonging to several categories; the most problematic categories were Internal Affairs and Foreign Affairs. Table 3 provides the number of instances when the raters disagreed on the category in which to place an article. For example, there were five articles that Rater 1 placed in the category Internal Affairs (IA) and Rater 2 in the category For-eign Affairs (FA).
Cohen’s kappa coefficient κ (Cohen 1960) measures the agreement between two raters who each classifies N items into C mutually exclusive categories. It is a more robust measure than simple percentage agreement calculation, since κ takes into account the agreement occurring by chance. In this study, Cohen’s kappa equals .796 and .727 for favorabil-ity assessment and category coding, respectively (see Krippendorff 2004 for calculation formula). According to Landis and Koch (1977), values of kappa in the range .61 to .80 constitute a substantial agreement between the raters. Therefore, developed categories and guidelines for the coding process were judged as sufficiently objective.
Quarterly DDII SeriesSince the total body of textual material was quite large (2,439 articles), it was decided to draw a random sample of 20 arti-cles from each of 64 quarters and then extrapolate the coding results to all articles in the respective quarter. If a nonrele-vant article was selected, then another article was drawn randomly to replace it, for the total of 20 (for details of ran-domization procedure, see Stepchenkova 2009). If, for example, 12 among 20 randomly selected articles from a quarter were coded in the CULT category, and that quarter contained 40 articles in total, then the number of articles in the CULT category was estimated to be 24. The volume of articles ranged from 14 to 95 per quarter, with 90% of all quarters having 57 articles or fewer. The sample size of 20 was chosen as a trade-off between accuracy of extrapolation results and time required for coding: approximately half of the articles (1,332) were actually coded. The sample size of 20 varied from 21% to 100% of articles selected per quarter. This gives an error rate of plus or minus 19.5% with 95% confidence. While such an error would be considered large in a political poll, in this exploratory study it was accepted as a reasonable trade-off between coding time and extrapola-tion accuracy. Rater 1 did the coding of the selected articles following the developed guidelines.
Table 3. Reliability Estimation: Category Coding
Rater 2
Rater 1 CULT ECON FA IA SAFE SOC TOUR NR Total
CULT 2 2 2 1 7ECON 1 1 2FA 2 3 1 6IA 1 2 5 1 1 10SAFE 1 2 3SOC 1 3 1 1 2 8TOUR 1 1 2 4NR 1 1 1 1 4Total 6 7 9 7 2 9 2 2 44
Note: CULT = Culture and History; ECON = Economic Development; FA = Foreign Affairs; IA = Internal Affairs; SAFE = Safety; SOC = Social Issues; TOUR = Tourism; NR = Not Relevant.
at UNIV OF NORTH DAKOTA on March 7, 2011jtr.sagepub.comDownloaded from
206 Journal of Travel Research 50(2)
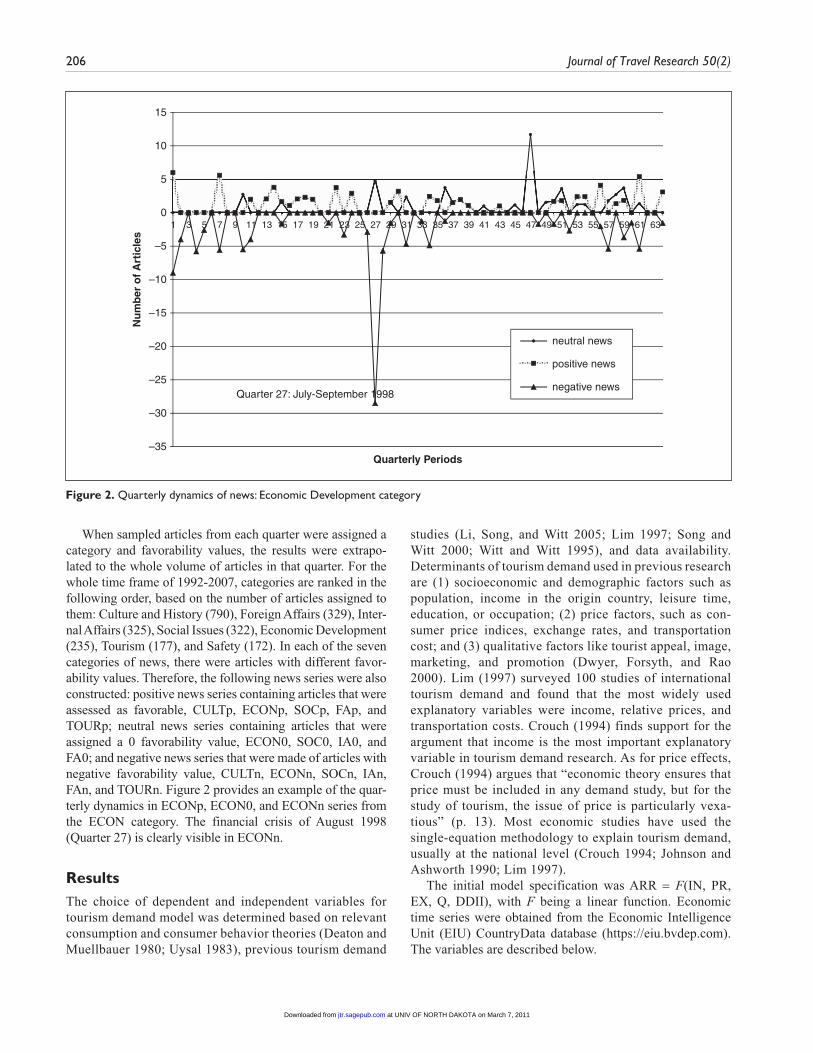
When sampled articles from each quarter were assigned a category and favorability values, the results were extrapo-lated to the whole volume of articles in that quarter. For the whole time frame of 1992-2007, categories are ranked in the following order, based on the number of articles assigned to them: Culture and History (790), Foreign Affairs (329), Inter-nal Affairs (325), Social Issues (322), Economic Development (235), Tourism (177), and Safety (172). In each of the seven categories of news, there were articles with different favor-ability values. Therefore, the following news series were also constructed: positive news series containing articles that were assessed as favorable, CULTp, ECONp, SOCp, FAp, and TOURp; neutral news series containing articles that were assigned a 0 favorability value, ECON0, SOC0, IA0, and FA0; and negative news series that were made of articles with negative favorability value, CULTn, ECONn, SOCn, IAn, FAn, and TOURn. Figure 2 provides an example of the quar-terly dynamics in ECONp, ECON0, and ECONn series from the ECON category. The financial crisis of August 1998 (Quarter 27) is clearly visible in ECONn.
ResultsThe choice of dependent and independent variables for tourism demand model was determined based on relevant consumption and consumer behavior theories (Deaton and Muellbauer 1980; Uysal 1983), previous tourism demand
studies (Li, Song, and Witt 2005; Lim 1997; Song and Witt 2000; Witt and Witt 1995), and data availability. Determinants of tourism demand used in previous research are (1) socioeconomic and demographic factors such as population, income in the origin country, leisure time, education, or occupation; (2) price factors, such as con-sumer price indices, exchange rates, and transportation cost; and (3) qualitative factors like tourist appeal, image, marketing, and promotion (Dwyer, Forsyth, and Rao 2000). Lim (1997) surveyed 100 studies of international tourism demand and found that the most widely used explanatory variables were income, relative prices, and transportation costs. Crouch (1994) finds support for the argument that income is the most important explanatory variable in tourism demand research. As for price effects, Crouch (1994) argues that “economic theory ensures that price must be included in any demand study, but for the study of tourism, the issue of price is particularly vexa-tious” (p. 13). Most economic studies have used the single-equation methodology to explain tourism demand, usually at the national level (Crouch 1994; Johnson and Ashworth 1990; Lim 1997).
The initial model specification was ARR = F(IN, PR, EX, Q, DDII), with F being a linear function. Economic time series were obtained from the Economic Intelligence Unit (EIU) CountryData database (https://eiu.bvdep.com). The variables are described below.
–35
–30
–25
–20
–15
–10
–5
0
5
10
15
1 3 5 7 9 11 13 15 17 19 21 23 25 27 29 31 33 35 37 39 41 43 45 47 49 51 53 55 57 59 61 63
Quarterly Periods
Nu
mb
er o
f A
rtic
les
neutral news
positive news
negative newsQuarter 27: July-September 1998
Figure 2. Quarterly dynamics of news: Economic Development category
at UNIV OF NORTH DAKOTA on March 7, 2011jtr.sagepub.comDownloaded from

Stepchenkova and Eales 207
Quarterly tourist arrivals (ARR). The data were acquired from the U.K. National Statistics Office; electronic data for Russia goes back as far as 1993, and, at the time of this study, the latest available data point was the fourth quarter of Year 2007. The data are based on a random sampling of 1 of 500 international travelers in points of departures such as international airports and ports. Both total and leisure arrivals were used in this research. Leisure arrivals (ARR_L) were calculated as the sum of holiday tourists, those visiting family and relatives (VFR), and other tourist categories. The total arrivals (ARR_T) is the sum of leisure and business arrivals. Both were measured in thousands of visitors per quarter.
Income in the United Kingdom (IN). Income mea-sures are generally not available on a quarterly or monthly basis; therefore, it was decided to use average wage in the United Kingdom as an ap-proximation for the income variable. The average real wage index (IN, 2005 = 100) was chosen.
Price (PR). The price variable includes prices of tourist services for which no single index is wholly adequate. Russia’s Consumer Price Index (PR_rus, 2005 = 100) series was selected as a proxy for the Russian tourism price variable.
Exchange rates (EX). National currency per U.S. dol-lar quarterly series (XRPD) for Russia (EX_rus) and the United Kingdom (EX_uk) were obtained.
The data were quarterly averages. In the first quar-ter of Year 1998, the devaluation of the ruble took place: 1,000 old rubles became one new ruble.
Seasonality (Q2, Q3, and Q4). To capture seasonal variations in travel, quarterly dummy variables were included in the model, with quarter 1 (Janu-ary–March) being suppressed.
Media messages (DDII series). DDII series obtained as quantification of volume and favorability of media messages with respect to Russia were also included in the model. DDII series were included to represent how Russia’s image affects the U.K. travel market.
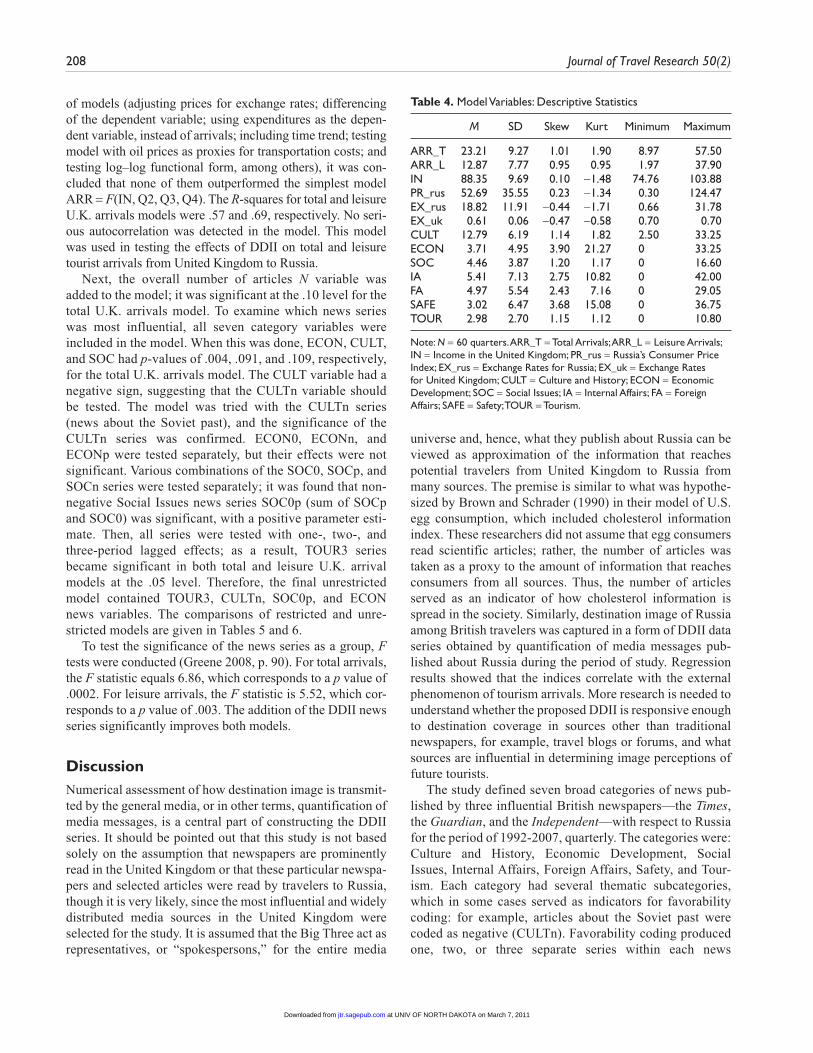
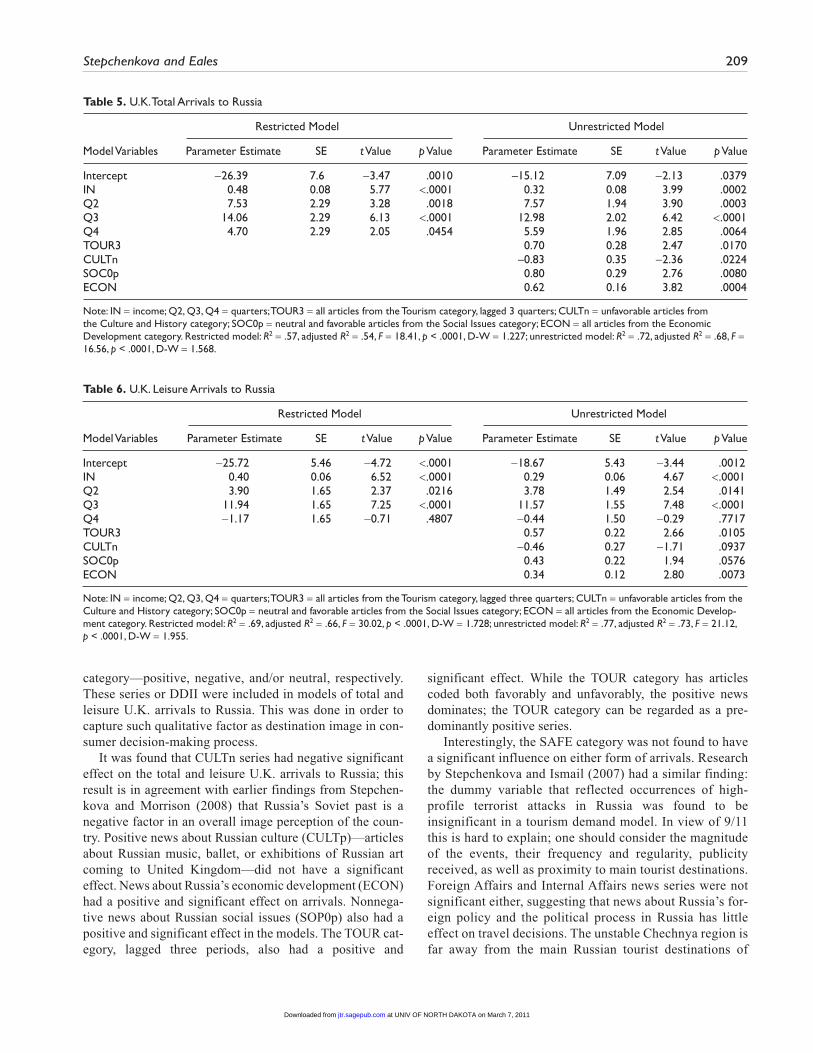
Descriptive statistics of the variables are given in Table 4. Figure 3 provides the graphs of Total and Leisure U.K. arrivals to Russia.
Initial estimates of the model of arrivals as determined by income, prices, exchange rates, and seasonal dummies were disappointing. Both the price and exchange rate variables had unexpected signs, income was positive but insignificant, while the second and third quarters were positive and signifi-cant. Indications of multicollinearity involving the income, price, and exchange rate variables were detected; applying first difference and one lag period to the income variable reduced the effect of multicollinearity, but attempts to remove unexpected signs through transformations of the variables were not successful. Having considered and tested a variety
0
10
20
30
40
50
60
70
Time Period (in quarters)
Arr
ival
s (i
n t
ho
usa
nd
s)
Total
Leisure
1 3 5 7 9 11 13 15 17 19 21 23 25 27 29 31 33 35 37 39 41 43 45 47 49 51 53 55 57 59
Figure 3. Total and Leisure U.K. arrivals to Russia: 1993-2007
at UNIV OF NORTH DAKOTA on March 7, 2011jtr.sagepub.comDownloaded from
208 Journal of Travel Research 50(2)
of models (adjusting prices for exchange rates; differencing of the dependent variable; using expenditures as the depen-dent variable, instead of arrivals; including time trend; testing model with oil prices as proxies for transportation costs; and testing log–log functional form, among others), it was con-cluded that none of them outperformed the simplest model ARR = F(IN, Q2, Q3, Q4). The R-squares for total and leisure U.K. arrivals models were .57 and .69, respectively. No seri-ous autocorrelation was detected in the model. This model was used in testing the effects of DDII on total and leisure tourist arrivals from United Kingdom to Russia.
Next, the overall number of articles N variable was added to the model; it was significant at the .10 level for the total U.K. arrivals model. To examine which news series was most influential, all seven category variables were included in the model. When this was done, ECON, CULT, and SOC had p-values of .004, .091, and .109, respectively, for the total U.K. arrivals model. The CULT variable had a negative sign, suggesting that the CULTn variable should be tested. The model was tried with the CULTn series (news about the Soviet past), and the significance of the CULTn series was confirmed. ECON0, ECONn, and ECONp were tested separately, but their effects were not significant. Various combinations of the SOC0, SOCp, and SOCn series were tested separately; it was found that non-negative Social Issues news series SOC0p (sum of SOCp and SOC0) was significant, with a positive parameter esti-mate. Then, all series were tested with one-, two-, and three-period lagged effects; as a result, TOUR3 series became significant in both total and leisure U.K. arrival models at the .05 level. Therefore, the final unrestricted model contained TOUR3, CULTn, SOC0p, and ECON news variables. The comparisons of restricted and unre-stricted models are given in Tables 5 and 6.
To test the significance of the news series as a group, F tests were conducted (Greene 2008, p. 90). For total arrivals, the F statistic equals 6.86, which corresponds to a p value of .0002. For leisure arrivals, the F statistic is 5.52, which cor-responds to a p value of .003. The addition of the DDII news series significantly improves both models.
DiscussionNumerical assessment of how destination image is transmit-ted by the general media, or in other terms, quantification of media messages, is a central part of constructing the DDII series. It should be pointed out that this study is not based solely on the assumption that newspapers are prominently read in the United Kingdom or that these particular newspa-pers and selected articles were read by travelers to Russia, though it is very likely, since the most influential and widely distributed media sources in the United Kingdom were selected for the study. It is assumed that the Big Three act as representatives, or “spokespersons,” for the entire media
universe and, hence, what they publish about Russia can be viewed as approximation of the information that reaches potential travelers from United Kingdom to Russia from many sources. The premise is similar to what was hypothe-sized by Brown and Schrader (1990) in their model of U.S. egg consumption, which included cholesterol information index. These researchers did not assume that egg consumers read scientific articles; rather, the number of articles was taken as a proxy to the amount of information that reaches consumers from all sources. Thus, the number of articles served as an indicator of how cholesterol information is spread in the society. Similarly, destination image of Russia among British travelers was captured in a form of DDII data series obtained by quantification of media messages pub-lished about Russia during the period of study. Regression results showed that the indices correlate with the external phenomenon of tourism arrivals. More research is needed to understand whether the proposed DDII is responsive enough to destination coverage in sources other than traditional newspapers, for example, travel blogs or forums, and what sources are influential in determining image perceptions of future tourists.
The study defined seven broad categories of news pub-lished by three influential British newspapers—the Times, the Guardian, and the Independent—with respect to Russia for the period of 1992-2007, quarterly. The categories were: Culture and History, Economic Development, Social Issues, Internal Affairs, Foreign Affairs, Safety, and Tour-ism. Each category had several thematic subcategories, which in some cases served as indicators for favorability coding: for example, articles about the Soviet past were coded as negative (CULTn). Favorability coding produced one, two, or three separate series within each news
Table 4. Model Variables: Descriptive Statistics
M SD Skew Kurt Minimum Maximum
ARR_T 23.21 9.27 1.01 1.90 8.97 57.50ARR_L 12.87 7.77 0.95 0.95 1.97 37.90IN 88.35 9.69 0.10 -1.48 74.76 103.88PR_rus 52.69 35.55 0.23 -1.34 0.30 124.47EX_rus 18.82 11.91 -0.44 -1.71 0.66 31.78EX_uk 0.61 0.06 -0.47 -0.58 0.70 0.70CULT 12.79 6.19 1.14 1.82 2.50 33.25ECON 3.71 4.95 3.90 21.27 0 33.25SOC 4.46 3.87 1.20 1.17 0 16.60IA 5.41 7.13 2.75 10.82 0 42.00FA 4.97 5.54 2.43 7.16 0 29.05SAFE 3.02 6.47 3.68 15.08 0 36.75TOUR 2.98 2.70 1.15 1.12 0 10.80
Note: N = 60 quarters. ARR_T = Total Arrivals; ARR_L = Leisure Arrivals; IN = Income in the United Kingdom; PR_rus = Russia’s Consumer Price Index; EX_rus = Exchange Rates for Russia; EX_uk = Exchange Rates for United Kingdom; CULT = Culture and History; ECON = Economic Development; SOC = Social Issues; IA = Internal Affairs; FA = Foreign Affairs; SAFE = Safety; TOUR = Tourism.
at UNIV OF NORTH DAKOTA on March 7, 2011jtr.sagepub.comDownloaded from
Stepchenkova and Eales 209
category—positive, negative, and/or neutral, respectively. These series or DDII were included in models of total and leisure U.K. arrivals to Russia. This was done in order to capture such qualitative factor as destination image in con-sumer decision-making process.
It was found that CULTn series had negative significant effect on the total and leisure U.K. arrivals to Russia; this result is in agreement with earlier findings from Stepchen-kova and Morrison (2008) that Russia’s Soviet past is a negative factor in an overall image perception of the coun-try. Positive news about Russian culture (CULTp)—articles about Russian music, ballet, or exhibitions of Russian art coming to United Kingdom—did not have a significant effect. News about Russia’s economic development (ECON) had a positive and significant effect on arrivals. Nonnega-tive news about Russian social issues (SOP0p) also had a positive and significant effect in the models. The TOUR cat-egory, lagged three periods, also had a positive and
significant effect. While the TOUR category has articles coded both favorably and unfavorably, the positive news dominates; the TOUR category can be regarded as a pre-dominantly positive series.
Interestingly, the SAFE category was not found to have a significant influence on either form of arrivals. Research by Stepchenkova and Ismail (2007) had a similar finding: the dummy variable that reflected occurrences of high-profile terrorist attacks in Russia was found to be insignificant in a tourism demand model. In view of 9/11 this is hard to explain; one should consider the magnitude of the events, their frequency and regularity, publicity received, as well as proximity to main tourist destinations. Foreign Affairs and Internal Affairs news series were not significant either, suggesting that news about Russia’s for-eign policy and the political process in Russia has little effect on travel decisions. The unstable Chechnya region is far away from the main Russian tourist destinations of
Table 6. U.K. Leisure Arrivals to Russia
Restricted Model Unrestricted Model
Model Variables Parameter Estimate SE t Value p Value Parameter Estimate SE t Value p Value
Intercept -25.72 5.46 -4.72 <.0001 -18.67 5.43 -3.44 .0012IN 0.40 0.06 6.52 <.0001 0.29 0.06 4.67 <.0001Q2 3.90 1.65 2.37 .0216 3.78 1.49 2.54 .0141Q3 11.94 1.65 7.25 <.0001 11.57 1.55 7.48 <.0001Q4 -1.17 1.65 -0.71 .4807 -0.44 1.50 -0.29 .7717TOUR3 0.57 0.22 2.66 .0105CULTn -0.46 0.27 -1.71 .0937SOC0p 0.43 0.22 1.94 .0576ECON 0.34 0.12 2.80 .0073
Note: IN = income; Q2, Q3, Q4 = quarters; TOUR3 = all articles from the Tourism category, lagged three quarters; CULTn = unfavorable articles from the Culture and History category; SOC0p = neutral and favorable articles from the Social Issues category; ECON = all articles from the Economic Develop-ment category. Restricted model: R2 = .69, adjusted R2 = .66, F = 30.02, p < .0001, D-W = 1.728; unrestricted model: R2 = .77, adjusted R2 = .73, F = 21.12, p < .0001, D-W = 1.955.
Table 5. U.K. Total Arrivals to Russia
Restricted Model Unrestricted Model
Model Variables Parameter Estimate SE t Value p Value Parameter Estimate SE t Value p Value
Intercept -26.39 7.6 -3.47 .0010 –15.12 7.09 -2.13 .0379IN 0.48 0.08 5.77 <.0001 0.32 0.08 3.99 .0002Q2 7.53 2.29 3.28 .0018 7.57 1.94 3.90 .0003Q3 14.06 2.29 6.13 <.0001 12.98 2.02 6.42 <.0001Q4 4.70 2.29 2.05 .0454 5.59 1.96 2.85 .0064TOUR3 0.70 0.28 2.47 .0170CULTn –0.83 0.35 -2.36 .0224SOC0p 0.80 0.29 2.76 .0080ECON 0.62 0.16 3.82 .0004
Note: IN = income; Q2, Q3, Q4 = quarters; TOUR3 = all articles from the Tourism category, lagged 3 quarters; CULTn = unfavorable articles from the Culture and History category; SOC0p = neutral and favorable articles from the Social Issues category; ECON = all articles from the Economic Development category. Restricted model: R2 = .57, adjusted R2 = .54, F = 18.41, p < .0001, D-W = 1.227; unrestricted model: R2 = .72, adjusted R2 = .68, F = 16.56, p < .0001, D-W = 1.568.
at UNIV OF NORTH DAKOTA on March 7, 2011jtr.sagepub.comDownloaded from

210 Journal of Travel Research 50(2)
Moscow and Saint Petersburg, which may help to explain why the disturbing news about military conflict there has no effect on arrivals. However, the reliability of coding for these two categories was the lowest, which might also explain their lack of significance.
Results show that the proposed DDII has potential to better explain tourist behavior. However, not all DDII news categories were significant factors in explaining the U.K. arrivals to Russia. Prior to this study, the authors hypothe-sized that articles about disasters, terrorist attacks, and political unrest (SAFE category) would influence tourist behavior and prevent travelers from going to a destination. Culture and history was regarded by the authors as almost permanent features of a destination; they can be revoked or reinforced by media coverage but not significantly changed. Thus, perceptions of these destination attributes were antic-ipated to play a lesser role in behavior. However, neither of these hypotheses was substantiated. More studies are needed to clarify the level of influence of various news cat-egories and their possible convergence into a single index, as was done in an exploratory study for destination Aruba (Stepchenkova 2009).
From a methodological standpoint, assessing favorability can have different results, depending on the content analysis parameters, that is, on sampling and recording units. Holsti (1969, p. 120) demonstrated that when newspaper editorials are coded according to the frequency of favorable and unfa-vorable assertions made about a specific issue, then, if the recording unit is a single assertion, articles can be only some-what or largely on one side or the other. However, if the entire article serves as a recording unit, that is, if the whole text is classified pro or con, this distinction will be lost. In this study, the whole article was coded as either favorable or unfavor-able in one of seven categories; thus, the method rests on the premise that the impact of pervasive messages is the overall impression created. In addition, favorability assess-ment, although sufficiently reliable in this study, reflects the researchers’ readings of the attitudes expressed in media mes-sages. How these messages are processed by potential visitors to the destination, what perceptions of the destination they are contributing to, and how these perceptions translate into behavior are different questions and need to be addressed in more detail in future studies.
The selecting of single articles as a recording unit was limiting in another way, as well. There were cases when a single article could have been classified into different cat-egories. This mostly happened with the long articles that touched on several topics when reporting news about Russia. In these cases, the researcher had to decide what the dominant topic was in order to code the article. While content analysis researchers generally agree that a single article is the least reliable recording unit (Holsti 1969; Krippendorff 2004), this choice was dictated by the extremely large amount of textual data, as well as a wide
range of topics with respect to Russia. In general, greater precision leads to increased costs of analysis, and the researcher must decide how fine the distinctions that need to be made in order to satisfactorily answer the research questions. Another limitation is that the final news series used in the model are obtained by extrapolation of the coding results made on a subsample of 20 articles from each quarter. While this approach saves time and effort, it is not immune to error. The more categories of news the researcher is dealing with, the larger is the possibility for error in the extrapolation process.
In the process of data selection and coding, the research-ers did not distinguish between organic and induced materials (Gartner 1993) published in the Big Three. While the organic publications clearly prevailed, in the travel sections there were articles that could have been considered as marketing driven. The processing and public attitudes to different types of publications differ, and future research is needed to assess the comparative power of organic and induced media mes-sages with respect to their influence on travel decisions.
From a practical perspective, the DDII extends to model-ing and, ultimately, forecasting tourism demand. Another possible use for the DDII is to estimate the effectiveness of promotional campaigns in the target markets: the effect of messages that a destination marketing organization (DMO) transmits can be assessed by, for example, studying materials from Internet travel forums and blogs to assess how visitors describe the destination, whether frequency and favorability of mention increase, and whether images that DMO creates are “catching up.” However, practical relevance of the DDII for destinations’ DMOs can be jeopardized by a time-consuming process of constructing the DDII series. Among the factors that can slow down the adoption of the approach is absence of readily available standardized categories for coding that would be suitable for each and every destina-tion–market pair of countries. In Stepchenkova (2009), the DDII approach was successfully applied to Aruba, a destina-tion that is different from Russia in almost all aspects; moreover, the category set for Aruba was different. The fact that the coding process is done “by hand” is another factor that can prevent adoption of the DDII concept. Therefore, feasibility of computer-assisted methodology for construct-ing DDII series is an important issue to investigate.
To summarize, the study proposes quantification of media messages in a form of dynamic time series, or DDII series that are based on a content analysis methodology and have precursors in earlier social science and econometrics research. The indices reflect volumes and topics of news published about the destination in a particular country and favorability of coverage. The indices are dynamic, since they reflect changes in media coverage from one period to another and summarize the wealth of media materials to a limited number of time series. They can be obtained for any origin–destination pair of countries in the form of weekly, monthly,
at UNIV OF NORTH DAKOTA on March 7, 2011jtr.sagepub.comDownloaded from

Stepchenkova and Eales 211
quarterly, or annual time series. As far as the authors know, this is the first study that incorporates quantified media mes-sages into models of tourism demand. Practical relevance of the approach can potentially be extended to modeling tourist arrivals and forecasting, as well as monitoring the image in different target markets and assessing the effectiveness of the promotional campaigns.
Declaration of Conflicting Interests
The authors declared no conflicts of interests with respect to the authorship and/or publication of this article.
Funding
The authors received no financial support for the research and/or authorship of this article.
References
Ajzen, I., and B. L. Driver (1992). “Application of the Theory of Planned Behavior to Leisure Choice.” Journal of Leisure Research, 24 (3): 207-24.
Bettman, J. R., M. F. Luce, and J. W. Payne (1998). “Constructive Consumer Choice Processes.” Journal of Consumer Research, 25 (3): 187-217.
Brester, G. W., and T. C. Schroeder (1995). “The Impacts of Brand and Generic Advertising on Meat Demand.” American Journal of Agricultural Economics, 77 (4): 969-79.
Brown, D. J., and L. F. Schrader (1990). “Cholesterol Information and Shell Egg Consumption.” American Journal of Agricultural Economics, 72 (3): 548-55.
Chang, H.-S., and H. W. Kinnucan (1991). “Advertising, Informa-tion, and Product Quality: The Case of Butter.” American Jour-nal of Agricultural Economics, 73 (4): 1195-1203.
Cohen, J. (1960). “A Coefficient of Agreement for Nominal Scales.” Educational and Psychological Measurement, 20: 37-46.
Cohen, J. B., and C. S. Areni (1991). “Affect and Consumer Behavior.” In Handbook of Consumer Behavior, edited by T. S. Robertson and H. H. Kassarjian. Englewood Cliff, NJ: Prentice Hall, pp. 188-240.
Crompton, J. L. (1979). “An Assessment of the Image of Mexico as a Vacation Destination and the Influence of Geographical Location upon That Image.” Journal of Travel Research, 17 (4): 18-23.
Crouch, G. I. (1994). “The Study of International Tourism Demand: A Survey of Practice.” Journal of Travel Research, 32: 41-55.
Danielson, W. A., and D. L. Lasorsa (1997). “Perceptions of Social Change: 100 Years of Front-Page Content on the New York Times and the Los Angeles Times.” In Text Analysis for the Social Sci-ences: Methods for Drawing Statistical Inferences from Texts and Transcripts, edited by C. W. Roberts. Mahwah, NJ: Law-rence Erlbaum, pp. 103-16.
Danielson, W. A., D. L. Lasorsa, and D. S. Im (1992). “Journalists and Novelists: A Study of Divergent Styles.” Journalism Quar-terly, 69: 436-46.
Deacon, D. (2007). “Yesterday’s Papers and Today’s Technology Digital Newspaper Archives and ‘Push Button’ Content Analy-sis.” European Journal of Communication, 22: 5-25.
Deaton, A., and J. Muellbauer (1980). “An Almost Ideal Demand System.” American Economic Review, 70 (3): 132-326.
Dwyer, L., P. Forsyth, and P. Rao (2000). “The Price Competitive-ness of Travel and Tourism: A Comparison of 19 Destinations.” Tourism Management, 21 (1): 9-22.
Eagly, A. H., and S. Chaiken (1993). The Psychology of Attitudes. Fort Worth, TX: Harcourt Brace College.
Echtner, C. M., and J. R. B. Ritchie (1993). “The Measurement of Destination image: An Empirical Assessment.” Journal of Travel Research, 31 (4): 3-13.
Engel, J. F., R. D. Blackwell, and P. W. Miniard (1995). Consumer Behavior, 8th edition. Fort Worth, TX: Dryden Press.
Flesch, R. (1951). How to Test Readability. New York: Harper and Row.
Fodness, D., and B. Murray (1997). “Tourist Information Search.” Annals of Tourism Research, 24 (3): 503-23.
Fodness, D., and B. Murray (1998). “A Typology of Tourist Infor-mation Search Strategies.” Journal of Travel Research, 37 (2): 108-19.
Gartner, W. C. (1993). “Image Formation Process.” Journal of Travel and Tourism Marketing, 2 (3): 191-216.
Gerbner, G., L. Gross, N. Signorielly, M. Morgan, and M. Jackson-Beeck (1979). Violence Profile No. 10: Trends in Network Television Drama and Viewer Conceptions of Social Reality, 1967-1978. Philadelphia: University of Pennsylvania, Annenberg School of Communications.
Glaser, B. G., and A. L. Strauss (1967). The Discovery of Grounded Theory: Strategies for Qualitative Research. Chicago, IL: Aldine.
Green, R. D., H. F. Carman, and K. McManus (1991). “Some Empirical Methods of Estimating Advertising Effects in Demand Systems: An Application to Dried Fruits.” Western Journal of Agricultural Economics, 16 (1): 63-71.
Greene, W. H. (2008). Econometric Analysis, 6th edition. Engle-wood Cliff, NJ: Prentice Hall.
Holsti, O. R. (1969). Content Analysis for the Social Sciences and Humanities. Reading, MA: Addison-Wesley.
Johnson, P., and J. Ashworth (1990). “Modelling Tourism Demand: A Summary Review.” Leisure Studies, 9 (2): 145-61.
Kinnucan, H. W., H. Xiao, C.-J. Hsia, and J. D. Jackson (1997). “Effects of Health Information and Generic Advertising on U.S. Meat Demand.” American Journal of Agricultural Economics, 79 (2): 13-23.
Krendel, E. S. (1970). “A Case Study of Citizen Complaints as Social Indicators.” IEEE Transactions on Systems Science and Cybernetics, 6: 267-72.
Krippendorff, K. (2004). Content Analysis: An Introduction to Its Methodology, 2nd edition. Thousand Oaks, CA: Sage.
Landis, J. R., and G. G. Koch (1977). “The Measurement of Observer Agreement for Categorical Data.” Biometrics, 33: 159-74.
Lasswell, H. D., D. Lerner, and I. d. S. Pool (1952). The Compara-tive Study of Symbols. Stanford, CA: Stanford University Press.
Li, G., H. Song, and S. F. Witt (2005). “Recent Developments in Econometric Modeling and Forecasting.” Journal of Travel Research, 44 (2): 82-99.
at UNIV OF NORTH DAKOTA on March 7, 2011jtr.sagepub.comDownloaded from

212 Journal of Travel Research 50(2)
Lim, C. (1997). “Review of International Tourism Demand Models.” Annals of Tourism Research, 24 (4): 835-49.
Mahl, G. F. (1959). “Exploring Emotional States by Content Anal-ysis.” In Trends in Content Analysis, edited by I. d. S. Pool. Urbana: University of Illinois Press, pp. 89-130.
Mayo, E. J., and L. P. Jarvis (1981). The Psychology of Leisure Travel. Boston: CBI.
McClelland, D. C. (1958). “The Use of Measures of Human Moti-vation in the Study of Society.” In Motives in Fantasy, Action and Society, edited by J. W. Atkinson. Princeton, NJ: D. Van Nostrand, pp. 518-52.
Menzel, H., and E. Katz (1955). “Social Relations and Innovation in the Medical Profession: The Epidemiology of a New Drug.” Public Opinion Quarterly, 19 (4): 337-52.
Merritt, R. L. (1966). Symbols of American Community, 1735-1775. New Haven, CT: Yale University Press.
Mizerski, R. W. (1982). “An Attribution Explanation of the Dis-proportionate Influence of Unfavorable Information.” Journal of Consumer Research, 9: 301-10.
Moutinho, L. (1987). “Consumer Behavior in Tourism.” European Journal of Marketing, 21 (10): 3-44.
Namenwirth, J. Z. (1969). “Marks of Distinction: A Content Analy-sis of British Mass and Prestige Newspaper Editorials.” Ameri-can Journal of Sociology, 74: 343-60.
Namenwirth, J. Z. (1973). “The Wheels of Time and the Interde-pendence of Value Change.” Journal of Interdisciplinary His-tory, 3: 649-83.
Neuendorf, K. A. (2002). The Content Analysis Guidebook. Thou-sand Oaks, CA: Sage.
Osgood, C. E., G. J. Suci, and P. H. Tannenbaum (1957). The Measurement of Meaning. Champaign: University of Illinois Press.
Raitz, K., and M. Dakhil (1989). “A Note about Information Sources for Preferred Recreational Environments.” Journal of Travel Research, 27: 45-50.
Rapoport, A. (1969). “A System-Theoretic View of Content Analysis.” In The Analysis of Communication Content: Developments in Sci-entific Theories and Computer Techniques, edited by G. Gerbner, O. R. Holsti, K. Krippendorff, W. J. Paisley, and P. J. Stone. New York: John Wiley, pp. 17-38.
Reynolds, F. D., and W. R. Darden (1972). “Why the Midi Failed.” Journal of Advertising Research, 12: 39-46.
Rogers, E. M. (1962). Diffusions of Innovations. New York: Free Press of Glencoe.
Schmoll, G. A. (1977). Tourism Promotion. London: Tourism Inter-national Press.
Schul, P., and J. L. Crompton (1983). “Search Behavior of Inter-national Vacationers: Travel-Specific Lifestyle and Sociodemo-graphic Variables.” Journal of Travel Research, 21: 23-31.
Sirakaya, E., and A. G. Woodside (2005). “Building and Testing Theories of Decision-Making by Travelers.” Tourism Manage-ment, 26: 815-32.
Snepenger, D., K. Meged, M. Snelling, and K. Worral (1990). “Information Search Strategies by Destination-Naïve Tourists.” Journal of Travel Research, 29: 13-16.
Song, H., and S. F. Witt (2000). Tourism Demand Modeling and Fore-casting: Modern Econometric Approaches. Oxford: Pergamon.
Song, H., S. F. Witt, and T. C. Jensen (2002). “Tourism Forecasting: Accuracy of Alternative Econometric Models.” International Journal of Forecasting, 19 (1): 123-41.
Stepchenkova, S. (2009). A Proposal for a Dynamic Destination Image Index: Concept, Construction, and Validation. Doctoral dissertation, Purdue University, West Lafayette, IN.
Stepchenkova, S., and J. A. Ismail (2007). “China and Russia: Sub-stitutes or complements?” In The 12th Annual Hospitality and Tourism Graduate Student Education and Research Conference Proceedings, Vol. XII, Advances in Hospitality and Tourism Research. Houston TX, January 4-6, 2007, pp. 939-48.
Stepchenkova, S., and A. M. Morrison (2006). “The Destination Image of Russia: From the Online Induced Perspective.” Tour-ism Management, 27 (5): 943-56.
Stepchenkova, S., and A. M. Morrison (2008). “Russia’s Desti-nation Image among American Pleasure Travelers: Revisiting Echtner and Ritchie.” Tourism Management, 29 (3): 548-60.
Tversky, A., and D. Kahneman (1974). “Judgment under Uncer-tainty: Heuristics and Biases.” Science, 185 (4157): 1124-31.
Uysal, M. (1983). Construction of a Model Which Investigates the Impact of Selected Variables on International Tourist Flows to Turkey. Doctoral Dissertation, Texas A&M University, College Station, TX.
Wahab, S., L. J. Crompton, and L. M. Rothfield (1976). Tourism Marketing. London: Tourism International Press.
Weinberger, M. C., C. T. Allen, and W. R. Dillon (1981). “Negative Information: Perspectives and Research Directions.” In Advances in Consumer Research, Vol. 8, edited by K. B. Monroe. Ann Arbor, MI: Association for Consumer Research, pp. 398-404.
Wells, R. A., and E. G. King (1994). “Prestige Newspaper Cover-age of Foreign Affairs in the 1990 Congressional Campaign.” Journalism Quarterly, 71: 652-64.
Witt, S. F., and C. A. Witt (1995). “Forecasting Tourism Demand: A Review of Empirical Research.” International Journal of Fore-casting, 11 (3): 447-75.
Wright, P. (1974). “The Harassed Decision-Maker: Time Pressures, Distractions, and the Use of Evidence.” Journal of Applied Psy-chology, 59 (5): 555-61.
Bios
Svetlana Stepchenkova, PhD, is an assistant professor in the depart-ment of tourism, recreation and sport management, College of Health and Human Performance, University of Florida, Gainesville.
James S. Eales is a professor in the department of agricultural eco-nomics, College of Agriculture, Purdue University, West Lafayette, Indiana.
at UNIV OF NORTH DAKOTA on March 7, 2011jtr.sagepub.comDownloaded from