journal of transport geography - connecting … · (mcminn et al., 2011) and in australia (kite and...
TRANSCRIPT

This is the author’s version of a work that was submitted/accepted for pub-lication in the following source:
Kamruzzaman, Md. & Hine, Julian (2013) Self-proxy agreement andweekly school travel behaviour in a sectarian divided society. Journal ofTransport Geography, 29, pp. 74-85.
This file was downloaded from: http://eprints.qut.edu.au/56802/
c© Copyright 2013 Elsevier
This is the author’s version of a work that was accepted for publicationin Journal of Transport Geography. Changes resulting from the pub-lishing process, such as peer review, editing, corrections, structural for-matting, and other quality control mechanisms may not be reflected inthis document. Changes may have been made to this work since itwas submitted for publication. A definitive version was subsequentlypublished in Journal of Transport Geography, [VOL 29, (2013)] DOI:10.1016/j.jtrangeo.2013.01.002
Notice: Changes introduced as a result of publishing processes such ascopy-editing and formatting may not be reflected in this document. For adefinitive version of this work, please refer to the published source:
http://dx.doi.org/10.1016/j.jtrangeo.2013.01.002

Self-proxy agreement and weekly school travel behaviour in a sectarian
divided society
Md. Kamruzzamana 1
, Julian Hineb
a School of Civil Engineering and the Built Environment, Queensland University of Technology, 2
George Street, Brisbane, Queensland, Australia.
b School of the Built Environment, University of Ulster, Shore Road, Newtownabbey, County Antrim,
BT37 0QB, Northern Ireland, UK.
Abstract Proxy reports from parents and self-reported data from pupils have often been used interchangeably
to identify factors influencing school travel behaviour. However, few studies have examined the
validity of proxy reports as an alternative to self-reported data. In addition, despite research that has
been conducted in a different context, little is known to date about the impact of different factors on
school travel behaviour in a sectarian divided society. This research examines these issues using
1624 questionnaires collected from four independent samples (e.g. primary pupils, parent of primary
pupils, secondary pupils, and parent of secondary pupils) across Northern Ireland. An independent
sample t test was conducted to identify the differences in data reporting between pupils and parents
for different age groups using the reported number of trips for different modes as dependent
variables. Multivariate multiple regression analyses were conducted to then identify the impacts of
different factors (e.g. gender, rural-urban context, multiple deprivations, and school management
type, net residential density, land use diversity, intersection density) on mode choice behaviour in this
context. Results show that proxy report is a valid alternative to self-reported data, but only for primary
pupils. Land use diversity and rural-urban context were found to be the most important factors in
influencing mode choice behaviour.
Keywords:
School travel behaviour; Self-proxy agreement; Convergent validity; Multivariate analysis; Sectarian
division; Northern Ireland
1 Corresponding author. Tel.: +61 (0)7 3138 2510; fax: +61 (0)7 3138 1170. E-mail addresses: [email protected]
(Md. Kamruzzaman), [email protected] (Julian Hine).
Title Page (WITH Author Details)Click here to view linked References

Research highlights
Parental proxy reports are a valid instrument of data collection for primary school pupils but
not for secondary school pupils.
One unit increase in diversity level is expected to increase 10 walking trips for secondary
pupils and decrease 8 walking trips for primary pupils in a week.
Secondary pupils attending controlled schools are less likely to walk to and from secondary
schools in Northern Ireland.
*Research Highlights

1
1. Introduction
The increased rate of car trips to and from schools, at the expense of active commuting, has
underpinned the growth of research on active commuting since the late 1990s. This paradigm shift in
school transport research is due to the association with multiple policy issues such as health (e.g.
obesity, safety), economy and environment (e.g. congestion), and personal development (e.g.
enhancement of spatial and social knowledge) (DiGuiseppi et al., 1998; Fyhri and Hjorthol, 2009;
Fyhri et al., 2011; Hinckson et al., 2011; Joshi et al., 1999; Yeung et al., 2008). As a result, efforts
have been made to identify factors that reinforce active commuting to school. However, this
resurgence has also led transport researchers to rely more on the use of proxy reports from parents
for various reasons (e.g. perceived inability of pupils to provide self-report, ethical consideration).
Despite the reliance on proxy reports, few studies to date have examined the validity of proxy reports
used in the identification of school travel behaviour (Evenson et al., 2008; McDonald et al., 2011;
McMinn et al., 2011; Mendoza et al., 2010; Rowe et al., 2010).
Proxy reports have been gathered using different types of survey instruments including
questionnaires (Fyhri and Hjorthol, 2009; Joshi et al., 1999; Schlossberg et al., 2006; Yeung et al.,
2008), travel diary surveys (Fyhri and Hjorthol, 2009; Mitra et al., 2010), interviews (Faulkner et al.,
2010), and focus groups (Christie et al., 2011; Lang et al., 2011). Although proxy reports have been
used to identify school travel behaviour for both primary (Joshi et al., 1999; Yeung et al., 2008), and
secondary pupils (Fyhri and Hjorthol, 2009; Schlossberg et al., 2006); most of the studies that aimed
at validating the use of proxy reports in school transport have focused on primary school children
only. Evidence in other research fields has shown that the validity level is much lower for secondary
age children (Harakeh et al., 2006). Moreover, validation studies to date are mostly found in the USA
(Evenson et al., 2008; McDonald et al., 2011; Mendoza et al., 2010), with a few exceptions in Europe
(McMinn et al., 2011) and in Australia (Kite and Wen, 2010). This, therefore, limits the external validity
and generalisation of the results globally given the contextual dependency of the validity of proxy
reports (Robitail et al., 2007). In addition, the results reported in different validation studies are not
conclusive, and sometimes conflict. For example, some studies identified a high level of validity of
proxy reports (McDonald et al., 2011; Mendoza et al., 2010); whereas others found a low level of
validity (Evenson et al., 2008; Rowe et al., 2010). Again, almost all of these studies used data
collected from parent-child dyads for the assessment of validity. Although the dyadic approach has a
long tradition and merits in validation, it is also subject to a number of weaknesses (e.g.
interdependency in reported data) (Kenny, 1996). As a result, the need for the confirmation of
validation results based on data from independent sample has been highlighted in the literature
(Smith et al., 2005; Smith et al., 2007).
Based on proxy reports or self-reports (or a combination of both), numerous studies have identified
factors affecting travel mode choice behaviour to schools (Davison et al., 2008; Sirard and Slater,
2008). These factors can be grouped into: a) individual/household characteristics (e.g. age, sex, car
ownership); b) school characteristics such as the availability of parking spaces, school participation in
*Blinded Manuscript (WITHOUT Author Details)

2
a specific programme (e.g. school travel plan – STP, safe routes to school – SRTS, walking school
bus – WSB, walk-to-school); c) neighbourhood characteristics (e.g. multiple deprivation, urban form);
and d) temporal characteristics (e.g. morning, afternoon). Despite the identification of a multiplicity of
factors that have influenced mode choice behaviour for school children, very little or no research has
investigated the relevance of these factors on school travel behaviour in a sectarian society. However,
sectarian division has been identified to have a strong role in influencing adult travel behaviour
(Community Relations Council for Northern Ireland, 2000; Goldhaber and Schnell, 2007).
Based on the above discussion, the objective of this research is twofold: first, to test the validity of
parental proxy reports for different age groups using data from independent samples in a sectarian
society; and second, to identify travel mode choice behaviour patterns of pupils at different ages in the
same context using Northern Ireland (NI) as a case study. A detail review of literature is conducted in
Section 2 focusing on both the psychometric properties (e.g. validity) of survey instruments and the
determinants of school travel behaviour. Section 3 justifies the rationale for choosing NI as a case
study. Section 4 discusses the data and methods employed in this research to reach the above
objectives. Results of this research and their interpretation are discussed in Section 5 and Section 6
concludes this research.
2. Literature review
2.1. Research on the evaluation of psychometric properties of proxy report
Although self-report by subjects has been identified as the most preferred method, researchers have
often relied on one person to inform them about the characteristics and behaviours of another person
(Agnihotri et al., 2010; Wagmiller, 2009). This reliance on proxy reports depends on many factors
including: a) the cost associated with obtaining data from all members in a group and the consequent
reliance on the ‘primary decision maker’ e.g. National Travel Survey in the UK; b) level of difficulty
associated with collecting data from those respondents who are unable to report reliably (e.g. infant)
or who are sometimes inaccessible; and c) the need to obtain confidential data which respondents do
not like to share (e.g. drink-driving behaviour) etc (Beck et al., 2012; Department for Transport, 2006;
Wagmiller, 2009). However, given that the proxy reports are obtained from a third person, they are
susceptible to bias and inaccuracies. Possible sources of bias include: halo effects (i.e. response
influenced by impression); acquiescence bias (i.e. tendency of ‘yea-saying’ such as ‘yes’, ‘true’ or
‘often’); framing effects (i.e. how the question is phrased); social desirability (i.e. faking good to give
socially acceptable answer); and end-aversion (i.e. tendency to avoid the end-points of a response
scale) (Smith et al., 2005). Inaccuracies imply that errors are made because of a lack of knowledge or
insufficient motivation to provide correct answers. For instance, a good relationship enables people to
gather information about each other and for that reason report more accurately. Similarly, people with
poor cognitive functioning have more difficulty providing accurate answers than those with good
cognitive abilities (Mandemakers and Dykstra, 2008). Although specific techniques exist to minimise a
particular bias (e.g. response scales based on specific, concrete behaviours, can help to reduce halo
effects), an assessment of the psychometric properties of different instruments used to collect proxy
data is a common practice.

3
The three main psychometric properties of a survey instrument are: reliability, validity and
responsiveness (Smith et al., 2005). Reliability is the degree to which an instrument is free from error,
produces stable, and repeatable results; and includes: internal consistency, test–retest reliability,
inter-rater reliability, and parallel forms reliability (i.e. agreement between two or more alternative
forms of the same measure e.g. short/long). Validity is the extent to which an instrument measures
what it is intended to measure. Researchers generally investigate three types of validity of proxy
report in different fields: content (i.e. content of an instrument is supported by the literature); criterion
related (i.e. reported data are valid against a ‘gold standard’); and construct validity. Construct validity,
again, can be classified into: convergent (agreement between similar measures), discriminate
(disagreement between dissimilar measures), and known group differences (ability to distinguish the
differences that are known between groups). Responsiveness is the degree to which an instrument is
able to detect significant change over time. Numerous studies have examined the psychometric
properties of proxy reports in various fields e.g. psychology (Smith et al., 2007), quality of life (Robitail
et al., 2007; Warner-Czyz et al., 2009), smoking behaviour (Harakeh et al., 2006), physical activity
(Gao et al., 2006), job satisfaction (Flannery et al., in press) and transport safety (McPeek et al.,
2011; Rosenbloom and Wultz, 2011). Although many of these studies have reported an acceptable
level of agreement, an opposite finding is also common in the literature (Ardon et al., 2012; Gao et al.,
2006; Telford et al., 2004).
The school transport literature mainly focuses on the evaluation of two psychometric properties of
proxy reports: reliability and validity. However, given the focus of this research, the paper reviews only
the validation of proxy reports of previous studies. McDonald et al. (2011) have assessed the validity
of a parental survey instrument as used in the SRTS programme in the USA against in-class student
tally data. This study used data from 262 parent-student dyads. The in-class tally data was collected
from two elementary schools in Charlotte. Using kappa statistics, this study found high convergent
validity (kappa>0.75). However, this study calls for the assessment of variability by mode as their
sample was heavily featured by motorised travellers. Mendoza et al. (2010) have also assessed the
validity of the SRTS travel survey instrument using data from 81 parent-student (4th grade) dyads in
Houston. Using kappa statistics, this study found high convergent validity (kappa = 0.87) in the
reported data. Evenson et al. (2008), on the other hand, have conducted a validity analysis of a new
survey instrument with 7 questions using weekly data collected from 28 parent-student (elementary
school) dyads in North California. This research employed two different measures for the assessment
of validity: kappa coefficient for categorical/nominal variables; and intraclass correlations coefficients
(ICC) for continuous variables. Although this study found relatively lower agreement on the total
number of walking trips made in a week (ICC = 0.55), other variables showed substantial agreement
between parent and child reports. The authors have mentioned that since both the student and
parental measures relied on self-report, so errors from these methods might be correlated. Forman et
al. (2008) have investigated the convergent validity a new instrument aiming to assess the barriers
(17 items) that youth encounter while walking to specific destinations. This study collected data from
189 parent-adolescent dyads in Boston, Cincinnati and San Diego. Using principle component
analysis of the items, this study identified 3 barrier sub-scales (e.g. environmental, psychological, and

4
safety). Validity assessment of the reported data has been conducted in these sub-scales for 3 types
of destinations (e.g. park, shop, and school). This study reported an initial evidence of validity of the
reported barriers (ICC: 0.69 – 0.73 for parks, 0.46 – 0.68 for shops, and 0.74 – 0.78 for school).
Apart from the above American studies, Kite and Wen (2010) have investigated the convergent
validity of proxy report (travel survey) in Sydney using data from 839 parent-student (primary) dyads.
Based on the reported total number of trips in a week by different mode, this study calculated
Spearman’s rho correlation coefficients for each mode. They found high validity for journey to school
by car (0.765), and walk (0.765); and journey from school by car (0.717), and walk (0.748). Weaker
correlations have been reported for public transport and other modes in this study. Stevenson (1996)
validated children’s (n=100) self-reported (interviews) exposure to traffic using two techniques in
Perth: ‘moving observer’ (a person observing the student while travelling); and pedestrian diaries.
Based on the findings from both measures, this study concluded that children’s self-reported ‘habitual
exposure’ data is a valid measure of his or her actual exposure in the road environment. Rowe et al.
(2010) conducted a convergent validity analysis of a questionnaire on walking to school in Scotland
which comprised of 14 variables. Using data from 115 parent-student (elementary) dyads, this study
found only a moderate correlations in the reported data between the instruments (r = 0.31). In another
study in Scotland, McMinn et al. (2011) investigated the criterion validity of a travel survey instrument.
They collected data on time spent walking to and from school using the travel diary which was
assessed against pedometer data (i.e. a gold standard) collected from the students. This work found
no significant difference in the reported data between instruments.
The above review confirms the weakness of previous studies as identified in Section 1. The reviews
also verify that parental proxy report is a valid alternative to the collection of data for
elementary/primary school children globally with only a few exceptions. The validity of self-reported
data against a gold standard signifies that primary school children are able to report their travel
behaviour accurately and that this can be one of the most reliable sources of data.
2.2. Determinants of school travel behaviour
A number of theoretical frameworks have been constructed which explain mode choice behaviour to
schools. These include the: social-ecological model, McMillan framework, and ecological and
cognitive active commuting framework (McMillan, 2005; Sirard and Slater, 2008). Amongst these, the
social-ecological model is widely used. This model explains the importance of different factors
including individual/household, school, neighbourhood; temporal etc influencing the choice of
transport mode. Using the ecological and cognitive active commuting framework, a number of studies
have reported that students from low socio-economic backgrounds are more likely to use active
modes of transport whereas students from a white racial background are less likely to walk and cycle
(Braza et al., 2004; Harten and Olds, 2004; McMillan, 2007; Merom et al., 2006). Higher levels of
household income and increased car ownership are consistently associated with lower rates of
walking and cycling (Pont et al., 2009). Zwerts et al. (2010) found that boys and senior students are
more likely to make independent journeys in Flanders, Belgium. An individual’s attitudes and

5
perceptions have also been identified as playing a significant role in choosing the school transport
mode. Using qualitative data, Faulkner et al. (2010) identified two stages in mode choice decision
making in Toronto. These included: a) choice between walking and driving which depended on travel
time /distance, and b) the choice between walking alone and accompanied which depends on the
perception of safety. However, Lee and Tudor-Locke (2005) found, these decisions are usually made
by mothers in households. Christie et al (2011) found that despite high levels of bicycle ownership
(77%) in disadvantaged areas of England, only 2% of students cycled to school due to perceptions of
safety and risk (e.g. stranger danger, road safety). However, Fyhri and Hjorthol (2009) found that the
perception of risk and safety is a significant factor only from the perspective of parents but not from
the perspective of students.
Research has shown that the level of walking and cycling increased significantly in those schools that
participated in specific programmes that were designed for them, compared to those schools that did
not participate in any such programmes including: STP (Hinckson et al., 2011); SRTS (McDonald,
2008), WSB (Lang et al., 2011; Mendoza et al., 2009).
Numerous neighbourhood determinants of active commuting to and from school have been
investigated and have been identified as having a significant impact. Amongst these, distance from
home to school has consistently been reported as a significant factor (DiGuiseppi et al., 1998; Mitra
and Buliung, 2012; Pont et al., 2009; Schlossberg et al., 2006; Timperio et al., 2006; Zwerts et al.,
2010). Block density (Lin and Chang, 2010; Mitra and Buliung, 2012), net residential density (Dalton
et al., 2011; He, 2011; Lin and Chang, 2010), and land use diversity (McMillan, 2007) have all been
shown to have a positive association with active commuting. He (2011) reported that an identical
increase in residential density increased the probability of walking or biking by 1.09%. However,
inconsistencies in research findings were also found to exist in the literature. For example, a number
of studies found that a positive association exists between intersection density and the use of active
transport mode to schools (Dalton et al., 2011; Schlossberg et al., 2006); whereas others have
reported a negative association between these two (Lin and Chang, 2010; Timperio et al., 2006).
Active commuting is negatively associated with cul-de-sac (dead end) density (Schlossberg et al.,
2006) and travel routes that cross busy roads (Timperio et al., 2006).
The spatial characteristics of areas (e.g. urban, suburban, and rural) have been shown to influence
active commuting. Mitra et al. (2010) analysed the spatial concentration of active commuters to school
in Toronto and found that they are more concentrated in urban and inner suburb areas than in outer
suburbs. They observed that urban pupils not only made more active trips to schools, and this mode
choice behaviour was also more temporally stable in urban areas compared to inner suburb and outer
suburb areas. Seasonal variations in cycling to school have also been reported. Muller et al., (2008)
found that students with car availability switch from bike to car at shorter distances in winter than
those with no car available who switch from bike to public transportation in Germany.

6
3. Sectarian division and it’s impact on school (transport) in Northern Ireland (NI)
NI has a long history of sectarian violence between Protestants (aligned to Unionist/Loyalist) and
Catholics (aligned to Nationalist/Republican) religious groups (Community Relations Council for
Northern Ireland, 2000; Hughes et al., 2007). The first recorded riot between these groups took place
in 1813 when the number of in-migrant Catholics grew sharply due to the Industrial Revolution (Jones,
1960). This violence intensified gradually and reached its peak in the late 1960s when each group
began to perceive themselves to be vulnerable minorities and tended to move house in search of
greater security provided by residing amongst the relevant ethnic group both within and between
areas (Boal, 1982; Doherty and Poole, 1997). In addition, a shift from urban to rural areas - to live with
like minded people - has been documented by many researchers in this period (Murtagh, 1999;
Stockdale, 1991).
Poole and Doherty (1996) studied residential segregation patterns in 39 Northern Ireland towns using
1981 census data and found symmetrical patterns of residential isolation: towns in eastern NI have
higher Protestant isolation indices while those in western NI have higher Catholic isolation indices.
This work also found that 17 towns out of the 39 were highly segregated in terms of dominance and
contained 78% of the province’s population (Poole and Doherty, 1996). Figure 1 illustrates that this
pattern still exists in today’s society (calculated at the output area (OA) level based on the 2001
census data). OA is the smallest administrative unit used to collect census data in NI (5022 in total).
The Cluster and Outlier Analysis (Anselin Local Moran's I) tool was used in ArcGIS to generate Figure
1 based on the literature (inverse distance conceptualisation of spatial relationship with 9km distance
band) (Anselin, 1995; Lloyd and Shuttleworth, 2012; Mitchell, 2005). Generally, it is estimated that 35-
40 percent of Protestants and Catholics live in communities divided along ethno-sectarian lines and
the trend has increased in recent years (Hughes et al., 2007). However, this does not necessarily
mean that these highly segregated towns are a homogenous entity, rather that spatial segregation of
ethnic communities can be found within a town (Doherty and Poole, 1997). It has been estimated,
using data from the 1991 Census, that 45% of the population of the Belfast Urban Area live in highly
segregated neighbourhoods, i.e. with more than 90% of one religion or another (Community Relations
Council for Northern Ireland, 2000).
The resultant spatial segregation thus acted as an integrating force within each group; and
consequently group specific unique activity-travel behaviour patterns have been developed due to
increased spatial separation of homes, workplace, shops, and schools between the groups
(Community Relations Council for Northern Ireland, 2000). For example, Cooper et al. (2001) found
that despite availability of proximate opportunities, most households are prepared to travel long
distances to the workplace, shopping centres and schools if the proximate opportunities are located
within the sphere of an opposite group. This puts further pressure on the provision of opportunities in
order to meet the needs of either group. A good example of this is the provision of education in
Northern Ireland. Education in NI remains largely segregated; with children either attending Catholic
maintained schools or de facto Protestant controlled schools (McGlynn, 2007; Pickett, 2008). The
Rural Community Network (2001) observed that separate schools for Protestants and Catholics has

7
often meant there are two schools in areas where otherwise there might only be one. Although
attempts have been made to integrate education through the development of integrated schools since
1981, only 6.6% (21,051) attend integrated schools (Department of Education, 2011e). This
phenomenon has been described as voluntary integration by parental consent (McGlynn, 2007). At
present, 321,717 students are enrolled in different schools (e.g. nursery, primary, secondary) in NI of
which 120,415 (37%) are from a Protestant background and 163,693 (51%) are from a Catholic
background. However, 79% (95,528) of those from a Protestant background are attending controlled
schools whereas 88% (144839) of those from Catholic background are attending maintained schools
(Department of Education, 2011e). This signifies the extent of religious segregation that still exists in
the education system even after a decade long peace process.
Like education, the provision of transport services has also been severely affected by ‘the troubles’.
Evidence shows that despite being located within areas of the same religion, groups avoided
activities in these locations if they needed to travel through areas occupied by groups of the opposite
religion (Community Relations Council for Northern Ireland, 2000). As a result, the use of public
transport services, which usually followed routes across areas of both religions, has dropped
significantly due to the fear of crime on public transport. Consequently, the so called public ‘black taxi’
services have emerged which follow strictly confined corridors connecting the segregated areas of
each group (Community Relations Council for Northern Ireland, 2000; Wu and Hine, 2003). Partially
due to this, despite the provision of free school transport services in NI, the number of car journeys to
schools have significantly increased (Hine, 2009). Fears of bullying and sectarianism make some
children feel unsafe and also create serious worries for many parents as reported in Hine et al. (2006,
p.92): ‘when they see the uniform and know what school the children go to, sometimes things are
thrown at them, stuff taken off them and abuse shouted at them’. Burns (2006) reported that 40% of
primary school pupils and 30% of post-primary pupils had experienced bullying and sectarianism in
schools; and this trend is continuing (Department of Education, 2011c). Department of Education
(2011c) also reported that 10.8% of bullying took place during school journeys for primary pupils
whereas the rate was reported to be 6.6% for secondary school pupils. Burns (2006) also reported
that pupils attending controlled schools got bullied at a higher rate (83%) than those attending in other
schools. Currently, school children are eligible for transport assistance in circumstances where they
enrol at a school which is beyond the qualifying walking distance from home (two miles for primary
pupils or three miles for post-primary pupils) and has been unsuccessful in gaining a place at all
suitable schools located within these ranges (Department of Education, 2011b). Despite free transport
services to schools, the growing number of car journeys to schools is now a major policy concern in
NI.
4. Data and methods
4.1 Survey instruments
Data used in this research were originally collected as a part of the Safer Journeys to School project
commissioned by the Northern Ireland Commissioner for Children and Young People (NICCY) and
General Consumer Council Northern Ireland (Hine et al., 2006). Different survey instruments were

8
used to collect data e.g. peer to peer workshops, focus groups with parents and pupils, electronic
survey of key stakeholders in the statutory and voluntary sectors, and questionnaire surveys of pupils
and parents. Only data obtained from the questionnaire survey is reported in this paper. The
questionnaires developed consisted of three versions. For the school pupils, two versions were
distributed: one for primary school pupils with a shorter version containing few basic questions; and a
longer version for secondary school pupils. The same basic information was contained in both
versions, but it was felt that the younger children would have difficulty completing the full
questionnaire and providing all other information collected from secondary pupils. The questionnaires
were completed in class under the supervision of teachers. A longer version of the questionnaire was
also developed for parents and completed at their homes. Parents were asked to provide information
on their children’s travel to and from school. They were instructed to answer questions about only one
of their children attending school. In the shorter version of the questionnaire, pupils were asked to
indicate the different modes (e.g. car, bus, taxi, train, walk, and cycle) they used in a week to go to
school and their frequency of usage (e.g. everyday, 4 days in a week, 3 days in a week, 2 days in a
week, 1 day in a week, and never). They were also asked to answer the above questions for their
return journeys to home. Using the answers from these questions, the total number of trips made by
each pupil in a week was calculated for each mode. In addition, the questionnaire also contained
questions related to reasons for using their chosen modes or reasons for not using certain modes
(multiple response set). Although additional data were collected from secondary pupils and from
parents of both primary and secondary pupils, these are not reported in this paper.
4.2 Data
25 schools from across NI were selected based on stratified random sampling techniques and a total
of 1687 questionnaires were collected from pupils (1394) and parents (293). Amongst these, 50
questionnaires were collected from pupils from a special school which were excluded from further
analysis. In addition, 13 of the remaining questionnaires were found to be incomplete and were also
excluded. The remaining 1624 (293 from parents and 1331 from pupils) questionnaires from 24
schools were retained for further analysis (Figure 2). Therefore, the sample sizes in this research
were found to be representative of previous research as indicated in Section 2. Table 1 outlines the
sample characteristics of the survey which were also found to be representative of the school
population in Northern Ireland. There are 1096 schools in NI (excluding special, hospital and other
independent schools) of which 223 (20%) schools are secondary and the remaining are primary
schools (Department of Education, 2011d). Separate sets of schools were chosen in order to
administer the questionnaires for primary pupils (614 questionnaires), secondary pupils (717
questionnaires), parents of primary pupils (150 questionnaires), and parents of secondary pupils (143
questionnaires). Therefore, the data reported in these questionnaires were obtained from independent
samples.
According to the rural urban classification of settlements in NI, 3 of the schools surveyed (12%) were
located in rural areas (e.g. Desertmartin primary school, Magherafelt; Armagh Integrated College;
Ballymacrickett primary school, Crumlin) (Figure 2) (NISRA, 2005). These are representative

9
considering the fact that only one fourth of the NI pupils attend schools located in rural areas (Table 1)
(Department of Education, 2011a). These rural schools were chosen according to their religious
attachments and sampled as: 1 maintained, 1 controlled, and 1 integrated. Figure 2 provides the
number of questionnaires that were collected from each of these schools. Although this shows a
larger representation of data from the eastern board (Belfast) of NI, this is justified given that around
20% of the NI pupils attend schools located in Belfast only. The type of management (or religious
affiliation) associated with the surveyed schools included: 9 maintained, 6 controlled, and 9
integrated. The data collected from integrated schools are overly represented in this research. Further
investigation shows that this is particularly true for the parental survey data from secondary school.
As a significant correlation exists between school management type and the religious backgrounds of
pupils as indicated in Section 3, no religious data was collected at the individual level in this research.
In addition, 98% of the school children are white racial background in NI, and as a result, this ethnic
dimension was not considered for further investigation in this research (Department of Education,
2011a). No household level data (such as household income, car-ownership) were collected as part
of this research. As discussed in Section 2.2, individual/household characteristics have a greater
impact on school travel behaviour. A lack of consideration of these variables is, therefore, a major
limitation of this study.
4.3 Methods
4.3.1. Derivation of neighbourhood level indicators
A number of neighbourhood level factors have consistently been identified (e.g. deprivation, net
residential density, land use diversity, intersection density, and cul-de-sac density) as having
significant impacts on mode choice behaviour both in this context (Hine et al., 2012; Kamruzzaman et
al., 2011), and elsewhere as discussed in Section 2.2. These factors were derived/obtained using
data from secondary sources. Geo-referenced school location data was used to extract the multiple
deprivation rank1 of the neighbourhoods from the Northern Ireland Multiple Deprivation Measure 2010
(NISRA, 2010). Net residential density was measured using the number of residential building
footprints located within a unit area of residential zoned lands (e.g. number/hectares) (Frank et al.,
2005). A variety of measures exist to calculate land use diversity in the literature including an entropy
based measure, destination based measure, proxy based measure, perceived diversity measure etc
(Cerin et al., 2007; Duncan et al., 2011). All these measures have both strengths and weaknesses
and are discussed by Brown et al (2009). This research used the Simpson’s diversity index – an
index used in the spatial ecology literature to calculate the biodiversity of habitats (Simpson, 1949).
Unlike other measures, this method takes into account both the richness and evenness of land uses.
Richness measures the number of different types of land uses present in an area whereas evenness
compares the similarity of different land uses (i.e. whether the existed land uses are equally present).
The following formula was used to calculate land use diversity index in which the higher value
represents more diversity of land uses (value ranges from 0 to 1) (Simpson, 1949):
1 A lower rank means higher deprivation.
10
2
1 )/( - diversity use Land Aa
where a is the total area of a specific land use category (e.g. residential) presents within a
neighbourhood and A represents the total area of all land use categories in the neighbourhood. The
building footprint feature class spatially represents 13 types of land uses of buildings. These were
reclassified into 6 main classes (e.g. residential, commercial, industrial, social, offices, and
recreational) following Kamruzzaman and Hine (2010) and were used to calculate the diversity level
for each school neighbourhood. Intersection density was measured based on the number of 3 or more
way intersections located within a unit area of the neighbourhood (e.g. number/hectares) whereas cul-
de-sac density was calculated using the number of dead ends located within a unit area of the
neighbourhood (e.g. number/hectares) (Figure 3). However, a stronger correlation was found to exist
between intersection density and cul-de-sac density, as a result, cul-de-sac density was excluded
from further analysis as they both represent street connectivity level of a neighbourhood (Stangl and
Guinn, 2011).
4.3.2. Validation of proxy reports
Unlike previous school transport research that has predominantly used data from parent-student
dyads for the convergent validity of proxy reports, this study collected data from four independent
samples (primary pupils, parents of primary pupils, secondary pupils, and parents of secondary
pupils). Also, the collected ‘number of trips’ data are continuous in nature (count data to be more
specific). As a result, independent sample t tests were conducted in SPSS in order to investigate
whether the proxy report is a valid alternative to self-reported data for different age groups using the
reported number of trips for different modes as dependent variables. The t test method has frequently
been used in the literature in order to evaluate the discrepancies between self-reports and proxy
reports (Robitail et al., 2007; Warner-Czyz et al., 2009). As mentioned earlier, data collected from
parents of secondary school children were found to be overrepresented by integrated schools. As a
result, the sample data for secondary schools were standardised by school management type in order
to make them more representative. Consequently, the validity of proxy report was further investigated
based on the standardised sample in STATA (version 11.1) using the [pweight = weight variable]
option. This enables examination of whether the two results are different.
4.3.3. Identifying determinants of school travel behaviour in NI
Determinants of mode choice behaviour were identified only for those modes that were found to have
a larger share of the overall commuting behaviour and included car, bus, and walk. Analysis shows
that the reported numbers of trips in these modes are significantly associated with each other for
different age groups. As a result, multivariate multiple regression (simultaneous equation model)
analyses were conducted with three dependent variables. This analysis, therefore, takes into account
the correlations of the dependent variables (Washington et al., 2010). Two multivariate multiple
regressions were estimated, one for each age group (e.g. primary and secondary), which in turn
estimated 6 models in total, one for each of the three modes and one for each of the age groups. Only
the statistically significant (p<0.1) explanatory factors for at least one outcome variable were retained

11
in the models upon refinement of an initial starter specification that included all seven explanatory
factors (e.g. gender, area type, management type, multiple deprivation, net residential density, land
use diversity, and intersection density). Calculations were carried out using STATA (version 11.1).
5. Results
5.1. Descriptive statistics
On average, each individual reported 9.7 trips in a week. It was expected to have 10 trips per
individual in a week considering 5 schools days in a week and 2 trips in a day (to and from school).
However, the non-attendance rate in NI schools ranges between 5% and 8% (Department of
Education, 2011a). Therefore, the 9.7 trips in a week might represent the authenticity of reported
data. Table 2 outlines the number of trips made by pupils using different modes in a week which are
classified according to the respondent type for this research. Despite differences between the groups
(which are discussed in detail in the following section), on average 50% of the trips were made by the
car, followed by bus (27%) and walk (23%). Pupils rarely used the bicycle and taxi whereas none of
the groups reported train as a mode of travel either to or from school. Data shows that a lack of a train
station close to pupils’ home location is the main reason (80%) for not using it. The main reasons for
not using taxis were cited as no taxi service near or readily available to their place of residence
(46.1%) with slightly less (40.6%) stating that they simply did not want to use a taxi. The main reason
for not cycling was found to be longer travel time (61.2% pupils and 71.4% of parents stated this).
The stated reasons for using the car are simply because pupils want to use it. Given the importance
of this reason, a further refinement in the instrument is necessary in order to decompose the
underlying factors associated with this. Other reasons for using the car were found to be its speed
and comfort, as shown in Table 3. A lack of public transport was not identified as a main cause of
using the car in this research. With regard to reasons for not using the car, the majority stated that this
was because pupils did not want to use the car (59%) with 30% stating that there is no car in their
household (Table 3). 42% of the respondents reported that they used car in both ways, 9% used only
for travelling to schools, and 1% used only for returning home. This, it was stated, is because many
pupils are often ‘dropped off’ by parents on their way to work and make other arrangements for the
homeward journey. This, it seems is mainly because those parents are at work and cannot collect the
children after school (McDonald, 2008). A number of factors were identified that influenced to use the
bus including the proximity of services (53%) followed by parental (51%) and pupils’ (42%)
willingness, and a lack of private transport in household (30%). On the other hand, amongst those
who never used the bus, a majority of them (73%) mentioned that students do not want to use the bus
followed by lack of services (24%) within reach and unreliability (21%) of the services. The length of
journeys on foot was cited as the main reason (97%) for not walking to and/or from school. This
finding is, therefore, similar to that reported in previous research studies (DiGuiseppi et al., 1998;
Schlossberg et al., 2006; Zwerts et al., 2010). However, unlike previous research, safety issues or
stranger danger do not feature prominently as reasons for preventing or prohibiting walking/cycling to
and from school in this research.

12
5.2 Modal split: self-reported data vs. proxy reports
Comparison of the reported number of trips by different modes, using an independent sample t test,
revealed no significant differences between primary pupils and their parents (Table 2). This finding is
similar to that reported in previous studies as discussed in Section 2. However, unlike the studies that
used data from parent-student dyads, this research utilised independent samples to validate the
usability of proxy reports in a sectarian divided society. The findings in this research, therefore,
advances the generalisation of results in a broader sense, that is, that parental proxy reports are a
valid method for collecting school travel data for primary pupils. Specifically, the findings suggest that
the parental proxy report is valid for primary pupils irrespective of their contexts. From this
perspective, the results found on the validity of proxy reports for secondary school pupils can also be
justified particularly when there is little literary evidence of this in transport research.
Table 2 indicates that a significantly huge difference exists in the reported data between secondary
pupils and parents of secondary pupils when transport modes were the car and the bus. Further
analyses using the standardised sample show similar results despite the t statistics showing a slight
reduction in the differences when compared to the original sample (Table 2).
Generally, parents reported a higher rate of car usage (60%) than pupils (25%). A significantly
reduced level of bus usage was reported by the parent (19%) compared to that for pupils (54%) in a
week (Table 2). Hine (2009) has shown that historically the rate of car usage for secondary pupils in
NI varies between 22% and 25% whereas the rate of bus usage varies between 55% and 58%.
Therefore, the self-reported number of trips by car and bus sit in between these figures. As a result,
the validity of parental proxy reports for secondary school pupils can be questioned; at least, for these
modes because there are no significant differences in the reported number of walk trips between the
survey instruments. However, considering the research findings reported in other research fields,
these findings were expected. Shapiro (2004) has indicated that unlike younger kids, when children
grew up, parents do not closely monitor their activities. As a result, parents report inaccurately
(Mandemakers and Dykstra, 2008). This finding suggests that unlike primary school pupils, care must
be taken with sample selection when an analysis focuses on senior pupils because a proxy report is
no longer a valid method of data collection for this age group particularly when it is required to
analyse car or public transport usage. Nevertheless, the reporting of an equal number of walk trips to
and from school implies that an exception can be made in terms of sample selection when analysis
focuses on just active modes of transport e.g. walk in this case.
5.3 Multivariate regression analysis results
Distinct patterns of travel behaviour associated with primary and secondary pupils were identified in
the above sections. Generally, primary school pupils rely more on the car and on foot for travelling to
and from school, whereas secondary pupils rely more on the bus. This section reports the regression
analysis results showing the factors that significantly affect mode choice behaviour of these two
groups separately. Since the proxy report for primary school pupils were found to be representative of
self-reported data, as a result, the data reported by both primary school pupils and parents of primary

13
school pupils were merged together for the regression analysis. Therefore, the sample sizes for this
regression analysis became 764 (614 pupils + 150 parents). As a significant difference exists in the
reported data between secondary school pupils and their parents, only the self reported data were
analysed in the regression models for secondary pupils (sample sizes 717). The tests for the overall
model indicate that the two multivariate models (primary and secondary) are statistically significant,
regardless of the type of multivariate criteria used (e.g. Wilks’ lambda) (Table 4). In addition, each of
the three univariate models (e.g. bus, car, and walk) was also found to be statistically significant for
both age groups. Despite the significance of the models caution must be taken when interpreting the
results due to their limited explanatory powers. However, the explanatory powers of both the car and
walk models for primary school pupils, and the car and bus models for secondary school pupils are
quite favourable in comparison with previous research (Tal and Handy, 2010).
Table 4 shows that girls, both in primary schools and in secondary schools, made significantly fewer
trips using the car and significantly more trips on foot than boys. The findings show that a one unit
change in this variable (i.e. from boys to girls) is expected to reduce by 0.61-0.76 car trips in a week
and increase a similar number of walk trips. This finding is surprising considering the fact that most
studies have previously found an inconsistent relationship between gender and walking to schools.
Whereas some studies reported that males are more likely to walk other studies found no correlation
between gender and walking (McDonald, 2012). However, this finding is similar to that reported by
Leslie et al. (2010) in the Australian context. They reported with surprise that having a higher/medium
level of community disorder influenced females to make more walk trips from schools, and therefore,
this finding is more relevant to the NI context. There are virtually no differences in the level of bus
usage between male and female pupils.
A higher number of car trips, a lower number of trips on foot, and using the bus were found to exist for
primary school pupils attending schools located in rural areas. However, the rate of car use for
secondary pupils attending rural schools was found to be significantly lower than their urban
counterparts because of a greater reliance on the bus. Like primary pupils, secondary pupils attending
school in rural areas also made fewer trips on foot.
Religion was found to be a significant factor in the choice of travel mode to and from school for
secondary school pupils only. Table 4 shows that Catholics were more likely to walk and their rate of
car use and bus use did not vary significantly from those pupils who attended controlled schools.
Pupils who attended integrated schools were found to rely more on foot and the car at the expense of
the bus compared to their counterparts in controlled schools.
Both primary and secondary pupils living in advantaged neighbourhoods made significantly fewer trips
using the bus. No difference was found to exist for primary school pupils living between advantaged
and deprived neighbourhoods in terms of making trips using the car and walk. However, secondary
school pupils who lived in a deprived neighbourhood made fewer walking trips. This could be due to
the fact that deprived neighbourhoods have a higher level of crime and pupils living in these

14
neighbourhoods avoided walking due to reasons of personal safety. This finding is similar to that
reported elsewhere in the UK and in other contexts (Christie et al., 2011; Leslie et al., 2010).
Although net residential density was not identified to be a significant factor for primary school pupils,
this was found to have significant impact for secondary school pupils. Secondary school pupils living
in higher density areas were more likely to walk. A higher level of land use diversity decreased the
level of walking for primary pupils. In contrast, a higher diversity increased walking for secondary
pupils. Primary pupils, instead, relied more on the cars in a highly diverse neighbourhood probably
due to the fear of stranger danger. A similar result was found for secondary pupils despite their higher
level of walking – perhaps at the expense of bus trips. Like the findings reported elsewhere
(Schlossberg et al., 2006), intersection density positively impacted on walking for primary school
pupils although such an association did not exist for secondary school pupils.
6. Conclusion
This research examined two relatively unexplored themes in the literature. By investigating
convergent validity of proxy reports from independent samples for different age groups, this research
verifies the widely identified conclusion that parental proxy reports are a valid alternative to self-
reported data even in a highly segregated society. However, this validity was found to be limited to
primary school children only in this research. The analyses presented using the collected datasets
show that parental proxy reports for secondary school pupils are over reported for the car and
underreported for the bus. However, given that this research utilised independent samples for the
assessment of validity, as a result, it calls for a further investigation on this assessment using the
widely used dyadic approach. Despite the invalidity of parental proxy reports using both original and
standardised samples for secondary school, the result should be read with caution; and further
research should seek to verify this using a truly representative sample. Nevertheless, the validity of
proxy reports on children’s mode choice to and from school for primary school pupils has a significant
implication for studies involving primary school pupils because data collection from primary school
pupils can sometimes be cumbersome for different reasons such as ethical approval. In addition, the
issue of non-reporting and collection of data whilst maintaining sample integrity can be tackled with
relative ease when data are collected from parents than pupils (Kite and Wen, 2010). The findings of
this research demonstrate that proxy reports for secondary school pupils can also be an effective
method if analysis focuses on just walking. This finding is also significant considering the changing
nature of school transport research in recent years which focuses more on active transport.
Secondly, this study identifies the determinants of school mode choice behaviour for different age
groups in a sectarian divided society by applying multivariate multiple regression technique. The
models capture 3-19% of the variance in the reported number of trips for different modes associated
with different age groups. Clearly, there are potentially many other factors that may help to explain
mode choice behaviour, including journey distance, school characteristics, household socio-
demographics, or other unknown factors. The extent to which these known and unknown omitted
factors are correlated with included covariates may influence the coefficients reported here. Further
15
research should seek to include these factors and improve upon the explanatory power of the model
presented here. Nevertheless, the factors that were identified to have significant impacts in
influencing the mode choice behaviour are justified based on findings from previous studies.
Sectarian division was identified as having an insignificant impact on mode choice behaviour for
primary school pupils. All religious groups in primary schools relied mainly on the car. This is possibly
due to the fact that primary school pupils encounter a higher level of bullying and sectarianism during
school journeys (Department of Education, 2011c), and as a result, ‘pupils want to use the car’ or
‘parents want them to use the car’. Sectarianism is, therefore, a hindrance in the way of securing
good health, developing social and spatial knowledge through using active transport to school for
primary school pupils in NI. A higher level of bullying and sectarianism in controlled schools could also
act as a barrier to use active transport for secondary school pupils attending controlled school as they
made a significantly fewer trips on foot (Burns, 2006). A lower level of bus usage by secondary pupils
attending integrated schools is probably due to the fact that integrated schools are sparsely located in
Northern Ireland, and as a result, scheduling of bus services to these schools is difficult which
prompted pupils to rely more on the car. However, evidence from this research shows that pupils
attending an integrated school would be more willing to walk if these schools were located within
walking distance from their home. These findings suggest that there is room for the promotion of
active travel choices amongst Protestants’ children attending secondary schools. In addition, the
provision of more integrated schools could be a way forward to lessen the anti-social behaviour (e.g.
bullying) and consequently to promote the use of more sustainable transport options in NI.
Despite sectarian division was found to be an important factor in this context, findings show that land
use diversity is the most significant factor in influencing the choice of transport mode for both primary
and secondary pupils. Rural-urban context is, yet, another major factor for both groups. Other urban
form variables were also found to be associated with mode choice behaviour. The findings, therefore,
support the global resurgence of compact urban development and healthy cities planning focusing on
urban design and active transport. However, the findings of this research suggest that a careful
selection of land use based interventions is required to promote walking because not all interventions
will have identical impacts for all age groups; rather, they sometimes impact in opposite directions
(e.g. land use diversity).
7. Acknowledgement
The authors would like to thank the Associate Editor (Dr. Karen Lucas) of this journal and the two
anonymous reviewers for their insightful comments and suggestions.
8. References
Agnihotri, K., Awasthi, S., Singh, U., Chandra, H., Thakur, S., 2010. A study of concordance between
adolescent self-report and parent-proxy report of health-related quality of life in school-going
adolescents. Journal of Psychosomatic Research 69, 525-532.
Anselin, L., 1995. Local Indicators of Spatial Association—LISA. Geographical Analysis 27, 93–115.
16
Ardon, M.S., Selles, R.W., Roebroeck, M.E., Hovius, S.E., Stam, H.J., Janssen, W.G., 2012. Poor
Agreement on Health-Related Quality of Life Between Children With Congenital Hand
Differences and Their Parents. Archives of Physical Medicine and Rehabilitation 93, 641-646.
Beck, M.J., Rose, J.M., Hensher, D.A., 2012. The accuracy of proxy responses in a stated choice
setting: A re-examination and some controversial conclusions. Transportation Research Part A
46, 226–239.
Boal, F., 1982. Segregation and mixing: space and residence in Belfast, In: Boal, F., Douglas, J.
(Eds.), Integration and Division. Academic Press, London.
Braza, M., Shoemaker, W., Seeley, A., 2004. Neighborhood design and rates of walking and biking to
elementary school in 34 California communities. American Journal of Health Promotion 19,
128-136.
Brown, B.B., Yamada, I., Smith, K.R., Zick, C.D., Kowaleski-Jones, L., Fan, J.X., 2009. Mixed land
use and walkability: Variations in land use measures and relationships with BMI, overweight,
and obesity. Health & Place 15, 1130–1141.
Burns, S., 2006. School Bullying in Northern Ireland - It hasn’t gone away you know. ARK Northern
Ireland: Social and Political Archive, www.ark.ac.uk.
Cerin, E., Leslie, E., Owen, N., Bauman, A., 2007. Applying GIS in Physical Activity Research:
Community 'Walkability' and Walking Behaviors, In: Lia, P.C., Mak, A.S.H. (Eds.), GIS for
Health and the Environment: Development in the Asia-Pacific Region. Springer, Berlin.
Christie, N., Kimberlee, R., Towner, E., Rodgers, S., Ward, H., Sleney, J., Lyons, R., 2011. Children
aged 9–14 living in disadvantaged areas in England: Opportunities and barriers for cycling.
Journal of Transport Geography 19, 943–949.
Community Relations Council for Northern Ireland, 2000. The Implications of Segregation for
Transport within Northern Ireland, Belfast.
Cooper, J., Ryley, T., Smyth, A., 2001. Contemporary lifestyles and the implications for sustainable
development policy: Lessons from the UK’s Most Car Dependent City, Belfast. Cities 18, 103–
113.
Dalton, M.A., Longacre, M.R., Drake, K.M., Gibson, L., Adachi-Mejia, A.M., Swain, K., Xie, H., Owens,
P.M., 2011. Built Environment Predictors of Active Travel to School Among Rural Adolescents.
American Journal of Preventive Medicine 40, 312-319.
Davison, K.K., Werder, J.L., Lawson, C.T., 2008. Children’s Active Commuting to School: Current
Knowledge and Future Directions. Preventing Chronic Diesease: Public Health Research,
Practice, and Policy 5, 1-11.
Department for Transport, 2006. National Travel Survey (NTS) data, 2002-2006: User guidance. UK
Data Archive, London.
Department of Education, 2011a. Attendance at Grant-Aided Primary, Post-Primary and Special
Schools 2009/10: Summary Statistics, Belfast.
Department of Education, 2011b. Getting to school - Home to school transport arrangements.
http://www.deni.gov.uk/index/85-schools/schools_getting_to_school_pg.htm. October 26, 2011

17
Department of Education, 2011c. The Nature and Extent of Pupil Bullying in Schools in the North of
Ireland, Belfast.
Department of Education, 2011d. Number of Educational Establishments in Northern Ireland by
Management Type, Belfast.
Department of Education, 2011e. Religion of pupils by school type and management type, 2010/11.
www.deni.gov.uk. October 26, 2011
DiGuiseppi, C., Roberts, I., Li, L., Allen, D., 1998. Determinants of car travel on daily journeys to
school: cross sectional survey of primary school children. BMJ 316, 1426-1428.
Doherty, P., Poole, M.A., 1997. Ethnic Residential Segregation in Belfast, Northern Ireland, 1971-
1991. Geographical Review 87, 520-536.
Duncan, M.J., Winkler, E., Sugiyama, T., Cerin, E., duToit, L., Leslie, E., Owen, N., 2011.
Relationships of Land Use Mix with Walking for Transport: Do Land Uses and Geographical
Scale Matter? Journal of Urban Health 87, 782-795.
Evenson, K.R., Neelon, B., Ball, S.C., Vaughn, A., Ward, D.S., 2008. Validity and Reliability of a
School Travel Survey. Journal of Physical Activity & Health 5, S1-S15.
Faulkner, G.E., Richichi, V., Buliung, R.N., Fusco, C., Moola, F., 2010. What’s ―quickest and
easiest?": parental decision making about school trip mode. International Journal of Behavioral
Nutrition and Physical Activity 7.
Flannery, K., Resnick, B., Galik, E., Lipscomb, J., McPhaul, K., in press. Reliability and Validity
Assessment of the Job Attitude Scale. Geriatric Nursing.
Forman, H., Kerr, J., Norman, G.J., Saelens, B.E., Durant, N.H., Harris, S.K., Sallis, J.F., 2008.
Reliability and validity of destination-specific barriers to walking and cycling for youth.
Preventive Medicine 46, 311-316.
Frank, L.D., Schmid, T.L., Sallis, J.F., Chapman, J., Saelens, B.E., 2005. Linking objectively
measured physical activity with objectively measured urban form: Findings from SMARTRAQ.
American Journal of Preventive Medicine 28, 117-125.
Fyhri, A., Hjorthol, R., 2009. Children’s independent mobility to school, friends and leisure activities.
Journal of Transport Geography 17, 377–384.
Fyhri, A., Hjorthol, R., Mackett, R.L., Fotel, T.N., Kytta, M., 2011. Children’s active travel and
independent mobility in four countries: Development, social contributing trends and measures.
Transport Policy 18, 703–710.
Gao, S., Harnack, L., Schmitz, K., Fulton, J., Lytle, L., Coevering, P.V., David R. Jacobs, J., 2006.
Reliability and Validity of a Brief Tool to Measure Children’s Physical Activity. Journal of
Physical Activity and Health 3, 415-422.
Goldhaber, R., Schnell, I., 2007. A model of multidimensional segregation in the Arab Ghetto in Tel
Aviv-Jaffa. Tijdschrift voor Economische en Sociale Geografie 98, 603-620.
Harakeh, Z., Engels, R.C.M.E., Vries, H.d., Scholte, R.H.J., 2006. Correspondence between proxy
and self-reports on smoking in a full family study. Drug and Alcohol Dependence 84, 40-47.
Harten, N., Olds, T., 2004. Patterns of active transport in 11-12 year old Australian children. The
Australian and New Zealand Journal of Public Health 28, 167-172.
18
He, S., 2011. Effect of School Quality and Residential Environment on Mode Choice of School Trips.
Journal of the Transportation Research Board No. 2213, 96–104.
Hinckson, E.A., Garrett, N., Duncan, S., 2011. Active commuting to school in New Zealand Children
(2004–2008): A quantitative analysis. Preventive Medicine 52, 332–336.
Hine, J., 2009. The provision of home to school transport in Northern Ireland. Research in
Transportation Economics 25, 29–38.
Hine, J., Kamruzzaman, M., Blair, N., 2012. Weekly activity-travel behaviour in rural Northern Ireland:
differences by context and socio-demographic. Transportation 39, 175-195.
Hine, J., Mackey, S., Gunay, B., 2006. Safer Journeys to School. Northern Ireland Commissioner for
Children and Young People, Roads Service for Northern Ireland, and General Consumer
Council for Northern Ireland, Belfast.
Hughes, J., Campbell, A., Hewstone, M., Cairns, E., 2007. Segregation in Northern Ireland. Policy
Studies 28, 33-53.
Jones, E., 1960. A Social Geography of Belfast. Oxford University Press, London.
Joshi, M.S., macLean, M., Carter, W., 1999. Children's journey to school: Spatial skills, knowledge
and perceptions of the environment. British Journal of Developmental Psychology 17, 125-139.
Kamruzzaman, M., Hine, J., 2010. Mobility, accessibility and activity participation : a comparative
assessment of methods to identify rural transport disadvantage, World Conference on
Transport Research, Lisboa Congress Center, Lisbon.
Kamruzzaman, M., Hine, J., Gunay, B., Blair, N., 2011. Using GIS to visualise and evaluate student
travel behaviour. Journal of Transport Geography 19, 13-32.
Kenny, D.A., 1996. Models of Non-Independence in Dyadic Research. Journal of Social and Personal
Relationships 13, 279-294.
Kite, J., Wen, L.M., 2010. Measuring children’s journey to school: student five-day diary compared to
parental report of usual behaviour. The Australian and New Zealand Journal of Public Health
34, 215-216.
Lang, D., Collins, D., Kearns, R., 2011. Understanding modal choice for the trip to school. Journal of
Transport Geography 19, 509–514.
Lee, S.M., Tudor-Locke, C., 2005. ACTIVE VERSUS PASSIVE COMMUTING TO SCHOOL: WHAT
CHILDREN SAY. American Journal of Health Studies 20, 212-218.
Leslie, E., Kremer, P., Toumbourou, J.W., Williams, J.W., 2010. Gender differences in personal,
social and environmental influences on active travel to and from school for Australian
adolescents. Journal of Science and Medicine in Sport 13, 597-601.
Lin, J.-J., Chang, H.-T., 2010. Built Environment Effects on Children’s School Travel in Taipai:
Independence and Travel Mode. Urban Studies 47, 867–889.
Lloyd, C.D., Shuttleworth, I., 2012. Residential segregation in Northern Ireland in 2001: assessing the
value of exploring spatial variations. Environment and Planning A 44, 52-67.
Mandemakers, J.J., Dykstra, P.A., 2008. Discrepancies in Parent’s and Adult Child’s Reports of
Support and Contact. Journal of Marriage and Family 70, 495-506.

19
McDonald, N.C., 2008. Household interactions and children’s school travel: the effect of parental work
patterns on walking and biking to school. Journal of Transport Geography 16, 324–331.
McDonald, N.C., 2012. Is there a gender gap in school travel? An examination of US children and
adolescents. Journal of Transport Geography 20, 80–86.
McDonald, N.C., Dwelley, A.E., Combs, T.S., Evenson, K.R., Winters, R.H., 2011. Reliability and
validity of the Safe Routes to school parent and student surveys. International Journal of
Behavioral Nutrition and Physical Activity 8, 56.
McGlynn, C., 2007. Rhetoric and reality: are integrated schools in Northern Ireland really making a
difference? Irish Educational Studies 26, 271-287.
McMillan, T.E., 2005. Urban form and a child’s trip to school: the current literature and a framework
for future research. J Planning Lit 19, 440-456.
McMillan, T.E., 2007. The relative influence of urban form on a child’s travel mode to school.
Transportation Research Part A 41, 69-79.
McMinn, D., Rowe, D.A., Murtagh, S., Nelson, N.M., 2011. The Strathclyde Evaluation of Children’s
Active Travel (SE-CAT): study rationale and methods. BMC Public Health 11, 958.
McPeek, R., Nichols, A.L., Classen, S., Breiner, J., 2011. Bias in older adults’ driving self-
assessments: The role of personality. Transportation Research Part F 14 579–590.
Mendoza, J.A., Levinger, D.D., Johnston, B.D., 2009. Pilot evaluation of a walking school bus
program in a low-income, urban community. BMC Public Health 9.
Mendoza, J.A., Watson, K., Baranowski, T., Nicklas, T.A., Uscanga, D.K., Hanfling, M.J., 2010.
RVeaselaircdh iatrtyicl eof instruments to assess students' travel and pedestrian safety. BMC
Public Health 10, 257.
Merom, D., Tudor-Locke, C., Bauman, A., Rissel, C., 2006. Active commuting to school among NSW
primary school children: implications for public health. Health & Place 12, 678-687.
Mitchell, A., 2005. The ESRI Guide to GIS Analysis. ESRI Press.
Mitra, R., Buliung, R.N., 2012. Built environment correlates of active school transportation:
neighborhood and the modifiable areal unit problem. Journal of Transport Geography 20, 51-
61.
Mitra, R., N.Buliung, R., Faulkner, G.E.J., 2010. Spatial clustering and the temporal mobility of
walking school trips in the Greater Toronto Area, Canada. Health & Place 16, 646–655.
Müller, S., Tscharaktschiew, S., Haase, K., 2008. Travel-to-school mode choice modelling and
patterns of school choice in urban areas. Journal of Transport Geography 16, 342-357.
Murtagh, B., 1999. Community and Conflict in Rural Ulster. University of Ulster, Coleraine.
NISRA, 2005. Report of the Inter-Departmental Urban-Rural Definition Group: Statistical Classification
and Delineation of Settlements. Northern Ireland Statistics and Research Agency (NISRA).
NISRA, 2010. The Northern Ireland Multiple Deprivation Measure 2010. Northern Ireland Statistics
and Research Agency (NISRA).
Pickett, L., 2008. Integrated Schools in Northern Ireland: Education for Peace and Reconciliation.
Childhood Education 84, 351-356.
20
Pont, K., Ziviani, J., Wadley, D., Bennett, S., Abbott, R., 2009. Environmental correlates of children's
active transportation: A systematic literature review. Health & Place 15, 849-862.
Poole, M.A., Doherty, P., 1996. Ethnic Residential Segregation in Northern Ireland. University of
Ulster, Coleraine.
Robitail, S., Siméoni, M.-C., Ravens-Sieberer, U., Bruil, J., Auquier, P., 2007. Children proxies'
quality-of-life agreement depended on the country using the European KIDSCREEN-52
questionnaire. Journal of Clinical Epidemiology 60, 469.e461-469.e413.
Rosenbloom, T., Wultz, B., 2011. Thirty-day self-reported risky driving behaviors of ADHD and non-
ADHD drivers. Accident Analysis & Prevention 43, 128-133.
Rowe, D.A., Murtagh, S., McMinn, D., Ord, K.L., Nelson, N.M., 2010. Reliability And Validity For
Measures Of Children's Self-Efficacy For Walking To School. Medicine & Science in Sports &
Exercise 42, 522-523.
Rural Community Network, 2001. Small Rural Schools in Northern Ireland - A Policy Discussion
Document, Cookstown.
Schlossberg, M., Greene, J., Phillips, P.P., Johnson, B., Parker, B., 2006. School Trips: Effects of
Urban Form and Distance on Travel Mode. Journal of the American Planning Associalion 72,
337-346.
Shapiro, A., 2004. REVISITING THE GENERATION GAP: EXPLORING THE RELATIONSHIPS OF
PARENT/ADULT-CHILD DYADS. The International Journal of Aging and Human Development
58, 127-146.
Simpson, E.H., 1949. Measurement of diversity. Nature 163, 688.
Sirard, J.R., Slater, M.E., 2008. Walking and Bicycling to School: A Review. American Journal of
Lifestyle Medicine 2, 372-396.
Smith, S., Lamping, D., Banerjee, S., Harwood, R., Foley, B., Smith, P., Cook, J., Murray, J., Prince,
M., Levin, E., Mann, A., Knapp, M., 2005. Measurement of health-related quality of life for
people with dementia: development of a new instrument (DEMQOL) and an evaluation of
current methodology. Health Technology Assessment 9.
Smith, S.C., Lamping, D.L., BANERJEE, S., Harwood, R.H., Foley, B., Smith, P., Cook, J.C., Murray,
J., Prince, M., Levin, E., Mann, A., Knapp, M., 2007. Development of a new measure of
healthrelated quality of life for people with dementia: DEMQOL. Psychological Medicine 37, 737
746.
Stangl, P., Guinn, J.M., 2011. Neighborhood design, connectivity assessment and obstruction. Urban
Design International 16, 285–296.
Stevenson, M.R., 1996. The validity of children's self-reported exposure to traffic. Accident Analysis
& Prevention 28, 599-605.
Stockdale, A., 1991. Recent Trends in Urbanisation and Rural Population in Northern Ireland. Irish
Geography 24, 70-80.
Tal, G., Handy, S., 2010. Travel behavior of immigrants: An analysis of the 2001 National Household
Transportation Survey. Transport Policy 17, 85-93.
21
Telford, A., Salmon, J., Jolley, D., Crawford, D., 2004. Reliability and Validity of Physical Activity
Questionnaires for Children: The Children’s Leisure Activities Study Survey (CLASS). Pediatric
Exercise Science 16, 64-78.
Timperio, A., Ball, K., Salmon, J., Roberts, R., Giles-Corti, B., Simmons, D., Baur, L.A., Crawford, D.,
2006. Personal, Family, Social, and Environmental Correlates of Active Commuting to School.
American Journal of Preventive Medicine 30, 45-51.
Wagmiller, R.L., 2009. A Fixed Effects Approach to Assessing bias in Proxy Reports. International
Journal of Public Opinion Research 21, 477-505.
Warner-Czyz, A.D., Loy, B., Roland, P.S., Tong, L., Tobey, E.A., 2009. Parent versus child
assessment of quality of life in children using cochlear implants. International Journal of
Pediatric Otorhinolaryngology 73, 1423-1429.
Washington, S., Matthew, K., Mannering, F., 2010. Statistical and Econometric Methods for
Transportation Data Analysis. Chapman & Hall/CRC, Boca Raton.
Wu, B.M., Hine, J., 2003. A PTAL approach to measuring the changes in bus service accessibility.
Transport Policy 10, 307-320.
Yeung, J., Wearing, S., Hills, A.P., 2008. Child transport practices and perceived barriers in active
commuting to school. Transportation Research Part A 42, 895–900.
Zwerts, E., Allaert, G., Janssens, D., Wets, G., Witlox, F., 2010. How children view their travel
behaviour: a case study from Flanders (Belgium). Journal of Transport Geography 18, 702–
710.

22
9. Tables
Table 1: Sample characteristics
Variables Pupil questionnaire
Parental questionnaire
Combined sample
2010/11 School census
Sample sizes % Sample sizes % Sample sizes % %
School type
Primary 614 46.1 150 51.2 764 47.0 51
Secondary 717 53.9 143 48.8 860 53.0 49
Gender
Boys 738 55.4 141 48.1 879 54.1 -
Girls 593 44.6 152 51.9 745 45.9 -
Area type
Urban 1251 94.0 218 74.4 1469 90.5 75
Rural 80 6.0 75 25.6 155 9.5 25
Management type
Protestant 732 55.0 71 24.2 803 49.4 40
Catholic 362 27.2 75 25.6 437 26.9 46
Integrated 237 17.8 147 50.2 384 23.6 6.6
Total 1331 100.0 293 100.0 1624 100.0 100 (321,717)
Table 2: Reported number of trips by different groups in a week by mode and their differences
Primary pupil
Primary parent
Primary pupil vs. primary parent
b
Secondary pupil
Secondary parent
Secondary pupil vs. secondary parentb
t Mean difference
t Mean difference
t (based on standardised sample)
Car 6.84 7.28 -1.195 -0.44 2.41 5.63 -8.627a -3.22 -5.93
a
Bus 0.40 0.38 0.319 0.02 5.14 1.79 11.513a 3.35 7.59
a
Walk 2.44 2.33 0.267 0.10 1.96 2.04 -0.249 -0.08 -0.86
Bicycle 0.04 0.00 0.01 0.00
Taxi 0.14 0.00 0.01 0.00
Train 0.00 0.00 0.00 0.00
Total 9.86 9.89 9.53 9.46 a Coefficients are significant at the 0.05 level
b Coefficients are not calculated for some modes due to non-response

23
Table 3: Reasons for (not) using the car to and from schools (multiple response set)
Reason for using the car Count Column N % Reason for not using the car Count Column N %
Students want to use the car 679 97.8 Students do not want to use the car 268 59.3
Students feel safe 0 0.0 Students feel unsafe 0 0.0
It is fast 673 97.0 Students do not like it 0 0.0
Bad weather 464 66.9
Parents want me to use the car 461 66.4 Parents do not want me to use the car 50 11.1
Safest way of travel 431 62.1
Comfortable way of travel 627 90.3
No alternative exists 116 16.7
Public transport is not suitable 114 16.4
Other 32 4.6 Other (e.g. no car) 137 30.3
Table 4: Multivariate multiple regression analyses results showing the mode choice behaviour of pupils
Model 1 (Primary pupil and primary parent)
Model 2 (Secondary pupil)
Car
Bus
Walk
Car
Bus
Walk
Coef. t Coef. t Coef. t Coef. t Coef. t Coef. t
Girls (ref: boys) -0.61 -2.07a
-0.01 -0.12 0.71 2.40a
-0.76 -2.72a
0.00 0.00 0.60 2.51a
Rural (ref: urban) 3.72 6.97a
-0.36 -2.63a
-3.46 -6.45a
-5.05 -4.91a
7.606 6.38a
-1.99 -2.25a
Management type
Protestant controlled (ref)
Catholic maintained 0.23 0.51 0.20 1.79b
-0.38 -0.85 -0.72 -1.58 0.35 0.66 1.24 3.16a
Integrated - - - - - - 4.72 3.99a
-8.03 -5.86a
3.70 3.64a
Net residential density - - - - - - 0.05 2.85a
-0.10 -5.01a
0.03 2.01a
Land use diversity 7.26 6.19a
0.04 0.12 -7.62 -6.46a
18.96 4.81a
-32.62 -7.15a
10.23 3.02a
Intersection density -0.42 -1.21 -0.34 -3.87a
0.98 2.83a
-3.11 -2.80a
4.98 3.87a
0.44 0.46
Multiple deprivation rank 0.00 0.27 -0.00 -3.27a
0.00 0.37
0.02 4.56a
-0.04 -7.26a
0.01 3.52a
Constant 4.26 4.03a
1.22 4.56a
4.37 4.12a
-23.05 -3.50a
53.78 7.05a
-15.75 -2.78a
F 13.85a 4.50
a 15.79
a 11.99
a 21.13
a 5.47
a
R2
0.09 0.03 0.11 0.12 0.19 0.05
Wilks’ lambda (F) 7.02a
12.17a
Lawley-Hotelling trace (F) 6.87a
11.40a
Pillai’s trace (F) 7.15a
12.94a
Roy’s largest root (F) 16.18a
31.73a
N 764 717 a Coefficients are significant at the 0.05 level;
b Coefficients are significant at the 0.1 level.
24
10. Figure captions
Figure 1: Spatial cluster/outlier analysis showing residential segregation of different religious groups in
NI (based on 2001 census data)
Figure 2: Spatial distribution of the surveyed schools by type and sample sizes
Figure 3: Network connectivity levels of two school neighbourhoods in Belfast
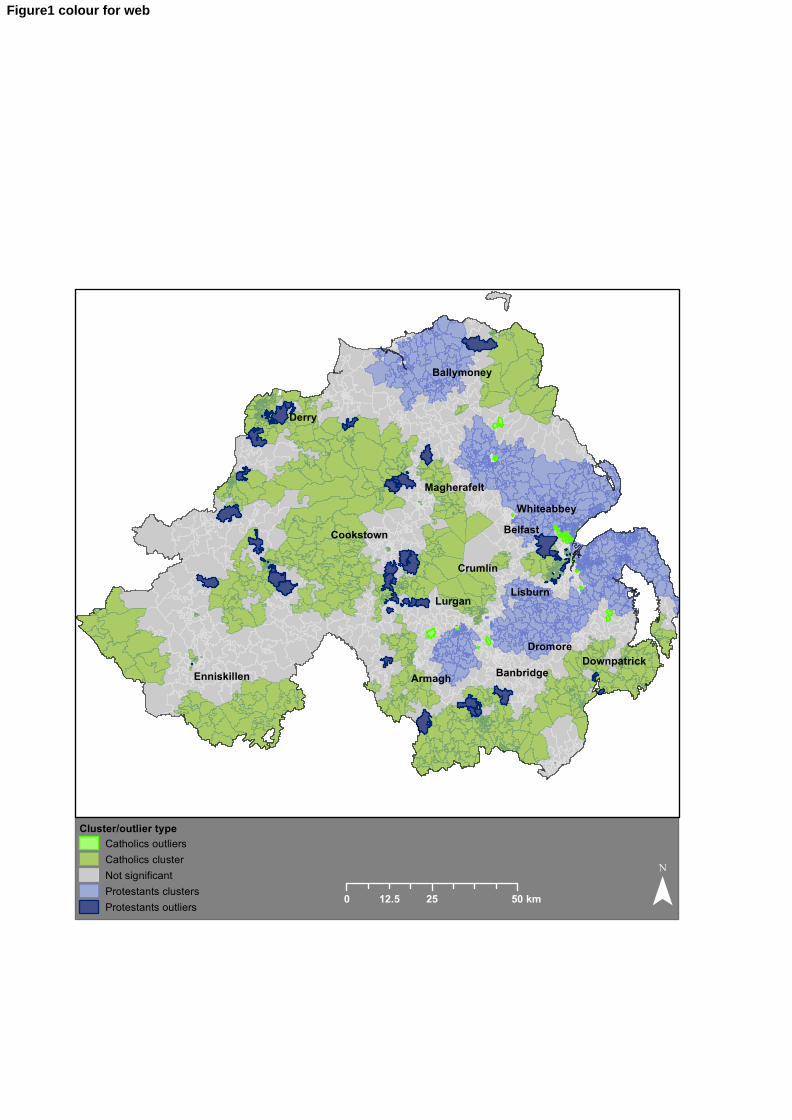
Cluster/outlier typeCatholics outliersCatholics clusterNot significantProtestants clustersProtestants outliers 0 25 5012.5 km ¯
Belfast
Dromore
Crumlin
Ballymoney
Derry
Lurgan
Downpatrick
Cookstown
Enniskillen
Magherafelt
Banbridge
Lisburn
Whiteabbey
Armagh
Figure1 colour for web

Cluster/outlier typeCatholics outliersCatholics clusterNot significantProtestants clustersProtestants outliers 0 25 5012.5 km ¯
Belfast
Dromore
Crumlin
Ballymoney
Derry
Lurgan
Downpatrick
Cookstown
Enniskillen
Magherafelt
Banbridge
Lisburn
Whiteabbey
Armagh
Figure1 BW for print

Secondary schools (sample sizes)1050
100
Primary schools (sample sizes)10
50
100
Local Government DistrictsMotorwayRailwayUrban areaRural areaRoads 0 10 205 km ¯
Belfast
Dromore
Crumlin
Ballymoney
Derry
Lurgan
Downpatrick
Cookstown
Enniskillen
Magherafelt
Banbridge
Lisburn
Whiteabbey
Armagh
Bangor
Figure2

¹½¹»
IntersectionsCul-de-sacsRoad networks
School type
¹» Primary
¹½ Secondary
Intersection density (number/hectare)0.03 - 0.100.11 - 0.420.43 - 0.700.71 - 1.161.17 - 1.90
0 250 500125 m ±
Chu
rch
Roa
d
Upper
Kno
ckre
da R
oad
Orm
eau
Road
Rav
enhi
ll R
oad
Knockreda Road
Lock
view
Roa
d
Wellington CollegeForge Integrated Primary School
Figure3