journal of power sources -...
TRANSCRIPT

lable at ScienceDirect
Journal of Power Sources 273 (2015) 697e706
Contents lists avai
Journal of Power Sources
journal homepage: www.elsevier .com/locate/ jpowsour
Bacterial nanocellulose/Nafion composite membranes for lowtemperature polymer electrolyte fuel cells
Gao-peng Jiang a, b, c, Jing Zhang b, Jin-li Qiao b, **, Yong-ming Jiang a, Hadis Zarrin c,Zhongwei Chen c, Feng Hong a, d, *
a Group of Microbiological Engineering and Industrial Biotechnology, College of Chemistry Chemical Engineering and Biotechnology, Donghua University,North Ren Min Road 2999, Shanghai 201620, Chinab College of Environmental Science and Engineering, Donghua University, North Ren Min Road 2999, Shanghai 201620, Chinac Department of Chemical Engineering, University of Waterloo, 200 University Avenue West, Waterloo, ON N2L 3G1, Canadad State Key Laboratory for Modification of Chemical Fibers and Polymer Materials, Donghua University, Shanghai 201620, China
h i g h l i g h t s
� A series of novel nanocomposite membranes of BC and Nafion are fabricated for DMFC.� The novel BC/Nafion membranes were reinforced with concrete-like structure.� Membranes show high strength, good proton conductivity and low methanol permeability.� The annealed membranes are more suitable for DMFC.� High PEMFC and DMFC performances are obtained from annealed B1N7 membranes.
a r t i c l e i n f o
Article history:Received 27 May 2014Received in revised form5 September 2014Accepted 22 September 2014Available online 30 September 2014
Keywords:Bacterial celluloseNafionBlend membraneProton conductivityAnnealingMembrane electrode assembly
* Corresponding author. Group of MicrobiologicalBiotechnology, College of Chemistry Chemical EngDonghua University, North Ren Min Road 2999, Shfax: þ86 21 67792649.** Corresponding author. Tel.: þ86 21 67792379; fax
E-mail addresses: [email protected] ([email protected] (F. Hong).
http://dx.doi.org/10.1016/j.jpowsour.2014.09.1450378-7753/© 2014 Elsevier B.V. All rights reserved.
a b s t r a c t
Novel nanocomposite membranes aimed for both proton-exchange membrane fuel cell (PEMFC) anddirect methanol fuel cell (DMFC) are presented in this work. The membranes are based on blendingbacterial nanocellulose pulp and Nafion (abbreviated as BxNy, where x and y indicates the mass ratio ofbacterial cellulose to Nafion). The structure and properties of BxNymembranes are characterized by FTIR,SEM, TG, DMA and EIS, along with water uptake, swelling behavior and methanol permeability tests. It isfound that the BxNy composite membranes with reinforced concrete-like structure show excellentmechanical and thermal stability regardless of annealing. The water uptake plus area and volumeswelling ratios are all decreased compared to Nafion membranes. The proton conductivities of pristineand annealed B1N9 are 0.071 and 0.056 S cm�1, respectively, at 30 �C and 100% humidity. Specifically,annealed B1N1 exhibited the lowest methanol permeability of 7.21 � 10�7 cm2 s�1. Through the selec-tivity analysis, pristine and annealed B1N7 are selected to assemble the MEAs. The performances ofannealed B1N7 in PEMFC and DMFC show the maximum power densities of 106 and 3.2 mW cm�2,respectively, which are much higher than those of pristine B1N7 at 25 �C. The performances of thepristine and annealed B1N7 reach a level as high as 21.1 and 20.4 mW cm�2 at 80 �C in DMFC,respectively.
© 2014 Elsevier B.V. All rights reserved.
Engineering and Industrialineering and Biotechnology,anghai 201620, China. Tel./
: þ86 21 67792159.Qiao), [email protected],
1. Introduction
Proton conducting membrane is one of the essential and criticalmaterials in both proton exchangemembrane fuel cell (PEMFC) anddirect methanol fuel cell (DMFC). Compared to PEMFC, DMFC isconsiderably more suitable for powering portable electric devices,such as laptops and cameras, because of its high power density[1,2]. However, the methanol crossover caused by the intrinsicproperty of commercial membranes, i.e. Nafion, results in about
G.-p. Jiang et al. / Journal of Power Sources 273 (2015) 697e706698
40% loss of fuel when 2 M methanol aqueous solution is fed. Themigrated methanol poisons the cathode catalyst by being oxidizedinducing an overpotential at the electrode [2,3]. Moreover, in thepresence of ruthenium (Ru) in the anode catalyst, which is ad-vantageous to reduce carbon monoxide (CO) poisoning, Ru can becarried by methanol crossover and thus the DMFC performancesignificantly diminishes [2]. Additionally, high cost of Nafion,$600e1200m�2, is another barrier for its extended applications [2].Therefore, novel proton exchangemembranes (PEMs) with high ionconductivity and low methanol permeability are vitally required tobe developed.
To date, different methodologies and strategies have beenapplied to fabricate PEMs for DMFC, either via grafting [4], cross-linking [5], or combining polymer electrolytes with nanoparticles[6], carbon nanotube [7], graphene oxide [8], and acidebase com-plex [9], or by employing layer-by-layer (LBL) [10], and blending[11] methods. Among them, blending is an easy and efficienttechnique to improve PEMs properties. One strategy is to blendNafion with methanol blocking materials such as PVA [12,13], PTFE[14], PVDF [15] and SiO2 [6], and the other one is to blend protondonors with hydrocarbon polymers including PVA [5,16,17], PBI [18]and SPEEK [19].
Bacterial cellulose (BC), mainly generated by the genus Gluco-nacetobacter, (formerly Acetobacter sp.), in particular G. xylinus andG. hansenii. Furthermore, it could be produced from a traditionalbeverage culture called Kombucha that is a symbiont of Glucona-cetobacter and one or more yeasts [20]. Essentially, BC is a kind ofpure cellulose material with special 3D nanostructure morphologyformed by nanofibrils with the diameter of 20e100 nm [21e23]. Itsdistinguished properties from plant cellulose include high crystal-linity, high tensile strength, high water binding capacity, low gaspermeation and good biocompatibility [23]. BC has been reportedto be used as a pervaporation membrane to separate ethanol andwater [24,25], which implies that BCmembrane is capable to have alow alcohol permeability. In addition, a sulfonated regeneratedcellulose membrane and a cellulose acetate membrane that have asimilar structure as BC, have been reported to work as a potentialmembrane and a separator in DMFC respectively [26,27].Combining those two examples, it is reasonable to deduce thepossible application of BC in DMFC. Most recently, 2-acrylamido-2-methyl-1- propanesulfonic acid-grafted BC membranes was syn-thesized and reported its application in DMFC, which partiallytestified the deduction above [29]. To prove the potential applica-tion of BC in DMFC, an easy and direct fabrication methodologyneeds to be developed.
In this work, a series of BC/Nafion nanocomposite membraneshave been prepared by incorporating BC pulp into Nafion solution,and their potentials both in PEMFC and DMFCwere evaluated. Sincethe annealing process has significant effects on Nafion containedmembranes [29], the differences between pristine and annealedBC/Nafion membranes were studied and characterized thoroughlyby FTIR, TGA, DMA, SEM, water uptake capability, swelling prop-erty, proton conductivity, methanol permeability and selectivity, aswell as single cell tests in PEMFC and DMFC systems.
2. Experimental
2.1. Fermentation and purification of bacterial cellulose
Kombucha was purchased from local market and used to pro-duce large amounts of bacterial cellulose pellicles in this study. Thefermentation medium was the same as the seed medium and thepreparation was as follows. Cool tea infusion was made by soaking0.5% (w/v) green tea in boiling deionized (DI) water for 20 min andthen was used to dissolve 5% (w/v) D-glucose, 0.5% (w/v) yeast
extract (Oxoid, UK), and 0.3% (w/v) tryptone (Oxoid, UK). Then thebrownish liquid culture medium was split into pre-autoclavedflasks with lids followed by pasteurization without pH regulation.
A Kombucha pellicle preserved in a seed mediumwas chosen asthe seed inoculum. The pellicle was cut into small pieces with asterilized scissor in a sterile hood and one or two pieces wereinoculated into a 100 mL fermentation medium. After static incu-bation at 30 �C for seven to ten days, thick yellowish BC pelliclesformed at the top of the cultures.
BC pellicles were harvested and rinsed with the DI water toremove soluble medium components and then treated in 1.0% so-dium hydroxide solution for 2 h at 80 �C to eliminate attachedbacterial cells and other impurities. Thereafter, BC pellicles werefurther purified by boiling in the DI water for 2 h. The purificationprocess was repeated until the BC samples changed to milky coloror semitransparent. Finally, the BC hydrogels were rinsed with theDI water until the pH value of the eluent was neutral and theabsorbance at 280 nm of the eluent was the same as water. Thepurified BC pellicles were stored in the DI water at 4 �C for furtheruse.
2.2. Preparation of bacterial cellulose pulp
Similar to the method used by Helbert et al. [30], a food blenderwas applied to homogenize BC. Small pieces of BC pellicles and DIwater of threefold weight of the BC gel were placed into the foodblender, and then the BC pulp was prepared by continuously cut-ting at a full speed for 30 min until no big gel piece was observed.The homogenous BC pulp was poured into a sterilized containerwith a lid, sealed with parafilm and preserved at 4 �C. Triplicatepulp samples of 10 mL were dried at 105 �C overnight and weighedto determine the content of drymass in the BC pulp. An appropriateBC concentration range was 3e5 mg L�1.
2.3. Preparation of BC/Nafion blending membranes
Considering the insolubility of Nafion in water, differentamounts of 5% Nafion solution (Dupont) were added in the mixtureof BC pulp, n-propanol and ethanol (45:48:2, w/w) and stirred atlow speed under room temperature overnight. The homogenoussuspension was concentrated by vacuum distillation in a rotaryevaporator at 50 �C followed by cooling and degasing in a vacuumdrying oven for 15 min. Then, the condensed pulp was transferredinto glass Petri dishes and de-bubbled with capillary tubes in orderto cast into the BC/Nafion blend membranes under roomtemperature.
Few days later, the formed BC/Nafion membranes were peeledoff from the petri dishes carefully after immersing in DI waterovernight. In order to eliminate soluble impurities, the harvestedBC/Nafion membranes were rinsed with DI water until no alcoholcould be detected in the immersion liquid by comparing O.D. valueof rinsing water with that of the blank control group at 525 nmafter they were reacted with acidic potassium permanganate.Thereafter, the BC/Nafion membranes were dried at ambient tem-perature and half of them were annealed at 110 �C for 1 h just likethe PVA/Nafion blends [29].
2.4. Characterization of BC/Nafion membranes
The BC/Nafion membranes were characterized by attenuatedtotal reflection fourier transform infrared (ATR-FTIR) spectra. Themembrane samples were placed on an infrared spectrometer(NEXUS-670, Nicolet-Thermo) covering the diamond of ATR in-strument, then spectrograms with a wavenumber resolution of4 cm�1 in the range from 4000 to 650 cm�1 were obtained.

G.-p. Jiang et al. / Journal of Power Sources 273 (2015) 697e706 699
A thermogravimetric analysis (TGA) of membranes was carriedout on an analyzer (TG 209, NETZSCH). Sample of 5 mg was loadedinto an alumina oxide pan and thenwas heated from 25 to 700 �C ata heating rate of 10 �C min�1 under a protection of nitrogen flow at20 mL min�1 [31].
Membrane samples for dynamic thermal mechanical analysis(DMA) were cut into strips with 2e3 cm long and 2e8 mm wideand dried under vacuum at 60 �C overnight. BC/Nafion membraneswere loaded on a DMA apparatus (Q800, TA) and tested with astable frequency of 1 Hz, a preloaded force of 0.01 N, a detectablestress of 0.01 N, a heating rate of 2 �C per minute and temperaturerange from�50 �C to 150 �C in a model of multi frequencies-stress.
Cross-sectional images of the membranes were inspected byusing FEI Quanta 250 scanning electron microscope (SEM), whichwas operated at 10 kV under high vacuum circumstance. Thespecimens were sputtered with gold followed by observing at low(�1000 or 2000) and high (�10000) magnifications.
2.5. Water uptake and dimensional stability
Both the BC/Nafion membranes before and after annealing weresoaked in DI water for at least 24 h. They were picked out tomeasure the thickness and then transferred to a smooth glass plateto measure the length and width. The water on the surface wascarefully removed with filter paper and the membranes wereimmediately weighed. After drying samples at 60 �C overnight, thelength, width, thickness and weight of the membranes weremeasured. Then, the water uptake (WU) of membranes (g g�1) wascalculated as follows:
WU ¼�Wwet �Wdry
�.Wdry (1)
where Wwet and Wdry represent the masses of the swollen anddried membranes, respectively [34]. The area swelling ratio (ASR)and volume swelling ratio (VSR) were calculated according to thefollowing equations:
ASR ¼ Awet � Adry
Adry� 100% (2)
VSR ¼ Vwet � Vdry
Vdry� 100% ; (3)
where Awet, Vwet and Adry, Vdry are the area and volume of the fullyhydrated membranes and the dry membranes, respectively [33].
2.6. Proton conductivity
The proton conductivity of BC/Nafion membranes wasmeasured by using an electrochemical impedance analyzer(PAR2273, Prinston) under test conditions that AC frequency wasscanned from 100 kHz to 0.1 Hz at voltage amplitude of 100 mV.Both the BC/Nafionmembranes before and after annealingwere cutinto pieces with a size of 1 � 1.5 cm and were sandwiched in aTeflon conductivity cell equipped with Pt foil contacts where Ptblack was plated [17,31]. The proton conductivity (S cm�1) wascalculated using the following expression:
s ¼ l=Rbd (4)
where l is the distance between two potential sensing platinumfoils, R is the membrane resistance, b and d are the width and thethickness of the membrane, respectively [31].
2.7. Methanol permeability and selectivity
Methanol permeability of BC/Nafion membranes was measuredby using a home-made liquid diffusion cell which consisted of twomirror symmetric glass compartments with a capacity of approxi-mate 300mL for each one. Themembranes, equilibrated in DI waterfor at least 24 h prior to the test, were attached on the ground glasssurfaces of two compartments, and sandwiched between thecompartments vertically by sealing with O-rings. The two com-partments were connected and immobilized with flanges, whichleft an effective area of 8.74 cm2 towork [32]. The left compartmentwas fed with aqueousmethanol solution (1mol L�1) while the rightone was filled with pure DI water, which were both well-stirredduring the test. With methanol diffusion from the left to the rightdriven by the concentration difference, the methanol concentrationin the right compartment increased gradually and appeared a linearrelationship with time. Combining with timing sampling anddetermination of the concentration of permeating methanol withgas chromatography (7890A, Agilent Technologies), a plot ofmethanol concentration in the right compartment as function oftime could be depicted and the methanol permeability (PM/cm2 s�1) could be calculated with slope (S) of the plot by thefollowing equation:
PM ¼ SVRdACL
(5)
where A and d are the membrane area and thickness, respectively,while cL and VR represent the initial concentration of methanol inthe left compartment and the volume of DI water in the rightcompartment respectively [34].
The selectivity (a) was a measurable standard of membranes toevaluate their potential application in DMFC, which was defined asthe ratio of proton conductivity (s) to methanol permeability (PM)[35,36], shown as follows.
a ¼ s=PM (6)
2.8. MEA fabrication and single-cell performance tests for PEMFCand DMFC
The fabrication of MEAs was as follows. The anode catalyst layerdeposited on the carbon paper (Toray TGP-H-090) was the mixtureof 30%Pt/15%Ru/C catalyst (Johnson Matthey) and Nafion (DuPont)with the ratio of 3:1 and metal loading of 1.72 mg cm�2 while thecathode catalyst layer was the mixture of 40%Pt/C catalyst (JohnsonMatthey) and Nafion with Pt loading of 0.95 mg cm�2 instead. TheBC/Nafion membranes before or after annealing with a size of4 � 4 cm were sandwiched with those carbon papers coated withcatalyst and binder prior to being hot-pressed at a pressure of10 MPa at 100 �C for 3 min [37].
The MEAs with an active area of 4 cm2 were activated andevaluated in a single H2/O2 fuel cell where the performance ofPEMFC was observed under the test condition that purehydrogen and oxygen were supplied to enter the anode andcathode channels at a flux of 100 and 70 mL min�1, respectively,through a humidifier worked at 25 �C under ambient pressure.Thereafter, the fuel was changed from hydrogen to aqueousmethanol solution (1 mol L�1) at the flux of 5 mL min�1 and theflux of oxygen increased to 100 mL min�1 to test the DMFCperformance of BC/Nafion membranes at ambient temperature,60 �C and 80 �C, respectively. All the polarization curves andpower density curves were obtained using a fuel cell evaluationsystem (GE/FC1-100) [31,36].

G.-p. Jiang et al. / Journal of Power Sources 273 (2015) 697e706700
3. Results and discussion
3.1. ATR-FTIR
Typical ATR-FTIR spectra of different BC/Nafion membranesbefore and after annealing, Nafion 115, and casted BC membraneare displayed in Fig. 1. The characteristic bands of cellulose at 3345,2847e2921, 1162, 1110, 1059, 1035 cm�1 were observed in thecasted BC membrane, where were assigned as ns(OeH), ns(CeH) inmethylene andmethylidyne, nas (CeOeC) at b-glycosidic linkage, ns(CeC) of glucose ring, ns(CeO) of secondary alcohol at C-2, C-3 andprimary alcohol at C-6, respectively [31,38e40]. Besides, othermarked peaks in fingerprint region such as in-plane bending vi-bration of CH2 at 1483 and 1425 cm�1 andwagging vibration of CH2at 1316 cm�1 as well as the water molecular absorbance at1638 cm�1 were found in the casted BCmembrane. As to Nafion 115membrane, a board peak around 3454 cm�1 assigned as thestretching vibration of hydroxyl in sulfoacid groups and theabsorbed water molecules was observed. Several other character-istic bands of Nafionwere found too. According to the reference, thebands at 1213, 1153, 1058 cm�1 meant the existence of sulfoacidgroups in the membrane, which represented the asymmetricstretching vibration, the symmetric stretching vibration of S]O insulfoacid groups after absorbing with water and the stretching vi-bration of SeO, respectively [41]. Meanwhile, as mentioned inreferences, peaks at 1213, 1153 cm�1 might be attributed to theasymmetric and symmetric stretching vibration of CeF on theskeleton of PTFE in Nafion too. The sharp shoulder peaks at 983 and971 cm�1 were the typical absorbance of CeOeC on the side chainof Nafion [41e43]. Some peaks of BC and Nafion were overlapped:3300e3400 cm�1, 1150e1160 cm�1, 1055e1060 cm�1. Therefore,peaks around 2800e3000, 1110 and 1034 cm�1 could be used toprove the existence of BC while bonds around 1213, 983 and971 cm�1 could illustrate the existence of Nafion.
As shown in Fig. 1, both membranes B1N1 and B1N7 displayedthe characteristic peaks of BC and Nafion regardless of beingannealed or not. This result clearly demonstrates the existence ofboth substances in the blendmembranes. Compared to B1N7, B1N1membranes with lower proportion of Nafion, the characteristicbands of both BC and Nafion were intense and marked, even thosepeaks ranging from 1300 to 1500 cm�1, whose spectra resembled
Fig. 1. ATR-FTIR spectra of casted BC, Nafion 115 and different BC/Nafion membranesbefore and after annealing. B1N1 and B1N7 represent BC/Nafion membranes with aratio of BC to Nafion of 1:1 and 1:7, respectively.
the one of BC. However, by increasing the Nafion loading, the in-tensity of some characteristic bands of BC have been either lessenedor shadowed by Nafion peaks, such thatn(OeH), n(CeH) andns(CeO) of primary alcohol were remained to verify the existence ofBC. In the prepared BC/Nafion blend membranes, some character-istic peaks still existed, such as ns (CeC) of glucose ring of BC at1110 cm�1 and n (CeOeC) of side chain of Nafion at 983 cm�1 whilstsome other bands were shifted. For instance, the symmetricstretching vibration of hydroxyl was red-shifted from 3345 cm�1 inBC and 3454 cm�1 in Nafion to 3339 cm�1 in B1N1 and 3343 cm�1
in B1N7, respectively. Likewise, the asymmetric stretching vibrationof CeF and S]O at 1213 cm�1 was shifted to 1224 cm�1 in B1N1and 1217 cm�1 in B1N7 respectively, i.e. the blue-shift effect. Thosered and blue shifts perfectly proved the hydrogen bonds betweenthe CeF or sulfoacid groups of Nafion and the hydroxyls of BC.
Moreover, Fig.1 indicates, no remarkable changes in the spectrumof B1N1 after annealing were observed compared to that beforeannealing, except for slightly lower intensityof somepeaks.However,samples with high ratio of Nafion, i.e. B1N7, showed distinguishedchanges in the spectra after annealing. Most of the characteristicpeaks of BC in the annealed membrane were shadowed or vanishedwhich left merely the weak absorption bands of hydroxyl andmethylene as the proof of the existence of BC. Furthermore, the in-tensityof bandsassignedasns(OeH),nas (CeF)ornas (S]O)wasmuchlower than that of the pristine one, which indicates the heating pro-cess might trigger some reaction between hydroxyls and sulfoacidgroups like esterification or dehydration reaction [44]. The low in-tensitymight be ascribed to the low proportion of BC (approximatelyone eighth) too. According to literature, the side and main chains ofNafion start to gradually degrade after been heated up to 320 �C andhigher temperatures, respectively [42,44]. However, in this study thepeak intensity at 983 cm�1 did not significantly shift or reduce, indi-cating that the annealing process did not drastically affect the sidechain or the main skeleton of Nafion.
3.2. Thermal stability
The thermal stabilities of the BC/Nafion blend membranes wereinvestigated before and after annealing by using thermogravimetricanalysis and the results aredisplayed inFig. 2. As shown inFig. 2, therewas only one significantweight loss stage in both TG and DTG curvesof casted BC, beginning at 280 �C and ending at 400 �C, which is inagreement with references [31,45]. For Nafion 115, three typicalweight loss stageswere observed, includingwater evaporation below120 �C, degradation of side chain from 280 to 380 �C and decompo-sition of the PTFE skeleton ranging from 380 to 560 �C, which wereconsistent with TGA-IR results reported by Perusich [41]. Therefore,the two raw materials were thermally stable below 250 �C.
However, the situation changed after blending. Not only thetypical weight loss stages of BC and Nafion occurred at lowertemperature, but also a new weight loss stage emerged between120 and 200 �C. The more proportion of Nafion in the blendmembranes, the lower temperature the new weight loss stagestarted, which could be clearly distinguished by the DTG curves ofB1N1 and B1N5 in Fig. 2b. This might result from the dehydrationreaction between sulfoacid groups of Nafion and the hydroxyls ofBC, or acid catalysis of Nafion just like inorganic acid to thedegradation of cellulose [31,44]. In addition, the DTG profile ofB1N5 displayed three typical pyrolysis peaks while that of B1N1appeared multi-peaks, which needs to be analyzed by using TGA-IRor other tests in a further study. However, no matter how muchweight of B1N1 was lost, they were still thermally stable under thenormal operating temperature of DMFC (<100 �C).
The effect of annealing on BC/Nafion blend membranes could beobserved from TG and DTG curves. As shown in Fig. 2, after

Fig. 2. TGA profiles of casted BC, Nafion 115 and different BC/Nafion membranes beforeand after annealing. B1N1 and B1N5 represent BC/Nafion membranes with a ratio of BCto Nafion of 1:1 and 1:5, respectively.
G.-p. Jiang et al. / Journal of Power Sources 273 (2015) 697e706 701
annealing, the blend membranes with different ratio of BC toNafion displayed different characteristic weight loss stages andDTG peaks. However, theywere quite similar to the ones before andafter annealing, and the annealed B1N5 even coincided with thepristine one. In the DTG curves, the shift of weight loss peaks tolower temperature was found in the annealed B1N1 samples ascompared to the samples before annealing. For instance, the tem-perature at maximumweight-loss rate (Tmax) for three main peaksdecreased from 170, 228 and 406 �C to 163, 221 and 396 �C,respectively. Whereas, the Tmax of B1N5 did not change remarkablyafter annealing, indicating that the heating process had less influ-ence on the BC/Nafion blend membranes with high ratio of Nafion.It is noteworthy that the amounts of weight loss of most peaksweremarginally lessened after annealing, especially the newweight losspeaks in both B1N1 and B1N5. This implies that the annealingprocess might be helpful to eliminate the new weight loss stage.Hence, the stability of annealed BC/Nafion membranes was quali-fied for the application in DMFC.
Fig. 3. Characteristic curves of storage modulus and loss factor towards temperature ofNafion 115 (a), casted BC and BC/Nafion (1:1) membranes before (b) and afterannealing (c).
3.3. Dynamic mechanical thermal analysis
The DMA profiles of Nafion 115, casted BC, pristine and annealedB1N1membranes are displayed in Fig. 3, including storagemodulus
and loss factor as function of temperature. Normally, DMA test is abest choice for the investigation of glass transition of polymers withhigh degrees of crystallinity or cross-linking, because the change ofloss factor near glass transition point is much more sensitive thanenthalpimetric analysis like DSC [46]. Given the stretching testmodel, the storage moduli of membranes could represent theirYoung's moduli. Hence, the DMA test could give the information ofboth glass transition and mechanical properties of membranes.
As shown in Fig. 3a, the storage modulus of Nafion 115 wasabout 220 MPa under the ambient temperature and declinedslowly as temperature increased, but dropped sharply at a higher
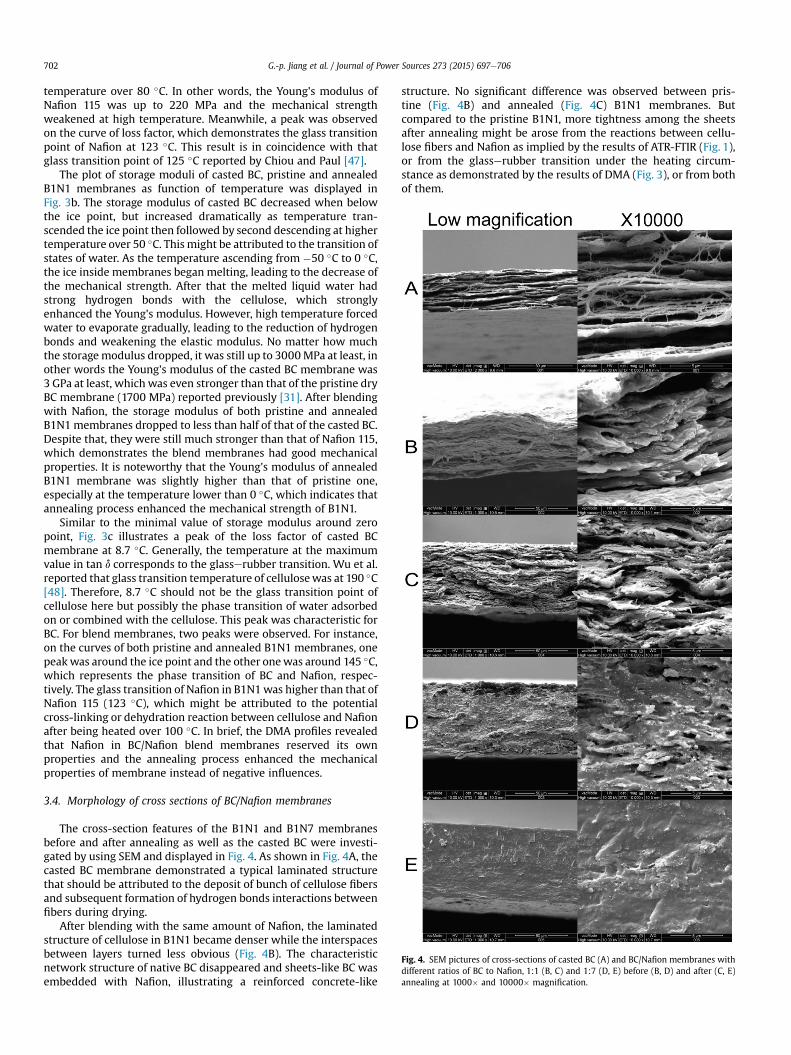
Fig. 4. SEM pictures of cross-sections of casted BC (A) and BC/Nafion membranes withdifferent ratios of BC to Nafion, 1:1 (B, C) and 1:7 (D, E) before (B, D) and after (C, E)annealing at 1000� and 10000� magnification.
G.-p. Jiang et al. / Journal of Power Sources 273 (2015) 697e706702
temperature over 80 �C. In other words, the Young's modulus ofNafion 115 was up to 220 MPa and the mechanical strengthweakened at high temperature. Meanwhile, a peak was observedon the curve of loss factor, which demonstrates the glass transitionpoint of Nafion at 123 �C. This result is in coincidence with thatglass transition point of 125 �C reported by Chiou and Paul [47].
The plot of storage moduli of casted BC, pristine and annealedB1N1 membranes as function of temperature was displayed inFig. 3b. The storage modulus of casted BC decreased when belowthe ice point, but increased dramatically as temperature tran-scended the ice point then followed by second descending at highertemperature over 50 �C. This might be attributed to the transition ofstates of water. As the temperature ascending from �50 �C to 0 �C,the ice inside membranes began melting, leading to the decrease ofthe mechanical strength. After that the melted liquid water hadstrong hydrogen bonds with the cellulose, which stronglyenhanced the Young's modulus. However, high temperature forcedwater to evaporate gradually, leading to the reduction of hydrogenbonds and weakening the elastic modulus. No matter how muchthe storagemodulus dropped, it was still up to 3000MPa at least, inother words the Young's modulus of the casted BC membrane was3 GPa at least, which was even stronger than that of the pristine dryBC membrane (1700 MPa) reported previously [31]. After blendingwith Nafion, the storage modulus of both pristine and annealedB1N1membranes dropped to less than half of that of the casted BC.Despite that, they were still much stronger than that of Nafion 115,which demonstrates the blend membranes had good mechanicalproperties. It is noteworthy that the Young's modulus of annealedB1N1 membrane was slightly higher than that of pristine one,especially at the temperature lower than 0 �C, which indicates thatannealing process enhanced the mechanical strength of B1N1.
Similar to the minimal value of storage modulus around zeropoint, Fig. 3c illustrates a peak of the loss factor of casted BCmembrane at 8.7 �C. Generally, the temperature at the maximumvalue in tan d corresponds to the glasserubber transition. Wu et al.reported that glass transition temperature of cellulosewas at 190 �C[48]. Therefore, 8.7 �C should not be the glass transition point ofcellulose here but possibly the phase transition of water adsorbedon or combined with the cellulose. This peak was characteristic forBC. For blend membranes, two peaks were observed. For instance,on the curves of both pristine and annealed B1N1 membranes, onepeakwas around the ice point and the other onewas around 145 �C,which represents the phase transition of BC and Nafion, respec-tively. The glass transition of Nafion in B1N1was higher than that ofNafion 115 (123 �C), which might be attributed to the potentialcross-linking or dehydration reaction between cellulose and Nafionafter being heated over 100 �C. In brief, the DMA profiles revealedthat Nafion in BC/Nafion blend membranes reserved its ownproperties and the annealing process enhanced the mechanicalproperties of membrane instead of negative influences.
3.4. Morphology of cross sections of BC/Nafion membranes
The cross-section features of the B1N1 and B1N7 membranesbefore and after annealing as well as the casted BC were investi-gated by using SEM and displayed in Fig. 4. As shown in Fig. 4A, thecasted BC membrane demonstrated a typical laminated structurethat should be attributed to the deposit of bunch of cellulose fibersand subsequent formation of hydrogen bonds interactions betweenfibers during drying.
After blending with the same amount of Nafion, the laminatedstructure of cellulose in B1N1 became denser while the interspacesbetween layers turned less obvious (Fig. 4B). The characteristicnetwork structure of native BC disappeared and sheets-like BC wasembedded with Nafion, illustrating a reinforced concrete-like
structure. No significant difference was observed between pris-tine (Fig. 4B) and annealed (Fig. 4C) B1N1 membranes. Butcompared to the pristine B1N1, more tightness among the sheetsafter annealing might be arose from the reactions between cellu-lose fibers and Nafion as implied by the results of ATR-FTIR (Fig. 1),or from the glasserubber transition under the heating circum-stance as demonstrated by the results of DMA (Fig. 3), or from bothof them.

G.-p. Jiang et al. / Journal of Power Sources 273 (2015) 697e706 703
With the proportion of Nafion increasing, the cross-section ofblend membrane such as B1N7 became much more condensed andless laminated (Fig. 4D). In spite of the disappearance of the obviouslaminated structure, the cellulose fiber bunches were stillembedded with Nafion. After being annealed, B1N7 displayed adifferent structure (Fig. 4E). The cross-sectional structure was notonly compact but also uniform. The sheets-like structurewas barelyfound in the SEM pictures (Fig. 4E). The reasons for the structurechange might be the same as the annealed B1N1. Whereas, in viewof the large percentage of Nafion in the blend membrane and lowerTg as tested by DMA, it could be reasonably assumed that theglasserubber transition of Nafion dominated the structural changeduring annealing by dispersing and embedding cellulose fibers aswell as flowing into and stuffing the pores or gaps in the mem-branes. In general, the annealing process was helpful to tighten thestructure of membranes.
3.5. Water uptake and dimensional stability
Thewater uptake (WU) of the Nafion/BC blendmembranes withdifferent ratios of BC to Nafion before and after annealing are dis-played in Fig. 5. Prior to annealing process, the pristine BC/Nafionblends demonstrated the water uptake of 0.9e1.2 g g�1, which wasslightly lower than that of casted BC (blue dotted line) but was farhigher than that of Nafion 115 (red solid line) (in web version). TheWU of samples increased with the proportion of Nafion addedexcept B1N5. However, the WU dropped sharply to 0.2e0.3 g g�1
after annealing process. Furthermore, the WU decreased whenmore Nafion was incorporated, even lower than that of Nafion 115.The dramatic change might imply structural changes. As low wateruptake is a desirable property for proton exchange membrane, theblends containing more Nafion should be more suitable for DMFC.
The dimensional properties were investigated by ASR and VSR.As shown in Fig. 6a, all the blendmembranes enlarged less than 10%in area no matter whether they were annealed or not. The areaswelling ratio was much lower than that of Nafion 115 (21%)marked with a red line (in web version). In general, the ASRincreased with the rise of ratio of Nafion. However, Fig. 6b dem-onstrates that the VSR of BC/Nafion blends transited from highswelling ratios before annealing to a lower level than that of Nafion115 (red line) (in web version) after annealing. Combining with theevaluation of ASR and VSR, it is obvious that the pristine blend
Fig. 5. Water uptake of BC/Nafion membranes before and after annealing. Blue dottedline: casted BC, Red solid line: Nafion 115. (For interpretation of the references tocolour in this figure legend, the reader is referred to the web version of this article.)
membranes mainly swelled in thickness but the heating processeliminated the negative influences. Like the low water uptake, theenhancement of dimensional stability should be a desirable prop-erty for proton exchange membranes as well.
3.6. Proton conductivity, methanol permeability and selectivity
Fig. 7 shows the proton conductivity of both pristine andannealed BC/Nafion membranes as a function of the ratio of BC toNafion. In general, the more Nafion was incorporated with BC, thehigher proton conductivity was obtained no matter whether theblend membranes were annealed or not. For example, the con-ductivities of pristine and annealed B1N1 were 0.015 and0.008 S cm�1, respectively, while those of B1N9 were 0.069 and0.056 S cm�1, respectively. Among all, the B1N9 exhibited thehighest ion conductivity. The increase of conductivity could beascribed to the introduction of charge carriers in Nafion. However,the conductivities lessened markedly after annealing. Consideringthe dramatic decrease of water uptake of annealed membranes(Fig. 5), the low mobility of proton under this circumstance mightcontribute to the phenomenon. In addition, the interactions
Fig. 6. Dimensional stability of BC/Nafion membranes before and after annealingincluding (a) area swelling ratio and (b) volume swelling ratio. Red lines represent theswelling ratios of Nafion 115. (For interpretation of the references to colour in thisfigure legend, the reader is referred to the web version of this article.)

Fig. 7. Proton conductivity of BC/Nafion membranes before and after annealing.
Fig. 9. The selectivity of BC/Nafion membranes before and after annealing.
G.-p. Jiang et al. / Journal of Power Sources 273 (2015) 697e706704
between BC and Nafion during annealing might lead to the sameresult as well.
Methanol permeability of BC/Nafion blend membranes wasinvestigated before and after annealing and the results are dis-played in Fig. 8. Similarly, the methanol permeability of pristineblendmembranes increased with the raised proportion of Nafion inthe membranes. However, high methanol permeability is not adesirable property for proton exchange membranes, but a hin-drance to the application in DMFC. As shown in Fig. 8, except B1N1containing the most amount of BC, every pristine blend membranedisplayed higher methanol permeability than Nafion 115 (red line)(in web version), which might be due to more Nafion proportion inthe membranes. Fortunately, after annealed all blend membranesallowed much less methanol permeation, which should be attrib-uted to the structural changes of membranes as observed by SEM(Fig. 4). Specifically, the methanol permeability of both annealedB1N1 and B1N7 reduced to 7.43 � 10�7 and 1.33 � 10�6 cm2 s�1
respectively, which is lower than the red line marked as that ofNafion 115 and indicates their potentials in DMFCs.
In order to comprehensively confirm the blend membranespotentials in DMFCs, the selectivity of membranes were evaluated
Fig. 8. Methanol permeability of BC/Nafion membranes before and after annealing.Red solid line: Nafion 115. (For interpretation of the references to colour in this figurelegend, the reader is referred to the web version of this article.)
and shown in Fig. 9. Since annealed membranes slightly decreasedion conductivity, (Fig. 7) but strongly declined methanol perme-ability (Fig. 8), their selectivity on proton was much more than thaton methanol, compared to the pristine ones. As to pristine andannealed B1N1, both methanol permeability and proton conduc-tivity were too low, which consequently diminished the selectivityto a great extent. Therefore, according to the logic in the literature[49,50], the most satisfactory candidate left for DMFCs was theannealed B1N7 with a selectivity of 4.26 � 104 S cm�3 s.
3.7. Single-cell performances
As chosen from the selectivity evaluation, both pristine andannealed B1N7 membranes were used to fabricate the membraneelectrode assembly (MEA). In order to maximize the performanceof DMFC, the MEAs were activated first in authentic H2/O2 single-cells prior to operation with 1 mol L�1 methanol aqueous solu-tion as a fuel. The polarization curves and power density profiles ofboth PEMFC and DMFC were obtained and are displayed in Figs. 10and 11, respectively. Fig. 10 shows that the open-circuit voltages(OCV) of both the pristine and annealed B1N7 reached around0.91 V, which suggests a high activity of catalyst has been loaded on
Fig. 10. PEMFC performances of pristine and annealed BC/Nafion (1:7) membranes aswell as Nafion 115 at room temperature.

Fig. 11. DMFC performances of pristine and annealed BC/Nafion (1:7) membranesobtained at room temperature (a), 60 �C (b) and 80 �C (c).
G.-p. Jiang et al. / Journal of Power Sources 273 (2015) 697e706 705
carbon papers. However, the polarization curves showed differ-ences with the elevation of current density. The MEA fabricatedwith an annealed B1N7 membrane demonstrated lower activationand ohmic overpotentials, resulted in maximum power density of106 mW cm�2 and endurable current density of 382.4 mA cm�2
under an ambient temperature. Hence, it implies that the annealingprocess facilitated the performance of B1N7 in PEMFC. Slightlyworse performance of Nafion 115 obtained at the same MEA
fabrication and testing condition (black lines in Fig. 10, only giving apower density of 100.8 mW cm�2 and a maximum endurable cur-rent density of 328.7 mA cm�2) makes the performance of B1N7more trustworthy and reasonable.
After being fed with methanol as fuel, the MEAs equipped witheither pristine or annealed B1N7 demonstrated their characteristicpolarization curves and power density profiles obtained at roomtemperature, 60 �C and 80 �C, respectively (Fig. 11). Although theOCV of the annealed B1N7 was low at room temperature, it stillreached about 0.6 V, which was higher than that of the pristineB1N7 (Fig. 11a). This result implies that less methanol crossoveroccurred through the membrane after annealing and is one of thebenefits brought from the annealing process. Other merits ascompared to the pristine B1N7, such as higher power density(3.2 mW cm�2) and current density (23.8 mA cm�2), wereobserved after annealing and are demonstrated in Fig. 11a. As theoperating temperature rose to 60 �C, the performances of bothpristine and annealed B1N7 were facilitated (Fig. 11b). All theparameters including the OCV, maximum power density andmaximum current density of pristine and annealed B1N7 aroseremarkably to 0.68 V, 12.3 mW cm�2, and 58.2 mA cm�2, as well asto 0.65 V, 12.2 mW cm�2, and 57 mA cm�2, respectively. Thoseaforementioned parameters as well as the overlapping of samples'polarization curves and power density profiles in Fig. 11b denotethe slight differences from samples. When testing at 80 �C, OCV ofthe annealed B1N7 rose to 0.70 V while that of the pristine B1N7dropped to 0.62 V (Fig. 11c). The elevation of operating tempera-ture not only improved the activity of catalysts, resulting in theincrease of OCV, but also drove more methanol moleculespermeating through the membranes and oxidizing on the surfaceof Pt catalyst on cathode, leading to the decrease of OCV. There-fore, there was a balance between these two effects. Consideringthe methanol permeability of the pristine B1N7 shown in Fig. 8, itis reasonable to assume that high methanol crossover at 80 �Clowered the OCV of the pristine B1N7 but the enhancement ofcatalytic activity at high temperature dominated the main effecton OCV of annealed B1N7. Meanwhile, the peak power densities ofpristine and annealed B1N7 were achieved at 21.1 and20.4 mW cm�2 respectively (Fig. 11c). The similar performanceand overlapping curves in Fig. 11b and c imply that the annealingprocess could not enhance the performance of B1N7 at highertemperature circumstance.
4. Conclusion
A series of novel proton exchange membranes have been pre-pared by blending bacterial cellulose pulp with Nafion solution forapplications in both PEMFC and DMFC but also increased wateruptake, Young's modulus, thermal and area swelling stabilities dueto the characteristics of bacterial cellulose. Moreover, they devel-oped some new features including the reinforced concrete struc-ture and interactions of Nafion with cellulose. Annealing processmade a positive effect on the properties of BC/Nafion membranes,including the dramatic decrease of water uptake, volume swellingratio and methanol permeability as well as the increase of densestructure, Young's modulus and selectivity. The annealing couldenhance the performance of the membranes in both PEMFC andDMFC under room temperature obviously. For annealed B1N7, themaximum power densities obtained in PEMFC and DMFC were106 mW cm�2 and 20.4 mW cm�2, respectively, which are muchhigher than those of BC-based membranes reported in the litera-ture [28]. Overall, these preliminary results demonstrate that BC/Nafion blend membranes are promising candidates for both PEMFCand DMFC, and the annealing is a critical process during thefabrication.

G.-p. Jiang et al. / Journal of Power Sources 273 (2015) 697e706706
Acknowledgments
This investigation was funded by Program for New CenturyExcellent Talents in University (NCET-12-0828), by the NationalNatural Science Foundation of China (51373031), the Science andTechnology Commission of Shanghai Municipality (11230700600and 12nm0500600), Opening Foundation of Zhejiang ProvincialTop Key Discipline (20110927), the State Key Laboratory for Modi-fication of Chemical Fibers and Polymer Materials (Donghua Uni-versity) (13M1060106), the Fundamental Research Funds for theCentral Universities (14D110502), and the China ScholarshipCouncil. All the financial supports are gratefully acknowledged.
References
[1] J.H. Wee, J. Power Sources 173 (2007) 424e436.[2] V. Neburchilov, J. Martin, H.J. Wang, J.J. Zhang, J. Power Sources 169 (2007)
221e238.[3] M. Ahmed, I. Dincer, Int. J. Energy Res. 35 (2011) 1213e1228.[4] J.H. Chen, D.R. Li, H. Koshikawa, M. Asano, Y. Maekawa, J. Memb. Sci. 362
(2010) 488e494.[5] J. Qiao, S. Ikesaka, M. Saito, J. Kuwano, T. Okada, Electrochem. Commun. 9
(2007) 1945e1950.[6] J.H. Kim, S.K. Kim, K. Nam, D.W. Kim, J. Memb. Sci. 415 (2012) 696e701.[7] Y. Heo, S. Yun, H. Im, J. Kim, J. Appl. Polym. Sci. 126 (2012) E467eE477.[8] C.Y. Tseng, Y.S. Ye, M.Y. Cheng, K.Y. Kao, W.C. Shen, J. Rick, J.C. Chen,
B.J. Hwang, Adv. Energy Mater. 1 (2011) 1220e1224.[9] Q. Zhao, Q.F. An, Y. Ji, J. Qian, C. Gao, J. Memb. Sci. 379 (2011) 19e45.
[10] C. Ling, D. Banerjee, W. Song, M.J. Zhang, M. Matsui, J. Mater. Chem. 22 (2012)13517e13523.
[11] S. Mohanapriya, S. Bhat, A. Sahu, S. Pitchumani, P. Sridhar, A. Shukla, EnergyEnviron. Sci. 2 (2009) 1210e1216.
[12] N.W. DeLuca, Y.A. Elabd, J. Power Sources 163 (2006) 386e391.[13] H.L. Lin, S.H. Wang, C.K. Chiu, T.L. Yu, L.C. Chen, C.C. Huang, T.H. Cheng,
J.M. Lin, J. Memb. Sci. 365 (2010) 114e122.[14] H.L. Lin, T.L. Yu, L.N. Huang, L.C. Chen, K.S. Shen, G.B. Jung, J. Power Sources
150 (2005) 11e19.[15] H. Wu, Y.X. Wang, S.C. Wang, Acta Polym. Sin. (2002) 540e543.[16] J.L. Qiao, T. Hamaya, T. Okada, Polymer 46 (2005) 10809e10816.[17] J. Qiao, T. Hamaya, T. Okada, J. Mater. Chem. 15 (2005) 4414e4423.[18] J. Hu, J. Luo, P. Wagner, C. Agert, O. Conrad, Fuel Cells 11 (2011) 756e763.[19] T. Yang, C.T. Liu, Int. J. Hydrogen Energy 36 (2011) 5666e5674.[20] E. Trovatti, L.S. Serafim, C.S.R. Freire, A.J.D. Silvestre, C.P. Neto, Carbohydr.
Polym. 86 (2011) 1417e1420.
[21] M. Nogi, H. Yano, Adv. Mater. 20 (2008) 1849e1852.[22] P. Gatenholm, D. Klemm, MRS Bull. 35 (2010) 208e213.[23] D. Klemm, F. Kramer, S. Moritz, T. Lindstrom, M. Ankerfors, D. Gray, A. Dorris,
Angew. Chem.-Int. Ed. 50 (2011) 5438e5466.[24] V. Dubey, C. Saxena, L. Singh, K. Ramana, R. Chauhan, Sep. Purif. Technol. 27
(2002) 163e171.[25] K. Ramana, K. Ganesan, L. Singh, World J. Microbiol. Biotechnol. 22 (2006)
547e552.[26] Y. Kasai, A. Akahira, A. Abudula, K. Urayama, T. Takigawa, Kobunshi Ron-
bunshu 66 (2009) 130e135.[27] A. Lam, D.P. Wilkinson, J.J. Zhang, Electrochem. Commun. 11 (2009)
1530e1534.[28] C.W. Lin, S.S. Liang, S.W. Chen, J.T. Lai, J. Power Sources 232 (2013) 297e305.[29] N.W. DeLuca, Y.A. Elabd, J. Memb. Sci. 282 (2006) 217e224.[30] W. Helbert, H. Chanzy, T.L. Husum, M. Schülein, S. Ernst, Biomacromolecules 4
(2003) 481e487.[31] G. Jiang, J. Qiao, F. Hong, Int. J. Hydrogen Energy 37 (2012) 9182e9192.[32] J.L. Qiao, J. Fu, L.L. Liu, Y.Y. Liu, J.W. Sheng, Int. J. Hydrogen Energy 37 (2012)
4580e4589.[33] L. Chaabane, G. Bulvestre, C. Larchet, V. Nikonenko, C. Deslouis, H. Takenouti,
J. Memb. Sci. 323 (2008) 167e175.[34] J.L. Qiao, T. Okada, H. Ono, Solid State Ionics 180 (2009) 1318e1323.[35] Y.F. Huang, L.C. Chuang, A.M. Kannan, C.W. Lin, J. Power Sources 186 (2009)
22e28.[36] C.W. Lin, R. Thangamuthu, C.J. Yang, J. Memb. Sci. 253 (2005) 23e31.[37] B. Li, J.L. Qiao, D.J. Yang, R. Lin, H. Lv, H.J. Wang, J.X. Ma, Int. J. Hydrogen Energy
35 (2010) 5528e5538.[38] S.Y. Oh, D.I. Yoo, Y. Shin, H.C. Kim, H.Y. Kim, Y.S. Chung, W.H. Park, J.H. Youk,
Carbohydr. Res. 340 (2005) 2376e2391.[39] S. Gea, C.T. Reynolds, N. Roohpour, B. Wirjosentono, N. Soykeabkaew,
E. Bilotti, T. Peijs, Bioresour. Technol. 102 (2011) 9105e9110.[40] L. Chen, F. Hong, X. Yang, S. Han, Bioresour. Technol. 135 (2013) 464e468.[41] S.A. Perusich, J. Appl. Polym. Sci. 120 (2011) 165e183.[42] A.C. Fernandes, E.A. Ticianelli, J. Power Sources 193 (2009) 547e554.[43] K. Hongsirikarn, X.H. Mo, J.G. Goodwin, S. Creager, J. Power Sources 196
(2011) 3060e3072.[44] M. Roman, W.T. Winter, Biomacromolecules 5 (2004) 1671e1677.[45] F. Hong, J. Biotechnol. 136 (Supplement) (2008) S433.[46] S.D. Clas, K. Lalonde, K. Khougaz, C.R. Dalton, R. Bilbeisi, J. Pharm. Sci. 101
(2012) 558e565.[47] J.S. Chiou, D.R. Paul, Industrial Eng. Chem. Res. 27 (1988) 2161e2164.[48] Y.B. Wu, S.H. Yu, F.L. Mi, C.W. Wu, S.S. Shyu, C.K. Peng, A.C. Chao, Carbohydr.
Polym. 57 (2004) 435e440.[49] M.M. Hasani-Sadrabadi, E. Dashtimoghadam, F.S. Majedi, K. Kabiri,
N. Mokarram, M. Solati-Hashjin, H. Moaddel, Chem. Commun. 46 (2010)6500e6502.
[50] H.C. Chien, L.D. Tsai, C.P. Huang, C.Y. Kang, J.N. Lin, F.C. Chang, Int. J. HydrogenEnergy 38 (2013) 13792e13801.