journal of marine sy stems - woods hole oceanographic ... · e-mail address: [email protected] (s....
TRANSCRIPT

Tidal pumping and nutrient !uxes on Georges Bank: A process-orientedmodeling study
Song Hu a,!, David W. Townsend b, Changsheng Chen a, Geoffrey Cowles a, Robert C. Beardsley c,Rubao Ji d, Robert W. Houghton e
a University of Massachusetts Dartmouth, Department of Fisheries Oceanography, School for Marine Science and Technology, 706 South Rodney French Boulevard,New Bedford, MA 02744, United Statesb University of Maine, School of Marine Sciences, 5706 Aubert Hall, Orono, ME 04469, United Statesc Department of Physical Oceanography, Woods Hole Oceanographic Institution, Woods Hole, MA 02548, United Statesd Department of Biology, Woods Hole Oceanographic Institution, Woods Hole, MA 02548, United Statese Columbia University, Lamont Doherty Earth Observatory, Palisades, NY 10964, United States
a r t i c l e i n f o a b s t r a c t
Article history:Received 8 October 2007Received in revised form 3 April 2008Accepted 10 April 2008Available online 27 April 2008
Process-oriented studies with the unstructured-grid, three-dimensional Finite-Volume CoastalOcean Model (FVCOM) of Georges Bank were used to examine the importance of physicalprocesses on the cross-isobath transport of nutrients onto the Bank. Starting from idealizedvertical pro"les of NO3 constructed from summertime climatologic "elds, the nutrient "eld wasintegrated in time using a conservative tracer equation with both homogenous and strati"edinitial hydrography and both tide and wind forcing. The model results reveal that: a) nutrient!uxes are spatially inhomogeneous, with the greatest nutrient !ux generated by tidal pumpinginto surface waters along the edge of the Bank's northern !ank; b) a surface nutrient maximumoccurs on the northeast !ank as a result of advection along the northern edge and bifurcation ofthe !ow as waters circulate clockwise and spread laterally around the eastern portion of theBank; c) advection enriches nutrient concentrations downstream and around the Bank,generating a donut-shaped pattern of elevated nutrients; and d) waters on the top of the Bank,especially in the southwest portions, experience the lowest nutrient !ux rates. The length oftime required to reach a quasi-equilibrium state of nutrient distribution over the Bank iscontrolled primarily by tidal advection, with cross-frontal !uxes modulated by strati"cation,surface wind stress, and the initial nutrient concentration in the Gulf of Maine source waters.
Published by Elsevier B.V.
Keywords:Tidal pumpingGeorges BankGulf of MaineNutrient !uxFVCOM
1. Introduction
Georges Bank (GB) is a shallow submarine feature locatedat the opening of the Gulf of Maine, a semi-enclosed con-tinental shelf sea in the northwest Atlantic Ocean (Fig. 1). TheBank is well known for its high biological productivity, whichfor centuries has supported important commercial "sheries(Backus, 1987); rates of primary production reported for theBank are thought to be among the highest of any continentalshelf sea, exceeding 400 gC m!2 y!1 in the central, shallowestportions of the Bank (O'Reilly et al., 1987).
An important driver of the biological productivity of theBank is its physical oceanographic processes, which areclosely tied to its geomorphology. The Bank is a relativelylarge feature, measuring about 150 km by 200 km, with anarea of about 34,000 km2 shallower than 100 m. Tidalcurrents, which are most pronounced over the top of theBank with the dominant constituent being the semi-diurnalM2 with the maximum currents of ~100 cm/s (Brown andMoody, 1987), are the dominant physical process. Mixinggenerated by such strong currents produces a vertically well-mixed water column in the crest area bounded by the 40–50 m isobath throughout the year. The general pattern ofresidual currents in the GB region has been known sinceBigelow (1927), who "rst described it as a general clockwise
Journal of Marine Systems 74 (2008) 528–544
! Corresponding author.E-mail address: [email protected] (S. Hu).
0924-7963/$ – see front matter. Published by Elsevier B.V.doi:10.1016/j.jmarsys.2008.04.007
Contents lists available at ScienceDirect
Journal of Marine Systems
j ourna l homepage: www.e lsev ie r.com/ locate / jmarsys

(anticyclonic) !owaround the Bank. Later investigators addedgreater detail to Bigelow's description (Loder, 1980; Butmanet al., 1982; Butman and Beardsley, 1987; Naimie et al., 1994;Chen et al., 1995; Limeburner and Beardsley, 1996; Naimie1996; Chen et al., 2001, 2003a), especially the tidally recti"edcurrent “jet” along the steep northern !ank.
Generally speaking, the Bank's high biological productivityresults because: (1) the Bank is suf"ciently shallow that light-limitation of phytoplankton is unimportant throughout most,or all, of theyear; (2) theBank is surroundedbydeepwaters richin dissolved inorganic nutrients, which are available for mixingwith Bank waters; and (3) vigorous tidal mixing on the Bank'sshoals promotes the injection of those deep water nutrientsonto theBankwhere their subsequentdispersion andadvectiondrive the Bank's biological oceanography (Townsend et al.,2006). It is this !ux of nutrients across the Bank's edges thatdetermines the level of biological production (Riley, 1941;Cohen et al., 1982; Horne et al., 1989; Franks and Chen, 1996;Townsend and Pettigrew, 1997; Franks and Chen, 2001; Town-send et al., 2006; and others). Nutrient !uxes occur around the
periphery of the Bank, but theyare greatest on thenorthernhalf(Pastuszak et al., 1982; Townsend and Pettigrew, 1997) wherethe bathymetry is steepest andwhere nutrient-rich slopewaterresides nearby, having entered Georges Basin from offshore viathe Northeast Channel.
The production cycle is highly seasonal in nature andexhibits a pronounced late winter–early spring phytoplank-ton bloom (Riley, 1941; Walsh et al., 1987; Cura, 1987; Town-send and Pettigrew, 1997; Townsend and Thomas, 2001,2002). Pre-bloom conditions are established during the falland winter, when nutrients accumulate and phytoplanktonproduction slows as a result of light-limitation, cooling watertemperature, and the breakdown of tidal mixing fronts on the!anks of the Bank. While the exact timing and dynamics arenot well known, it appears that seasonal nutrient recharge tothe top of the Bank is accomplished more so during the fallmonths than during thewinter (Pastuszak et al., 1982), settingthe stage for the winter–spring phytoplankton bloom whichbegins in December and January (Townsend and Thomas,2001, 2002).
Fig. 1. Bathymetry (in meters) of the Gulf of Maine/Georges Bank region. Heavy arrows indicate the general pathways of water !owing around Georges Bank.
529S. Hu et al. / Journal of Marine Systems 74 (2008) 528–544

Townsend et al. (2006) proposed the following hypothesisfor the GB planktonic ecosystem based on earlier observa-tions. Following the winter–spring phytoplankton bloom, agreater cross-frontal nutrient !ux on the northern edge of theBank leads to higher phytoplankton biomass accumulationson the northern !ank and the northeast !ank. Those cells andnutrients are further advected clockwise around the Bank tothe southern !ank, fueling secondary production and leadingto higher standing stocks of zooplankton in that region. Theresult is a “donut-like” band of elevated phytoplankton pro-duction, being greatest on the northeast !ank, and corre-sponding to the magnitude of new nutrient !uxes (Townsendand Pettigrew, 1997; Townsend et al., 2006). Because that“donut” of primary production is driven by newly injecteddeep water nutrients, it is “new” production (Dugdale andGoering, 1967; Eppley and Peterson, 1979). This hypothesis issupported by measurements of high f-ratios ("0.7) in thetidal mixing front along the northern !ank, and much lowerratios (0.1–0.2) in the mixed regions inside the fronts (Loderand Platt 1985). The f-ratio de"ned here is the ratio of newprimary production (fueled by the nitrate !uxes) to the totalprimary production (Eppley and Peterson, 1979).
The signi"cance here is that it is the donut band of “new”primary production, resulting from new nutrient injections,that is available for transfer to higher trophic level biomasssuch as zooplankton and "sh (Townsend and Pettigrew,1997),and thus it is important to understand in greater detail thenature of nutrient !uxes to the Bank. Conversely, primaryproduction on the top of the Bank, inside the 60-m isobath, ismuch more dependent (80–90%) on recycled nitrogenousnutrients. These details, however, have not beenwell studied.In particular, important aspects of cross-isobath (or cross-frontal) nutrient !uxes onto the Bank, such as the magnitudeof these !uxes, their spatial patterns throughout the Bankregion, and the major physical mechanism(s) driving these!uxes, are poorly understood.
Dye tracer experiments reported by Houghton and Ho(2001) provided a quantitative measurement of an on-Bankdiapycnal Lagrangian !ow, revealing 68% greater cross-isobath !ow on the northern !ank ("3.2 cm/s) than themore gently-sloping southern !ank ("1.9 cm/s). Based onbuoyancy measurements and de"ning “tidal pumping” as aLagrangian upwelling resulted from the interaction of tidalcurrents over steep bottom topography (Chen and Beardsley,1998; Ullman et al., 2003), Ullman et al. (2003) found that themagnitude of the tidal pumping !ux on GB was of the sameorder as the divergent component of the skew !ux de"ned byLoder and Horne (1991) with consideration of the contribu-tion of tidal current variation to the tracer !ux through atransect at a "xed location on the northern !ank of the Bank.Using model simulations, Chen and Beardsley (1998) andPringle and Franks (2001) showed a net cross-Bank !ux thatcan result from asymmetric tidal mixing. Later, Chen andBeardsley (2002) attributed the cross-Bank !uxes to fourprinciple physical mechanisms: 1) strong non-linear interac-tions; 2) asymmetric tidal mixing; 3) varying wind forcing;and 4) chaotic mixing associated with cross-frontal waterexchange. All these previous studies were focused on physicalmechanisms. Several three-dimensional coupled physical andbiological model experiments have been conducted toexamine the phytoplankton bloom on the Bank (Franks and
Chen,1996, 2001; Lewis et al., 2001; Ji et al., 2006a,b; Tian andChen, 2006), but few efforts have been made to quantify therelative importance of physical versus biological processes inthe establishment of the three-dimensional spatial patterns ofnutrient !uxes on the Bank.
The purpose of our study reported here was to learn moreabout the nature of nutrient !uxes across sloping topographyand tidal mixing fronts, and the signi"cance of spatialinhomogeneity in those !uxes. Process-oriented modelexperiments were made to identify 1) the primary sourceand spatial variability of tidal pumping- and wind-inducednutrient !uxes onto the Bank, and 2) the relative in!uence oftides and winds on on-Bank nutrient pumping under well-mixed and strati"ed conditions and on nutrient rechargeduring the seasonal transition from summer to winter.
2. Numerical model and experiment design
The numerical experiments were made using the prog-nostic free-surface, three-dimensional primitive equationunstructured-grid, Finite-Volume Coastal Ocean Model(FVCOM) (Chen et al., 2003b, 2006, 2007). The modelincorporates the Mellor and Yamada Level 2.5 turbulentclosure scheme (Mellor and Yamada, 1982; Galperin et al.,1988). An unstructured triangular grid was used in thehorizontal and a sigma-coordinate in the vertical. A detaileddescription of FVCOM is given in Chen et al. (2006).
The nutrient concentration is treated as a tracer quantitygoverned by the following conservation equation:
ANAt
! uANAx
! vANAy
!wANAz
" ANAx
AhANAx
! "! AN
AyAh
ANAy
! "
! ANAz
AzANAz
! "#1$
where N is the concentration of the nutrient; u, v, and w theCartesian (x,y,z) components of the !uid velocity; Az is thevertical eddy diffusivity calculated using theMY-2.5 turbulentclosure scheme; Ah is the horizontal eddy diffusivity com-puted using the Smagorinsky eddy parameterization method(Smagorinsky, 1963) de"ned as
Ah " 0:5CXu
Pr
ffiffiffiffiffiffiffiffiffiffiffiffiffiffiffiffiffiffiffiffiffiffiffiffiffiffiffiffiffiffiffiffiffiffiffiffiffiffiffiffiffiffiffiffiffiffiffiffiffiffiffiffiffiffiffiffiffiffiffiffiffiffiffiffiffiffiffiffiffiffiAuAx
! "2
!0:5AvAx
! AuAy
! "2
! AvAy
! "2s
#2$
where C is a constant parameter and !u is the area of theindividual momentum control element. Pr is the Prandtlnumber. In this study, C=0.4 and Pr=1, which gives reason-able values of Ah ranging from 30 to 500 m2/s on GeorgesBank.
For this work, deep water nitrate measurements wereused to supply the initial conditions in several of thenumerical experiments, and the on-Bank !ux estimates ofnitrate made in several observational programs were used forcomparison with model !uxes. Thus, while the evolution ofthe tracer equation is driven by dynamics not speci"c to anynutrient, we will consider the nutrient "eld here to representnitrate. We excluded biological processes in themodel runs inorder to isolate the importance of physical processes on theon-Bank nutrient !uxes.
The computational domain encompassed the Gulf ofMaine (GoM)/GB region, with the Scotian Shelf to the
530 S. Hu et al. / Journal of Marine Systems 74 (2008) 528–544
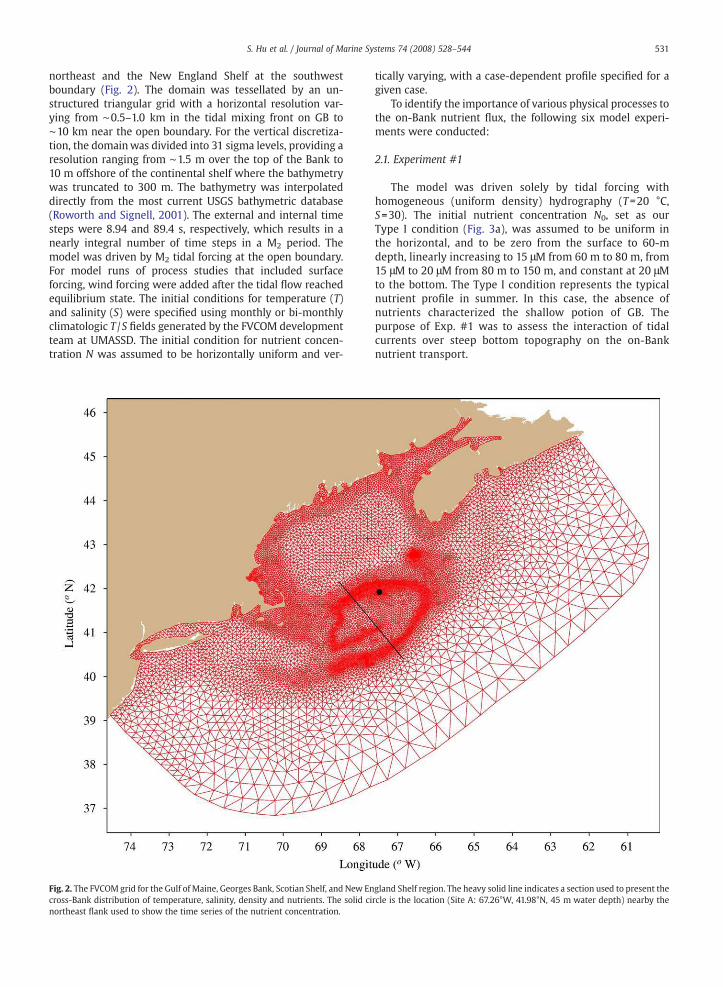
northeast and the New England Shelf at the southwestboundary (Fig. 2). The domain was tessellated by an un-structured triangular grid with a horizontal resolution var-ying from "0.5–1.0 km in the tidal mixing front on GB to"10 km near the open boundary. For the vertical discretiza-tion, the domainwas divided into 31 sigma levels, providing aresolution ranging from "1.5 m over the top of the Bank to10 m offshore of the continental shelf where the bathymetrywas truncated to 300 m. The bathymetry was interpolateddirectly from the most current USGS bathymetric database(Roworth and Signell, 2001). The external and internal timesteps were 8.94 and 89.4 s, respectively, which results in anearly integral number of time steps in a M2 period. Themodel was driven by M2 tidal forcing at the open boundary.For model runs of process studies that included surfaceforcing, wind forcing were added after the tidal !ow reachedequilibrium state. The initial conditions for temperature (T)and salinity (S) were speci"ed using monthly or bi-monthlyclimatologic T /S "elds generated by the FVCOM developmentteam at UMASSD. The initial condition for nutrient concen-tration N was assumed to be horizontally uniform and ver-
tically varying, with a case-dependent pro"le speci"ed for agiven case.
To identify the importance of various physical processes tothe on-Bank nutrient !ux, the following six model experi-ments were conducted:
2.1. Experiment #1
The model was driven solely by tidal forcing withhomogeneous (uniform density) hydrography (T=20 °C,S=30). The initial nutrient concentration N0, set as ourType I condition (Fig. 3a), was assumed to be uniform inthe horizontal, and to be zero from the surface to 60-mdepth, linearly increasing to 15 !M from 60 m to 80 m, from15 !M to 20 !M from 80 m to 150 m, and constant at 20 !Mto the bottom. The Type I condition represents the typicalnutrient pro"le in summer. In this case, the absence ofnutrients characterized the shallow potion of GB. Thepurpose of Exp. #1 was to assess the interaction of tidalcurrents over steep bottom topography on the on-Banknutrient transport.
Fig. 2. The FVCOMgrid for the Gulf of Maine, Georges Bank, Scotian Shelf, and New England Shelf region. The heavy solid line indicates a section used to present thecross-Bank distribution of temperature, salinity, density and nutrients. The solid circle is the location (Site A: 67.26°W, 41.98°N, 45 m water depth) nearby thenortheast !ank used to show the time series of the nutrient concentration.
531S. Hu et al. / Journal of Marine Systems 74 (2008) 528–544

2.2. Experiment #2
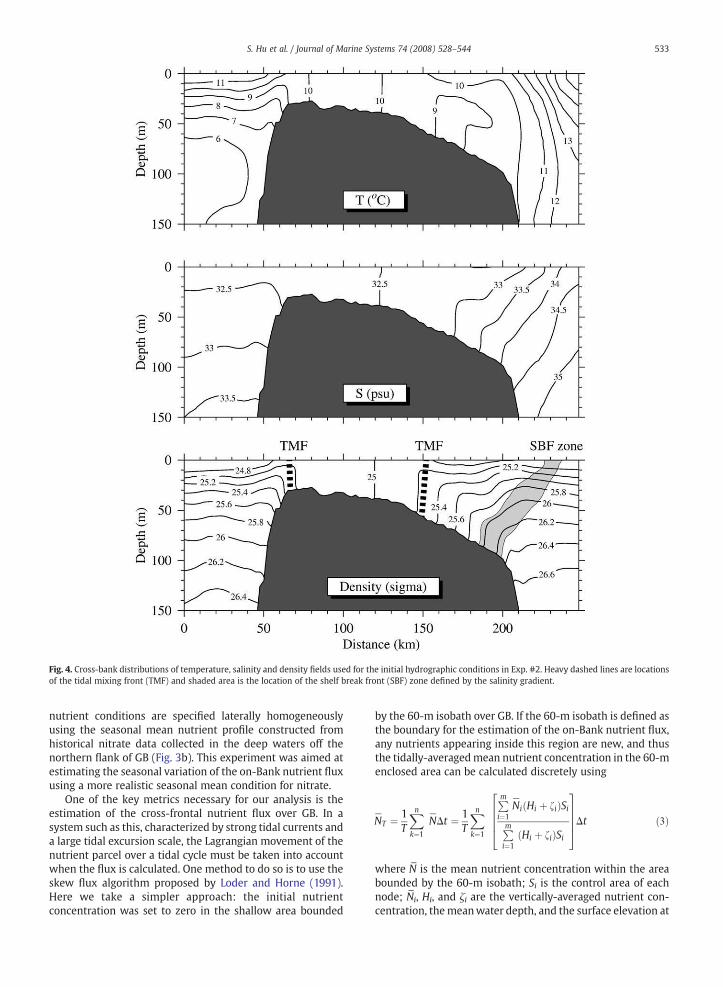
For this experiment, the model was driven solely by tidalforcing using a strati"ed initial hydrography representative ofearly summer. The initial T and S "elds were speci"ed usingthemonthly averaged climatologic hydrographic data for June(Fig. 4). The initial nutrient condition used in this experimentwas the same as that in Exp. #1 (Type I, Fig. 3a). The purposeof Exp. #2 was to assess the roles of advection and vertical/lateral mixing within the tidal mixing front and upwelling atthe shelf break front in the on-Bank nutrient !ux as the frontsintensi"ed in summer.
2.3. Experiment #3
In this experiment, the model was driven by tidal forcingunder strati"ed hydrographic conditions with a seasonalvariation. Model runs were made starting with the initial T /Sconditions speci"ed using July–August, September–October,and November–December bi-monthly averaged hydrographicdata (Fig. 5), respectively. To examine the impact of thisseasonal variation in the initial strati"cation on the on-Banknutrient !ux, we used the same Type I vertical pro"le of initialnutrient concentration N0 for all three cases. This experimentwas designed to examine the in!uence of strati"cation onnutrient recharge to the Bank during the seasonal transitionfrom summer to autumn.
2.4. Experiment #4
Themodel was driven by both tidal andwind forcing usingthe same strati"ed initial and seasonally-varying hydrogra-phy as Exp. #3. Thewind forcing was the bi-monthly averaged
wind stress over GB, which was estimated from a 27-yearmeteorological model hindcast (Table 1). That hindcast wasconducted using the GoM meso-scale meteorological model(MM5) (Chen et al., 2005) for 1978–2004, with assimilation ofall available buoymeasurements. To estimate variations in thenutrient !ux due to the temporal !uctuations of wind stress,we also drove the model with inclusion of the wind stressvariation determined by the standard deviation calculatingfrom hourly wind stress during each bi-monthly period(Table 2). This experiment was aimed at qualifying andquantifying the relative importance of the wind stress and itsvariability to tidal pumping on the nutrient recharge duringthe seasonal transition from summer to autumn.
2.5. Experiment #5
The model was driven solely by tidal forcing with variousinitial nutrient concentration pro"les but with the same earlysummer strati"ed initial hydrography used in Exp. #2. Thehistorical nutrient data available for the GoM region exhibitsigni"cant temporal and spatial variations in vertical con-centration pro"les which can directly alter the net nutrient!ux onto GB in our model runs. By using higher (Type II) andlower (Type III) initial nutrient concentrations relative to ourbaseline (Type I), we were able to examine the sensitivity ofthe net on-Bank nutrient !ux to the variability in the initialnutrient distribution (Fig. 3a).
2.6. Experiment #6
The model was driven by both tidal forcing and seasonalmean wind stress with strati"ed initial hydrography as donein Exp. #4. The difference is that in this experiment the initial
Fig. 3. Panel a: Vertical pro"les of initial nutrient concentration. Type I: the pro"le used for the standard experiment cases (Exp. #1–Exp. #3). Type II and Type III:pro"les used in Exp. #5 for higher and lower initial nutrient cases, respectively. Panel b: Vertical pro"les of the bi-monthly climatologic-mean nitrate concentrationoff the northern !ank of Georges Bank. These pro"les were used for the initial conditions of the nutrient concentration in Exp. #6. Note: for simpli"cation, thenitrate is set to be constant in the deep region below 200-m depth.
532 S. Hu et al. / Journal of Marine Systems 74 (2008) 528–544
nutrient conditions are speci"ed laterally homogeneouslyusing the seasonal mean nutrient pro"le constructed fromhistorical nitrate data collected in the deep waters off thenorthern !ank of GB (Fig. 3b). This experiment was aimed atestimating the seasonal variation of the on-Bank nutrient !uxusing a more realistic seasonal mean condition for nitrate.
One of the key metrics necessary for our analysis is theestimation of the cross-frontal nutrient !ux over GB. In asystem such as this, characterized by strong tidal currents anda large tidal excursion scale, the Lagrangian movement of thenutrient parcel over a tidal cycle must be taken into accountwhen the !ux is calculated. One method to do so is to use theskew !ux algorithm proposed by Loder and Horne (1991).Here we take a simpler approach: the initial nutrientconcentration was set to zero in the shallow area bounded
by the 60-m isobath over GB. If the 60-m isobath is de"ned asthe boundary for the estimation of the on-Bank nutrient !ux,any nutrients appearing inside this region are new, and thusthe tidally-averagedmean nutrient concentration in the 60-menclosed area can be calculated discretely using
PNT " 1
T
Xn
k"1
PNDt " 1
T
Xn
k"1
Pm
i"1
PNi Hi ! fi# $Si
Pm
i"1Hi ! fi# $Si
2
6664
3
7775Dt #3$
where N_is the mean nutrient concentration within the area
bounded by the 60-m isobath; Si is the control area of eachnode; N
_i, Hi, and "i are the vertically-averaged nutrient con-
centration, themeanwater depth, and the surface elevation at
Fig. 4. Cross-bank distributions of temperature, salinity and density "elds used for the initial hydrographic conditions in Exp. #2. Heavy dashed lines are locationsof the tidal mixing front (TMF) and shaded area is the location of the shelf break front (SBF) zone de"ned by the salinity gradient.
533S. Hu et al. / Journal of Marine Systems 74 (2008) 528–544

each node, respectively; T is the period of the M2 tide; mis the total number of elements in the area bounded by the60-m isobath; and n is the total number of time steps over aM2 tidal cycle.
3. Model results
3.1. Experiment #1
Driven solely by the M2 tidal forcing at open boundaries,the tidal and residual currents and the surface elevationreached an equilibrium state after ten tidal cycles. Thenutrient tracer equation was activated at the 20th tidal cyclefrom an initial nutrient condition based on the Type I pro"leand then integrated for an additional 80 tidal cycles. In this
case with zero strati"cation, the residual currents over GB arecharacterized by a clockwise circulation gyre, with a strongcurrent jet of "19 cm/s along the northern and northeastern!anks and a weak return !ow of "3–8 cm/s on the crest andsouthern !ank (Fig. 6a). The residual current jet bifurcates at
Table 1Bi-monthly wind ellipses for Georges Bank
Jul–Aug Sep–Oct Nov–Dec
Fig. 5. Cross-bank distributions of the bi-monthly density "eld used for the initial conditions in Exp. #3, #4 and #6. Upper: July–August. Middle: September–October. Bottom: November–December.
534 S. Hu et al. / Journal of Marine Systems 74 (2008) 528–544
the northeastern !ank where the 40-m, 60-m and 100-misobaths split. As a result, the on-Bank along-isobath !ow(following the 60-m isobath) in that area drops to "10 cm/s.Limeburner and Beardsley (1996) found that there exists atleast three preferred paths over the eastern !ank for near-surface drifters, perhaps due to the bottom sand ridge. Thispattern was also found in other observations of drifters(Naimie et al., 2001; Brink et al., 2003). Our model resultsindicate that the !ow paths over the eastern !ank onto theBank are associated with the location where the isobathsdiverge. This !ow pattern was reported in Chen et al. (2003a)and is consistent with tidal recti"cation theory derived byLoder (1980) and previous results predicted by other nu-merical circulation models (Greenberg, 1983; Lynch andNaimie, 1993; Chen et al., 1995; Chen et al., 2001, Naimieet al., 2001).
The nutrient distribution is controlled by tidally-inducedadvection and mixing. The model showed that the nutrientsin the central crest region of the Bank bounded by the 60-misobath came primarily from the northern !ank, with a majorcontribution from the current bifurcation area on the north-eastern !ank. This can be seen clearly in the tidally-averagednutrient distribution at the 80th tidal cycle with a region ofhigher nutrient concentration intruding towards the crestarea like a tongue originating from the northeastern !ank(Fig. 6b–e). Due to the lack of strati"cation, the nutrient con-centration was quickly mixed to the surface by energetic tidalmixing (Fig. 6b–e). The time sequence plots of the nutrientconcentration on a cross-Bank transect, Transect-A, show anasymmetric pattern on the northern and southern !anks inthe area shallower than 60 m. At the 40th tidal cycle, forexample, a value of 1–2 !Mwas found at the 40-m isobath onthe northern !ank, while it was located near the 70-m isobathon the southern !ank (Fig. 6b,c). At the 80th tidal cycle, thenutrient concentration over most of the northern !ank ex-ceeded 2 !M, while the contours of 1–2 !M were still nearthe 70-m isobath (Fig. 6d). At this time, the mean nutrientconcentration on the top of the Bank bounded by the 60-misobath is "2.0 !M (Fig. 6e).
Two major points are revealed by this model run withoutstrati"cation: First, the interaction of tidal currents withtopography produces a !ux of deep water nutrients from theGoM onto the crest of GB. In this case, the on-Bank nutrient!ux is predominantly controlled by the on-Bank residualcurrents in the topographically-driven bifurcation region onthe northeast !ank. This “tidal pumping” process provides acontinuous supply of nutrients. The role of “tidal pumping” inthe on-Bank nutrient !ux was studied in previous investiga-tions (Franks and Chen, 1996; Chen and Beardsley, 1998;Franks and Chen, 2001; Ullman et al., 2003). The difference
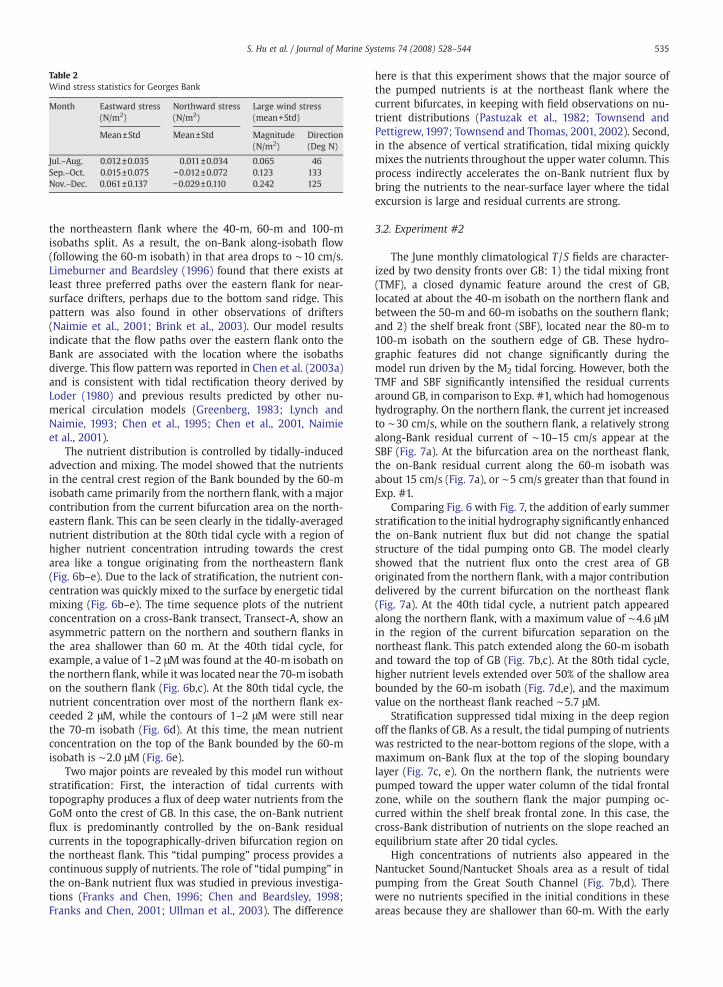
here is that this experiment shows that the major source ofthe pumped nutrients is at the northeast !ank where thecurrent bifurcates, in keeping with "eld observations on nu-trient distributions (Pastuzak et al., 1982; Townsend andPettigrew, 1997; Townsend and Thomas, 2001, 2002). Second,in the absence of vertical strati"cation, tidal mixing quicklymixes the nutrients throughout the upper water column. Thisprocess indirectly accelerates the on-Bank nutrient !ux bybring the nutrients to the near-surface layer where the tidalexcursion is large and residual currents are strong.
3.2. Experiment #2
The June monthly climatological T /S "elds are character-ized by two density fronts over GB: 1) the tidal mixing front(TMF), a closed dynamic feature around the crest of GB,located at about the 40-m isobath on the northern !ank andbetween the 50-m and 60-m isobaths on the southern !ank;and 2) the shelf break front (SBF), located near the 80-m to100-m isobath on the southern edge of GB. These hydro-graphic features did not change signi"cantly during themodel run driven by the M2 tidal forcing. However, both theTMF and SBF signi"cantly intensi"ed the residual currentsaround GB, in comparison to Exp. #1, which had homogenoushydrography. On the northern !ank, the current jet increasedto "30 cm/s, while on the southern !ank, a relatively strongalong-Bank residual current of "10–15 cm/s appear at theSBF (Fig. 7a). At the bifurcation area on the northeast !ank,the on-Bank residual current along the 60-m isobath wasabout 15 cm/s (Fig. 7a), or "5 cm/s greater than that found inExp. #1.
Comparing Fig. 6 with Fig. 7, the addition of early summerstrati"cation to the initial hydrography signi"cantly enhancedthe on-Bank nutrient !ux but did not change the spatialstructure of the tidal pumping onto GB. The model clearlyshowed that the nutrient !ux onto the crest area of GBoriginated from the northern !ank, with a major contributiondelivered by the current bifurcation on the northeast !ank(Fig. 7a). At the 40th tidal cycle, a nutrient patch appearedalong the northern !ank, with a maximum value of "4.6 !Min the region of the current bifurcation separation on thenortheast !ank. This patch extended along the 60-m isobathand toward the top of GB (Fig. 7b,c). At the 80th tidal cycle,higher nutrient levels extended over 50% of the shallow areabounded by the 60-m isobath (Fig. 7d,e), and the maximumvalue on the northeast !ank reached "5.7 !M.
Strati"cation suppressed tidal mixing in the deep regionoff the !anks of GB. As a result, the tidal pumping of nutrientswas restricted to the near-bottom regions of the slope, with amaximum on-Bank !ux at the top of the sloping boundarylayer (Fig. 7c, e). On the northern !ank, the nutrients werepumped toward the upper water column of the tidal frontalzone, while on the southern !ank the major pumping oc-curred within the shelf break frontal zone. In this case, thecross-Bank distribution of nutrients on the slope reached anequilibrium state after 20 tidal cycles.
High concentrations of nutrients also appeared in theNantucket Sound/Nantucket Shoals area as a result of tidalpumping from the Great South Channel (Fig. 7b,d). Therewere no nutrients speci"ed in the initial conditions in theseareas because they are shallower than 60-m. With the early
Table 2Wind stress statistics for Georges Bank
Month Eastward stress(N/m2)
Northward stress(N/m2)
Large wind stress(mean+Std)
Mean±Std Mean±Std Magnitude(N/m2)
Direction(Deg N)
Jul.–Aug. 0.012±0.035 0.011±0.034 0.065 46Sep.–Oct. 0.015±0.075 !0.012±0.072 0.123 133Nov.–Dec. 0.061±0.137 !0.029±0.110 0.242 125
535S. Hu et al. / Journal of Marine Systems 74 (2008) 528–544

Fig. 6. Horizontal distribution of the near-surface residual current vectors (upper) and near-surface (lower left) and cross-Bank (lower right) distributions ofthe tidally-averaged nutrient concentration after 40 (upper) and 80 (lower) tidal cycles over Georges Bank for the homogeneous case (Exp. #1). The 40-, 60-, and100-m isobaths are shown for reference in the upper and left panels, with the 200-m isobath also shown in the left panels.
536 S. Hu et al. / Journal of Marine Systems 74 (2008) 528–544

Fig. 7. Horizontal distribution of the near-surface residual current vectors (upper) and near-surface (lower left) and cross-Bank (lower right) distribution of thetidally-averaged nutrient concentration at the 40th and 80th tidal cycles over Georges Bank for the early summer strati"cation case (Exp. #2). The 40-, 60-, and100-m isobaths are shown in the upper and left panels with the 200-m isobath also shown in the left panels.
537S. Hu et al. / Journal of Marine Systems 74 (2008) 528–544

summer strati"ed hydrography, the interaction of tidalcurrents over topography function like a pump to supplynutrients continuously to these areas. This model result isconsistent with both satellite ocean color imagery of seasurface temperature and coupled biological–physical modelresults, which have shown a high concentration of phyto-plankton in this area (Franks and Chen, 2001). It has beenknown that Nantucket Sound is a !ow-through dynamicsystem that functions as a conveyor to transport waters fromCape Cod and the western GoM to the coastal regions ofsouthern New England. It has been known that Nantucket
Shoals is a region of high phytoplankton biomass. There is asouthwest !ow on Nantucket Shoals that carries GoM waterover the shoals to the south of Nantucket (Limeburner andBeardsley, 1982; Chen et al., 2001). Our experiment indicatesthat GoM water is the source of nutrients supporting thepresumed high productivity.
The tidally-averaged mean nutrient concentration on thecrest of the Bank, inside the 60-m isobath, increased linearlywith time. The area inside the 60-m isobath is about1.4!104 km2, so the supply rate of nutrients in Exp. #2 was"0.03 !mol N/m2/s. Townsend and Pettigrew (1997) esti-
Fig. 8. Four different geographical areas (shown as gray shading) where non-zero initial nutrient concentrations are speci"ed (left panels) and the correspondingtidally-averaged concentrations of the near-surface nutrients at the 80th tidal cycle (right panels). The 60-, 100-, and 200-m isobaths are shown.
538 S. Hu et al. / Journal of Marine Systems 74 (2008) 528–544

mated a nitrate supply rate onto GB based on "eld measure-ments and reported an average rate of 0.034 !mol N/m2/s,which is very close to these model results. Due to the lackof biological processes in our experiments, we cannot statethat tidal pumping supports the entire nutrient supply onGB, but these results do support the idea that tidal pump-ing is one of the major processes bringing nutrients to thecrest of GB.
To identify the point of origin of nutrients in the deep GoMregion that were carried onto GB and Nantucket Sound/Nantucket Shoals, we conducted a series of numerical ex-periments by specifying non-zero initial nutrient concentra-tion in select regions shown in Fig. 8. The Type I pro"le(Fig. 3a) was used to specify the vertical nutrient distributionfor each case. The right panels of Fig. 8 show the distributionsof tidally-averaged near-surface nutrient concentration at the80th tidal cycle. With nutrients initially only in region I(Fig. 8a), the deep nutrients were predominantly carried intotwo near-surface regions: one on the northern !ank and the
other over the Nantucket Sound/Shoals (Fig. 8b). With nu-trients emanating from region II (Fig. 8c), near-surface nu-trients were only detected on the eastern edge of the tidalmixing front on GB (Fig. 8d). With nutrients emanatingfrom region III (Fig. 8e), most of the nutrients starting on andalso pumped onto the eastern !ank were moved southwardand off the Bank (Fig. 8f). Similar results were found in thecase where nutrients were speci"ed as emanating fromregion IV (Fig. 8g), in which nearly the entire nutrient loadwas advected southward, and little was detected on thewestern !ank in the vicinity of the 60-m isobath (Fig. 8h). Inthe region I case, in addition to direct pumping of elevatednutrients to the Nantucket Sound/Nantucket Shoals region, aportion of the nutrients was carried eastward along the localbathymetry to the northern !ank and then pumped acrossmuch of the Bank. In the region II case, nutrients were ad-vected along the northern !ank and then pumped onto GBnear the location of the residual current bifurcation on thenortheast !ank. These experiments clearly show that thedeep GoM region off GB, west of the northeast !ank, is themajor nutrient source supplying GB.
To elucidate the relative contributions of advection anddiffusion to nutrient supply on GB, we re-ran Exp. #2 byturning off both vertical and horizontal diffusion terms in thetracer equation. We compared the time series of the nutrientconcentration for the cases with and without diffusion at siteA on the northeast !ank. The results clearly show that tidalpumping around that area was dominantly driven byadvective processes, with a secondary contribution fromvertical/horizontal diffusion (Fig. 9).
3.3. Experiment #3
Model runs using initial conditions based on the bi-monthly averaged hydrographic "elds for July–August, Sep-tember–October and November–December showed a clearsummer-to-winter transition of the tidal mixing front on GB,during which the mixing region enlarged as the front moved
Fig. 9. Time series of the vertically-averaged nutrient concentration at Site A(shown in Fig. 2) on the northeast !ank for the cases with (solid line) andwithout (dashed line) diffusion.
Fig. 10. Positions of the tidal mixing front (the mixed region is de"ned as an area in which the surface-bottom density (sigma-t) difference is less than 0.5. A: Jul.–Aug.; B: Sep.–Oct.; and C: Nov.–Dec. The 60-, 100-, and 200-m isobaths are shown.
539S. Hu et al. / Journal of Marine Systems 74 (2008) 528–544

toward the shelf break and the strati"cation weakened(Fig. 10). Driven by the same M2 tidal forcing, the modelshowed that the nutrient !ux onto GB varied signi"cantlywith the seasonal transition in water column strati"cation. Inthe July–August (summer) condition, the model displayed thedonut-shaped feature of surface nutrient concentrationaround the tidal mixing front (Fig. 11a, b), as hypothesizedbased on "eld observations (Townsend and Pettigrew, 1997;Townsend et al., 2006) as well as bio-physical modelingresults (Franks and Chen, 2001). Similar distributions wererevealed in the September–October (fall) and November–December (winter) conditions, except that the patch of high
nutrient concentration on the eastern portion of the Bankextends farther to the east towards the 80-m isobath from thefall to thewinter (Fig. 11c–f). The total mean concentrations ofnitrate tracer within the 60-m isobath were 3.86 !M insummer, 4.05 !M in fall and 3.40 !M in winter (Table 3), withmaximum seasonal values of "5.9 !M, "6.6 !M and "7.4 !M,each located on the northeastern portions of the Bank. In theshallow crest area of the Bank, bounded by the 60-m isobath,the tidally-induced nutrient recharge is greatest in the fall andweakest in the winter. This is consistent with the seasonalintensi"cation and breakdown of the tidal mixing front,which is strongest in the summer, and weaker in the fall
Fig. 11. Near-surface horizontal and cross-bank vertical distributions of tidally-averaged nutrient concentrations at the 120th tidal cycle for the cases with July–August (a–b), September–October (c–d), and November–December (e–f) bi-monthly averaged strati"cations, respectively. The 60-, 100-, and 200-m isobaths areshown.
540 S. Hu et al. / Journal of Marine Systems 74 (2008) 528–544

and winter. It should be noted that in the simulation forcedonly by tides, the nutrients pumped onto the Bank from thenortheast !ank is stronger in the winter than in the fall.However, since the maximum concentration patch shiftstowards the shelf break with the off-Bank migration of theTMF, the nutrient !ux into the top of the Bank in the winter islower than in the fall.
3.4. Experiment #4
For this experiment, we added the bi-monthly averagedwind stress to the model and repeated Exp. #3 which allowedus to estimate the contribution of the wind stress to theseasonal variation in the nutrient !ux to the top of GB. Themodel showed that the in!uence of the mean wind stress onthe !ux is very weak in the summer and fall, while it accountsfor nearly a 24.7% increase in the winter (Table 3, Exp. #4a)over the analogous simulation with no wind forcing. Areanalysis of 27 years of wind stress derived from the GoMMM5 model clearly shows that the wind on GB variessigni"cantly with a time scale of 3–7 days, so that themonthly averaged wind stress is signi"cantly smaller than theRMS variation. By taking the standard deviation of the bi-monthly wind stress into account, the nutrient replenishmenton the top of the Bank in the fall through winter issigni"cantly increased, especially in the early winter whereit increases by nearly 100% (Table 3, Exp. #4b).
3.5. Experiment #5
The tidal pumping induced on-Bank nutrient !ux dependson the initial vertical pro"le of nutrient concentration off theBank, especially in the deeper !ank region between 60 m and100 m over the slope. An examination of monthly climato-logical "elds of nutrients shows that the concentrations anddistributions of nutrients in the GoM vary seasonally. We re-ran Exp. #3 using alternate vertical pro"les of nutrientconcentrations representing low and high concentrations inwaters deeper than 60 m. We found that at the 40th tidalcycle, the average nitrate concentration inside the 60-misobath over GB is about 1.71 !Mand 1.03 !M for Type II (high)and Type III (low) initial pro"les, respectively, compared to avalue of 1.4 !M for the Type I initial pro"le used in Exp. #3.
3.6. Experiment #6
This experiment was the same as Exp. #4 except that weincluded a more realistic initial nutrient condition based onhistorical data. Those data (for nitrate) inside the 60-misobath, compared with our idealized nutrient initial condi-tion were "15% higher in July–August, 35% lower inSeptember–October, and 37% larger in November–December
(Table 3). The large differences detected in the fall and wintersupport our "nding in Exp. #5 that the nutrient refreshmentover GB is signi"cantly in!uenced by the nutrient "eld in theoff-Bank waters in the GoM.
4. Discussion
Results from the numerical experiments support previous"ndings from both "eld and more idealized model experi-ments. For example, they support the earlier reports by Cura(1987) that diatoms are more dominant on the northern !ankthan on the southern !ank and generally higher phytoplank-ton biomass is typically found on the northeast !ank. Basedon nutrient and Chl-a measurements, Townsend et al. (2006)hypothesized that the nutrients over GB are drawn from thedeeper waters around the Bank's edges to the northern !ankwhere they are then advected by the residual circulationaround the Bank to the southern !ank, creating the “donut-shaped” pattern of nutrients and phytoplankton production.Our experiments clearly show a major source of nutrientsonto GB is on the northeast !ank where the residual currentsbifurcate and a donut-shaped distribution of nutrients formsdue to the clockwise residual currents.
Chen and Beardsley (2002) summarized four physicalmechanisms of cross-frontal water exchange on GB: 1) non-linear tidal current interactions; 2) asymmetric tidal mixing;3) variable winds; and 4) chaotic mixing. They suggested that“tidal pumping”, the tide-induced Lagrangian upwelling, isthe key physical process for transport of nutrients from deepwater onto the Bank near the bottom (Chen and Beardsley,1998). This mechanismwas supported by a coupled physical–biological experiment made by Franks and Chen (2001). Witha simple Nutrient–Phytoplankton–Zooplankton (NPZ) modelcoupled with the Princeton Ocean Model (POM) and drivenonly by tides, theywere able to reproduce the “donut-shaped”nutrient distribution around the tidal mixing front on GB.With better resolution of the complex bathymetry over thenorthern and northeastern !anks of GB, our model (FVCOM)experiments suggest that the “tidal pumping” varies sig-ni"cantly in space in this region, with a major source locatednear the northeast !ank where the residual current bifur-cates. This is consistent with the inter-model comparisonresults found by Tian and Chen (2006), who pointed out thatthe failure to resolve the rapid change of bathymetry on thenorthern !ank of GB in a structured-grid model (like POM)can lead to an overestimate of the on-Bank water transport aswell as an underestimate of the spatial variation of the tide-induced upwelling.
Using a long-term nutrient database including data from1931 to 20051, we computed monthly averaged (or “climato-logic”) values of nitrate concentration on the top of GB insidethe 60-m isobath (Fig. 12a). The nitrate concentrations arehighest in February with amean value of 6.5 !M, and decreaseto 0.1 !M from early spring to summer before recharging inthe fall and early winter. In the months for which ourexperiments were conducted, the observed monthly-meannitrate concentrations were 0.5 and 0.3 !M in June and July,
1 The major data sources are the US GLOBEC NWA program, NODC andMESD, with additional data provided by Pierre Clement at BedfordInstitution of Oceanography (Fisheries and Oceans Canada, 2006).
Table 3Tidally-averaged concentrations of nutrients within the 60-m isobath onGeorges Bank at the 120th tidal cycle for the listed experiments (units: µM)
Month Exp #3 Exp #4a Exp #4b Exp #6
Jul.–Aug. 3.86 3.88 4.07 4.46Sep.–Oct. 4.05 4.03 4.62 2.61Nov.–Dec. 3.40 4.24 6.78 5.81
541S. Hu et al. / Journal of Marine Systems 74 (2008) 528–544

0.7 !M and 0.1 !M in August and September, 0.9 and 2.3 !M inOctober and November, and 4.3 and 4.7 !M in December andJanuary. This reconstructed seasonal pattern (Fig. 12a) is verysimilar to that reported by Pastuszak et al. (1982) based onsingle-year cruise data, suggesting that this structure repre-sents a general seasonal pattern on GB. The large uncertaintyshown in Fig. 12a is due to signi"cant interannual variability.Despite such variability, the seasonal pattern remained littlechanged year to year. Without including biological processes,our model experiments suggest that the tidal pumping-induced !ux of nutrients onto GB can produce roughly ameannutrient concentration on the top of GB of up to "3.86 !M insummer and "4.05 !M in fall. The modeled contribution fromthe monthly-mean wind stress is weak, but variable windstress in the fall and winter can cause a large refreshment ofnutrients on GB (Table 3). Compared with the data in Fig. 12a,the model-predicted values are signi"cantly greater insummer and roughly the same in the fall and winter (whenthe effects of wind variability are included). This suggests, ofcourse, that biological uptake is important in maintaining low
nutrient levels on the top of GB during the summer, and isconsistent with the seasonal variation of observed Chl-aconcentrations summarized in Fig. 12b.
Earlier !ux rate estimates made by Loder et al. (1982)using observed temperatures gave a horizontal diffusion rate(Ah) of "150–380 m2/s. They argued that, based on diffusiveprocesses, new nutrients account for 20%–40% of the totalnutrients on the Bank. With an estimated water columnprimary production rate of about 2 gC/m2/d from spring tolater fall (Cohen et al., 1982) and assuming a Red"eld ratio ofN:C of 16:106, we estimate that a nutrient supply rate of 0.05–0.12 !mol N/m2/s is required to maintain a level of 20%–40%new nutrients on the Bank. Considering the temporal andspatial variations of a tidal mixing front resulting from thespring–neap tidal cycle, baroclinic eddies and near-bottomon-Bank !ow, Loder and Platt (1985) suggested a total cross-frontal nutrient !uxof 3.5!105mg at N s!1 for thewhole Bankarea within the 60-m isobath. Converting this value to anaverage rate over the area within the 60-m isobath gives0.025 !mol N/m2/s. Horne et al. (1989) used a skew !uxmethod to estimate the depth-integrated cross-frontal nitrate!ux onto GB; their estimated value is 12 mg at N m!1 s!1,which corresponds to an average rate of "0.34 !mol N/m2/sby assuming the perimeter is "400 km. Townsend andPettigrew (1997) found that the nitrate supply rate onto GBvaried signi"cantly in space. They estimated depth-integrated!ux of "2.9 mg at N m!1 s!1 on the northern !ank, 0.3 mg atN m!1 s!1 on the eastern !ank, 0.8 mg at N m!1 s!1 on thesouthern !ank, and 0.3 mg at N m!1 s!1 on the western !ank.Their area-averaged rate within the 60-isobath was deter-mined to be "0.034 !mol N/m2/s. Therefore, the area-averagesupply rate onto GB estimated from these "eldmeasurementsis in the range "0.02–0.34 !mol N/m2/s. Our model resultsobtained for summer strati"cation give "0.03 !mol N/m2/s.This value is in agreement with that estimated by Townsendand Pettigrew (1997), who argued that the large value of"0.34 !mol N/m2/s estimated by Horne et al. (1989) was toohigh andwas unrealistic during summer on GB.Working fromthe estimate of Townsend and Pettigrew, "ndings from thepresent work suggest that tidal pumping is the primaryprocess responsible for bringing nutrients onto GB in summer.
It should be noted again that because our modelingexperiments focused on verifying and quantifying the role oftidal pumping, mean wind stress, and wind stress variabilityin supplying nutrients to GB using various initial conditionsfor hydrography and initial nutrient distribution, we did notinclude any biological processes in this study. Nonetheless,our results clearly show that biological processes areimportant in maintaining the observed low nutrient levelson GB in summer and perhaps can also indirectly contributeto the skew on-Bank nutrient !ux by modifying the verticaland spatial distributions of the nutrients. Based on the tidalpumping idea proposed in our experiments, Ji et al. (in press)extended our experiments to include an NPZD biologicalmodel and simulated the seasonal variation of nutrients in theGoM/GB region. A discussion on the contribution of biologicalprocesses to the tidal pumping process is discussed in detailin their paper.
Our experiments show that tidal pumping is mainly dom-inated by advective processes with a secondary contributionfrom vertical and lateral diffusion. The lateral diffusion !ux,
Fig. 12. Annual cycles of observed monthly averaged nitrate and chlorophyllconcentrations versus temperature on the top of Georges Bank. Each dotrepresents the mean of the monthly averaged values computed for each yearwith suf"cient data in that month, and the horizontal bar is the standarddeviation of the mean. (The number of nutrient samples for January, July andSeptember are not enough to calculate the standard deviations of the mean,so the horizontal bars for those months are omitted).
542 S. Hu et al. / Journal of Marine Systems 74 (2008) 528–544

even though it is very small, may still be over-counted in ourexperiments due to an overestimate of the lateral diffusioncoef"cient on GB. Based on his GB dye experiment results,Houghton (2002) estimated the lateral diffusion coef"cient inthe tidal mixing front to be Ah"10–20 m2/s, which is aboutone order of magnitude smaller than the value suggested byLoder et al. (1982). By simulating the observed spreading ofthe initial dye patch, Chen et al. (2008) found that the modelconverges to the observed dye behavior when the horizontalresolution was increased to "500 m on GB. With this re-solution, the Smagorinsky eddy parameterization yieldsvalues of Ah the same order of magnitude as that estimatedby Houghton (2002). The parameters used in our currentexperiments yield values of Ah in the same range as thatsuggested by Loder et al. (1982). A further study needs to beconductedwith higher spatial resolution if one is interested indetermining quantitatively the lateral diffusion nutrient !uxonto GB.
5. Conclusions
The in!uence of tides and winds on nutrient transportonto GB is studied using a high-resolution nutrient tracermodel driven by the GoM/GB FVCOM. The results show thattidal pumping, a result of the non-linear interaction of tidalcurrents over steep bottom topography, is the key process forthe supply of nutrients to GB. The replenishment rate ofnutrients to the Bank is also related to the seasonal variationin water column strati"cation, winds, and off-Bank source-water nutrient concentrations. In the homogenous case, theresidual current bifurcates where the 40-m, 60-m and 100-misobaths split along the northern !ank. The tidal pumping-induced on-Bank nutrient !ux varies signi"cantly in space,with amajor source on the northeast !ankwhere the isobathsand residual currents diverge. The clockwise residual currentaround GB is a dominant physical process that delivers nu-trients downstream from the northeast !ank to the southern!ank. In summer, the winds are too light to in!uence sig-ni"cantly the on-Bank !ux of nutrients, while tidal pumpingdominates the !ux to the mixed region of GB. Biologicaluptake depletes nutrients in the mixed region during thesummer. In the fall through winter, particularly after the fallbloom, the recharge of nutrients to GB is mainly drivenby the combined physical processes of tidal pumping andvariablewind forcing. Seasonal variation of tidal pumping as aresult of variable vertical strati"cation is signi"cant, butwithin-season variability in strati"cation is insigni"cant.Rapid recharge in the fall and early winter is driven primarilyby strong wind events, with winds becoming more importantin late winter.
Acknowledgments
This research was supported by the U.S. GLOBEC North-west Atlantic/Georges Bank Program through NSF grants(OCE-0234545; OCE-0227679, OCE0606928; OCE0712903;OCE0732084 and OCE0726851) and NOAA grant (NA-16OP2323) for Changsheng Chen, NSF grant (OCE-0228943)to David W. Townsend, NSF grant (OCE-0236270) for RobertHoughton, the WHOI Smith Chair in Coastal Oceanographyand NOAA grant (NA-17RJ1223) for Robert Beardsley, NOAA
(grants NA04NMF4720332 and NA05NMF4721131) for SongHu and Geoffrey Cowles, and NSF (grant OCE-0727033) andNOAA (grant NA17RJ1223) to Rubao Ji. The experiments wereconducted using the Linux clusters in the Marine EcosystemDynamics Modeling Laboratory at the School of MarineScience and Technology, University of Massachusetts–Dart-mouth, funded by the SMAST Fishery Program through NOAAgrants NA04NMF4720332 and NA05NMF4721131. This paperis U.S. GLOBEC contribution number 596, SMAST ContributionSeries number 08-0501, School for Marine Science andTechnology, University of Massachusetts-Dartmouth andLamont Doherty Earth Observatory contribution number7149. The authors would like to thank two anonymousreviewers for their constructive suggestions on improving thequality of this paper.
References
Backus, R.H., 1987. Georges Bank. MIT Press, Cambridge, Mass. 593 pp.Bigelow, H.B., 1927. Physical oceanography of the Gulf of Maine. Bull. U. S. Bur.
Fish. 40, 511–1027.Brink, K.H., et al., 2003. Properties of !ow and pressure over Georges Bank as
observed with near-surface drifters. J. Geophys. Res. 108, C118001.doi:101029/2001JC001019.
Brown, W., Moody, J., 1987. Tides. In: Backus, R.H. (Ed.), Georges Bank. MITPress, Cambridge, Mass., pp. 100–107.
Butman, B., Beardsley, R.C., 1987. An introduction to the physical oceano-graphy of Georges Bank. In: Backus, R.H. (Ed.), Georges Bank. MIT Press,Cambridge, Mass. 593 pp.
Butman, B., et al., 1982. Recent observations of the mean circulation onGeorges Bank. J. Phys. Oceanogr. 12, 569–591.
Chen, C., Beardsley, R.C., 1998. Tidal mixing and cross-frontal particleexchange over a "nite amplitude asymmetric bank: a model studywith application to Georges Bank. J. Mar. Res. 56, 1163–1201.
Chen, C., Beardsley, R.C., 2002. Cross-frontal water exchange on GeorgesBank: some results from an U.S. GLOBEC/Georges Bank Program ModelStudy. J. Oceanogr. 58, 403–420.
Chen, C., Beardsley, R.C., Franks, P.J.S., 2001. A three-dimensional prognosticmodel study of the ecosystem over Georges Bank and adjacent coastalregions, Part I, physical model. Deep Sea Res. II 48, 419–456.
Chen, C., et al., 1995. A numerical study of strati"ed tidal recti"cation over"nite-amplitude banks, part II, Georges Bank. J. Phys. Oceanogr. 25,2111–2118.
Chen, C., et al., 2003a. Model study of the cross-frontal water exchange onGeorges Bank: a three-dimensional Lagrangian experiment. J. Geophys.Res. 108 (C5), 3142. doi:10.1029/2000JC000390.
Chen, C., et al., 2003b. An unstructured, "nite-volume, three-dimensional,primitive equation ocean model: application to coastal ocean andestuaries. J. Atmos. Ocean. Technol. 20, 159–186.
Chen, C., et al., 2005. Using MM5 to hindcast the ocean surface forcing "eldsover the Gulf of Maine and Georges Bank region. J. Atmos. Ocean.Technol. 22 (2), 131–145.
Chen, C., et al., 2006. An unstructured grid, "nite-volume coastal oceanmodel (FVCOM) system. Special Issue entitled “Advance in Computa-tional Oceanography”. Oceanography 19 (1), 78–89.
Chen, C., et al., 2007. A "nite-volume numerical approach for coastal oceancirculation studies: comparisonwith "nite difference models. J. Geophys.Res. 112, C03018. doi:10.1029/2006JC003485.
Chen, C., et al., 2008. Amodel-dye comparison experiment in the tidal mixingfront zone on the southern !ank of Georges Bank. J. Geophys. Res. 113,C02005. doi:10.1029/2007JC004106.
Cohen, E.B., et al., 1982. Energy budget of Georges Bank. Can. Spec. Publ. Fish.Aquat. Sci. 59, 95–107.
Cura, J.J., 1987. In: Backus, R.H. (Ed.), Phytoplankton in Georges Bank. MITPress, Cambridge, Mass., pp. 213–218.
Dugdale, R.C., Georing, J.J., 1967. Uptake of new and regenerated forms ofnitrogen in primary productivity. Limnol. Oceanogr. 12, 196–206.
Eppley, R.W., Peterson, B.J., 1979. Particulate organic matter !ux andplanktonic new production in the deep ocean. Nature 282, 677–680.
Fisheries and Oceans Canada, 2006. BioChem: database of biological andchemical oceangraphic data. http://www.meds-sdmmdfo-mpo.gc.ca/biochem/Biochem_e.htm. Version 8 (2005).
Franks, P.S.J., Chen, C., 1996. Plankton production in tidal fronts: a model ofGeorges Bank in summer. J. Mar. Res. 54, 631–651.
543S. Hu et al. / Journal of Marine Systems 74 (2008) 528–544

Franks, P.J.S., Chen, C., 2001. A three-dimensional prognostic model study ofthe ecosystem over Georges Bank and adjacent coastal regions, Part II:coupled biological and physical model. Deep Sea Res. II 48, 457–482.
Galperin, B., et al., 1988. A quasi-equilibrium turbulent energy model forgeophysical !ows. J. Atmos. Sci. 45, 55–62.
Greenberg, D.A., 1983. Modeling the mean barotropic circulation in the Bay ofFundy and the Gulf of Maine. J. Phys. Oceanogr. 13, 886–904.
Horne, E.P.W., et al., 1989. Nitrate supply and demand at the Georges Banktidal front. Sci. Mar. 53, 145–158.
Houghton, R.W., 2002. Diapycnal !ow through a tidal front: a dye tracerstudy on Georges Bank. J. Mar. Sys. 37, 31–46.
Houghton, R.W., Ho, C., 2001. Diapycnal !ow through the Georges Bank tidalfront: a dye tracer study. Geophys. Res. Lett. 28 (1), 33–36.
Ji, R., et al., 2006a. Spring bloom and associated lower trophic level food webdynamics on Georges Bank: 1-D and 2-D model studies. Deep Sea Res. II53, 2656–2683.
Ji, R., et al., 2006b. The impact of Scotian Shelf Water “cross-over” on theplankton dynamics on Georges Bank: a three-dimensional experimentfor the 1999 spring bloom. Deep Sea Res. II 53, 2684–2707.
Ji, R., et al., in press. In!uence of local and external processes on the annualnitrogen cycle and primary productivity on Georges Bank: a 3-Dbiological-physical modeling study. J. Mar. Syst. doi:10.1016/j.jmarsys.2007.08.002.
Lewis, C.V.W., et al., 2001. Biological–physical modeling of meroplanktontransport and settlement patterns on Georges Bank. Deep Sea Res. II 48,137–158.
Limeburner, R., Beardsley, R.C., 1982. The seasonal hydrography andcirculation over Nantucket Shoals. J. Mar. Res. 40, 371–406 Supplement.
Limeburner, R., Beardsley, R.C., 1996. Near-surface recirculation over GeorgesBank. Deep-Sea Res. II 43, 1547–1574.
Loder, J.W., 1980. Topographic recti"cation of tidal currents on the sides ofGeorges Bank. J. Phys. Oceanogr. 10, 1399–1416.
Loder, J.W., Horne, E.P.W., 1991. Skew eddy !uxes as signatures of non-lineartidal current interactions, with application to Georges Bank. Atmos.-Ocean. 29, 517–546.
Loder, J.W., Platt, T., 1985. Physical controls on phytoplankton production attidal fronts. In: Gibbs, P.E. (Ed.), Proceedings of the Nineteenth EuropeanMarine Biology Symposium. Cambridge University Press, pp. 3–21.
Loder, J.W., et al., 1982. Horizontal exchange on central Georges Bank. Can. J.Fish. Aquat. Sci. 39, 1130–1137.
Lynch, D.R., Naimie, C.E., 1993. TheM2 tide and its residual on the outer banksof the Gulf of Maine. J. Phys. Oceanogr. 23, 2222–2253.
Mellor, G.L., Yamada, T., 1982. Development of a turbulence closure model forgeophysical !uid problems. Rev. Geophys. 20, 851–875.
Naimie, C.E., 1996. Georges Bank residual circulation during weak and strongstrati"cation periods: prognostic numerical model results. J. Geophys.Res. 101, 6469–6486. doi:10.1029/95JC03698.
Naimie, C.E., et al., 1994. Seasonal variation of the three-dimensional residualcirculation on Georges Bank. J. Geophys. Res. 99, 15967–15990.doi:10.1029/94JC01202.
Naimie, C.E., et al., 2001. On the geographic and seasonal patterns of the near-surface circulation on Georges Bank—from real and simulated drifters.Deep Sea Res. II 48, 501–518.
O'Reilly, J.E., et al., 1987. Primary production. In: Backus, R.H. (Ed.), GeorgesBank. MIT Press, Cambridge, Mass., pp. 220–233.
Pastuszak, M., et al., 1982. One year of nutrient distribution in the GeorgesBank region in relation to hydrography. J. Mar. Res. 14, 525–542.
Pringle, J.M., Franks, P.J.S., 2001. Asymmetric mixing transport: a horizontaltransport mechanism for sinking plankton and sediment in tidal !ows.Limnol. Oceanogr. 46 (2), 381–391.
Riley, G.A., 1941. Plankton studies, IV. Georges Bank. Bull. Bingham Oceanogr.7, 1–73.
Roworth, E., Signell, R.P., 2001. Construction of Digital Bathymetry for the GulfofMaine. (See http://pubs.usgs.gov/of/1998/of98-801/bathy/index.htm/).
Smagorinksy, J., 1963. General circulation experiments with the primitiveequations: I. The basic experiment. Mon. Weather Rev. 91, 99–164.
Tian, R., Chen, C., 2006. In!uence of model geometrical "tting and turbulenceparameterization on phytoplankton simulation in the Gulf of Maine.Deep Sea Res. II 53, 2808–2832.
Townsend, D.W., Pettigrew, N.R., 1997. Nitrogen limitation of secondaryproduction on Georges Bank. J. Plankton Res. 19 (2), 221–235.
Townsend, D.W., Thomas, A.C., 2001. Winter-sprint transition of phytoplank-ton chlorophyll and inorganic nutrients on Georges Bank. Deep Sea Res. II48, 199–214.
Townsend, D.W., Thomas, M., 2002. Springtime nutrient and phytoplanktondynamics on Georges Bank. Mar. Ecol. Progr. Ser. 228, 57–74.
Townsend, D.W., et al., 2006. Oceanography of the Northwest AtlanticContinental Shelf. In: Robinson, A.R., Brink, K.H. (Eds.), The Sea: TheGlobal Coastal Ocean: Interdisciplinary Regional Studies and Syntheses.Harvard University Press, pp. 119–168.
Ullman, D.S., et al., 2003. The front on the northern !ank of Georges Bank inspring: cross-frontal !uxes and mixing. J. Geophys. Res. 108, 8010.doi:10.1029/2002JC001328.
Walsh, J.J., et al., 1987. Nitrogen cycling on Georges Bank and the New YorkShelf: a comparison between well-mixed and seasonally strati"edwaters. In: Backus, R.H. (Ed.), Georges Bank. MIT Press, Cambridge,Mass., pp. 234–246.
544 S. Hu et al. / Journal of Marine Systems 74 (2008) 528–544