journal of hematology - springer · journal of hematology & oncology autoantibodies to ezrin...
TRANSCRIPT
JOURNAL OF HEMATOLOGY& ONCOLOGY
Autoantibodies to Ezrin are an early sign ofpancreatic cancer in humans and in geneticallyengineered mouse modelsCapello et al.
Capello et al. Journal of Hematology & Oncology 2013, 6:67http://www.jhoonline.org/content/6/1/67

RESEARCH Open Access
Autoantibodies to Ezrin are an early sign ofpancreatic cancer in humans and in geneticallyengineered mouse modelsMichela Capello1,2, Paola Cappello1,2, Federica Caterina Linty1,2, Roberto Chiarle1, Isabella Sperduti3,Anna Novarino4, Paola Salacone5, Giorgia Mandili1,2, Alessio Naccarati6, Carlotta Sacerdote6,7, Stefania Beghelli8,Samantha Bersani9, Stefano Barbi9, Claudio Bassi10, Aldo Scarpa8,9, Paola Nisticò11, Mirella Giovarelli1,2,Paolo Vineis6,12, Michele Milella13 and Francesco Novelli1,2*
Abstract
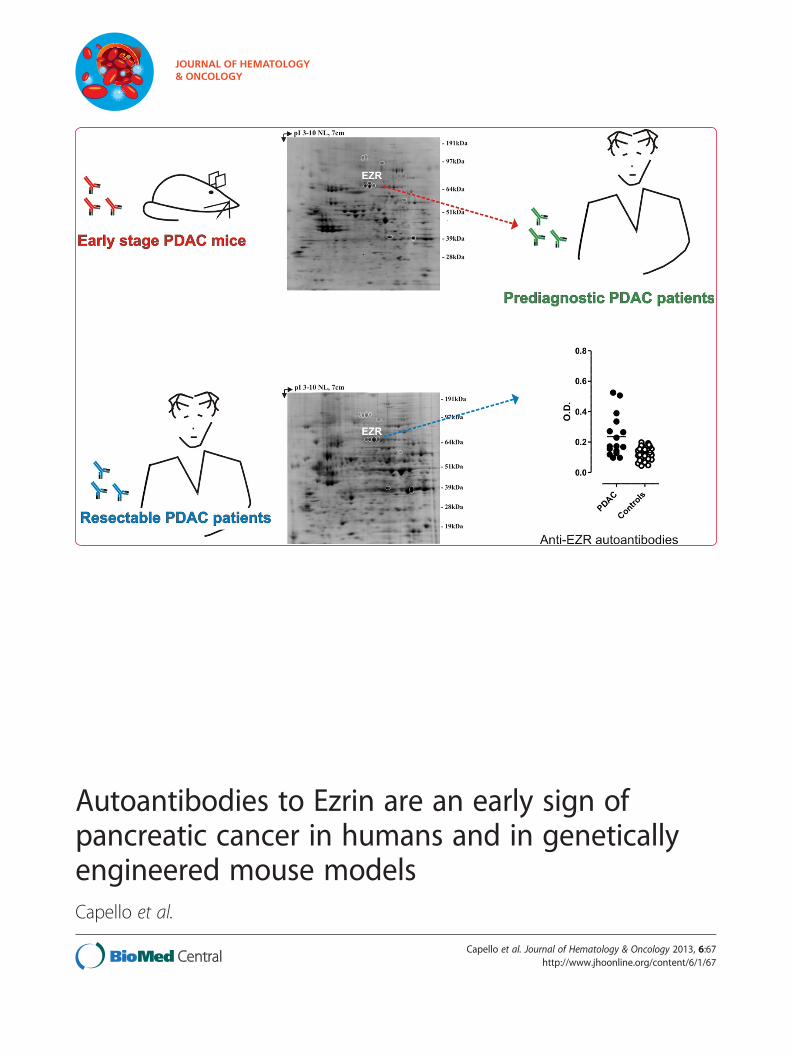
Background: Pancreatic Ductal Adenocarcinoma (PDAC) is a highly aggressive malignancy with only a 5% 5-yearsurvival rate. Reliable biomarkers for early detection are still lacking. The goals of this study were (a) to identify earlyhumoral responses in genetically engineered mice (GEM) spontaneously developing PDAC; and (b) to test theirdiagnostic/predictive value in newly diagnosed PDAC patients and in prediagnostic sera.
Methods and results: The serum reactivity of GEM from inception to invasive cancer, and in resectable oradvanced human PDAC was tested by two-dimensional electrophoresis Western blot against proteins from murineand human PDAC cell lines, respectively. A common mouse-to-human autoantibody signature, directed against sixantigens identified by MALDI-TOF mass spectrometry, was determined. Of the six antigens, Ezrin displayed thehighest frequency of autoantibodies in GEM with early disease and in PDAC patients with resectable disease. Thediagnostic value of Ezrin-autoantibodies to discriminate PDAC from controls was further shown by ELISA and ROCanalyses (P < 0.0001). This observation was confirmed in prediagnostic sera from the EPIC prospective study inpatients who eventually developed PDAC (with a mean time lag of 61.2 months between blood drawing andPDAC diagnosis). A combination of Ezrin-autoantibodies with CA19.9 serum levels and phosphorylated α-Enolaseautoantibodies showed an overall diagnostic accuracy of 0.96 ± 0.02.
Conclusions: Autoantibodies against Ezrin are induced early in PDAC and their combination with other serologicalmarkers may provide a predictive and diagnostic signature.
Keywords: Pancreatic ductal adenocarcinoma, Tumor antigen, Genetically engineered mouse model, Earlydiagnosis, Ezrin
BackgroundPancreatic ductal adenocarcinoma (PDAC) is the fourthleading cause of cancer death in Western countries. Upondiagnosis, less than 20% of patients present localized,potentially curable tumors. The overall 5-year survival rateis <5% [1,2]. This poor prognosis has been attributed tofailure in early disease diagnosis, when the tumor may still
be resectable, along with its propensity to disseminate andits resistance to systemic treatment [3]. CA19.9 is the onlybiomarker that has demonstrated clinical value for thera-peutic monitoring and early detection of recurrent diseaseafter treatment in patients with known pancreatic cancer.However, its use as a screening tool has proved unsuccess-ful, thus other biomarkers alone or in combination with itare required for early diagnosis of PDAC [1].Autoantibody levels can function as diagnostic and
prognostic markers [4,5]. By SERological Proteome Ana-lysis (SERPA) we have previously identified a number ofPDAC-associated antigens that are specifically recognized
* Correspondence: [email protected] for Experimental Research and Medical Studies (CeRMS), AziendaOspedaliera Città della Salute e della Scienza di Torino, Turin, Italy2Department of Molecular Biotechnology and Life Sciences, University ofTorino, Turin, ItalyFull list of author information is available at the end of the article
JOURNAL OF HEMATOLOGY& ONCOLOGY
© 2013 Capello et al.; licensee BioMed Central Ltd. This is an Open Access article distributed under the terms of the CreativeCommons Attribution License (http://creativecommons.org/licenses/by/2.0), which permits unrestricted use, distribution, andreproduction in any medium, provided the original work is properly cited.
Capello et al. Journal of Hematology & Oncology 2013, 6:67http://www.jhoonline.org/content/6/1/67

by circulating autoantibodies present in the serum ofPDAC patients [6-9]. However as these autoantibodieswere discovered in sera from patients at advanced stagesof PDAC, earlier diagnostic markers would not have beenidentified.Genetically engineered mice (GEM) that spontan-
eously develop PDAC may be used to facilitate thedevelopment of novel tests for the early detection andtreatment of PDAC [10]. LSL-KrasG12D/+; Pdx-1-Cremice (KC) develop the entire histologic compendium ofpancreatic intraepithelial neoplasia (PanIN) lesions ob-served in the human disease, and a subset of mice also de-velop invasive pancreatic carcinomas. LSL-KrasG12D/+;LSL-Trp53R172H/+; Pdx-1-Cre double mutant mice (KPC),develop a more aggressive invasive and metastatic PDACwith an earlier time of onset, and display a reduced sur-vival rate compared to KC mice [11,12].In the present study, we used SERPA to identify TAAs
eliciting an early humoral response in KC and KPC.Results from two-dimensional electrophoresis (2DE),Western blotting (WB) and mass spectrometry (MS)were combined to compare the reactivity of KC andKPC sera to that of corresponding matched controls.Antigens recognized by autoantibodies in KC and KPCat PanIN stages were identified and validated in a set ofresectable and advanced PDAC patients. Ezrin (EZR),the protein with the highest frequency of autoantibodiesin both early stage GEM and resectable PDAC patients,was validated by ELISA test using PDAC sera eithercollected at the time of diagnosis or several monthsbefore cancer onset (prediagnostic PDAC). The sensitivityand specificity of EZR-autoantibodies for discriminatingPDAC was evaluated together with other serologicalmarkers.
MethodsMurine studyAll animals were treated in accordance with European andinstitutional guidelines (Legislative Order No. 116/92).129SvJae/B6 H-2Db mice carrying mutated KrasG12D andTrp53R172H under the endogenous promoter, and flankedby Lox-STOP-Lox cassettes (LSL-KrasG12D/+ and LSL-Trp53R172H/+) were kindly provided from Dr. D.A. Tuveson(Cancer Research UK, Cambridge Research Institute,Cambridge, UK). C57BL/6 mice expressing Cre recom-binase under a specific pancreatic transcriptional factorPdx-1 (pancreatic duodenum homeobox 1) promoter(Pdx-1-Cre) were obtained from Dr. A.M. Lowy (Universityof California, San Diego, CA). Conditional LSL-KrasG12D/+,LSL-Trp53R172H/+ and Pdx-1-Cre strains were bred toobtain LSL-KrasG12D/+; Pdx-1-Cre single mutant (KC) andLSL-KrasG12D/+; LSL-Trp53R172H/+; Pdx-1-Cre doublemutant (KPC) mice [11,12]. To collect serum, mice wereeuthanized and blood was collected by cardiac puncture
using a 22-gauge needle and 1 ml syringe. Mice weresurgically and pathologically examined to confirm thepresence of pancreatic tumors and metastases.
Human studiesCross-sectional clinical studyThe study was approved by the Ethical Committees of:Azienda Ospedaliera Città della Salute e della Scienza diTorino, Turin; Policlinico G.B. Rossi, Verona; ReginaElena National Cancer Institute, Rome and OrdineMauriziano Hospital, Turin. Serum samples were iso-lated from venous blood at time of diagnosis with theinformed consent of patients and control subjects andstored at −80°C until use. De-identified numeric specimencodes were used to protect the identity of the individuals.Diagnosis of PDAC or any other cancer was consistentlyconfirmed by histological or cytological analysis. Sera from120 PDAC patients (M/F: 67/53; median age, 67 y; range,32–86 y) with clinical features previously described [9]were analyzed by SERPA, and sera from 69 PDAC patientswith clinical features described in Table 1 were tested byELISA. Reactivity of these sera was compared, in bothSERPA and ELISA studies, with that of control sera fromthe following sources: 60 healthy subjects (HS, M/F: 25/35;median age, 70 y; range, 49 − 90 y) with no prior history ofcancer or autoimmune disease; 50 non-PDAC cancerpatients (9 liver, 12 breast, 9 colon, 19 lung and 1 ovarian;M/F: 24/26; median age, 69 y; range, 44 − 86 y); 46 chronicpancreatitis patients (CP, M/F: 26/20; median age, 58 y;range, 22 − 74 y); 12 autoimmune diseases patients (AD, 3Mixed Cryoglobulinemia, 2 Meniere's Syndrome, 4 Rheu-matoid Arthritis, 2 Systemic Lupus Erythematosus, and 1Autoimmune Pancreatitis; M/F: 3/9; median age, 49 y;range, 38 − 79 y).
Prospective pre-clinical studyPrediagnostic serum samples of PDAC patients andmatched controls were obtained from the Turin EuropeanProspective Investigation into Cancer and Nutrition(EPIC) cohort that includes samples from 10 604 healthysubjects at the moment of enrolment (6 047 males and 4557 females, aged 35–65 y) recruited in the city of Turin.Recruitment took place between 1993–1998 and involvedblood donors and other healthy volunteers. After blooddonation, samples were stored at 5–10°C, protected fromlight, and transported to local laboratories for processingand dividing into aliquots. Blood was separated into0.5-ml fractions (serum, plasma, red cells, and buffy coatfor DNA extraction) and stored in heat-sealed straws inliquid nitrogen (−196°C). Subjects were monitored longi-tudinally for cancer or other disease development. Co-operation with the local cancer registry and the localhealth authority enabled access to hospital discharge in-formation and all newly diagnosed cancer cases. Study
Capello et al. Journal of Hematology & Oncology 2013, 6:67 Page 2 of 12http://www.jhoonline.org/content/6/1/67

design, population and baseline data collection have pre-viously been described in detail [13,14]. Sixteen PDACpatients identified from the Turin EPIC cohort are inclu-ded in the present study. Controls were matched by age,sex, and date at entry in the cohort, and did not developany cancer or autoimmune disease. Characteristics of sub-jects are summarized in Table 2. Each participant providedinformed consent, and the local Ethics Review Committeesapproved this study.
Two-dimensional electrophoresis and western blot analysisCells (107) from the CF-PAC-1 (ECACC ref. No. 91112501)and K8484 isolated from a tumor arising in KPC mice,kindly provided by Dr. K.P. Olive (Columbia University,New York, NY), were solubilized, subjected to 2DE andelectro-transferred onto a nitrocellulose membrane (GEHealthcare Bio-Sciences, Uppsala, Sweden) as previ-ously described [6]. Frozen PDAC tissues from eightsurgically-treated patients (stage IIA and IIB of PDAC)were homogenized in 2DE lysis buffer, subjected to2DE and electro-blotted onto a nitrocellulose mem-brane (GE Healthcare) as previously described [9]. Serafrom KC, KPC, PDAC patients and controls were testedto determine mouse and human IgG concentrationsusing commercial kits (IgG ELISA Quantitation Set
Table 1 Clinical features of PDAC patients analyzed byELISA
Characteristics N %a
Gender
Male 39 57
Female 30 43
Age (y)
Mean 63 - -
Range 42-84 - -
Stageb
IB 1 2
IIA 7 10
IIB 29 42
III 10 14
IV 22 32
Grading
Not reported 32 46
1 4 6
2 16 23
3 17 25
Primary site
Head 49 71
Body 6 9
Tail 5 7
Body-Tail 9 13
ECOG PS
Not reported 10 14
0 32 47
1 25 36
≥2 2 3
Surgery with radical intent
Yes 39 57
No 30 43
Baseline CA19.9 (IU/ml)
Evaluable 63 91
Mean 3052 - -
Median 500 - -
Range 2- > 12000 - -
First-line chemotherapyc
Evaluable 59 86
Gem 43 73
Gem/Oxal 10 17
Gem/5-FU 3 5
Non-Gem 1 2
No CT 2 3
Table 1 Clinical features of PDAC patients analyzed byELISA (Continued)
ENOA1,2 Reactivity
Evaluable 50 73
Positive 34 68
Negative 16 32
ECOG PS eastern cooperative oncology group performance status,5-FU 5-fluorouracil, Gem gemcitabine, Oxal oxaliplatin, CT chemotherapy.aRounded percentages.bClassified according to the TMN classification of malignant tumor of thepancreas (UICC).cFirst-line chemotherapy refers to palliative chemotherapy administered forrelapsed, locally advanced inoperable, or metastatic disease.
Table 2 Characteristics of the EPIC cohort subjects
PDAC Controls
N % N %
Total 16 100 32 100
Age (y)
Mean 54.9 55.1
SD 7.3 7.5
Sex
Female 7 44 14 44
Male 9 56 18 56
Time span to diagnosis (mo)
Mean 61.2
Range 5–117.1
Capello et al. Journal of Hematology & Oncology 2013, 6:67 Page 3 of 12http://www.jhoonline.org/content/6/1/67

from Bethyl Laboratories - Montgomery, TX, USA).Sera were individually tested on 2DE maps at a workingdilution of 0.1 mg/ml IgG for 4 h, followed by incuba-tion with horseradish peroxidase (HRP)-conjugatedrabbit anti-human IgG (90 minutes, 1:1000; Santa CruzBiotechnology, Santa Cruz, CA, USA) or sheep anti-mouse Ig (90 minutes, 1:5000; GE Healthcare) as asecondary antibody. Ezrin spots were revealed with anti-Ezrin antibody (1 hour incubation, 1:5000; Abcam,Cambridge, MA, USA) and HRP-conjugated donkeyanti-rabbit IgG (1 hour incubation, 1:2000; GE Healthcare)as a secondary antibody. Immunodetection was accom-plished by ECL PLUS (Enhanced Chemiluminescence, GEHealthcare). The chemifluorescent signals were scannedwith “ProXPRESS 2D” (PerkinElmer, Waltham, MA, USA)with an excitation/emission filter setting of 460/80 and530/30, respectively, for an exposure time of 12 s. Imageswere recorded in TIFF format. The volume of each spotrecognized by autoantibodies was calculated after back-ground subtraction using “ProFinder 2D” (PerkinElmer)software and reported as arbitrary units (AU). For proteinsrepresented from more than one spot the volume wasexpressed as a mean value.
Protein identification by mass spectrometryCoomassie G-stained spots were excised from 2DE pre-parative gels; destaining and in-gel enzymatic digestionwere performed as previously described [15]. Briefly eachspot was destained with 100 μl of 50% vol/vol aceto-nitrile in 5 mmol/l ammonium bicarbonate and driedwith 100 μl of acetonitrile. Each dried gel piece wasrehydrated for 40 minutes at 4°C in 10 μl of a digestionbuffer containing 5 mmol/l ammonium bicarbonate, and10 ng/μl of trypsin. Digestion was allowed to proceedovernight at 37°C and peptide mixtures were stored at 4°Cuntil assayed. All digests were analyzed by a MALDI microMX - TOF Mass Spectrometer (Waters, MA, USA)equipped with a delayed extraction unit. Peptide solutionwas prepared with equal volumes of saturated α-cyano-4-hydroxycinnamic acid solution in 40% vol/vol acetonitrile-0.1% vol/vol trifluoroacetic acid. The MALDI-TOF was cali-brated with a mix of PEG (PEG 1000, 2000 and 3000 withthe ratio 1:1:2) and mass spectra were acquired in thepositive-ion mode. Peak lists were generated withProteinLynx Data Preparation (ProteinLynx Global Server2.2.5) using the following parameters: external calibrationwith lock mass using mass 2465.1989 Da of ACTH, back-ground subtract type adaptive combining all scans,performing deisotoping with a threshold of 1%. The 25 mostintense masses were used for database searches against theSWISSPROT database (Release 2011_12 of 14-Dec-11)using the free search program MASCOT 2.3.02 (http://www.matrixscience.com/cgi/search_form.pl?FORMVER=2&SEARCH=PMF). The following parameters were used in the
searches: taxa Homo sapiens or Mus musculus, trypsin di-gest, one missed cleavage by trypsin, carbamidomethylationof cysteine as fixed modification, methionine oxidation asvariable modifications and maximum error allowed 100ppm. Only proteins with a Mascot score >55 were taken intoconsideration.
Anti-Ezrin autoantibody capture by enzyme-linkedimmunosorbent assayPurified recombinant protein of Homo sapiens Ezrin, tran-script variant 1 (OriGene, Rockville, MD, USA) was usedto capture autoantibodies to Ezrin. Briefly, the protein wascoated (0.5 μg/ml in PBS) on 96-well micro-plates over-night at room temperature, followed by blocking with PBScontaining 4% bovine serum albumin for 2 hours at roomtemperature. Sera (working dilution 0.01 mg/ml) werethen added to the coated wells for 2 hours at roomtemperature. After washing with PBS-Tween-20, micro-plates were incubated with HRP-conjugated rabbit anti-human IgG (dilution 1:1000; Santa Cruz Biotechnology)for 1 hour at room temperature and TMB One Solution(Promega, Madison, WI, USA) was added to each well.The reaction was stopped by 2N HCl and the opticaldensity (OD) value was measured at 450 nm. The corre-sponding background values of the sera on uncoated wellswere subtracted. All samples were assayed in triplicateand the results represent mean values.
Statistical analysisStatistical analysis was performed using GraphPad(Version 4, San Diego, CA), MedCalc (Version 11.4.2.0,Mariakerke, Belgium) and SPSS (Version 18.0, Chicago,IL, USA) software packages. Mouse survival was estimatedby Kaplan-Meier analysis and compared with Log-ranktests. Receiver operating characteristic (ROC) curve ana-lysis was performed in order to find the optimal cut-offlevels capable of splitting patients into groups with differ-ent outcome probabilities. Specificity, sensitivity and areaunder curve (AUC) were estimated considering histologyresults as the gold standard. The classification and regres-sion tree (CART) analysis, a type of decision tree method-ology, is a nonparametric statistical procedure thatidentifies mutually exclusive and exhaustive subgroups ofa population whose members share common characteris-tics that influence the dependent variable of interest.CART uses a binary recursive partitioning method thatproduces a decision tree that identifies subgroups of pa-tients with a higher likelihood of being found positive in atest for a disease state. The exhaustive CHAID methodwas used for CART analysis. Correlations and associationsbetween variables were tested by Pearson’s test, Student'st-test, χ2 test or Fisher’s exact test, as appropriate. For alltests, 2-sided P < 0.05 (*), P < 0.005 (**) and P < 0.0005(***) values were considered significant.
Capello et al. Journal of Hematology & Oncology 2013, 6:67 Page 4 of 12http://www.jhoonline.org/content/6/1/67

ResultsMurine studySerological proteome analysis in mice that spontaneouslydevelop PDACTo identify tumor antigens associated with early PDACdevelopment, we exploited two sophisticated mousemodels of PDAC, KC and KPC mice, in which we couldcollect serum from inception of preinvasive disease toinvasive cancer. KC and KPC displayed stereotypicalneoplastic progression from pancreatic precursor lesions(PanIN) present at 1 month of age to advanced PDAC,showing a mean survival of 12 and 7 months, respectively(Additional file 1: Figure S1A). Percentages of transformedfoci increased with age, ranging from less than 5% at 1month of age to more than 80% at 9 and 5 monthsrespectively (Additional file 1: Figure S1B-G). Serumsamples collected from 25 KC at 1, 3, 5 and 9 months of
age, and from 16 KPC at 2, 5 and 7 months of age werehistologically attributed to different stages of tumor pro-gression and subjected to SERPA. Total proteins extractedfrom the KPC-derived K8484 cell line were separated by2DE and transferred onto nitrocellulose membranes. Serafrom GEM or age-matched Pdx-1-Cre mice (hereafterdefined as control mice) were screened individually forthe presence of antibodies to PDAC proteins. Image ana-lysis of the immunoreactivity identified 18 protein spotsrecognized at high frequency by KC and KPC sera com-pared to control mice sera (Figure 1A-D). These spotswere excised from a preparative gel for MALDI-TOF ana-lysis, leading to identification of nine proteins (Additionalfile 1: Table S1) belonging to three different functionalgroups, mainly cytoskeletal proteins or cytoskeleton regula-tors: Ezrin (EZR), Vimentin (VIM), Cytokeratin-8 (K2C8),Vinculin (VCL), Annexin A2 (ANXA2) and Annexin A1
Figure 1 SERPA analysis of KC and KPC serum reactivity against K8484 cell line 2DE map. Total lysates from the K8484 cell line wereseparated by 2DE as described in the Methods section. Samples were focused in the first dimension using a gradient spanning the indicated pHrange, separated in the second dimension in 4-12% acrylamide gels and subsequently Blue Coomassie stained (A) or transferred to anitrocellulose membrane and probed with mouse sera. Three representative Western blot images show the immunoreactivity of control (B), KC(C) or KPC (D) serum. Immunoreactive protein spots were determined for each serum by superimposition of immunoblot signal pattern with thespot pattern of the corresponding Blue Coomassie stained gel using the “ProFinder 2D” software. Numbered circles indicate immunoreactiveproteins specifically recognized by KC and KPC sera and identified by MALDI-TOF MS. Immunoreactive protein names are listed in Additionalfile 1: Table S1.
Capello et al. Journal of Hematology & Oncology 2013, 6:67 Page 5 of 12http://www.jhoonline.org/content/6/1/67

(ANXA1); nuclear proteins: Far upstream element bindingprotein 2 (FUBP2) and Heterogeneous nuclear ribonu-cleoprotein L (hnRNPL) and a multifunctional protein:Programmed Cell Death-6 Interacting protein (PDC6I).The frequency of IgG to these proteins ranged between 0and 44% for control mice, and between 25 and 100% forGEM sera (Figure 2A-B). Even the intensity of the reactivity
of IgG to the identified proteins was significantly higher inGEM compared to matched controls (Figure 2A-B); 2DEWB performed with serum serial dilution displayed ahigher titer of autoantibodies to these specific proteins inGEM compared to controls (data not shown). All anti-gens, and particularly EZR, VCL, VIM, PDC6I, hnRNPLand ANXA2 induced a specific antibody response in KC
Figure 2 Individual KC and KPC serum reactivity against the identified antigens. The intensity of reactivity of each control Cre, KC (A) andKPC (B) serum against each MALDI-TOF MS identified protein is represented as a gray gradient scale of color as described in the legend. Thevolume (Vol) of each immunoreactive spot was calculated after background subtraction with the image analysis software “ProFinder 2D” andreported as arbitrary units (AU). For proteins represented from more than one spot the volume was expressed as mean AU value.
Capello et al. Journal of Hematology & Oncology 2013, 6:67 Page 6 of 12http://www.jhoonline.org/content/6/1/67

and KPC already at 1 to 3 months of age (Figure 2A-B),when the tumor stage was limited to early PanIN(Additional file 1: Figure S1B and E).
Human studiesSerological proteome analysis in human PDACTo validate in PDAC patients the autoantibody signatureidentified in GEM, sera from 120 PDAC patients, 40healthy subjects (HS), 50 non-PDAC tumor patients (non-PDAC), 46 chronic pancreatitis (CP) and 12 autoimmunedisease (AD) patients, previously screened against α-enolase (ENOA) isoforms [9], were compared for reactiv-ity against whole protein extracts of the CF-PAC-1 humanPDAC cell line, resolved by 2DE. Only six antigens (EZR,ANXA2, VCL, hnRNPL, ANXA1 and PDC6I), representedby 12 spots, induced specific IgG in PDAC patients like inGEM with a frequency from 19% to 56% (Additional file1: Figure S2 and Table S2 and Table 3).IgG to these common antigens were not only present
in advanced PDAC patients (n = 82), but also in thegroup of stage II and III resectable patients who under-went surgery with curative intent (n = 38). In this set ofpatients, there was a statistically significant frequencyof autoantibodies against common antigens, with theexception of PDC6I, compared to controls; in parti-cular, EZR and ANXA2 were recognized by 68 and 63%of resectable PDAC patients, respectively (Figure 3A).Moreover, for eight surgically-treated patients withstage IIA/IIB PDAC the antigen immunoreactivity wasnot only confirmed on the CF-PAC-1 cell lysate, butalso on the autologous tumoral biopsy 2DE map(Figure 3B).
Cross-sectional clinical study: detection of anti-EzrinautoantibodiesEZR was the antigen recognized at the highest frequen-cies by sera from both GEM at early stages of the diseaseand resectable PDAC patients, and its identification waslater proved through 2DE WB in K8484, CF-PAC-1 cellsand PDAC tissues (Additional file 1: Figure 1). This ana-lysis confirmed the presence of different EZR isoformsboth in murine and human PDAC, likely due to differentpost-translational modifications (e.g. phosphorylation).Moreover, to approach the issue through a method-
ology with a wider clinical employment, we set up anELISA test to validate 2DE WB results. The ability ofsera from advanced (n = 30) and resectable (n = 39)PDAC patients (Table 1) to react against human re-combinant EZR was compared to that of sera from HS(n = 45), non-PDAC tumor (n = 28; 8 breast, 8 colon, 12lung cancer), CP (n = 37) and AD patients (n = 12).PDAC sera displayed specific reactivity to EZR protein(P < 0.0001, Figure 4A), but not to ANXA2, another pro-tein recognized with a high frequency by resectablePDAC patients in 2DE WB (data not shown). The ELISAapproach also confirmed the presence of autoantibodiesagainst EZR in both KC and KPC, where there was a sig-nificant increase of autoantibody levels against recom-binant EZR compared to control mice (data not shown).
Prospective pre-clinical study: validation of anti-EzrinautoantibodiesTo investigate the occurrence of autoantibodies to EZRseveral months before PDAC diagnosis, we took advan-tage of the serum specimens from the European Prospect-ive Investigation into Cancer and Nutrition (EPIC) cohort
Table 3 Frequencies of sera reactivity against protein spots in analyzed groups
Spot no.a Protein PDAC non-PDAC CP AD HS
(N = 120) (N = 50) (N = 46) (N = 12) (N = 40)
1-4 VCL 31% 0% 9% 0% 5%
P < 0.0001 P = 0.0024 P = 0.0193 P = 0.0005
5 PDC6I 21% 0 (0%) 7% 0% 3%
P < 0.0001 P = 0.0361 P = 0.1221 P = 0.0033
6-9 EZR 56% 12% 2% 17% 10%
P < 0.0001 P < 0.0001 P = 0.0135 P < 0.0001
10 hnRNPL 35% 4% 12% 0% 5%
P < 0.0001 P = 0.0006 P = 0.0039 P < 0.0001
11 ANXA1 19% 0% 2% 0% 0%
P = 0.0003 P = 0.0053 P = 0.2198 P = 0.0012
12 ANXA2 53% 8% 28% 0% 10%
P < 0.0001 P = 0.0052 P = 0.0003 P < 0.0001aReactive protein spots numbered as shown in Additional file 1: Figure S2. Frequencies are expressed as percentage of positive sera; Fisher’s test was performedbetween PDAC and each control group, P-values < 0.05 were considered statistically significant.
Capello et al. Journal of Hematology & Oncology 2013, 6:67 Page 7 of 12http://www.jhoonline.org/content/6/1/67

where blood samples were collected from healthy volun-teers monitored longitudinally for cancer or other diseasesdevelopment over the years. Sixteen prediagnostic PDACpatient specimens, with a time span to diagnosis of 5–117.1 mo (mean, 61.2 mo), and thirty-two matched con-trols from the Turin EPIC cohort were used for this study.Controls were matched for age, sex, and date of enrollment(Table 2). Notably, the level of autoantibodies to EZR wassignificantly higher in prediagnostic PDAC serum samplescompared to matched controls (P = 0.0002), showing asimilar trend of reactivity in both newly diagnosed andprediagnostic PDAC sera (Figure 4B). Detailed time lag todiagnosis and ELISA values for each PDAC patient of theEPIC cohort are shown in Additional file 1: Table S3.
Analysis of diagnostic performance and clinicalcorrelationsThese ELISA results prompted us to use ROC analysis toassess the diagnostic performance of EZR-autoantibodydetection. The analysis performed, using OD obtained inELISA as a continuous variable, showed the greatestdiscriminating power between PDAC patients (n = 69) andbenign controls (HS, CP and AD patients, n = 94) at acut-off level of 0.1183 (sensitivity 93.2%, specificity 75.5%,AUC 0.90 ± 0.03; Figure 4C). With reference to the samecut-off, the ELISA test was also very efficient in dis-criminating between PDAC patients and patients withnon-PDAC malignancies, with 94.9% sensitivity, 96.4%specificity, and an AUC of 0.99 ± 0.01 (data not shown).Thus we dichotomized the EZR-autoantibody variables intopositive and negative according to the above-mentionedcut-off level (0.1183) for all subsequent analyses.Dichotomized EZR-autoantibody levels did not show
any correlation with clinical parameters (age, gender,
stage at diagnosis, ECOG PS). However, mean andmedian OD values were significantly (P = 0.030) higherin PDAC patients who had undergone radical surgery(see also ROC analysis in Additional file 1: Figure S4,right panel).We have previously demonstrated that autoantibodies
to ENOA1,2, two phosphorylated isoforms of ENOA, use-fully complement the diagnostic performance of CA19.9serum levels [9,16]. Thus, we tested by CART analysis thediagnostic performance of EZR-autoantibodies in con-comitance with the above biomarkers: CA19.9 (using themost relevant clinical laboratory cut-off value of 37 IU/ml)and ENOA1,2-autoantibodies, in the cohort of sampleswhere all three parameters were available (PDAC patients:n = 45; HS, AD, CP: n = 48) (Figure 4D). Using thisapproach, the first node that significantly discrimina-ted PDAC patients from benign controls was CA19.9 (P <0.001). EZR-autoantibodies significantly refined CA19.9diagnostic performance, particularly in CA19.9-negativecases (P < 0.0001). Finally, in the few cases in whichCA19.9 and EZR-autoantibodies yielded conflicting re-sults (i.e. CA19.9 negative/EZR-autoantibodies posi-tive), ENOA1,2-autoantibodies significantly improveddiagnostic performance (P = 0.0022). Since only onecontrol subject in our cohort displayed high CA19.9serum levels, CART analysis could not further classifyCA19.9 positive cases. However, among CA19.9 positivecases only one PDAC patient and the above mentionedcontrol subject resulted negative for EZR-autoantibodies,and they were again properly classified by ENOA1,2-auto-antibodies. Based on these findings, a diagnostic algorithmwhich assigned patients to the PDAC group when bothEZR-autoantibodies and CA19.9 were positive, and sepa-rated discordant cases into PDAC or controls based on
Figure 3 Antigen validation in resectable PDAC patients. (A) The graph shows the frequency of autoantibodies against mouse and humancommon immunoreactive antigens in the group of resectable patients who underwent surgery with curative intent (n = 38), analyzed by SERPAagainst CF-PAC-1 cell line 2DE map. P-values were calculated vs. control frequencies listed in Table 3 by Fisher's exact test (** P < 0.005). (B)Proteins were extracted from eight frozen PDAC tissues from surgically-treated patients (stage IIA and IIB), separated by 2DE, transferred to anitrocellulose membrane and probed with the autologous serum. A representative Western blot is shown; circles indicate the presence ofautoantibodies against the mouse and human common immunoreactive antigens.
Capello et al. Journal of Hematology & Oncology 2013, 6:67 Page 8 of 12http://www.jhoonline.org/content/6/1/67
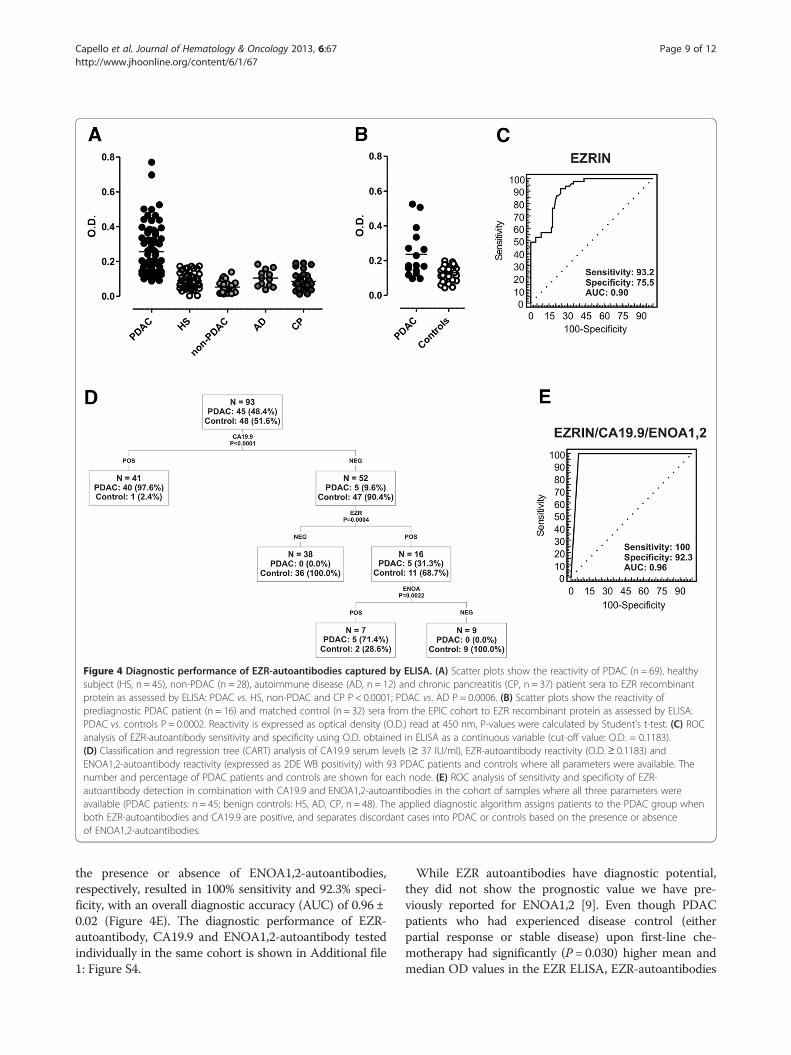
the presence or absence of ENOA1,2-autoantibodies,respectively, resulted in 100% sensitivity and 92.3% speci-ficity, with an overall diagnostic accuracy (AUC) of 0.96 ±0.02 (Figure 4E). The diagnostic performance of EZR-autoantibody, CA19.9 and ENOA1,2-autoantibody testedindividually in the same cohort is shown in Additional file1: Figure S4.
While EZR autoantibodies have diagnostic potential,they did not show the prognostic value we have pre-viously reported for ENOA1,2 [9]. Even though PDACpatients who had experienced disease control (eitherpartial response or stable disease) upon first-line che-motherapy had significantly (P = 0.030) higher mean andmedian OD values in the EZR ELISA, EZR-autoantibodies
Figure 4 Diagnostic performance of EZR-autoantibodies captured by ELISA. (A) Scatter plots show the reactivity of PDAC (n = 69), healthysubject (HS, n = 45), non-PDAC (n = 28), autoimmune disease (AD, n = 12) and chronic pancreatitis (CP, n = 37) patient sera to EZR recombinantprotein as assessed by ELISA: PDAC vs. HS, non-PDAC and CP P < 0.0001; PDAC vs. AD P = 0.0006. (B) Scatter plots show the reactivity ofprediagnostic PDAC patient (n = 16) and matched control (n = 32) sera from the EPIC cohort to EZR recombinant protein as assessed by ELISA:PDAC vs. controls P = 0.0002. Reactivity is expressed as optical density (O.D.) read at 450 nm, P-values were calculated by Student's t-test. (C) ROCanalysis of EZR-autoantibody sensitivity and specificity using O.D. obtained in ELISA as a continuous variable (cut-off value: O.D. = 0.1183).(D) Classification and regression tree (CART) analysis of CA19.9 serum levels (≥ 37 IU/ml), EZR-autoantibody reactivity (O.D.≥ 0.1183) andENOA1,2-autoantibody reactivity (expressed as 2DE WB positivity) with 93 PDAC patients and controls where all parameters were available. Thenumber and percentage of PDAC patients and controls are shown for each node. (E) ROC analysis of sensitivity and specificity of EZR-autoantibody detection in combination with CA19.9 and ENOA1,2-autoantibodies in the cohort of samples where all three parameters wereavailable (PDAC patients: n = 45; benign controls: HS, AD, CP, n = 48). The applied diagnostic algorithm assigns patients to the PDAC group whenboth EZR-autoantibodies and CA19.9 are positive, and separates discordant cases into PDAC or controls based on the presence or absenceof ENOA1,2-autoantibodies.
Capello et al. Journal of Hematology & Oncology 2013, 6:67 Page 9 of 12http://www.jhoonline.org/content/6/1/67

analyzed as a continuous variable had no significantimpact on survival (PFS or OS), either following surgerywith radical intent or first-line chemotherapy. This dem-onstrates the power of the SERPA approach, combinedwith ELISA, to identify antigens that could serve distinctfunctions in an armament of tools for the diagnosis andprognosis of PDAC.
DiscussionThis study identifies autoantibodies to EZR as earlymarkers in mouse and human PDAC. Of clinical rele-vance, we also show that EZR-autoantibodies efficientlycomplement the diagnostic performance of CA19.9.To identify early immune response markers we applied
SERological Proteome Analysis (SERPA) in KC and KPCmice spontaneously developing PDAC. As GEM can besampled at defined stages of tumor development andunder controlled breeding conditions, greater standardi-zation is possible when using mouse models as opposedto human studies. GEM allowed us to identify EZR-autoantibodies as early biomarkers in PDAC, sinceprecociously detected in their serum when the diseasestage was limited to PanIN. Through this approach, wealso identified additional antigens (VCL, PDC6I, FUBP2,hnRNPL, VIM, K2C8, ANXA1 e ANXA2) recognized athigh frequencies by both KC and KPC sera.Reactivity against some of these antigens was present
in control mice, but the intensity of WB recognition wasmuch greater in GEM. A clear example is representedby EZR, faintly recognized by a number of control micebut strongly evident in all KPC. Despite the fact thatauto-reactive lymphocytes should have been removedfrom the repertoire before maturation into naïve B cells,a large number of circulating IgG+ memory B cells pro-duce low affinity antibodies to self-antigens [17,18]. Thehumoral response against these self-antigens is stronglyincreased in tumor conditions, as demonstrated in thiswork both in humans and in mice (Figure 1, Table 3 andFigure 4). Some differences in the pattern of recognitionwere present between mice of the same age, probablydue to the molecular heterogeneity of tumor progressionin this model that fully recapitulates the genetic andmolecular features of human PDAC [12]. Importantly,all the identified antigens, except for FUBP2 andANXA1, induced a powerful humoral response not onlyin KPC but also in KC bearing PanIN lesions, indicatingthat the antibody response to these TAAs is alreadyoccurring when Kras is the only genetic alteration in thetumor, independently of p53 mutation, which is a laterevent in PDAC development. This reflects previousstudies reporting how the immune response to TAAs inhumans occurs at an early stage during tumorigenesis,as illustrated by the detection of high titers of autoanti-bodies, as early as 5 years before disease onset [19,20].
By comparing the 2DE WB reactivity of GEM withthat of a large cohort of PDAC patients and controls, sixproteins, namely: EZR, ANXA2, VCL, hnRNPL, ANXA1and PDC6I were common to both human and mousesignatures. EZR and ANXA2 were recognized by mostPDAC patients who underwent surgery with curative in-tent. ELISA confirmed the diagnostic value of anti-EZRbut not anti-ANXA2 autoantibodies, which were alsopresent in control groups. Other studies have indeedreported the presence of autoantibodies against ANXA2in systemic autoimmune diseases and lung cancer, aswell as pancreatic cancer [21-23], suggesting that thehumoral response to ANXA2 is not specific for PDACtransformation.EZR is a member of the ezrin-radixin-moesin (ERM)
family and a link between a number of growth factorreceptors/adhesion molecules and the actin cytoskeleton. Itis localized to the cytoplasm as an inactive form. Uponthreonine and tyrosine phosphorylation, EZR is transportedto the cell membrane whereupon it tethers F-actin [24]. Itworks downstream of cell-surface receptors throughthe activation of Rho and PI3K/Akt signaling pathways[25,26], and in physiological conditions, EZR is requiredfor macropinocytosis, cell adhesion, and membraneruffling in epithelial cells, whereas in tumor cells it is animportant metastatic regulator [27]. EZR is overexpressedin many cancers, including PDAC, even in PanIN lesions[28-30], and it interacts with cortactin to form podosomalrosettes in PDAC cells, which may play an important rolein tumor invasion [31]. These observations support theimmunogenicity of EZR that we observed in the presentstudy, even if it is not clear how TAAs overcome self-tolerance and thus become autoantibody targets in cancerpatients, as many of those discovered so far are intracellu-lar proteins [4,32,33]. Interestingly, EZR has been identi-fied both in exosomes secreted by mesothelioma cells [34]and as a substrate of matrix metalloproteinases able togenerate neo-epitopes from self-antigens [35].The most important observation of our study is that
autoantibodies against EZR were present also in pre-diagnostic PDAC samples from the prospective EPICcohort that were collected several months or yearsbefore PDAC diagnosis. The EPIC study recruited overhalf a million healthy volunteers in ten European coun-tries, including Italy, monitored longitudinally for canceror other disease development [36]. Since it has been esti-mated that the elapsed time between PDAC initiation tometastatic spread is at least 10 years [37], our resultsstrongly support the hypothesis that EZR-autoantibodydevelopment is an early event in PDAC. Notably, pre-diagnostic patients with the highest levels of EZR-autoantibody in the ELISA test were the ones with anintermediate time lag to diagnosis (69.3 and 56.9 mo,Additional file 1: Table S3). This observation supports the
Capello et al. Journal of Hematology & Oncology 2013, 6:67 Page 10 of 12http://www.jhoonline.org/content/6/1/67
hypothesis that autoantibody levels decrease closer todiagnosis due to immune complex formation [20].Although EZR-autoantibody testing has displayed a
high diagnostic performance, especially in resectablePDAC patients (Additional file 1: Figure S4), a singleTAA may lack adequate sensitivity and specificity, andthe combination of a panel of autoantibodies and sero-logical markers can improve the overall accuracy of adiagnostic assay for cancer detection. We thereforeassessed the diagnostic performance of combined dicho-tomized EZR-autoantibody levels, CA19.9, the onlyPDAC marker currently in clinical use, and ENOA1,2-autoantibodies. We have previously demonstrated thatautoantibodies against Ser-419-phosphorylated ENOAisoforms (ENOA1,2) complement the performance ofCA.19.9 [9]. Interestingly, a diagnostic algorithm separ-ating CA19.9 and EZR-autoantibodies discordant casesinto PDAC or controls based on the presence or absenceof ENOA1,2-autoantibodies respectively, resulted in anoverall diagnostic accuracy of 0.96. Notably, the algorithmhere applied is more stringent than the one previously de-scribed by our group [9], where tested cases were assignedto the PDAC group when either ENOA1,2-autoantibodiesor CA19.9 were positive, as their values were inverselycorrelated. This finding is of real translational relevance,since CA19.9 is the only biomarker with demonstratedclinical value for therapeutic monitoring and detection ofrecurrent PDAC, but its use as a screening tool has provedunsuccessful until now [3].Further validation studies, performed in a large and in-
dependent patient cohort, are warranted to establish thediagnostic performance of this multiplexed analysis and ofthe identified TAA panel tested alone or in combination.
Additional file
Additional file 1: Figure S1. Survival curve and histological progressionof KC and KPC. Table S1. Identification of proteins recognized by GEMsera using MALDI-TOF MS. Table S2. Identification of proteins recognizedby PDAC patient sera using MALDI-TOF MS. Figure S2. Immunoreactivityof PDAC patient and control sera against CF-PAC-1 cell line 2DE map.Figure S3. Validation of EZR identification by Western blot analysis.Table S3. Time span to diagnosis and EZR-autoantibody ELISA values ofPDAC patients from the EPIC cohort. Figure S4. ROC analysis ofindividually evaluated EZR-autoantibody, dichotomized CA19.9 serumlevel and ENOA1,2-autoantibody.
Abbreviations2DE: Two dimensional electrophoresis; AD: Autoimmune disease;ANXA1: Annexin A1; ANXA2: Annexin A2; AU: Arbitrary units; AUC: Areaunder the curve; CART: Classification and regression tree; CP: Chronicpancreatitis; ECOG PS: Eastern cooperative oncology group performancestatus; ELISA: Enzyme-linked immunosorbent assay; ENOA: α-enolase;EPIC: European Prospective Investigation into Cancer and Nutrition;ERM: Ezrin-radixin-moesin; EZR: Ezrin; FUBP2: Far upstream element bindingprotein 2; GEM: Genetically engineered mice; hnRNPL: Heterogeneousnuclear ribonucleoprotein L; HRP: Horseradish peroxidase; HS: Healthysubject; K2C8: Cytokeratin-8; KC: LSL-KrasG12D/+, Pdx-1-Cre mice; KPC: LSL-KrasG12D/+, LSL-Trp53R172H/+, Pdx-1-Cre mice; MALDI-TOF: Matrix-assisted laser
desorption ionization-time of flight; MS: Mass spectrometry; non-PDAC:Non-pancreatic cancer; NP: Normal pancreas; OD: Optical density;PanIN: Pancreatic intraepithelial neoplasia; PDAC: Pancreatic ductaladenocarcinoma; PDC6I: Programmed cell death-6 interacting protein;Pdx-1: Pancreatic duodenum homeobox 1; ROC: Receiver operating curve;SEREX: Serological analysis of tumor antigens by recombinant cDNAexpression cloning; SERPA: Serological proteome analysis; TAA: Tumor-associated antigen; VCL: Vinculin; VIM: Vimentin; WB: Western blot.
Competing interestsFN, MC, and PC are inventors of an Italian patent application No:TO2012A000523 entitled “Kit for in vitro diagnosis and predispositionassessment of pancreatic ductal adenocarcinoma”. Potential investigatorconflict of interest has been disclosed to study participants.
Authors’ contributionsMC designed the study, performed human SERPA and ELISA experiments,analyzed the data and wrote the manuscript; PC designed the study,coordinated and performed GEM breeding, murine sample collection andanalyzed data; FCL performed murine SERPA studies and GEM serumcollection; MG contributed to GEM breeding and analyzed data;RC performed GEM histological and immunohistochemical analysis; ISperformed statistical analysis; GM performed mass spectrometry analysis;SB and SB performed human histological and immunohistochemical analysis;SB performed microarray analysis; AN, PN, PS, AS, CB and MM recruitedpatients and contributed to experimental design and analysis of data;AN, CS and PV provided samples from the Turin EPIC cohort and analyzeddata; FN supervised the project and wrote the manuscript. All authors readand approved the final manuscript.
AcknowledgementsThis work was supported in part by grants from: the European Community,Seventh Framework Program European Pancreatic Cancer-Tumor-Microenvironment Network (EPC-TM-Net, no. 256974); Associazione ItalianaRicerca sul Cancro (AIRC) 5 × 1000 (no. 12182) and IG (no. 5548 and 11643);Ministero della Salute: Progetto Integrato Oncologia; Regione Piemonte:Ricerca Industriale e Sviluppo Precompetitivo (BIOPRO and ONCOPROT),Ricerca Industriale “Converging Technologies” (BIOTHER), Progetti strategicisu tematiche di interesse regionale o sovra regionale (IMMONC), RicercaSanitaria Finalizzata, Ricerca Sanitaria Applicata; Ministero dell’Istruzione edella Ricerca (MIUR), Progetti di Rilevante Interesse Nazionale (PRIN 2009);University of Turin-Progetti di Ateneo 2011: Mechanisms of REsistance toanti-angiogenesis regimens THErapy (grant Rethe-ORTO11RKTW). MC isrecipient of a fellowship from the Fondazione Italiana Ricerca sulCancro (FIRC).We thank Drs. Marianne Murphy, John Iliffe and Radhika Srinivasan forcritically reading the manuscript.
Author details1Center for Experimental Research and Medical Studies (CeRMS), AziendaOspedaliera Città della Salute e della Scienza di Torino, Turin, Italy.2Department of Molecular Biotechnology and Life Sciences, University ofTorino, Turin, Italy. 3Division of Biostatistics, Regina Elena National CancerInstitute, Rome, Italy. 4Centro Oncologico Ematologico Subalpino (COES),Azienda Ospedaliera Città della Salute e della Scienza di Torino, Turin, Italy.5Gastroenterology Unit, Ordine Mauriziano Hospital, Turin, Italy. 6HumanGenetics Foundation, HuGeF, Turin, Italy. 7Unit of Cancer Epidemiology,University of Turin and Center for Cancer Epidemiology and Prevention (CPOPiemonte), Turin, Italy. 8ARC-NET Research Center, University of Verona,Verona, Italy. 9Department of Pathology and Diagnostics, University ofVerona, Verona, Italy. 10Department of Surgery and Oncology, University ofVerona, Verona, Italy. 11Division of Immunology, Regina Elena NationalCancer Institute, Rome, Italy. 12Epigenetics Unit, Department of Surgery andCancer, Imperial College, London, UK. 13Division of Medical Oncology, ReginaElena National Cancer Institute, Rome, Italy.
Received: 17 July 2013 Accepted: 20 August 2013Published: 6 September 2013
References1. Hidalgo M: Pancreatic cancer. N Engl J Med 2010, 362:1605–1617.
Capello et al. Journal of Hematology & Oncology 2013, 6:67 Page 11 of 12http://www.jhoonline.org/content/6/1/67

2. Jemal A, Siegel R, Xu J, Ward E: Cancer statistics, 2010. CA Cancer J Clin2010, 60:277–300.
3. Duffy MJ, Sturgeon C, Lamerz R, Haglund C, Holubec VL, Klapdor R, NicoliniA, Topolcan O, Heinemann V: Tumor markers in pancreatic cancer: aEuropean Group on Tumor Markers (EGTM) status report. Ann Oncol2010, 21:441–447.
4. Tan HT, Low J, Lim SG, Chung MC: Serum autoantibodies as biomarkersfor early cancer detection. FEBS J 2009, 276:6880–6904.
5. Hanash S: Harnessing immunity for cancer marker discovery.Nat Biotechnol 2003, 21:37–38.
6. Tomaino B, Cappello P, Capello M, Fredolini C, Ponzetto A, Novarino A,Ciuffreda L, Bertetto O, De Angelis C, Gaia E, et al: Autoantibody signaturein human ductal pancreatic adenocarcinoma. J Proteome Res 2007,6:4025–4031.
7. Cappello P, Tomaino B, Chiarle R, Ceruti P, Novarino A, Castagnoli C,Migliorini P, Perconti G, Giallongo A, Milella M, et al: An integrated humoraland cellular response is elicited in pancreatic cancer by alpha-enolase, anovel pancreatic ductal adenocarcinoma-associated antigen. Int J Cancer2009, 125:639–648.
8. Capello M, Ferri-Borgogno S, Cappello P, Novelli F: alpha-Enolase: apromising therapeutic and diagnostic tumor target. FEBS J 2011,278:1064–1074.
9. Tomaino B, Cappello P, Capello M, Fredolini C, Sperduti I, Migliorini P,Salacone P, Novarino A, Giacobino A, Ciuffreda L, et al: Circulatingautoantibodies to phosphorylated alpha-enolase are a hallmark ofpancreatic cancer. J Proteome Res 2011, 10:105–112.
10. Leach SD: Mouse models of pancreatic cancer: the fur is finally flying!Cancer Cell 2004, 5:7–11.
11. Hingorani SR, Petricoin EF, Maitra A, Rajapakse V, King C, Jacobetz MA, RossS, Conrads TP, Veenstra TD, Hitt BA, et al: Preinvasive and invasive ductalpancreatic cancer and its early detection in the mouse. Cancer Cell 2003,4:437–450.
12. Hingorani SR, Wang L, Multani AS, Combs C, Deramaudt TB, Hruban RH,Rustgi AK, Chang S, Tuveson DA: Trp53R172H and KrasG12D cooperate topromote chromosomal instability and widely metastatic pancreaticductal adenocarcinoma in mice. Cancer Cell 2005, 7:469–483.
13. Riboli E, Hunt KJ, Slimani N, Ferrari P, Norat T, Fahey M, Charrondiere UR,Hemon B, Casagrande C, Vignat J, et al: European ProspectiveInvestigation into Cancer and Nutrition (EPIC): study populations anddata collection. Public Health Nutr 2002, 5:1113–1124.
14. Chuang SC, Stolzenberg-Solomon R, Ueland PM, Vollset SE, Midttun O,Olsen A, Tjonneland A, Overvad K, Boutron-Ruault MC, Morois S, et al:A U-shaped relationship between plasma folate and pancreatic cancerrisk in the European Prospective Investigation into Cancer and Nutrition.Eur J Cancer 2011, 47:1808–1816.
15. Barbero G, Carta F, Giribaldi G, Mandili G, Crobu S, Ceruti C, Fontana D,Destefanis P, Turrini F: Protein/RNA coextraction and small two-dimensional polyacrylamide gel electrophoresis for proteomic/geneexpression analysis of renal cancer biopsies. Anal Biochem 2006,349:62–71.
16. Zhou W, Capello M, Fredolini C, Piemonti L, Liotta LA, Novelli F, Petricoin EF:Mass spectrometry analysis of the post-translational modifications ofalpha-enolase from pancreatic ductal adenocarcinoma cells. J ProteomeRes 2010, 9:2929–2936.
17. Wardemann H, Yurasov S, Schaefer A, Young JW, Meffre E, Nussenzweig MC:Predominant autoantibody production by early human B cell precursors.Science 2003, 301:1374–1377.
18. Tiller T, Tsuiji M, Yurasov S, Velinzon K, Nussenzweig MC, Wardemann H:Autoreactivity in human IgG +memory B cells. Immunity 2007,26:205–213.
19. Disis ML, Pupa SM, Gralow JR, Dittadi R, Menard S, Cheever MA: High-titerHER-2/neu protein-specific antibody can be detected in patients withearly-stage breast cancer. J Clin Oncol 1997, 15:3363–3367.
20. Ladd JJ, Chao T, Johnson MM, Qiu J, Chin A, Israel R, Pitteri SJ, Mao J, Wu M,Amon LM, et al: Autoantibody signatures involving glycolysis andsplicesome proteins precede a diagnosis of breast cancer amongpostmenopausal women. Cancer Res 2013, 73:1502–1513.
21. Salle V, Maziere JC, Smail A, Cevallos R, Maziere C, Fuentes V, Tramier B,Makdassi R, Choukroun G, Vittecoq O, et al: Anti-annexin II antibodies insystemic autoimmune diseases and antiphospholipid syndrome. J ClinImmunol 2008, 28:291–297.
22. Brichory FM, Misek DE, Yim AM, Krause MC, Giordano TJ, Beer DG, HanashSM: An immune response manifested by the common occurrence ofannexins I and II autoantibodies and high circulating levels of IL-6 inlung cancer. Proc Natl Acad Sci USA 2001, 98:9824–9829.
23. Zheng L, Foley K, Huang L, Leubner A, Mo G, Olino K, Edil BH, Mizuma M,Sharma R, Le DT, et al: Tyrosine 23 phosphorylation-dependent cell-surface localization of annexin A2 is required for invasion andmetastases of pancreatic cancer. PLoS One 2011, 6:e19390.
24. Fehon RG, McClatchey AI, Bretscher A: Organizing the cell cortex: the roleof ERM proteins. Nat Rev Mol Cell Biol 2010, 11:276–287.
25. Hunter KW: Ezrin, a key component in tumor metastasis. Trends Mol Med2004, 10:201–204.
26. Chen Q, Zhang XH, Massague J: Macrophage binding to receptor VCAM-1transmits survival signals in breast cancer cells that invade the lungs.Cancer Cell 2011, 20:538–549.
27. Niggli V, Rossy J: Ezrin/radixin/moesin: versatile controllers of signalingmolecules and of the cortical cytoskeleton. Int J Biochem Cell Biol 2008,40:344–349.
28. Torer N, Kayaselcuk F, Nursal TZ, Yildirim S, Tarim A, Noyan T, Karakayali H:Adhesion molecules as prognostic markers in pancreaticadenocarcinoma. J Surg Oncol 2007, 96:419–423.
29. Abiatari I, Esposito I, Oliveira TD, Felix K, Xin H, Penzel R, Giese T, Friess H,Kleeff J: Moesin-dependent cytoskeleton remodelling is associated withan anaplastic phenotype of pancreatic cancer. J Cell Mol Med 2010,14:1166–1179.
30. Meng Y, Lu Z, Yu S, Zhang Q, Ma Y, Chen J: Ezrin promotes invasion andmetastasis of pancreatic cancer cells. J Transl Med 2010, 8:61.
31. Kocher HM, Sandle J, Mirza TA, Li NF, Hart IR: Ezrin interacts with cortactinto form podosomal rosettes in pancreatic cancer cells. Gut 2009,58:271–284.
32. Zinkernagel RM: What is missing in immunology to understandimmunity? Nat Immunol 2000, 1:181–185.
33. Guo K, Li J, Tang JP, Tan CP, Hong CW, Al-Aidaroos AQ, Varghese L, HuangC, Zeng Q: Targeting intracellular oncoproteins with antibody therapy orvaccination. Sci Transl Med 2011, 3:99ra85.
34. Hegmans JP, Bard MP, Hemmes A, Luider TM, Kleijmeer MJ, Prins JB,Zitvogel L, Burgers SA, Hoogsteden HC, Lambrecht BN: Proteomic analysisof exosomes secreted by human mesothelioma cells. Am J Pathol 2004,164:1807–1815.
35. Cauwe B, Martens E, Proost P, Opdenakker G: Multidimensionaldegradomics identifies systemic autoantigens and intracellular matrixproteins as novel gelatinase B/MMP-9 substrates. Integr Biol (Camb) 2009,1:404–426.
36. Bingham S, Riboli E: Diet and cancer–the European ProspectiveInvestigation into Cancer and Nutrition. Nat Rev Cancer 2004, 4:206–215.
37. Costello E, Neoptolemos JP: Pancreatic cancer in 2010: new insights forearly intervention and detection. Nat Rev Gastroenterol Hepatol 2011,8:71–73.
doi:10.1186/1756-8722-6-67Cite this article as: Capello et al.: Autoantibodies to Ezrin are an earlysign of pancreatic cancer in humans and in genetically engineeredmouse models. Journal of Hematology & Oncology 2013 6:67.
Submit your next manuscript to BioMed Centraland take full advantage of:
• Convenient online submission
• Thorough peer review
• No space constraints or color figure charges
• Immediate publication on acceptance
• Inclusion in PubMed, CAS, Scopus and Google Scholar
• Research which is freely available for redistribution
Submit your manuscript at www.biomedcentral.com/submit
Capello et al. Journal of Hematology & Oncology 2013, 6:67 Page 12 of 12http://www.jhoonline.org/content/6/1/67