journal of engineering and technology techno...
TRANSCRIPT
International Journal of Engineering and Technology Volume 5 No. 4,April, 2015
ISSN: 2049-3444 © 2015– IJET Publications UK. All rights reserved. 225
Techno-Economic Assessment of Large-Scale Aero-Derivative Industrial Gas
Turbines Combined-Heat-And-Power
Barinyima Nkoi, Pericles Pilidis and Theoklis Nikolaidis Department of Power and Propulsion, Energy and Power Division, School of Engineering, Cranfield University, Cranfield, Bedfordshire, MK43
0AL, United Kingdom
ABSTRACT
The aim of this paper is to assess and compare techno-economic viability of large-scale simple cycle (SC) and advanced cycles aero-
derivative industrial gas turbines combined-heat-and-power (ADIGT-CHP) generation in the petrochemical industry in terms of net
present value (NPV), internal rate of return (IRR), and simple-payback-period (SPBP). To achieve this, a techno-economic
assessment method was applied using a case study of a large-scale Refinery CHP. Parameters of technical performance of the
ADIGT-CHP such as fuel flow, power output, emissions, heat recovery, and steam flow, in conjunction with various cost elements
were made inputs in an economic module utilising a 20 years life-cycle. Economic principles were applied to predict the NPV, IRR,
and SPBP of the three ADIGT-CHP cycles over conventional case (Grid electricity plus on-site boiler). The advanced cycles
considered are intercooled (IC) cycle and intercooled-recuperated (ICR) cycle. The result shows that all three ADIGT–CHP cycles
exhibit positive NPV, good payback-period and internal-rate-of-return, which is an indication that all are viable, though the SC
ADIGT–CHP was found to be more profitable than the others. The percentage savings in operational cost of SC, IC, and ICR cycle
ADIGT–CHP over the conventional case were obtained as 21.1%, 20.5%, and 19.7% respectively. More so, SC ADIGT–CHP was
found to exhibit higher CHP efficiency and steam flow than IC and ICR cycles. This sort of assessment would aid decision makers to
make good choice of large-scale ADIGT-CHP cycle option in the petrochemical industry.
Keywords: Aero-Derivative-Gas-Turbines, Combined-Heat-And-Power, Techno-Economic Assessment, Intercooled-Recuperated-Cycle, Net-
Present-Value, Simple-Payback-Period
NOMENCLATURE
Abbreviation Description
ADIGT Aero-derivative industrial gas turbines
CHP Combined-heat-and-power
CO Carbon mono-oxide
CO2 Carbon(iv) oxide
Conv Conventional case
DECC Department of Energy and climate change
DLE Dry Low Emission
DP Design point
EI Emission index
GT Gas turbine
H2O Water vapour
HEPHAESTUS Gas turbine engine emissions prediction code
HRSG Heat recovery steam generator
ICR Intercooled-recuperated
IC Intercooled
IRR Internal rate of return
ISA SLS International standard atmosphere sea level static
LRCP Large-scale Refinery and Chemical plant
N/A Not available
NOX Oxides of Nitrogen
NPV Net present value
OD Off design point
O&M Operation and maintenance
Ref Reference
RoI Return on investment
SC Simple cycle (base engine)
SPBP Simple-payback-period
TERA Techno-economic and environmental risk analysis
TURBOMATCH Gas turbine engine performance code
International Journal of Engineering and Technology (IJET) – Volume 5 No. 4, April, 2015
ISSN: 2049-3444 © 2015– IJET Publications UK. All rights reserved. 226
Symbol Description Unit
CLr Equal annual loan repayment £
C Investment capital cost £
CBh Cost of boiler heat £
Ce Avoided cost of electricity by CHP £
Cemtx Emission tax £
Cf Cost of fuel for CHP £
Cg Investment grant £
CGe Cost of Grid electricity £
Ch Avoided cost of heat by CHP £
Co/m Cost of operation and maintenance of plant minus fuel cost £
d Constant market discount rate %
dt Variable market discount rate in time period t %
F0 Present worth of investment capital cost £
Ft Annual net cash flow for year t £
ft Annual operation savings £
FF Fuel flow in combustor kg/s
L Loan £
N Life of CHP plant years
Re Revenue from excess electricity sold from CHP £
Rh Revenue from excess heat sold from CHP £
r Interest rate on loan %
rT Tax rate on income due to CHP %
SVN Salvage value of the investment at the end of the economic life N £
Tt Taxable income in year t, due to CHP £
→ Implies
> Greater than
< Less than
= Equal to
1. INTRODUCTION
Techno-economic and environmental risk analysis (TERA)
framework is a multi-disciplinary decision-making tool used
in preliminary design analysis to assess the viability of power
plants. This kind of assessment is herein extended to large-
scale aero-derivative industrial gas turbines combined-heat-
and-power (ADIGT-CHP) in the petrochemical industry,
which are employed to generate both power and process
steam from single fuel source. How would one make the
choice of large-scale ADIGT-CHP cycle option in the
petrochemical industry that would produce good return on
investment (RoI), considering technical and economic
benefits? This is a question that an asset manager or product
developer would ask when faced with the challenge of
making choice of large-scale ADIGT-CHP cycle option.
Explanation has been rendered of the emergence and
application of TERA framework as having been conceived as
a result of research work carried out in areas of multi-
disciplinary optimization and management, and after-come on
the environment, of both the design and operation, of power
plants. The use of TERA was demonstrated in jet engine
modeling and management to optimize the thrust, weight and
geometry scaling [1]. Furthermore, a research was carried out
on technical risk analysis of gas turbines to select gas turbine
plant equipment for liquefaction of natural gas in which the
risk assessment aspect of TERA was focused upon with
respect to machine downtime identified as an empirical
measure of technical risk [2].
The aim of this paper is to assess and compare techno-
economic viability of large-scale simple (base engine),
intercooled, and intercooled-recuperated cycles ADIGT-CHP
in the petrochemical industry in terms of net present value
(NPV), internal rate of return (IRR), and simple payback
period (SPBP), over conventional case. The conventional
case is made of grid electricity plus on-site boiler. This is
done to provide a framework that would aid sound choice of
large-scale ADIGT-CHP cycle option in the petrochemical
industry that would produce good return on investment (RoI).
2. THEORY AND METHOD
2.1. Techno-economic and environmental risk
analysis (TERA) modules
TERA is a modular framework that integrates the following
modules: engine performance module, emission and
environment module, economic and risk modules [1].
2.1.1. Engine performance module
Engine technical performance module involves the
application of TURBOMATCH code in the preliminary
design point (DP) and off-design (OD) performance analysis
of the various aero-derivative gas turbine engine cycles. Also,
it was implemented in the ADIGT-CHP DP and OD
performance evaluation. The outputs of these technical
performances are made inputs to the emissions, and economic
modules. Detail description of TURBOMATCH code was

International Journal of Engineering and Technology (IJET) – Volume 5 No. 4, April, 2015
ISSN: 2049-3444 © 2015– IJET Publications UK. All rights reserved. 227
presented by the authors in ref [3] as gas turbine engine
performance prediction code developed at Cranfield
University, UK and validated.
The cycle thermal efficiency, fuel flow, power, etc, of the
engines, are essential performance parameters that are obtained
as desired results of the simulation. Heat recovery steam
generators (HRSG) of the ADIGT-CHP are also modelled in
TURBOMATCH to determine steam flows.
2.1.2. Engine emissions module
This module calculates the total amount of emissions
produced as products of combustion that occur in the engine
over the range of design point and off-design performance.
These combustion products include oxides of nitrogen (NOx),
carbon monoxide (CO), carbon (iv) oxide (CO2), and water
vapour (H2O), which constitute bulk of pollutants to the
environment.
A code called HEPHAESTUS – adapted for industrial gas
turbines has been developed at Cranfield University, UK and
validated to perform the engine emissions and environment
module [4] [5]. The scheme simulates a single annular
combustor, and introduces a technology factor so that it can
calibrate the amounts of engine emissions to standards that
apply to different technology combustors. Emission indices of
the gaseous products at different power settings and ambient
temperatures, and the total quantity of each emission per day
are calculated.
Emission index of a gaseous product of combustion is defined
as the ratio of the amount of product in grams to the amount
of fuel consumed in kilograms. For instance, emission index
of NOx denoted by EINOx is given by Equation 2.1-1
EINOX =g of NOX
kg of fuel
Equation
2.1-1
Similarly EICO, EICO2, and EIH2O are calculated. These
quantities are computed and translated into annual total emissions
based on the amount of fuel consumed [6].
2.1.3. Economic module
A method of this module was developed and applied in this
work. This module takes inputs from the outputs of engine
performance, and emissions modules, and applies economic
principles with appropriate cost elements. Economic return
drives investment in any new equipment, ADIGT-CHP not an
exception. TERA tool is useful in predicting the future and
reducing the risk of investing in new equipment. For a CHP
generation scheme to be adjudged worthwhile it has to be
profitable than the base load case assessment. The base load
case is defined as the use of boiler to satisfy required steam
demand of a site while the site power demand is met by
purchasing grid electricity [7].
The Department of Energy and Climate Change (DECC), UK
outlines some parameters used in the economic appraisal of
CHP schemes as: simple payback period (SPBP), net present
value (NPV), and internal rate of return (IRR) [8]. These
capabilities are captured as contents of the economic method
developed in this work. A discounting technique based on
NPV method is presented to allow an initial assessment of the
likelihood of various engine cycles being attractive in a specific
situation of CHP application, over the conventional case.
2.1.3.1. Net present value
The difference between the present worth of all expenses and
the present worth of all revenues during the life cycle of a CHP is
termed net present value (NPV) [9]. It includes savings, and is
the present worth of the total net cash flow of the CHP
investment. It is calculated using Equation 2.1-2 or Equation
2.1-3
NPV = −F0 + ∑Ft
(1 + dt)t
N
t=0
Equation
2.1-2
Or
NPV = −F0 + ∑Ft
(1 + d)t
N
t=0
Equation
2.1-3
Where
dt = the market interest rate or market discount rate during the
period t, and when it is considered constant dt = d.
N = the period in time for which the CHP is assumed to operate
(the life of the CHP plant). Time period in years is usually used,
though day, month, six-month, could be used.
Ft = net cash flow in year t (revenue + savings – expenses).
The term “net cash flow” here could be negative, which indicates
loss in year t.
F0 = the present worth of the investment (at time = 0), and it is
negative. It is equal to the capital cost.
There are three possible solutions:
NPV > 0; → return on investment (RoI) > d; → economically
viable investment, given condition (N, d)
NPV = 0; → return on investment (RoI) = d; → economically
viable investment, given condition (N, d)
NPV < 0; → return on investment (RoI) < d; → investment is not
economically viable under the given specification (N, d) [9].
2.1.3.2. Algorithm for computing the net present value of
CHP
I. Iinitial cash flow (F0, t = 0): This is given by Equation 2.1-4
𝐅𝟎 = Cg + L + C Equation 2.1-4
Where, C = investment cash at hand, Cg = investment grant, L =
loan
F0 may comprise of only Cg or L or C, and it is the capital cost of
CHP installation.
II. Net Cash Flow for N Years (Ft, t = 1 to N)
Annual operation savings ft: This is given by Equation 2.1-5
ft = (Ce + Re + Ch + Rh - CGe – CBh – CLr - Cf -
Co/m - Cemtx)
Equation
2.1-5
International Journal of Engineering and Technology (IJET) – Volume 5 No. 4, April, 2015
ISSN: 2049-3444 © 2015– IJET Publications UK. All rights reserved. 228
Where, Ce = avoided cost of electricity = cost of electricity
that would be purchased from the grid, if not cogenerated.
Re = revenue from selling excess electricity, if any.
Ch = avoided cost of heat, i.e. cost of heat that, if not cogenerated,
would be produced by boiler(s).
Rh = revenue from selling excess steam, if any.
CGe = cost of electricity purchased from the grid during
outages of on-site generation.
CLr = Equal annual loan repayment
CBh = cost of heat produced by boiler(s) during outages of CHP.
Cf = cost of fuel for the cogeneration plant.
Co/m = operation and maintenance cost (except fuel) of the
cogeneration plant.
Cemtx = emission tax = emission tariff x total gaseous emissions
Subscript t = the year (t = 1, 2,…, N) during which project
lasted.
Assumptions:
The operation of the plant starts from the beginning of the
first year, t = 1.
Construction period is assumed as year t = 0 which takes
capital cost F0
A life-cycle period of 20 years is chosen, (that is N = 20).
Annual net cash flow (Ft): This is given by Equation
2.1-6
Ft = ft — rT Tt + SVN, for (t = 1, 2, ..., N) Equation
2.1-6
Where
Ft = net cash flow in year t,
ft = operation saving in year t,
rT = tax rate,
Tt = taxable income in year t, due to cogeneration,
SVN = salvage value of the investment at the end of the
economic life cycle, that is at the end of year N.
Assumptions:
Operation savings is main target for the CHP, thus Tt =
0
Assuming the scenario that savage value is used
completely for disposal of plant as scrap.
III. NPV Calculation
Then applying Equation 2.1-3
NPV = −F0 + ∑Ft
(1+d)tNt=1 where 0 ≤ NPV ≥ 0
Assumptions:
Total life-cycle of CHP plant (N) = 20 years
Discount rate (d) = constant = 10%
Electricity tariffs escalation rate = 5%
Heat tariffs escalation rate = 5%
Fuel price escalation rate = 5%
Operation & maintenance cost escalation rate = 3%
Emission tax escalation rate = 3%
Interest on loan = 5%
Loan repayment period = 10 years
Loan holiday = 2 years
Availability of on-site generation plant ~ 95%
The flow chart outlining the computation sequence of NPV is
shown in
2.1.4. Internal rate of return
Internal rate of return is the discount rate that results in an
NPV value of zero. This implies that IRR is the discount rate
that makes the net present worth of future cash flows equal
the CHP capital investment cost. An iterative method
employing Equation 2.1-7 is used to determine IRR.
Internal rate of return, IRR = d, for NPV = 0 [9];
→ 0 = −F0 + ∑Ft
(1+IRR)tNt=1 Equation 2.1-7
2.1.5. Simple-payback- period
Simple-payback-period (SPBP) is the length of time usually
in years taken to recover the initial investment capital of
implementing the CHP scheme based on the annual savings
realised. SPBP is computed using annual running cost of
CHP operation [10]. Equation 2.1-8 is used to calculate
SPBP.
SPBP (in years) =Capital investment cost of CHP
Annual savings from CHP over conventional case
Equation
2.1-8
Where,
Capital investment cost of CHP = total installation cost of the
CHP plant, and
Annual savings = (conventional base case annual total
running cost) – (CHP case annual
total running cost)
= (conventional base case annual total cost of
energy, operation and maintenance) – (CHP case
annual total cost of energy, operation and
maintenance).
2.1.6. Loan repayment
Equal annual loan repayment was calculated using Equation
2.1-9 [11], given an interest rate of 5%, and loan duration of
10 years.
→ CLr = (L ∗ r) [1 − (1 + r)−N]⁄ Equation
2.1-9
Where r = interest rate. CLr, L, and N are as defined in section
2.1.3.2

International Journal of Engineering and Technology (IJET) – Volume 5 No. 4, April, 2015
ISSN: 2049-3444 © 2015– IJET Publications UK. All rights reserved. 229
Figure 2.1-1 Flow chart for NPV computation
NPV > 0
NPV = 0 NPV < 0
Loan, L
revenue excess electricity, Re
Investment cost, C
Initial cash flow 𝐹0
𝐹0 = 𝐶𝑔 + 𝐿 + 𝐶
avoided cost of electricity, Ce
Annual net cash flow 𝐹𝑡, (t = 1,…,N)
Ft = (C
e + R
e + C
h – C
Ge – C
Bh –CLr-Cf
- Co/m
)
Cost of Grid electricity, CGe
cost of boiler heat, CBh
cost of fuel, Cf
operation & maintenance cost, Co/m
avoided cost of heat, Ch
𝑁𝑃𝑉 = −𝐹0 + ∑𝐹𝑡
(1 + 𝑑)𝑡
𝑁
𝑡=1
Period in years, N
𝐼𝑠 𝑁𝑃𝑉 <, >, 𝑜𝑟 = 0? Economically viable
Economically viable
Not
economically
viable
Investment grant, 𝐶𝑔
Discount rate, d
IRR < d

International Journal of Engineering and Technology (IJET) – Volume 5 No. 4, April, 2015
ISSN: 2049-3444 © 2015– IJET Publications UK. All rights reserved. 230
3. ANALYSIS AND RESULTS: CASE STUDY
OF LARGE-SCALE REFINERY AND
CHEMICAL PLANT (LRCP) CHP
3.1. Energy demand of LRCP
The implementation of the ADIGT-CHP techno-economic
analysis was done by examining typical case studies. With no
particular interest one of such case studies is a Large-scale
Refinery and Chemical plant CHP (LRCP-CHP) in the United
Kingdom which has an installed capacity of 295MW and 2 x
250 tonnes/hour of steam [12]. This gives a total of
500tonnes/hour of steam = 47.61 x 500 = 23804.51kWth
(because 1tonne/hour of steam = 47.61kWth).
The annual electricity and steam demand of the LRCP were
computed and are as shown in
Table 3-1 below. It is worth noting that the process plant
consumes energy at approximately constant rate, due to
routine plant operation. It was assumed that the power plant
has an availability of about 95%.
Table 3-1 Energy demand of LRCP
Month Hours of
power plant
operation
Power
consumption
demand from
power plant
(kWhe)
Excess power
exported to
grid (kWhe)
Grid electricity
during plant
outages (kWhe)
Steam
consumption
demand from CHP
(kWhth)
Excess steam
exported (kWhth)
Boiler steam
during CHP
outages (kWhth)
Jan 693 204435000 45172477 14160000 16496525 15739666 1142616
Feb 692 204140000 45107293 1475000 16472721 15716954 119023
Mar 694 204730000 32958199 13865000 16520330 15647239 1118812
April 693 204435000 32910709 7670000 16496525 15624692 618917
May 694 204730000 21413197 13865000 16520330 15559431 1118812
June 694 204730000 21413197 7375000 16520330 15559431 595113
July 694 204730000 6151720 14160000 16520330 15420841 1142616
Aug 693 204435000 6142856 13570000 16496525 15398621 1095007
Sept 694 204730000 21413197 7375000 16520330 15559431 595113
Oct 695 205025000 33005689 13865000 16544134 15669785 1118812
Nov 693 204435000 32910709 7670000 16496525 15624692 618917
Dec 693 204435000 45172477 14160000 16496525 15739666 1142616
Total 8322 2454990000 343771719 129210000 198101132 187260449 10426375
3.2. Power plant performance
With the nominal capacity energy demand of the LRCP stated
in section 3.1, 3 x 100MW ADIGTs and an additional 1 x
43.85MW ADIGT-CHP of same 50Hz frequency were
considered to supply the demanded power and steam. This
arrangement was made knowing that during hot days (in the
summer) power generation on site may fall below demanded
power. There may be surplus power and steam generated on
site which are exported to the Grid. Conversely during plant
outages electricity is imported from the Grid and steam
produced in a stand-by boiler. The DP performance
evaluation of the engine cycles using TURBOMATCH are
shown in
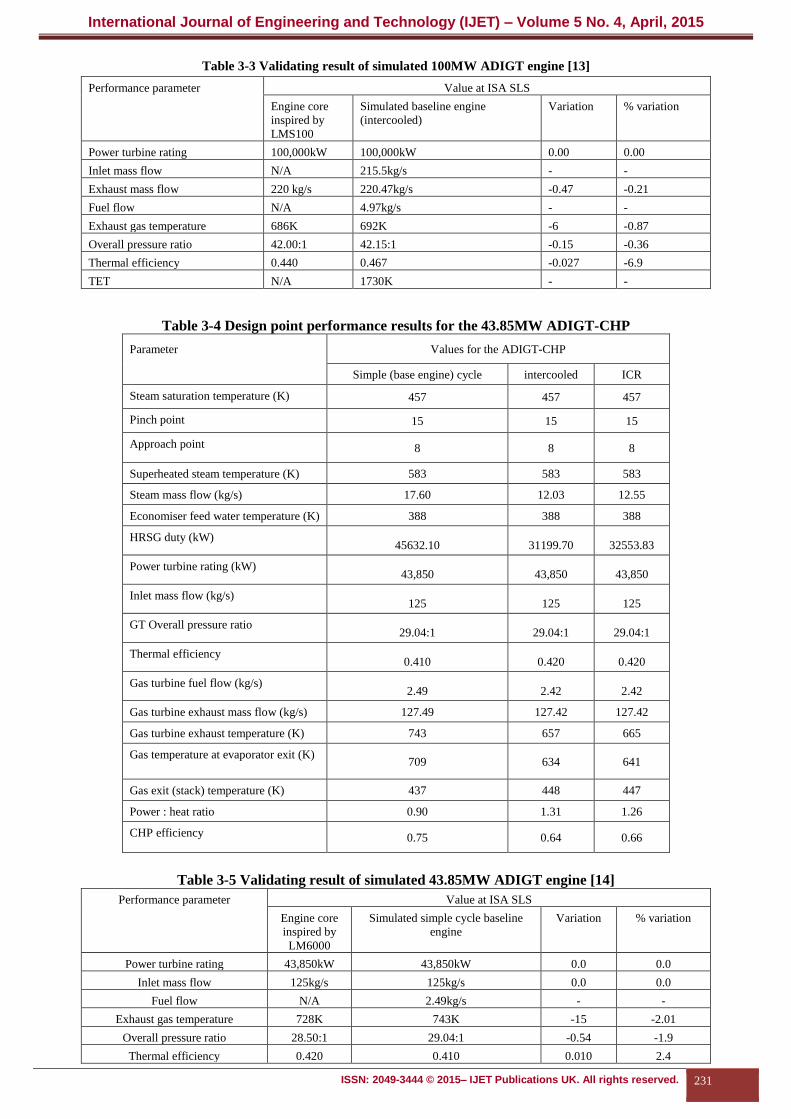
Table 3-2 and Table 3-4, whereas validation of the engines
performances are presented in Table 3-3 and Table 3-5.
Table 3-2 Summary of DP performance results of 100MW ADIGT engines simulation
Performance parameter Value at DP of simulated three-spool large-scale aero-derivative engines
Simple cycle Intercooled ICR
Power turbine rating (kW) 100,000 100,000 100,000
Inlet mass flow (kg/s) 215.5 215.5 215.5
Exhaust mass flow (kg/s) 220.59 220.47 220.54
Fuel flow (kg/s) 5.09 4.97 5.04
Exhaust gas temperature (K) 783 692 690
Overall compression pressure ratio 42.15:1 42.15:1 42.15:1
Thermal efficiency 0.457 0.467 0.460
International Journal of Engineering and Technology (IJET) – Volume 5 No. 4, April, 2015
ISSN: 2049-3444 © 2015– IJET Publications UK. All rights reserved. 231
Table 3-3 Validating result of simulated 100MW ADIGT engine [13]
Performance parameter Value at ISA SLS
Engine core
inspired by
LMS100
Simulated baseline engine
(intercooled)
Variation % variation
Power turbine rating 100,000kW 100,000kW 0.00 0.00
Inlet mass flow N/A 215.5kg/s - -
Exhaust mass flow 220 kg/s 220.47kg/s -0.47 -0.21
Fuel flow N/A 4.97kg/s - -
Exhaust gas temperature 686K 692K -6 -0.87
Overall pressure ratio 42.00:1 42.15:1 -0.15 -0.36
Thermal efficiency 0.440 0.467 -0.027 -6.9
TET N/A 1730K - -
Table 3-4 Design point performance results for the 43.85MW ADIGT-CHP
Parameter Values for the ADIGT-CHP
Simple (base engine) cycle intercooled ICR
Steam saturation temperature (K) 457 457 457
Pinch point 15 15 15
Approach point 8 8 8
Superheated steam temperature (K) 583 583 583
Steam mass flow (kg/s) 17.60 12.03 12.55
Economiser feed water temperature (K) 388 388 388
HRSG duty (kW) 45632.10 31199.70 32553.83
Power turbine rating (kW) 43,850 43,850 43,850
Inlet mass flow (kg/s) 125 125 125
GT Overall pressure ratio 29.04:1 29.04:1 29.04:1
Thermal efficiency 0.410 0.420 0.420
Gas turbine fuel flow (kg/s) 2.49 2.42 2.42
Gas turbine exhaust mass flow (kg/s) 127.49 127.42 127.42
Gas turbine exhaust temperature (K) 743 657 665
Gas temperature at evaporator exit (K) 709 634 641
Gas exit (stack) temperature (K) 437 448 447
Power : heat ratio 0.90 1.31 1.26
CHP efficiency 0.75 0.64 0.66
Table 3-5 Validating result of simulated 43.85MW ADIGT engine [14]
Performance parameter Value at ISA SLS
Engine core
inspired by
LM6000
Simulated simple cycle baseline
engine
Variation % variation
Power turbine rating 43,850kW 43,850kW 0.0 0.0
Inlet mass flow 125kg/s 125kg/s 0.0 0.0
Fuel flow N/A 2.49kg/s - -
Exhaust gas temperature 728K 743K -15 -2.01
Overall pressure ratio 28.50:1 29.04:1 -0.54 -1.9
Thermal efficiency 0.420 0.410 0.010 2.4

International Journal of Engineering and Technology (IJET) – Volume 5 No. 4, April, 2015
ISSN: 2049-3444 © 2015– IJET Publications UK. All rights reserved. 232
TET N/A 1550K - -
3.3. Engines emissions estimation
HEPHAESTUS code was employed to estimate engine
emissions utilising dry low emission technology (DLE), and
DP results are as presented in
Table 3-6 and Table 3-7.
Table 3-6 Design point emissions index for the 100MW engine cycles
Engine
cycle
EINOX
(g/kg fuel)
EICO
(g/kg fuel)
EICO2
(g/kg fuel)
EIH2O
(g/kg fuel)
SC (base engine) 1.97 0.96 51106.39 39755.64
IC 1.94 1.32 51034.23 39746.07
ICR 1.92 1.37 51027.20 39745.00
Table 3-7 Design point emissions index for the 43.85MW engine cycles
Engine
cycle
EINOX
(g/kg fuel)
EICO
(g/kg fuel)
EICO2
(g/kg fuel)
EIH2O
(g/kg fuel)
SC (base engine) 1.20 0.15 51169.05 39805.81
IC 1.17 0.22 51092.53 39796.50
ICR 1.11 0.21 51098.56 39796.90
The total annual emissions of the ADIGTs used in the
economic analysis were computed based on the annual fuel
consumptions.
3.4. Economic analysis of LRCP-CHP
3.4.1. LRCP Conventional case (grid electricity + on-
site boiler)
Assumptions: the following were assumed in addition to
those stated in section 2.1.3.2
I. The Refining and Chemical plant operate throughout the year
implying 8760 hours of electricity purchase from grid and on-
site steam generation in boiler.
II. Two industrial boilers of 23.804MWth capacity each are
installed on site of which one is kept on stand-by.
III. Year (0) is taken as initial installation and site construction
period so that operation on site commences in year (1).
IV. Investment capital is made of Loan
Boiler capital cost = number of boilers × cost per kWth × Boiler capacity (kWth)
= 2 × 80£
kWth
× 23.804kWth = £3,808,722.00
Boiler O&M cost = annual steam consumption (kWhth) × O&M cost per kWhth
= 208527507.6 kWhth × 0.004£
kWhth
= £834,110.03
Boiler fuel cost = annual steam consumption (kWhth) × fuel price perkWhth
= 208527507.6 kWhth × 0.05£
kWhth
= £10,426,375.38
Grid electricity cost = annual electricity consumption (kWhe) × grid electricity tariff per kWhe
= 2584200000 kWhe × 0.095£
kWhe = £245,499,000
Boiler emission cost = annual heat consumption (kWhth) × emission tax per kWhth
= 208527507.6 kWhth × 0.0015£
kWhth
= £312,791.26
Year 1 annual operation cost = £834,110.03 + £10,426,375.38 + £245,499,000 + £312,791.26 = £256,238,167.00
Present value of year 1 annual operation cost = £232,943,788.00, utilising the formula Ft
(1+d)t
3.4.1.1. Conventional case life-cycle cash flow
Applying the escalation rates of prices (costs) to the life-cycle as spelled out in section 2.1.3.2, the life-cycle cash flow of the
conventional case was computed and result is as shown in Table 3-9

International Journal of Engineering and Technology (IJET) – Volume 5 No. 4, April, 2015
ISSN: 2049-3444 © 2015– IJET Publications UK. All rights reserved. 233
Table 3-8 Conventional case economic analysis of LRCP (Grid electricity + Boiler)
3.4.2. LRCP- CHP cases
The CHP economic analysis is implemented for both the simple and advanced cycle large-scale ADIGT-CHP, and results compared.
The set of power plant is as described in section 1.1. The following assumption was made in conjunction to those stated in sections
2.1.3.2 and 3.4.1 (i), (iii), and (iv): One industrial boiler of 23.804MWth capacity is installed on site to be kept on stand-by and
brought on stream during CHP outages.
3.4.2.1. Simple cycle SC ADIGT-CHP case
Initial cash flow is the sum of installation costs of three 100MWe ADIGTs, one 43.85MWe ADIGT (with a set of HRSG), and one
23.805MWth boiler.
Initial cash flow F0 = (3 × 100MW GT + 1 × 43.85MW GT) × capital cost per kW + cost of 1 boiler
Initial cash flow = (3 × 100000kW + 1 × 43850kW) ×850£
kW+ 23805kW × 80 £/kW
Initial cash flow F0 = £294,176,861.00
3.4.2.1.1. Year 1 annual net cash flow
Annual Operation & maintenance cost Co/m = total annual energy generated (kWh) × O&M cost per kWh
= (annual electricity generated (kWhe) + annual steam generated (kWht)) × O&M cost per kWh
= (2452900930.05 + 345860788.6 + 385361581.30 + 10426375.38)kWh × 0.006£/kWh = £19146445.30
Annual GT fuel cost Cf = total annual power generated (kWh) × fuel price per kWh
= (2452900930.05 + 345860788.6)kWh × 0.05£/kWh = £139938085.93
Annual grid electricity cost during outages of CHP CGe
= annual grid electricity consumption (kWhe) × electricity tariff per kWhe
= 129210000kWhe × 0.095£/kWhe = £12,274,950
Annual boiler heat cost during outages of CHP Cbh = annual heat generated in boiler(kWht) × gas oil price per kWht
= 10426375.38kWht × 0.05£/kWht = £521318.77
Annual emission tax Cemtx = (annual total emissions)(kg) × emission tax rate per kg
= (20873157972.16)kg × 0.0025£/kg = £52182894.93
Electricity price £/kWh : 0.095 interest rate( %): 5
Boiler O & M cost £/kWh: 0.004 Grid electricity /annum kWh: 2584200000 Loan duration(yrs): 10
Boiler capital cost £/kW: 80 Hours of operation/annum: 8760 Loan (£) 260046888.24
Boiler capital cost £: 3808721.6 Boiler gas fuel price £/kWh: 0.05 Repayment Holiday 2 yrs
emissions tax £ /kWh : 0.0015 10% Discount rate (d) : 0.1
End of
year (t)
Boiler O & M cost, -
Co/m (3%
escalation rate)
(£)
Grid electricity
cost, -CGe (5%
escalation rate)
(£)
Boiler fuel cost, -
Ch (5%
escalation
rate)(£)
Boiler
emission cost -
Cbemtx (3%
escalation rate)
(£)
Annual Loan
repayment, CLr
(£)
Annual cost (£) Present value
(10% discount
rate) (£)
1 834110.03 245499000.00 10426375.38 312791.26 0.00 256238166.64 232943787.86
2 859133.33 257773950.00 10947694.15 322175.00 0.00 269043819.15 222350263.76
3 884907.33 270662647.50 11495078.86 331840.25 33677261.73 316166828.34 237540817.68
4 911454.55 284195779.88 12069832.80 341795.46 33677261.73 330284669.86 225588873.62
5 938798.19 298405568.87 12673324.44 352049.32 33677261.73 345108204.36 214285042.85
6 966962.13 313325847.31 13306990.66 362610.80 33677261.73 360672710.51 203590342.36
7 995971.00 328992139.68 13972340.19 373489.12 33677261.73 377015230.73 193468426.35
8 1025850.13 345441746.66 14670957.20 384693.80 33677261.73 394174659.40 183885387.70
9 1056625.63 362713833.99 15404505.06 396234.61 33677261.73 412191835.40 174809575.71
10 1088324.40 380849525.69 16174730.32 408121.65 33677261.73 431109639.39 166211428.48
11 1120974.13 399892001.98 16983466.83 420365.30 33677261.73 450973095.84 158063318.92
12 1154603.36 419886602.08 17832640.17 432976.26 33677261.73 471829480.24 150339413.11
13 1189241.46 440880932.18 18724272.18 445965.55 0.00 460051169.91 133260436.78
14 1224918.70 462924978.79 19660485.79 459344.51 0.00 483044809.10 127200795.47
15 1261666.26 486071227.73 20643510.08 473124.85 0.00 507187862.66 121416741.86
16 1299516.25 510374789.12 21675685.59 487318.59 0.00 532537793.30 115895739.73
17 1338501.74 535893528.57 22759469.87 501938.15 0.00 559154936.59 110625823.29
18 1378656.79 562688205.00 23897443.36 516996.30 0.00 587102644.66 105595571.22
19 1420016.49 590822615.25 25092315.53 532506.18 0.00 616447436.96 100794081.87
20 1462616.99 620363746.01 26346931.30 548481.37 0.00 647259158.69 96210949.62
∑ 22412848.88 8117658666.31 344758049.77 8404818.33 336772617.33 8807594151.74 3274076818.23
International Journal of Engineering and Technology (IJET) – Volume 5 No. 4, April, 2015
ISSN: 2049-3444 © 2015– IJET Publications UK. All rights reserved. 234
Annual saved electricity cost Ce = annual electricity consumption from CHP (kWhe) × electricity tariff per kWhe
= 2454990000 kWhe × 0.095£/kWhe = £233224050
Annual saved heat cost Ch = annual heat consumption from CHP(kWht) × gas oil price per kWht
= 198101132.2 kWht × 0.05£/kWht = £9905056.61
Annual revenue from excess electricity exported to grid Re
= annual electricity exported (kWhe) × electricity tariff per kWhe
= 343771718.65 kWhe × 0.05£/kWhe = £17188585.93
Annual revenue from excess steam exported Rh = annual steam exported (kWht) × gas oil price per kWht
= 187260449.08 kWht ×0.025£
kWht= £4681511.23
Year 1 annual net cash flow F1 = Ce+Ch + Re + Rh-C0/m- Cf − Cbh − CGe − Cemtx
= 233224050 + 9905056.61 + 17188585.93 + 4681511.23 − 19146445.30 − 139938085.93 − 12,274,950 − 521,318.77
− 52182894.93
= £40,935,509.00
Present value of year 1 annual net cash flow =F1
(1 + d)1
Present value of year 1 annual net cash flow =40,935,509.00
(1 + 0.1)1
Present value of year 1 annual net cash flow = £37,214,099.00
3.4.2.1.2. Simple cycle ADIGT-CHP case life-cycle cash flow
Applying the escalation rates of prices (costs) to the life-cycle as spelled out in section 2.1.3.2, the life-cycle cash flow of the simple
cycle CHP case was computed and result is as shown in Table 3-9.
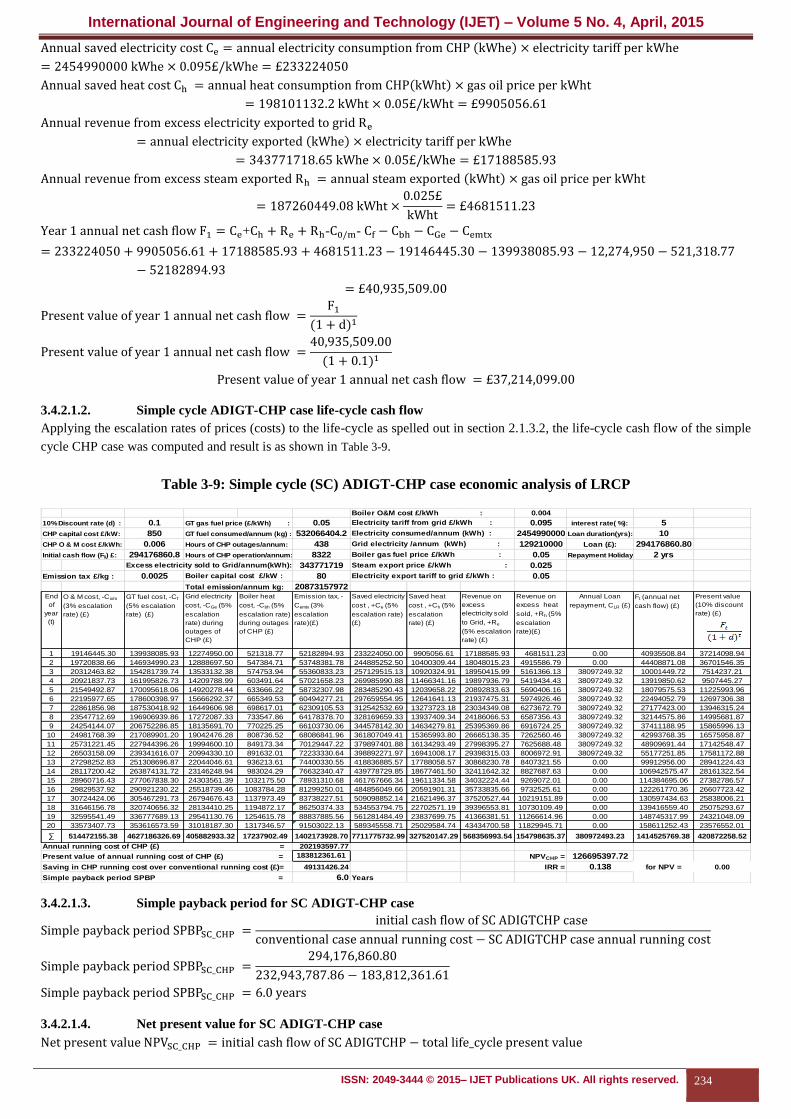
Table 3-9: Simple cycle (SC) ADIGT-CHP case economic analysis of LRCP
3.4.2.1.3. Simple payback period for SC ADIGT-CHP case
Simple payback period SPBPSC_CHP =initial cash flow of SC ADIGTCHP case
conventional case annual running cost − SC ADIGTCHP case annual running cost
Simple payback period SPBPSC_CHP =294,176,860.80
232,943,787.86 − 183,812,361.61
Simple payback period SPBPSC_CHP = 6.0 years
3.4.2.1.4. Net present value for SC ADIGT-CHP case
Net present value NPVSC_CHP = initial cash flow of SC ADIGTCHP − total life_cycle present value
Boiler O&M cost £/kWh : 0.004
10% Discount rate (d) : 0.1 GT gas fuel price (£/kWh) : 0.05 Electricity tariff from grid £/kWh : 0.095 interest rate( %): 5
CHP capital cost £/kW: 850 GT fuel consumed/annum (kg) : 532066404.2 Electricity consumed/annum (kWh) : 2454990000 Loan duration(yrs): 10
CHP O & M cost £/kWh: 0.006 Hours of CHP outages/annum: 438 Grid electricity /annum (kWh) : 129210000 Loan (£): 294176860.80
Initial cash flow (F0) £: 294176860.8 Hours of CHP operation/annum: 8322 Boiler gas fuel price £/kWh : 0.05 Repayment Holiday 2 yrs
Excess electricity sold to Grid/annum(kWh): 343771719 Steam export price £/kWh : 0.025
Emission tax £/kg : 0.0025 Boiler capital cost £/kW : 80 Electricity export tariff to grid £/kWh : 0.05
Total emission/annum kg: 20873157972End
of
year
(t)
O & M cost, -Co/m
(3% escalation
rate) (£)
GT fuel cost, -Cf
(5% escalation
rate) (£)
Grid electricity
cost, -CGe (5%
escalation
rate) during
outages of
CHP (£)
Boiler heat
cost, -Cbh (5%
escalation rate)
during outages
of CHP (£)
Emission tax, -
Cemtx (3%
escalation
rate)(£)
Saved electricity
cost , +Ce (5%
escalation rate)
(£)
Saved heat
cost , +Ch (5%
escalation
rate) (£)
Revenue on
excess
electricity sold
to Grid, +Re
(5% escalation
rate) (£)
Revenue on
excess heat
sold, +Rh (5%
escalation
rate)(£)
Annual Loan
repayment, CLR (£)
Ft (annual net
cash flow) (£)
Present value
(10% discount
rate) (£)
1 19146445.30 139938085.93 12274950.00 521318.77 52182894.93 233224050.00 9905056.61 17188585.93 4681511.23 0.00 40935508.84 37214098.94
2 19720838.66 146934990.23 12888697.50 547384.71 53748381.78 244885252.50 10400309.44 18048015.23 4915586.79 0.00 44408871.08 36701546.35
3 20312463.82 154281739.74 13533132.38 574753.94 55360833.23 257129515.13 10920324.91 18950415.99 5161366.13 38097249.32 10001449.72 7514237.21
4 20921837.73 161995826.73 14209788.99 603491.64 57021658.23 269985990.88 11466341.16 19897936.79 5419434.43 38097249.32 13919850.62 9507445.27
5 21549492.87 170095618.06 14920278.44 633666.22 58732307.98 283485290.43 12039658.22 20892833.63 5690406.16 38097249.32 18079575.53 11225993.96
6 22195977.65 178600398.97 15666292.37 665349.53 60494277.21 297659554.95 12641641.13 21937475.31 5974926.46 38097249.32 22494052.79 12697306.38
7 22861856.98 187530418.92 16449606.98 698617.01 62309105.53 312542532.69 13273723.18 23034349.08 6273672.79 38097249.32 27177423.00 13946315.24
8 23547712.69 196906939.86 17272087.33 733547.86 64178378.70 328169659.33 13937409.34 24186066.53 6587356.43 38097249.32 32144575.86 14995681.87
9 24254144.07 206752286.85 18135691.70 770225.25 66103730.06 344578142.30 14634279.81 25395369.86 6916724.25 38097249.32 37411188.95 15865996.13
10 24981768.39 217089901.20 19042476.28 808736.52 68086841.96 361807049.41 15365993.80 26665138.35 7262560.46 38097249.32 42993768.35 16575958.87
11 25731221.45 227944396.26 19994600.10 849173.34 70129447.22 379897401.88 16134293.49 27998395.27 7625688.48 38097249.32 48909691.44 17142548.47
12 26503158.09 239341616.07 20994330.10 891632.01 72233330.64 398892271.97 16941008.17 29398315.03 8006972.91 38097249.32 55177251.85 17581172.88
13 27298252.83 251308696.87 22044046.61 936213.61 74400330.55 418836885.57 17788058.57 30868230.78 8407321.55 0.00 99912956.00 28941224.43
14 28117200.42 263874131.72 23146248.94 983024.29 76632340.47 439778729.85 18677461.50 32411642.32 8827687.63 0.00 106942575.47 28161322.54
15 28960716.43 277067838.30 24303561.39 1032175.50 78931310.68 461767666.34 19611334.58 34032224.44 9269072.01 0.00 114384695.06 27382786.57
16 29829537.92 290921230.22 25518739.46 1083784.28 81299250.01 484856049.66 20591901.31 35733835.66 9732525.61 0.00 122261770.36 26607723.42
17 30724424.06 305467291.73 26794676.43 1137973.49 83738227.51 509098852.14 21621496.37 37520527.44 10219151.89 0.00 130597434.63 25838006.21
18 31646156.78 320740656.32 28134410.25 1194872.17 86250374.33 534553794.75 22702571.19 39396553.81 10730109.49 0.00 139416559.40 25075293.67
19 32595541.49 336777689.13 29541130.76 1254615.78 88837885.56 561281484.49 23837699.75 41366381.51 11266614.96 0.00 148745317.99 24321048.09
20 33573407.73 353616573.59 31018187.30 1317346.57 91503022.13 589345558.71 25029584.74 43434700.58 11829945.71 0.00 158611252.43 23576552.01
∑ 514472155.38 4627186326.69 405882933.32 17237902.49 1402173928.70 7711775732.99 327520147.29 568356993.54 154798635.37 380972493.23 1414525769.38 420872258.52
Annual running cost of CHP (£) = 202193597.77
Present value of annual running cost of CHP (£) = 183812361.61 NPVCHP = 126695397.72
Saving in CHP running cost over conventional running cost (£)= 49131426.24 IRR = 0.138 for NPV = 0.00
Simple payback period SPBP = 6.0 Years
International Journal of Engineering and Technology (IJET) – Volume 5 No. 4, April, 2015
ISSN: 2049-3444 © 2015– IJET Publications UK. All rights reserved. 235
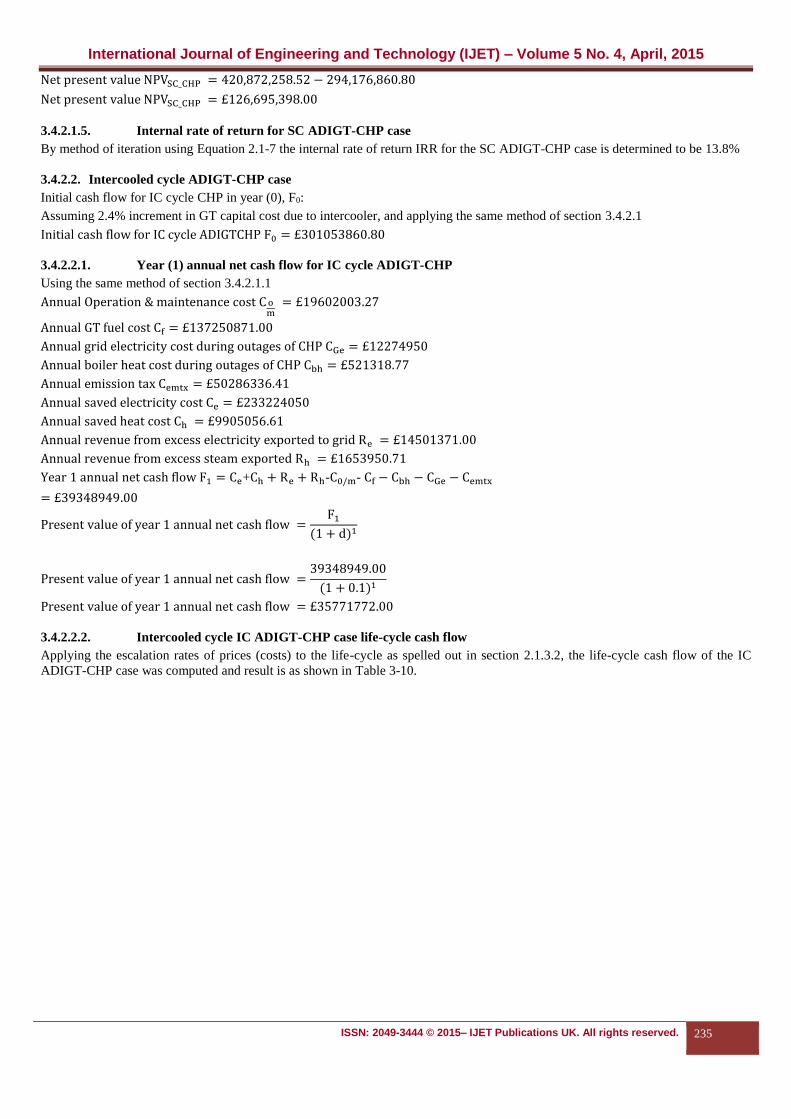
Net present value NPVSC_CHP = 420,872,258.52 − 294,176,860.80
Net present value NPVSC_CHP = £126,695,398.00
3.4.2.1.5. Internal rate of return for SC ADIGT-CHP case
By method of iteration using Equation 2.1-7 the internal rate of return IRR for the SC ADIGT-CHP case is determined to be 13.8%
3.4.2.2. Intercooled cycle ADIGT-CHP case
Initial cash flow for IC cycle CHP in year (0), F0:
Assuming 2.4% increment in GT capital cost due to intercooler, and applying the same method of section 3.4.2.1
Initial cash flow for IC cycle ADIGTCHP F0 = £301053860.80
3.4.2.2.1. Year (1) annual net cash flow for IC cycle ADIGT-CHP
Using the same method of section 3.4.2.1.1
Annual Operation & maintenance cost C om
= £19602003.27
Annual GT fuel cost Cf = £137250871.00
Annual grid electricity cost during outages of CHP CGe = £12274950
Annual boiler heat cost during outages of CHP Cbh = £521318.77
Annual emission tax Cemtx = £50286336.41
Annual saved electricity cost Ce = £233224050
Annual saved heat cost Ch = £9905056.61
Annual revenue from excess electricity exported to grid Re = £14501371.00
Annual revenue from excess steam exported Rh = £1653950.71
Year 1 annual net cash flow F1 = Ce+Ch + Re + Rh-C0/m- Cf − Cbh − CGe − Cemtx
= £39348949.00
Present value of year 1 annual net cash flow =F1
(1 + d)1
Present value of year 1 annual net cash flow =39348949.00
(1 + 0.1)1
Present value of year 1 annual net cash flow = £35771772.00
3.4.2.2.2. Intercooled cycle IC ADIGT-CHP case life-cycle cash flow
Applying the escalation rates of prices (costs) to the life-cycle as spelled out in section 2.1.3.2, the life-cycle cash flow of the IC
ADIGT-CHP case was computed and result is as shown in Table 3-10.
International Journal of Engineering and Technology (IJET) – Volume 5 No. 4, April, 2015
ISSN: 2049-3444 © 2015– IJET Publications UK. All rights reserved. 236
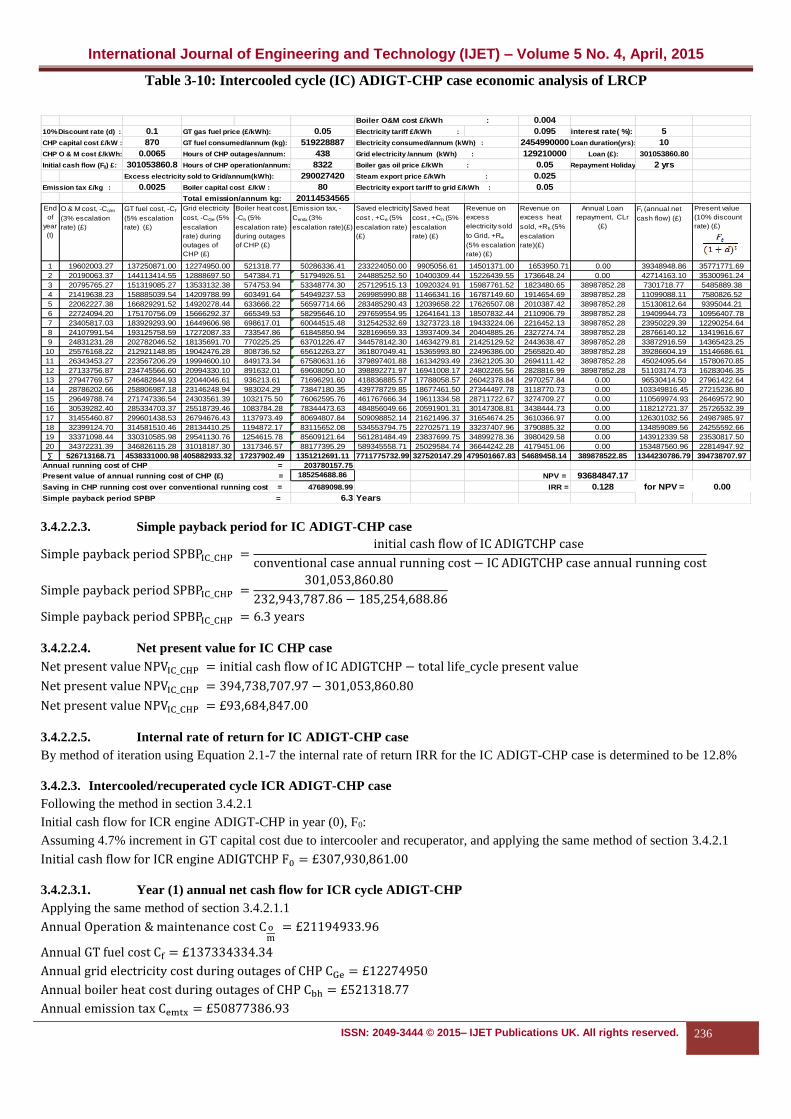
Table 3-10: Intercooled cycle (IC) ADIGT-CHP case economic analysis of LRCP
3.4.2.2.3. Simple payback period for IC ADIGT-CHP case
Simple payback period SPBPIC_CHP =initial cash flow of IC ADIGTCHP case
conventional case annual running cost − IC ADIGTCHP case annual running cost
Simple payback period SPBPIC_CHP =301,053,860.80
232,943,787.86 − 185,254,688.86
Simple payback period SPBPIC_CHP = 6.3 years
3.4.2.2.4. Net present value for IC CHP case
Net present value NPVIC_CHP = initial cash flow of IC ADIGTCHP − total life_cycle present value
Net present value NPVIC_CHP = 394,738,707.97 − 301,053,860.80
Net present value NPVIC_CHP = £93,684,847.00
3.4.2.2.5. Internal rate of return for IC ADIGT-CHP case
By method of iteration using Equation 2.1-7 the internal rate of return IRR for the IC ADIGT-CHP case is determined to be 12.8%
3.4.2.3. Intercooled/recuperated cycle ICR ADIGT-CHP case
Following the method in section 3.4.2.1
Initial cash flow for ICR engine ADIGT-CHP in year (0), F0:
Assuming 4.7% increment in GT capital cost due to intercooler and recuperator, and applying the same method of section 3.4.2.1
Initial cash flow for ICR engine ADIGTCHP F0 = £307,930,861.00
3.4.2.3.1. Year (1) annual net cash flow for ICR cycle ADIGT-CHP
Applying the same method of section 3.4.2.1.1
Annual Operation & maintenance cost C om
= £21194933.96
Annual GT fuel cost Cf = £137334334.34
Annual grid electricity cost during outages of CHP CGe = £12274950
Annual boiler heat cost during outages of CHP Cbh = £521318.77
Annual emission tax Cemtx = £50877386.93
Boiler O&M cost £/kWh : 0.004
10% Discount rate (d) : 0.1 GT gas fuel price (£/kWh): 0.05 Electricity tariff £/kWh : 0.095 interest rate( %): 5
CHP capital cost £/kW : 870 GT fuel consumed/annum (kg): 519228887 Electricity consumed/annum (kWh) : 2454990000 Loan duration(yrs): 10
CHP O & M cost £/kWh: 0.0065 Hours of CHP outages/annum: 438 Grid electricity /annum (kWh) : 129210000 Loan (£): 301053860.80
Initial cash flow (F0) £: 301053860.8 Hours of CHP operation/annum: 8322 Boiler gas oil price £/kWh : 0.05 Repayment Holiday 2 yrs
Excess electricity sold to Grid/annum(kWh): 290027420 Steam export price £/kWh : 0.025
Emission tax £/kg : 0.0025 Boiler capital cost £/kW : 80 Electricity export tariff to grid £/kWh : 0.05
Total emission/annum kg: 20114534565End
of
year
(t)
O & M cost, -Co/m
(3% escalation
rate) (£)
GT fuel cost, -Cf
(5% escalation
rate) (£)
Grid electricity
cost, -CGe (5%
escalation
rate) during
outages of
CHP (£)
Boiler heat cost,
-Ch (5%
escalation rate)
during outages
of CHP (£)
Emission tax, -
Cemtx (3%
escalation rate)(£)
Saved electricity
cost , +Ce (5%
escalation rate)
(£)
Saved heat
cost , +Ch (5%
escalation
rate) (£)
Revenue on
excess
electricity sold
to Grid, +Re
(5% escalation
rate) (£)
Revenue on
excess heat
sold, +Rh (5%
escalation
rate)(£)
Annual Loan
repayment, CLr
(£)
Ft (annual net
cash flow) (£)
Present value
(10% discount
rate) (£)
1 19602003.27 137250871.00 12274950.00 521318.77 50286336.41 233224050.00 9905056.61 14501371.00 1653950.71 0.00 39348948.86 35771771.69
2 20190063.37 144113414.55 12888697.50 547384.71 51794926.51 244885252.50 10400309.44 15226439.55 1736648.24 0.00 42714163.10 35300961.24
3 20795765.27 151319085.27 13533132.38 574753.94 53348774.30 257129515.13 10920324.91 15987761.52 1823480.65 38987852.28 7301718.77 5485889.38
4 21419638.23 158885039.54 14209788.99 603491.64 54949237.53 269985990.88 11466341.16 16787149.60 1914654.69 38987852.28 11099088.11 7580826.52
5 22062227.38 166829291.52 14920278.44 633666.22 56597714.66 283485290.43 12039658.22 17626507.08 2010387.42 38987852.28 15130812.64 9395044.21
6 22724094.20 175170756.09 15666292.37 665349.53 58295646.10 297659554.95 12641641.13 18507832.44 2110906.79 38987852.28 19409944.73 10956407.78
7 23405817.03 183929293.90 16449606.98 698617.01 60044515.48 312542532.69 13273723.18 19433224.06 2216452.13 38987852.28 23950229.39 12290254.64
8 24107991.54 193125758.59 17272087.33 733547.86 61845850.94 328169659.33 13937409.34 20404885.26 2327274.74 38987852.28 28766140.12 13419616.67
9 24831231.28 202782046.52 18135691.70 770225.25 63701226.47 344578142.30 14634279.81 21425129.52 2443638.47 38987852.28 33872916.59 14365423.25
10 25576168.22 212921148.85 19042476.28 808736.52 65612263.27 361807049.41 15365993.80 22496386.00 2565820.40 38987852.28 39286604.19 15146686.61
11 26343453.27 223567206.29 19994600.10 849173.34 67580631.16 379897401.88 16134293.49 23621205.30 2694111.42 38987852.28 45024095.64 15780670.85
12 27133756.87 234745566.60 20994330.10 891632.01 69608050.10 398892271.97 16941008.17 24802265.56 2828816.99 38987852.28 51103174.73 16283046.35
13 27947769.57 246482844.93 22044046.61 936213.61 71696291.60 418836885.57 17788058.57 26042378.84 2970257.84 0.00 96530414.50 27961422.64
14 28786202.66 258806987.18 23146248.94 983024.29 73847180.35 439778729.85 18677461.50 27344497.78 3118770.73 0.00 103349816.45 27215236.80
15 29649788.74 271747336.54 24303561.39 1032175.50 76062595.76 461767666.34 19611334.58 28711722.67 3274709.27 0.00 110569974.93 26469572.90
16 30539282.40 285334703.37 25518739.46 1083784.28 78344473.63 484856049.66 20591901.31 30147308.81 3438444.73 0.00 118212721.37 25726532.39
17 31455460.87 299601438.53 26794676.43 1137973.49 80694807.84 509098852.14 21621496.37 31654674.25 3610366.97 0.00 126301032.56 24987985.97
18 32399124.70 314581510.46 28134410.25 1194872.17 83115652.08 534553794.75 22702571.19 33237407.96 3790885.32 0.00 134859089.56 24255592.66
19 33371098.44 330310585.98 29541130.76 1254615.78 85609121.64 561281484.49 23837699.75 34899278.36 3980429.58 0.00 143912339.58 23530817.50
20 34372231.39 346826115.28 31018187.30 1317346.57 88177395.29 589345558.71 25029584.74 36644242.28 4179451.06 0.00 153487560.96 22814947.92
∑ 526713168.71 4538331000.98 405882933.32 17237902.49 1351212691.11 7711775732.99 327520147.29 479501667.83 54689458.14 389878522.85 1344230786.79 394738707.97
Annual running cost of CHP = 203780157.75
Present value of annual running cost of CHP (£) = 185254688.86 NPV = 93684847.17
Saving in CHP running cost over conventional running cost = 47689098.99 IRR = 0.128 for NPV = 0.00
Simple payback period SPBP = 6.3 Years

International Journal of Engineering and Technology (IJET) – Volume 5 No. 4, April, 2015
ISSN: 2049-3444 © 2015– IJET Publications UK. All rights reserved. 237
Annual saved electricity cost Ce = £233224050
Annual saved heat cost Ch = £9,905,056.61
Annual revenue from excess electricity exported to grid Re = £14584834.34
Annual revenue from excess steam exported Rh = £1927549.04
Year 1 annual net cash flow F1 = Ce+Ch + Re + Rh-C0/m- Cf − Cbh − CGe − Cemtx
= £37,438,566.00
Present value of year 1 annual net cash flow =F1
(1 + d)1
Present value of year 1 annual net cash flow =37438566.00
(1 + 0.1)1
Present value of year 1 annual net cash flow = £34,035,060.00
3.4.2.3.2. Intercooled/recuperated cycle ICR ADIGT-CHP case life-cycle cash flow
Applying the escalation rates of prices (costs) to the life-cycle as spelled out in section 2.1.3.2, the life-cycle cash flow of the ICR
ADIGT-CHP case was computed and result is as shown in Table 3-11.
Table 3-11: Intercooled-recuperated cycle (ICR) ADIGT-CHP case economic analysis of LRCP
Simple payback period for ICR ADIGT-CHP case
Simple payback period SPBPICR_CHP =initial cash flow of ICR ADIGTCHP case
conventional case running cost − ICR ADIGTCHP case running cost
Simple payback period SPBPICR_CHP =307,930,860.80
232,943,787.86 − 186991400.57
Simple payback period SPBPICR_CHP = 6.7 years
3.4.2.3.3. Net present value for ICR ADIGT-CHP case
Net present value NPVICR_CHP = initial cash flow of ICR ADIGTCHP − total life_cycle present value
Net present value NPVICR_CHP = 370,706,298.91 − 307,930,860.80
Net present value NPVICR_CHP = £62,775,438.00
Boiler O&M cost £/kWh : 0.004
10% Discount rate (d) : 0.1 GT gas fuel price (£/kWh) : 0.05 Electricity tariff £/kWh : 0.095 interest rate( %): 5
GT capital cost £/kW : 890 GT fuel consumed/annum (kg) : 525718049.8 Electricity consumed/annum (kWh) : 2454990000 Loan duration(yrs): 10
O & M cost £/kWh: 0.007 Hours of CHP outages/annum: 438 Grid electricity /annum (kWh) : 129210000 Loan (£): 307930860.80
Initial cash flow (F0) £: 307930860.8 Hours of CHP operation/annum: 8322 Boiler gas oil price £/kWh : 0.05 Repayment Holiday 2 yrs
Excess electricity sold to Grid/annum(kWh): 291696687 Steam export price £/kWh : 0.025
Emission tax £/kWh : 0.0025 Boiler capital cost £/kW : 80 Electricity export tariff to grid £/kWh : 0.05
Total emission/annum kg: 20350954771
End of
year
(t)
O & M cost, -
Co/m (3%
escalation
rate) (£)
GT fuel cost, -
Cf (5%
escalation rate)
(£)
Grid
electricity
cost, -CGe
(5%
escalation
rate) during
outages of
CHP (£)
Boiler heat
cost, -Ch (5%
escalation rate)
during outages
of CHP (£)
Emission tax, -
Cemtx (3%
escalation
rate)(£)
Saved
electricity cost
, +Ce (5%
escalation rate)
(£)
Saved heat
cost , +Ch (5%
escalation
rate) (£)
Revenue on
excess
electricity sold
to Grid, +Re
(5% escalation
rate) (£)
Revenue on
excess heat
sold, +Rh
(5%
escalation
rate)(£)
Annual Loan
repayment, CLr
(£)
Ft (annual net
cash flow) (£)
Present value
(10% discount
rate) (£)
1 21194933.96 137334334.34 12274950.00 521318.77 50877386.93 233224050.00 9905056.61 14584834.34 1927549.04 0.00 37438565.99 34035059.99
2 21830781.98 144201051.06 12888697.50 547384.71 52403708.54 244885252.50 10400309.44 15314076.06 2023926.49 0.00 40751940.70 33679289.84
3 22485705.44 151411103.61 13533132.38 574753.94 53975819.79 257129515.13 10920324.91 16079779.86 2125122.81 39878455.25 4395772.30 3302608.79
4 23160276.61 158981658.79 14209788.99 603491.64 55595094.38 269985990.88 11466341.16 16883768.85 2231378.95 39878455.25 8138714.18 5558851.30
5 23855084.90 166930741.73 14920278.44 633666.22 57262947.22 283485290.43 12039658.22 17727957.30 2342947.90 39878455.25 12114680.08 7522263.18
6 24570737.45 175277278.82 15666292.37 665349.53 58980835.63 297659554.95 12641641.13 18614355.16 2460095.30 39878455.25 16336697.48 9221639.83
7 25307859.58 184041142.76 16449606.98 698617.01 60750260.70 312542532.69 13273723.18 19545072.92 2583100.06 39878455.25 20818486.58 10683175.40
8 26067095.36 193243199.90 17272087.33 733547.86 62572768.52 328169659.33 13937409.34 20522326.56 2712255.06 39878455.25 25574496.08 11930691.17
9 26849108.22 202905359.89 18135691.70 770225.25 64449951.58 344578142.30 14634279.81 21548442.89 2847867.82 39878455.25 30619940.92 12985844.02
10 27654581.47 213050627.88 19042476.28 808736.52 66383450.13 361807049.41 15365993.80 22625865.04 2990261.21 39878455.25 35970841.93 13868316.72
11 28484218.91 223703159.28 19994600.10 849173.34 68374953.63 379897401.88 16134293.49 23757158.29 3139774.27 39878455.25 41644067.42 14595991.58
12 29338745.48 234888317.24 20994330.10 891632.01 70426202.24 398892271.97 16941008.17 24945016.20 3296762.98 39878455.25 47657377.00 15185109.00
13 30218907.85 246632733.10 22044046.61 936213.61 72538988.31 418836885.57 17788058.57 26192267.01 3461601.13 0.00 93907922.82 27201780.21
14 31125475.08 258964369.76 23146248.94 983024.29 74715157.96 439778729.85 18677461.50 27501880.36 3634681.19 0.00 100658476.88 26506522.97
15 32059239.33 271912588.25 24303561.39 1032175.50 76956612.69 461767666.34 19611334.58 28876974.38 3816415.25 0.00 107808213.38 25808429.14
16 33021016.51 285508217.66 25518739.46 1083784.28 79265311.07 484856049.66 20591901.31 30320823.10 4007236.01 0.00 115378941.09 25109819.24
17 34011647.01 299783628.54 26794676.43 1137973.49 81643270.41 509098852.14 21621496.37 31836864.26 4207597.81 0.00 123393614.70 24412768.84
18 35031996.42 314772809.97 28134410.25 1194872.17 84092568.52 534553794.75 22702571.19 33428707.47 4417977.70 0.00 131876393.78 23719128.60
19 36082956.31 330511450.47 29541130.76 1254615.78 86615345.57 561281484.49 23837699.75 35100142.84 4638876.58 0.00 140852704.77 23030542.76
20 37165445.00 347037022.99 31018187.30 1317346.57 89213805.94 589345558.71 25029584.74 36855149.98 4870820.41 0.00 150349306.05 22348466.32
∑ 569515812.90 4541090796.04 405882933.32 17237902.49 1367094439.76 7711775732.99 327520147.29 482261462.88 63736247.95 398784552.47 1285687154.14 370706298.91
Annual running cost of CHP = 205690540.63
Present value of annual running cost of CHP (£) = 186991400.57 NPV = 62775438.11
Saving in CHP running cost over conventional running cost = 45952387.29 IRR = 0.119 for NPV = 0.00
Simple payback period SPBP = 6.7 Years
International Journal of Engineering and Technology (IJET) – Volume 5 No. 4, April, 2015
ISSN: 2049-3444 © 2015– IJET Publications UK. All rights reserved. 238
3.4.2.3.4. Internal rate of return for ICR ADIGT-CHP case
By method of iteration using Equation 2.1-7 the internal rate of return IRR for the ICR ADIGT-CHP case is determined to be 11.9%.
Guides to unit prices and cost estimations of CHP and GT installations, electricity, gas fuel, operations and maintenance, and
emissions tax, were obtained from refs [12] [15][16][17].
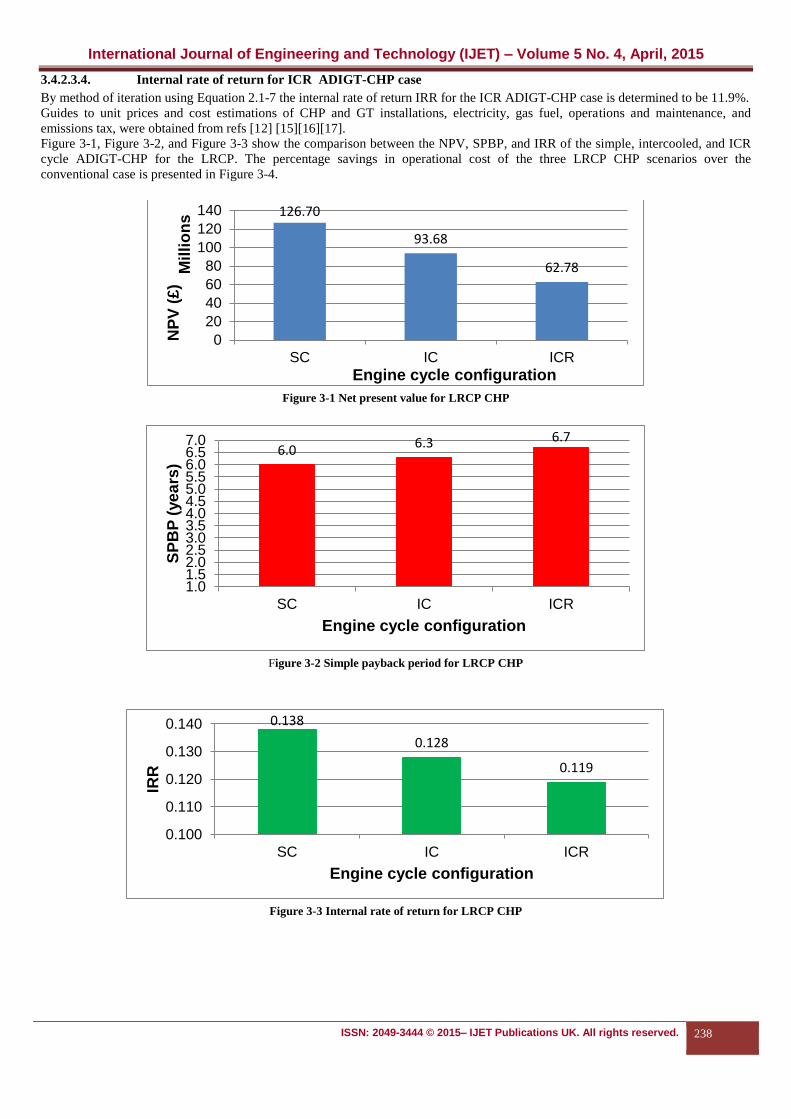
Figure 3-1, Figure 3-2, and Figure 3-3 show the comparison between the NPV, SPBP, and IRR of the simple, intercooled, and ICR
cycle ADIGT-CHP for the LRCP. The percentage savings in operational cost of the three LRCP CHP scenarios over the
conventional case is presented in Figure 3-4.
Figure 3-1 Net present value for LRCP CHP
Figure 3-2 Simple payback period for LRCP CHP
Figure 3-3 Internal rate of return for LRCP CHP
126.70
93.68
62.78
0
20
40
60
80
100
120
140
SC IC ICR
NP
V (
£)
Mil
lio
ns
Engine cycle configuration
6.0 6.3 6.7
1.01.52.02.53.03.54.04.55.05.56.06.57.0
SC IC ICR
SP
BP
(ye
ars
)
Engine cycle configuration
0.138
0.128
0.119
0.100
0.110
0.120
0.130
0.140
SC IC ICR
IRR
Engine cycle configuration

International Journal of Engineering and Technology (IJET) – Volume 5 No. 4, April, 2015
ISSN: 2049-3444 © 2015– IJET Publications UK. All rights reserved. 239
Figure 3-4 Percentage cost savings of LRCP CHP over conventional case
4. RESULTS DISCUSSION
The outcome of the techno-economic assessment by the
method in the case study of the LRCP-CHP above indicates
that all three cycle configurations, SC, IC, and ICR ADIGT-
CHP register positive NPV and are profitable over and above
the conventional case. However, the scenario of SC ADIGT-
CHP recorded the highest profit in NPV, the shortest payback
period, and the highest IRR, followed by the IC ADIGT-
CHP. The bulk of annual net savings of the plant comes from
sales of excess electricity and steam. These sales are observed
to be huge in the case of SC ADIGT-CHP than in IC and ICR
ADIGT-CHP. The much excess steam is as a result of high
heat content of the exhaust gas of the SC aero-derivative
engine compared to those of the IC and ICR cycles.
Similarly, the much excess electricity from the SC engine is
as a result of SC cycle generating more power due to much
lower ambient temperature (below international standard
atmosphere sea level static ISA SLS) of the region (site) over
a year period, where majority of annual seasons ambient
temperature falls below ISA SLS. On the other hand, IC and
ICR would generate more power in a region of ambient
temperature higher than ISA SLS.
The avoided or saved electricity and steam cost, grid
electricity, and boiler heat cost, are almost the same in all
three scenarios due to the constant consumption rate of the
process plant. Nevertheless, O & M cost, and
capital/installation cost were highest in the case of ICR
ADIGT-CHP, followed by the IC ADIGT-CHP, of course
due to additional components and complexity (from
intercooler, and recuperator). However, more fuel cost was
incurred in the scenario of SC ADIGT-CHP than the
advanced cycles, due to lesser GT thermal efficiency of the
former. Besides, it is pertinent to note that of all the annual
cost elements, GT fuel cost contributes the largest share in all
three scenarios.
Furthermore, it is observed that IRR of the ADIGT-CHP
cycle options increases as NPV increases, whereas SPBP
decreases with increasing NPV, as shown in the combination
of Figure 3-1, Figure 3-2, and Figure 3-3.
5. CONCLUSION
Assessment, prediction, and comparison have been done of
the techno-economic viability of simple, intercooled, and
intercooled-recuperated cycle large-scale aero-derivative
industrial gas turbines CHP over the conventional case in the
petrochemical industry, which is the aim of this paper. This
was implemented by estimating NPV, IRR, and SPBP for all
the ADIGT-CHP cycle options given inputs of technical
performance parameters of the engines with various
respective costs.
i. It was found that the percentage savings in operational cost
of SC, IC, and ICR cycle large-scale ADIGT–CHP over and
above the conventional case (grid electricity plus on-site
boiler) are 21.1%, 20.5%, and 19.7% respectively.
ii. SC large-scale ADIGT-CHP exhibits better NPV, SPBP,
and IRR than IC and ICR cycles over and above the
conventional case. Nevertheless, all three cycle options are
profitable than the conventional case.
iii. More-so, the results of SPBP, and IRR obtained compare
favourably with trends available in the literature. For
instance, a 66MW CHP plant in the UK was reported to
register an IRR of 12% and SPBP of 4.8 years [18].
iv. Steam flow is more in SC large-scale ADIGT-CHP than in
IC and ICR cycles.
v. SC large-scale ADIGT-CHP exhibits better CHP efficiency
than IC and ICR cycles.
vi. It is noteworthy that this sort of assessment method would
actually aid decision makers to make good choice of engine
cycles pertaining to investment in large-scale aero-derivative
industrial gas turbines CHP in the petrochemical industry.
Besides, future work is being contemplated by the authors for
the risk and sensitivity analysis of NPV with respect to
uncertainty in values of key inputs such as GT fuel price and
grid electricity tariff.
0.211 0.205 0.197
0
-0.040-0.0200.0000.0200.0400.0600.0800.1000.1200.1400.1600.1800.2000.220
SC IC ICR Conv
% c
os
t s
avin
gs
ove
r c
on
ve
nti
on
al
ca
se
Engine cycle configuration

International Journal of Engineering and Technology (IJET) – Volume 5 No. 4, April, 2015
ISSN: 2049-3444 © 2015– IJET Publications UK. All rights reserved. 240
Acknowledgments
The authors would like to thank Dr. Giuseppina Di Lorenzo
of the Department of Power and Propulsion of Cranfield
University, for her valuable contribution.
REFERENCES
[1] Ogaji S, Pilidis P, Hales R (2007). TERA: A Tool for
Aero-Engine Modelling and Management. Second World
Congress on Engineering Asset Management and the Fourth
International Conference on Condition Monitoring,
Harrogate, United Kingdom, June 11–14, 2007. Available
from:
http://dspace.lib.cranfield.ac.uk/handle/1826/3880. Date
accessed: 10 April 2013
[2] Khan R.S.R, Lagana M.C, Ogaji S.O.T, Pilidis P, Bennett
I. (2011). Risk analysis of gas turbines for natural gas
liquefaction. J. Eng. Gas Turbines Power 2011; 133(7):
071704-1 – 8.
[3] Nkoi B, Pilidis P, Nikolaidis T. (2013). Performance
assessment of simple and modified cycle turboshaft gas
turbines. Journal of Propulsion and Power Research, Elsevier
2013; 2(2): 96 – 106. Available from:
http://dx.doi.org/10.1016/j.jppr.2013.04.009. Date accessed:
12 July 2013
[4] Celis C. (2010). Evaluation and Optimisation of
Environmentally Friendly Aircraft Propulsion Systems.
[Dissertation]. School of Engineering, Cranfield University, UK.
2010; 31 – 98. Available from:
http://dspace.lib.cranfield.ac.uk/handle/1826/4686. Date
accessed: 15 May 2013.
[5] Kyprianidis K.(2008). Eva a Tool for
Environmental Assessment of Novel Cycles.
Proceedings of ASME Turbo Expo 2008: Power for
Land, Sea and Air, Berlin, Germany. June 9 – 13, 2008;
GT2008-50602: 547-556.
[6] Khan R, Barreiro J, Lagana M, Kyprianidis K, Ogaji S,
Pilidis P, Bennett I. (2009). An Assessment of the Emissions
and Global Warming Potential of Gas Turbines for LNG
Applications. ASME Paper No. GT2009-59184: 2009; 123-
132. Available from:
http://proceedings.asmedigitalcollection.asme.org/proceeding.
aspx?articleid=1647083 . Date accessed: 20 May 2013.
[7] Carbon Trust (2010). Introducing Combined Heat and
Power. Available from:
www.carbontrust.com/.../ctv044_introducing_combined_he
at_and_power. Date accessed: 12 June 2013.
[8] DECC (2012). CHP Finance. Department of Energy
and Climate Change. Available from:
http://chp.decc.gov.uk/cms/chp-finance. Date assessed: 15
June, 2013.
[9] EDUCOGEN (2001). The European Educational Tool on
Cogeneration. 2nd ed. 2001;
p. 102 – 103.
[10] Milton M, Lucas B.H. (2010). Sustainable On-site CHP
Systems: Design,
Construction and Operations. McGraw-Hill Companies. p.141
– 142
[11] Gutierrez P.H, Dalsted N.L. Long-term Loan repayment
methods, fact sheet No. 3.757.
Farm and Ranch/Economics. Colorado State University
Extension. Available from:
www.ext.colostate.edu/pubs/farmmgt/03757.pdf . Date
accessed: 06 March 2014.
[12] Greenpeace (2008). Securing Power, Potential for CCGT
CHP Generation at
Industrial Sites in the UK. A Report to Greenpeace. Poyry
Energy (Oxford) Ltd. 3 June, 2008. Available from:
www.greenpeace.org.uk/files/pdfs/climate/securingpower0
708.pdf. Date accessed: 19 May, 2013.
[13] GE Energy (2012). Gas Turbines: Aero-derivatives.
Available from:
http://www.ge_energy.com/products_and_services/product
s/gas_turbines_aeroderivative/index.jsp. Date accessed: 10
July 2012.
[14] Badeer G.H, Evendale O.H. (2000). GE Aero-derivative
Gas Turbines: Design and
Operating Features. GE Power Systems. GER-3695E. 2000;
10 – 11
[15] EPA-CPPD (2008). Technology Characterization: Gas
Turbines.
Environmental Protection Agency Climate Protection
Partnership Division, Washington DC. December 2008.
Available from:
www.epa.gov/chp/documents/catalog_chptech_gas_turbines.
pdf. Date accessed: 13 May, 2013.
[16] HM Revenue & Customs, DECC (2011). Carbon Price
floor, Tax Information and
Impact Note. 23 March 2011. Available from:
https://www.gov.uk/government/organisations/hm-revenue-
customs. Date accessed: 10 May, 2013.
[17] DECC (2013). Industrial Energy Prices Statistics.
Available from:
https://www.gov.uk/government/collections/industrial-
energy-prices. Date accessed: 25 June, 2013.
[18] Merše S, Visočni B.P, Riddoch F, Craenen S, Gardiner
P, Rotheray T, et al. (2011).
Cogeneration Case Study Handbook. CODE project.
Cogeneration Observatory and Dissemination Europe. Jozef
Stefan Institute, Energy Efficiency Centre: Slovenia. 2011; 34
– 6.