journal of earth science & climatic legese et al., arth ... · ao legese sa, olutayo oa,...
TRANSCRIPT

Volume 7 • Issue 9 • 1000368J Earth Sci Clim Change, an open access journalISSN: 2157-7617
Legese et al., J Earth Sci Clim Change 2016, 7:9DOI: 10.4172/2157-7617.1000368
Open Access
*Corresponding author: Solomon AL, Department of Natural ResourcesManagement, College of Agriculture and Environmental Sciences, Bahir Dar University, Bahir Dar, Ethiopia, E-mail: [email protected]
Olaleye AO, Professor and Director of Research and Development Unit, MIST, Innovate, Ontario, Canada, Tel no: +1-647-458-1967; E-mail: [email protected]
Received August 29, 2016; Accepted September 09, 2016; Published September 12, 2016
Citation: Legese SA, Olutayo OA, Sulaiman H, Rao P (2016) Assessing Climate Change Impacts in the Lake Tana Sub-Basin, Ethiopia Using Livelihood Vulnerability Approach. J Earth Sci Clim Change 7: 368. doi: 10.4172/2157-7617.1000368
Copyright: © 2016 Legese SA, et al. This is an open-access article distributed under the terms of the Creative Commons Attribution License, which permits unrestricted use, distribution, and reproduction in any medium, provided the original author and source are credited.
Keywords: Climate change; Livelihood vulnerability index;Exposure; Sensitivity; Adaptive capacity
Introduction The economy of Ethiopia is dependent on rainfed agriculture,
contributes about 52 percent to the gross domestic product (GDP) and generates more than 85 percent of foreign exchange earnings. In addition, it employs about 80 percent of the population (Ministry of Economic Development and Cooperation) [1,2]. One of the serious challenges of the agricultural sector in Ethiopia is its vulnerability to climate change (CC) [3,4]. Two of important determinants of social groups to CC are environmental and socio-economic factors. The most cited factors affecting the latter in literature include the level of technological development, infrastructure, institutions, and political setups [5,6] and the former include climatic conditions, quality of soil, and availability of water for irrigation [7-11]. It is the variations in these two factors that affect different social groups as well as their vulnerability to CC. Indicators of vulnerability provide means of monitoring potential of vulnerability over time and space, and identifying the processes that contribute to vulnerability, prioritizing strategies for reducing such vulnerability, and evaluating the effectiveness of these strategies in different social and ecological settings [12,13]. Architesh et al., [14] indicated that the sustainable livelihoods approach to mapping vulnerability looks at five types of household assets such as natural, social, financial, physical, and human capital. This approach used to design development program at the community level and it has proven useful for assessing the ability of households to withstand shocks (e.g. epidemics or civil conflict among the community). Another approach for vulnerability assessment integrates climate exposures and accounts for household adaptation practices and this is needed in order to comprehensively evaluate livelihood risks resulting from CC and its consequences [15]. However, in literature, there is not a unified method to assessing vulnerability, but most assessments normally consider one
or more of exposure to risks, susceptibility to damage and capacity to recover from climate shocks [9,16,17].
One of the best ways to assess vulnerability is to understand how vulnerable a community is and then compare this to other community within the same agro-ecology. Several researchers rely on the definition proposed by the Intergovernmental Panel on Climate Change (IPCC) that view vulnerability as a function of exposure, sensitivity and adaptive capacity [18]. The vulnerability framework as proposed by the IPCC is viewed as one of the most powerful analytical tool for assessments [19,20]. Within this broad framework, Hahn et al., developed an indicator-based vulnerability assessment which has been utilized by several researchers in different areas [11,21,24]. The livelihood vulnerability index (LVI) is a composite index of all major parameters, while the IPCC vulnerability approach frames the major parameters into three contributing factors to vulnerability and these are: exposure, sensitivity and adaptive capacity. The LVI uses multiple indicators to assess exposure to natural disasters due to climate change
Assessing Climate Change Impacts in the Lake Tana Sub-Basin, Ethiopia Using Livelihood Vulnerability ApproachSolomon Addisu Legese1*, Olaleye Adesola Olutayo2*, Hameed Sulaiman3, and Prasada Rao4
1Department of Natural Resources Management, College of Agriculture and Environmental Sciences, Bahir Dar University, Bahir Dar, Ethiopia2Research and Development Unit, MIST, Innovate, Ontario, Canada3College of Science, Sultan Qaboos University, P. O. Box 36,PC 123, Alhoudh, Muscat, Oman4Department of Environmental Sciences, College of Science and Technology, Andhra University, Visakhapatnam, India
AbstractThe agro-ecology based classification was used to analyze the vulnerability of Lake Tana sub-basin (LTSB) to
shocks induced by CC. One hundred and fifty households were surveyed in LTSB and data were collected on socio-demographics, livelihoods, social networks, health, food and water security, natural disasters and climate variability. Data collected were aggregated using a composite index, differential and integrated vulnerability analysis approach to develop indices. The major components have been classified into adaptive capacity, exposure and sensitivity to climate change impacts to analyze Livelihood vulnerability index (LVI)-IPCC contributing factors. The results depicted that Upper sub-basin (USB) had a LVI-IPCC score of 0.042 and the LSB was (0.036). The LVI–IPCC analysis of Lower sub-basin (LSB) was 0.036 and that of the USB 0.042. Results showed that almost all the three major components of the IPCC vulnerability indices both agro-ecology of LTSB, however, the USB households were more vulnerable more than the LSB. From these results, it can be seen that the former is more susceptible to CC compared to the latter. The overall LVI–IPCC scores indicate that USB households might be more vulnerable than LSB households (0.042 versus 0.036). This study showed general and site-specific factors contributing to different components of vulnerability (exposure, sensitivity and adaptive capacity) for mixed agro-livestock smallholders. The findings can be used by the government of Ethiopia as well as AID agencies in the country to reduce vulnerability and enhance adaptive capacity of both the LSB and USB basins. In addition, income and livelihood diversification may be one of the options to reduce vulnerability in all districts.
Jour
nal o
f Ear
th Science &Climatic Change
ISSN: 2157-7617
Journal of Earth Science & ClimaticChange
Research Article

Citation: Legese SA, Olutayo OA, Sulaiman H, Rao P (2016) Assessing Climate Change Impacts in the Lake Tana Sub-Basin, Ethiopia Using Livelihood Vulnerability Approach. J Earth Sci Clim Change 7: 368. doi: 10.4172/2157-7617.1000368
Page 2 of 10
Volume 7 • Issue 9 • 1000368J Earth Sci Clim Change, an open access journalISSN: 2157-7617
affect their adaptive capacity, and current health, food, and water resource characteristics that determine their sensitivity to climate change impacts.
MethodologyDescription of the study area
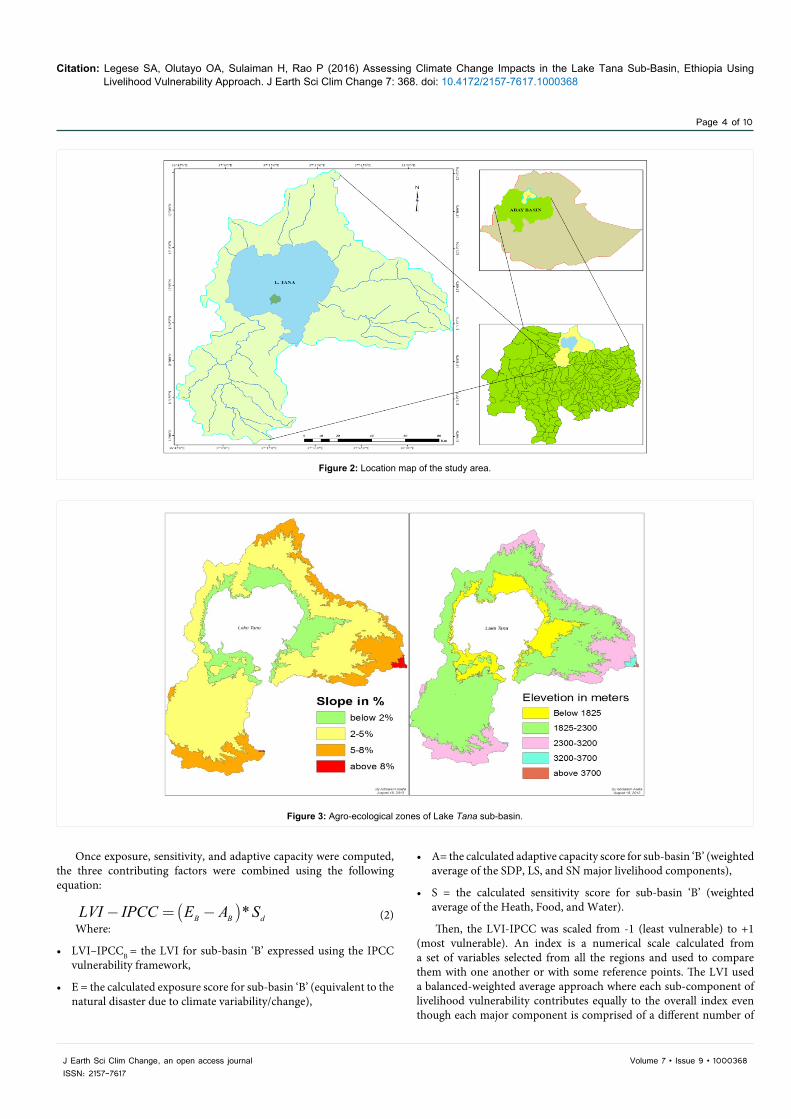
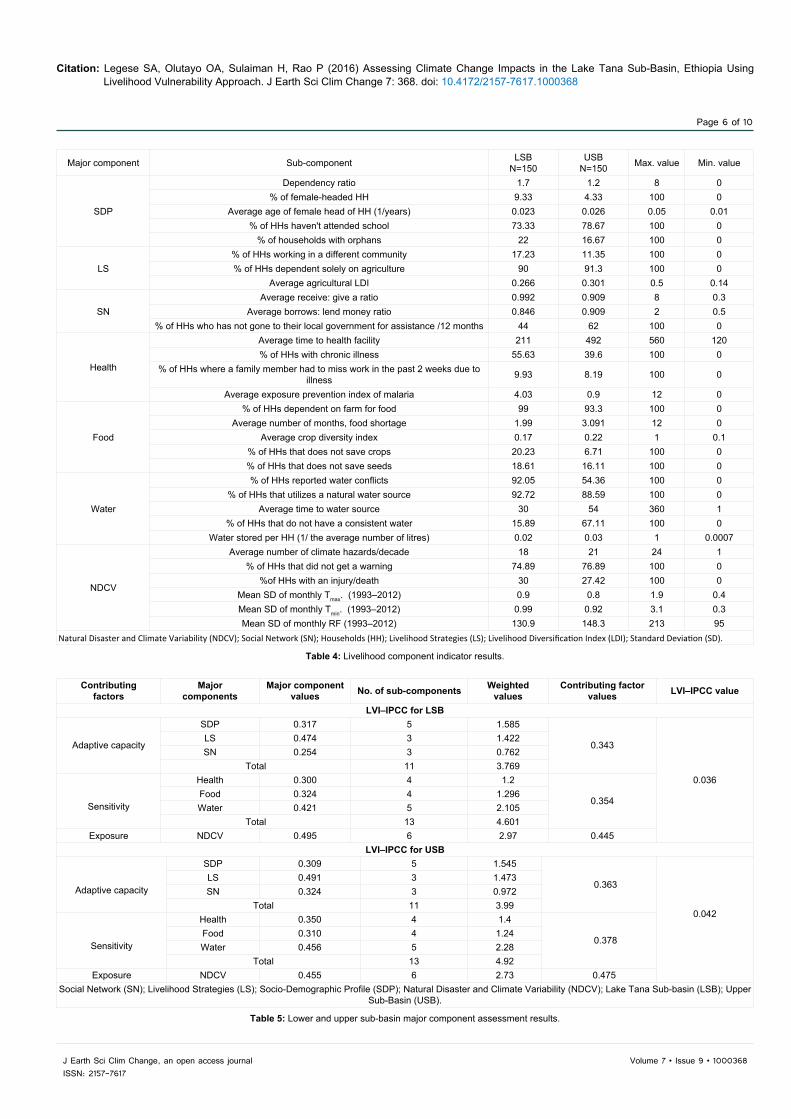
Ethiopia is located in Northeastern or East Central Horn of Africa lying between 3 to 15 degrees’ north latitude, 33 to 48 degrees’ east longitude (Figure 2). Ethiopia is bordered in the east by Somalia and Djibouti, in the south by Kenya, in the northeast by Eritrea and in the west by the North and South Sudan. The country has a total area of about 1.1 million km2 and comprises of 12 river basins with varying size and water resource potential [30]. Blue Nile basin (Locally called the Abay Basin), is the largest of these basins and of the sub-basins is the Lake Tana Sub-basin (LTSB). The LTSB is the largest freshwater and oligotrophic-high altitude lake in the world (CSA, 2007) and it is classified into different agro-climatic zones within the temperate zone based on its topographic nature and rainfall. According to a practical guide for development agents on managing land, there are four altitude zones in LTSB [31] and these are: Woyna-Dega (below 2300 m.a.s.l.), Dega (2300 to 3200 m.a.s.l), Wurch (3200 to 3700 m.a.s.l.) and Alphine Wurch (above 3700 m.a.s.l.) (Figure 3). The dominant agro-ecology in the LTSB is Woyna-Dega accounts for 79.5% of the area. Other agro-ecologies are Wurch and Alpine-Wurch and these covers 20, 0.43 and 0.07% of the sub-basin respectively. Considering a combination of altitude and rainfall, agro-climatic zones of the sub-basin are classified into different raster layers. Analysis of the combination of these raster layers by using ArcGIS 10.1 software indicated that the sub-basin is classified into seven agro-climatic zones [32].
The climate of Ethiopia is mainly controlled by the seasonal migration of the Inter-Tropical Convergence Zone (ITCZ) and associated atmospheric circulation, but the topography has also an effect on local climate conditions. In other words, though Ethiopia is found within the tropic, is not a hot country since its altitudinal climate controlling effect is significantly higher than its latitudinal controlling effect. LTSB, because of its high altitudes, mostly experience temperate climate conditions. Thus, the seasonal variation in the climate is low compared to other tropical areas of low altitude. Two distinct seasons, dry and wet, are recognized. The dry season starts from November to May, while the wet season covers the remaining parts of the year, when most of the precipitation takes place. Summer is the most important and agriculturally active season in the LTSB. Maximum rain comes from the months of June to September and rural people are totally dependent on this rain for agricultural productions [33]. The diurnal variation in the daily temperature is very low. The annual mean maximum temperature of different parts of the region had a range from 16.6°C to 27.8°C; while the mean minimum temperature ranges from 10°C to 17°C. March to May is the hottest part of the year, and December to February is the coldest part of the year, during which time occasionally at high altitude regions, extreme minimum temperature of less than 5°C may occur. The monthly mean maximum and minimum temperatures for the LTSB are presented in Figure 4. The mean temperatures start rising gradually from January to April and thereafter with a slight decline by August [34].
According to Hurni [35] classification, there are three rainfall regimes across the sub-basin; these are dry, moist and wet. Areas with annual rainfall of 900 mm and below are categorized as dry; areas having rainfall amount between 900 and 1400 mm are considered to be moist; and those areas receiving more than 1400 mm are categorized
or variability, social and economic characteristics of households that affect their adaptive capacity, and current health, food, and water resource characteristics that determine their sensitivity to climate change impacts. According to the IPCC report [25,26], exposure relates to the influences or stimuli that impact on a system, sensitivity reflects the responsiveness of a system to climatic effects, and the degree to which changes in climate might affect that system in its current situations and the adaptive capacity is the ability of a system to adjust to climate change (including climate variability and extremes) to moderate possible damages or to cope with the consequences of the event (Figure 1 and Table 1). Adaptive capacity of a system or society describes its ability to modify its characteristics or behaviour so as to cope better with changes in external circumstances. The more adaptive a system, the less vulnerable it is. It is also defined as the character of a system to adjust its nature in order to expand its coping range under existing climate variability or future climate conditions [27]. For social system's vulnerability would be seen as a disruption of social networks and communications, a reduction in the capacity of volunteer organizations or reduced productivity as a result of reduced access to the workplace. Occupational health and welfare policy that reduced working hours would also increase the vulnerability of social systems, as would reduce household earnings, poor public services such as public transport, increased crime rates, an increase in the proportion of the population considered to be socially excluded or a reduction in the levels of engagement or trusts with government. Vulnerability of constructing physical systems would include the number or capital value of infrastructure assets that will be damaged or in need of increased maintenance, modification or relocation/retreat from the climate stresses and will include transport networks (roads, rail, ports), communication, buildings, land and service related infrastructure (water and energy networks). The Livelihood Vulnerability Index (LVI) by Chambers and Conway [28] indicated that the sustainable livelihoods approach, which looks at five types of household assets such as natural, social, financial, physical, and human capital is an approach used to design development program at the community level. The approach has proven useful for assessing the ability of households to withstand shocks such as epidemics or civil conflict among the community [29]. Hence, climate change adds complexity to the household livelihood security and in the meantime the survival of life. The workable livelihoods approach to a limited extent addresses the issues of sensitivity and adaptive capacity to climate change. However, a new approach for vulnerability assessment that integrates climate exposures and accounts for household adaptation practices is needed in order to comprehensively evaluate livelihood risks resulting from climate change and its consequences. The LVI uses multiple indicators to assess exposure to natural disasters due to climate change or variability, social and economic characteristics of households that
- -
Difference x
Vulnerability
Exposure
Sensitivity
Adaptive capacity
Figure 1: Diagram of exposure, sensitivity, potential impact and adaptive capacity. [Source: Modified from Thomas (2012)].

Citation: Legese SA, Olutayo OA, Sulaiman H, Rao P (2016) Assessing Climate Change Impacts in the Lake Tana Sub-Basin, Ethiopia Using Livelihood Vulnerability Approach. J Earth Sci Clim Change 7: 368. doi: 10.4172/2157-7617.1000368
Page 3 of 10
Volume 7 • Issue 9 • 1000368J Earth Sci Clim Change, an open access journalISSN: 2157-7617
2xz =value of normal distribution at 95% confidence (z=1.96);
P = the proportion for the key variables to be investigated (p=0.5);
ε = margin of error (10%); and
d = design effect
The proposed and actual sample size for the household survey is given in Table 2. Based on this, 300 household heads were selected from the upper and lower sub-basins that were situated in the LTSB. In order to obtain the required information, 15 household heads (HH) were randomly selected using simple random sampling techniques (Table 3). Enumerators were appointed and these went to each household to collect the required data. In case, the head of a given could not tracked down at the time of data collection, the required information was collected from the wife.
Calculating the LVI–IPCC framework approach
The LVI–IPCC framework approach was developed as an alternative method for calculating the LVI that incorporates the IPCC vulnerability definition. Exposure of the study population was measured by the number of natural disasters that have occurred in the past 10 years, while climate variability was measured by the average standard deviation of the maximum and minimum monthly temperature and monthly precipitation over a 10 years’ period [38,39]. Adaptive capacity was quantified by the demographic profile of a sub-basin, the types of livelihood strategies employed and the strength of social networks. Last, sensitivity was measured by assessing the current state of the sub-basin’s food and water security and health status. It diverges from the LVI when the major components are aggregated. The major components first combined according to the categorization scheme using the equation:
1
1
n
in
i
wMiMBiCFB
wMi=
=
= åå
(1)
Where:-
CFB is an IPCC-defined contributing factor (exposure, sensitivity, or adaptive capacity) for sub-basin B,
• MBi are the major components for sub-basin B indexed by i,
• WMi is the weight of each major livelihood component, and
• n is the number of major livelihood components in each contributing factor.
under wet region. Assessment of spatial rainfall from the point stations within or around the sub-basin through applying kriging interpolation also indicated that LTSB has three rainfall zones, namely: dry (below 900 mm), moist (900–1400 mm) and wet (above 1400 mm) (Figure 5). The mean annual rainfall for the LTSB is 1552.8 mm, and it varies over different stations from 1435.6 mm to 2348.3 mm. The main rainy season, June to September (Kiremt), 80 - 85% of the annual rainfall is received; while in the second season from October to December/January (Bega) another 5-10% of the annual rainfall occurs, and in the third is the small rainy season from February/March to May (Belg), 10-20% amount of the annual rainfall is received through sporadic rain. The number of rainy days may range up to 120 days/annum during a normal rainfall year.
Climate change is known to affect socioeconomic condition of a given area [36], hence, a socioeconomic survey was conducted at the household level of the LTSB: the upper and the lower sub-basins respectively. Subsequently, pre-tested structured questionnaires consisting of both open and close-ended questions were administered to the households within the LTSB, at the upper and lower sub-basins. To substantiate the result, interviews and focus group discussions (FDG) were also conducted. In addition to these, secondary data on crops, livestock, population, etc. were collected from the districts of the agricultural bureaus. The number of sampled households selected from administrative kebeles in each of the agro-ecology located in the sub-basins and was after Cochran [37]. Sample size calculation for selection of households from each sub-basin considered the following (i) the proportion (p) for the different variables of investigation (p=0.5); (ii) design effect of two (2) to make an adjustment for non-random effect; (iii) 10% margin of error at 95% confidence; and (iv) 5% non-response rate. The formula used to calculate sample size is given as:
2
2
( ) * (1 )2xd z p p
noi-
=e
11( 1)
noininoi
Ni
=-
Where: Ni = the total number of households in each sub-basin (i=1, 2, 3);
n0i = non-adjusted sample size for each sub-basin
ni = adjusted sample size for each for each sub-basin;
No. IPCC contributing factors to vulnerability Major components1 Exposure Natural disasters caused by climate variability
2 Adaptive capacity Socio-demographic profile, Livelihood strategies and Social networks
3 Sensitivity Health, Food and Water
Table 1: Categorization of major components into IPCC contributing factors.
Sub-basins Number of HHs in each sub-basin Adjusted sample size Non-response rate Proposed sample size Actual sample sizeLower
sub-basins 12,098 136 5 141 150
Upper Sub-basins 10,694 134 5 139 150
Total 22,792 270 10 280 300Source: Interpolation and household survey (2014); Households (HH).
Table 2: The proposed and actual sample size of households.
Citation: Legese SA, Olutayo OA, Sulaiman H, Rao P (2016) Assessing Climate Change Impacts in the Lake Tana Sub-Basin, Ethiopia Using Livelihood Vulnerability Approach. J Earth Sci Clim Change 7: 368. doi: 10.4172/2157-7617.1000368
Page 4 of 10
Volume 7 • Issue 9 • 1000368J Earth Sci Clim Change, an open access journalISSN: 2157-7617
Figure 2: Location map of the study area.
Figure 3: Agro-ecological zones of Lake Tana sub-basin.
Once exposure, sensitivity, and adaptive capacity were computed, the three contributing factors were combined using the following equation:
( )*B B dLVI IPCC E A S- = - (2)
Where:
• LVI–IPCCB = the LVI for sub-basin ‘B’ expressed using the IPCC vulnerability framework,
• E = the calculated exposure score for sub-basin ‘B’ (equivalent to the natural disaster due to climate variability/change),
• A= the calculated adaptive capacity score for sub-basin ‘B’ (weighted average of the SDP, LS, and SN major livelihood components),
• S = the calculated sensitivity score for sub-basin ‘B’ (weighted average of the Heath, Food, and Water).
Then, the LVI-IPCC was scaled from -1 (least vulnerable) to +1 (most vulnerable). An index is a numerical scale calculated from a set of variables selected from all the regions and used to compare them with one another or with some reference points. The LVI used a balanced-weighted average approach where each sub-component of livelihood vulnerability contributes equally to the overall index even though each major component is comprised of a different number of

Citation: Legese SA, Olutayo OA, Sulaiman H, Rao P (2016) Assessing Climate Change Impacts in the Lake Tana Sub-Basin, Ethiopia Using Livelihood Vulnerability Approach. J Earth Sci Clim Change 7: 368. doi: 10.4172/2157-7617.1000368
Page 5 of 10
Volume 7 • Issue 9 • 1000368J Earth Sci Clim Change, an open access journalISSN: 2157-7617
Figure 4: Long term mean monthly maximum and minimum temperature of LTSB.
Figure 5: Monthly means rainfall of LTSB.
LSB kebele No. HHs District USB Kebele No. HHs District
Shaga 1525 Fogera Michaeldebir 2071 Libokemkem
Shina 2196 Fogera Libo 1930 Libokemkem
Kuharmichael 1241 Fogera Mokesh 1509 Farta
Bebekis 1588 Fogera Amjaye 1405 Farta
Tezamba 1202 Libokemkem Gentegna 1302 Farta
Bira 1406 Libokemkem Sores 1100 Farta
Shinatsion 1402 Libokemkem Darmo 1377 Farta
Kab 1538 Libokemkem -- -- --
Source: District administrative office, 2014; Lake Tana Sub-basin (LSB); Upper Sub-Basin (USB).
Table 3: Sub-samples from the kebeles in the study area.
Citation: Legese SA, Olutayo OA, Sulaiman H, Rao P (2016) Assessing Climate Change Impacts in the Lake Tana Sub-Basin, Ethiopia Using Livelihood Vulnerability Approach. J Earth Sci Clim Change 7: 368. doi: 10.4172/2157-7617.1000368
Page 6 of 10
Volume 7 • Issue 9 • 1000368J Earth Sci Clim Change, an open access journalISSN: 2157-7617
Major component Sub-component LSB N=150
USBN=150 Max. value Min. value
SDP
Dependency ratio 1.7 1.2 8 0% of female-headed HH 9.33 4.33 100 0
Average age of female head of HH (1/years) 0.023 0.026 0.05 0.01% of HHs haven't attended school 73.33 78.67 100 0
% of households with orphans 22 16.67 100 0
LS % of HHs working in a different community 17.23 11.35 100 0% of HHs dependent solely on agriculture 90 91.3 100 0
Average agricultural LDI 0.266 0.301 0.5 0.14
SNAverage receive: give a ratio 0.992 0.909 8 0.3
Average borrows: lend money ratio 0.846 0.909 2 0.5% of HHs who has not gone to their local government for assistance /12 months 44 62 100 0
Health
Average time to health facility 211 492 560 120% of HHs with chronic illness 55.63 39.6 100 0
% of HHs where a family member had to miss work in the past 2 weeks due to illness 9.93 8.19 100 0
Average exposure prevention index of malaria 4.03 0.9 12 0
Food
% of HHs dependent on farm for food 99 93.3 100 0Average number of months, food shortage 1.99 3.091 12 0
Average crop diversity index 0.17 0.22 1 0.1% of HHs that does not save crops 20.23 6.71 100 0% of HHs that does not save seeds 18.61 16.11 100 0
Water
% of HHs reported water conflicts 92.05 54.36 100 0% of HHs that utilizes a natural water source 92.72 88.59 100 0
Average time to water source 30 54 360 1% of HHs that do not have a consistent water 15.89 67.11 100 0
Water stored per HH (1/ the average number of litres) 0.02 0.03 1 0.0007
NDCV
Average number of climate hazards/decade 18 21 24 1% of HHs that did not get a warning 74.89 76.89 100 0
%of HHs with an injury/death 30 27.42 100 0Mean SD of monthly Tmax. (1993–2012) 0.9 0.8 1.9 0.4Mean SD of monthly Tmin. (1993–2012) 0.99 0.92 3.1 0.3Mean SD of monthly RF (1993–2012) 130.9 148.3 213 95
Natural Disaster and Climate Variability (NDCV); Social Network (SN); Households (HH); Livelihood Strategies (LS); Livelihood Diversification Index (LDI); Standard Deviation (SD).
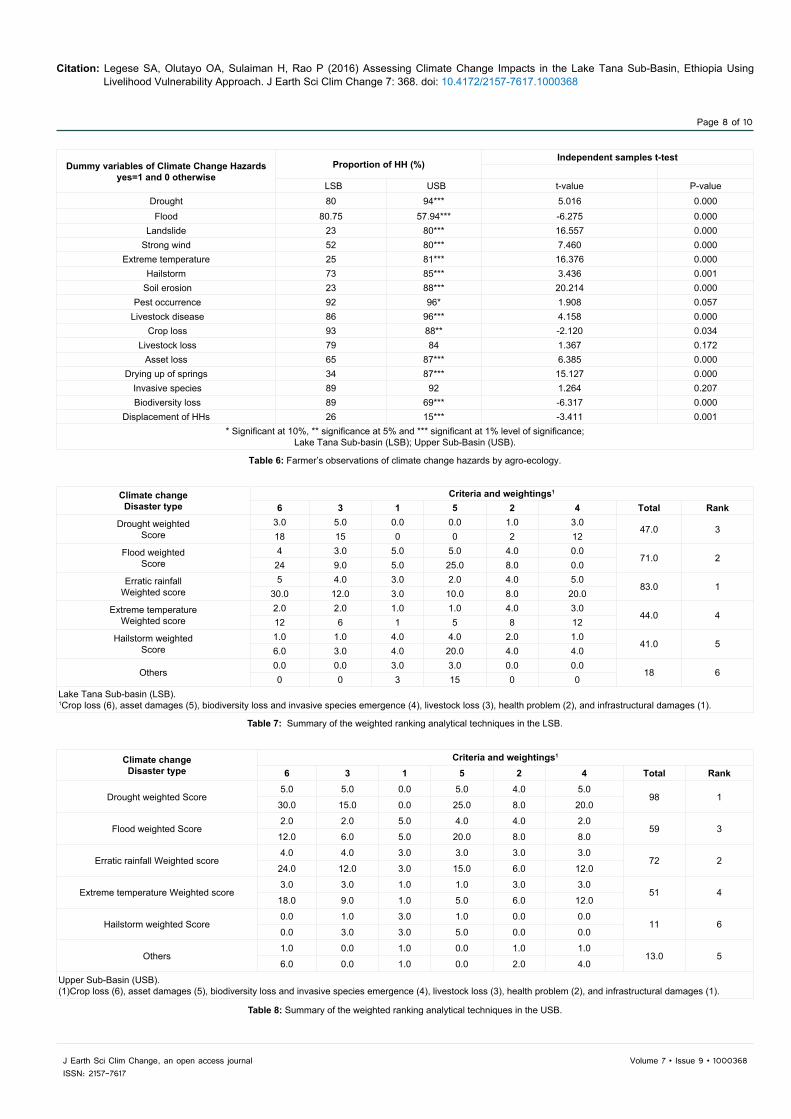
Table 4: Livelihood component indicator results.
Contributing factors
Major components
Major component values No. of sub-components Weighted
valuesContributing factor
values LVI–IPCC value
LVI–IPCC for LSB
Adaptive capacity
SDP 0.317 5 1.585
0.343
0.036
LS 0.474 3 1.422SN 0.254 3 0.762
Total 11 3.769
Sensitivity
Health 0.300 4 1.2
0.354Food 0.324 4 1.296Water 0.421 5 2.105
Total 13 4.601Exposure NDCV 0.495 6 2.97 0.445
LVI–IPCC for USB
Adaptive capacity
SDP 0.309 5 1.545
0.363
0.042
LS 0.491 3 1.473SN 0.324 3 0.972
Total 11 3.99
Sensitivity
Health 0.350 4 1.4
0.378Food 0.310 4 1.24Water 0.456 5 2.28
Total 13 4.92Exposure NDCV 0.455 6 2.73 0.475
Social Network (SN); Livelihood Strategies (LS); Socio-Demographic Profile (SDP); Natural Disaster and Climate Variability (NDCV); Lake Tana Sub-basin (LSB); Upper Sub-Basin (USB).
Table 5: Lower and upper sub-basin major component assessment results.

Citation: Legese SA, Olutayo OA, Sulaiman H, Rao P (2016) Assessing Climate Change Impacts in the Lake Tana Sub-Basin, Ethiopia Using Livelihood Vulnerability Approach. J Earth Sci Clim Change 7: 368. doi: 10.4172/2157-7617.1000368
Page 7 of 10
Volume 7 • Issue 9 • 1000368J Earth Sci Clim Change, an open access journalISSN: 2157-7617
sub-components. Because each of the sub-components measured on a different scale, it was then first necessary to standardize each as an index. In this case, the LVI uses a balanced-weighted average approach (standardized) where each sub-component contributes equally to the overall index even though each major component is comprised of a different number of sub-components.
Results and DiscussionIn this study, the average family size per household were found to
be 6.13 ± 0.67 (LSB) and 6.23 ± 0.69 (USB) respectively, which is higher than the national average of 4.1 ± 0.6 persons. The LSB respondents reported a higher proportion of female-headed households and a smaller proportion of household heads who did not attend school compared to the USB respondents. The educational level of household head was found to be important determinant of resilience to climate change induced shock. Household heads with higher levels of education have a better level of planning, access and effectiveness of early warning information from different sources, better reactions and rehabilitation skills during and after natural shocks, alter agricultural operation and adopt extension strategies [40]. Hence, education is one of the key factors in building the resilience level of households to climate change impacts. Results further showed that a significant number of households have not attended schools and these were 73.33% (LSB) and in the USB, 78.67%. This is much higher than the national average (47%) reported by CSA (2008). These outcomes suggest that both sub-basin respondents are extremely vulnerable to CC risks. The dependency ratio and the number of orphans were found to be higher in the lower sub-basins (i.e. between 1.7 and 22%) than the upper basin (i.e. between 1.2 and 16.67%), respectively (Table 4). Regarding the livelihood strategies of both sub-basins, the percentage of households with family members who have been working in a different community for their additional income (off-farm and non-farm activities) was found to be 17.23% (LSB) and 11.35% (USB). The percent of households who depend solely on agriculture as a source of income were higher for both sub-basins: 90% in the LSB and 91.3% in the USB. In terms of vulnerability, results showed that the USB is more vulnerable in terms of livelihood strategies, social networks, and health profile and water resource. However, the vulnerability of the households in the LSB was in terms of socio-demographic profile, food and natural disaster related to climate variability.
The LVI used a weighted average approach where each sub-component contributes differently to the overall index since each major portion is made up of a different number of sub-elements. The LVI–IPCC analysis results revealed that (LVI–IPCC: LSB=0.036, USB=0.042) (Figure 6). Vulnerability triangle plots the contributing factor results in livelihood vulnerability index IPCC approach. Almost all the three major components of the IPCC vulnerability approach value were found to be higher in both agro-ecologies of LTSB. Relatively, the USB households were more vulnerable more than the LSB. Results presented in Figure 6 showed that the USB with a score of 0.475 may be more exposed to CC when compared to the LSB with a score of 0.445. Moreover, accounting for the current health status as well as food and water security, USB might be more sensitive to CC impacts than LSB (i.e. 0.378 versus 0.354, respectively) (Table 5). By the demographic characteristics, livelihood strategies, and societal networks, USB showed a higher adaptive capacity (USB=0. 363 versus LSB=0.343). In other words, households in the upper sub-basin were found to be more vulnerable to the adverse impacts of CC than the lower-basin based on the local level assessment livelihood components. The overall LVI–IPCC scores indicate that USB households might
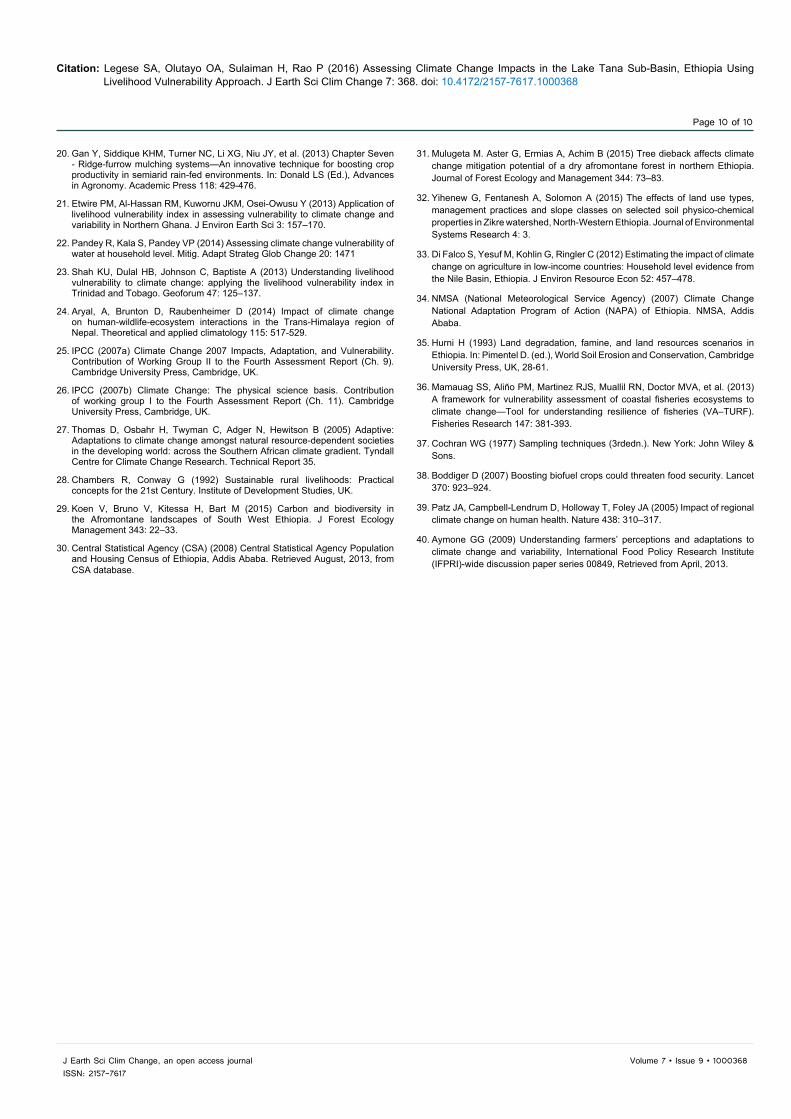
be more vulnerable than LSB households (0.042 versus 0.036). The broken line in Figure 6 indicated that the USB is on the outer edge of the triangle as compared to the solid line (LSB). The implication of this is that from the three IPCC vulnerability components, the USB is highly exposed and sensitive to and has a higher adaptive capacity. This might be the case that the higher scale of vulnerability and sensitivity enabled the rural masses to cope up adverse impacts of climate change by building adaptive capacity better than the LSB households. During the field visit and focus group discussions (FGD) conducted in the USB, observations showed that within this sub-basin actively participated in environmental resources management through soil and water conservation, tree plantation. In addition, they were actively involved in fertility management through compost making when compared to the households in the LSB sub-basins. The commonly observed CC hazards by agro-ecology were drought, flood, crop pests, livestock disease, crop loss and invasive species prevalence in both sub-basins (i.e. USB and LSB). From the results, it was apparent that the likelihoods of drought occurrence in the USB (i.e. 94%) were significantly greater when compared to the LSB (i.e. 80%). In addition, the occurrence of flooding was also noted to be higher in the LSB (i.e. 80.75% chances) when compared to the USB (i.e. 57.94%) (Table 6). Using focus group discussions (FGD) in each agro-ecology results showed that impact of CC varied from most severe to less severe: crop loss (6) > asset damages such as house destruction, fall of big trees, water lodging, landslide, etc.) (5) > biodiversity loss and invasive species emergence (4) > livestock loss (3) > human health problem including malaria expansion to the highland (2), and > infrastructural damages (1). The results of the weighted ranking analytical techniques indicated that the order in LSB was erratic rainfall > flooding > drought > extreme temperature > hailstorm and others (Table 7). Farmers from the rural kebeles of the LSB (i.e. Shaga, Kuharmichael, Shina, Bebekis, Tezamba, Bira, and Shinatsion) stated that delay of the onset of rainy season enabled to plant fast growing crops which has low yield. They mentioned that high yield crops have been missing since the delay in the rainy seasons and replaced by faster growing crops where yield is lower per plots of land. However, in the USB sub-basin, the order was drought > erratic rainfall > flood > extreme temperature > others > hailstorm (Table 8). Farmers that participated in the FGD were in these kebeles (i.e. Michaeldebir, Libo, Mokesh, Amjaye, Gentegna, Sores and Darmo). Results presented in Table 9 showed the commonest livelihoods in both LSB and USB
Figure 6: Vulnerability triangle diagram of the livelihood vulnerability index, Intergovernmental panel on climate change approach.
Citation: Legese SA, Olutayo OA, Sulaiman H, Rao P (2016) Assessing Climate Change Impacts in the Lake Tana Sub-Basin, Ethiopia Using Livelihood Vulnerability Approach. J Earth Sci Clim Change 7: 368. doi: 10.4172/2157-7617.1000368
Page 8 of 10
Volume 7 • Issue 9 • 1000368J Earth Sci Clim Change, an open access journalISSN: 2157-7617
Dummy variables of Climate Change Hazards yes=1 and 0 otherwise
Proportion of HH (%)Independent samples t-test
LSB USB t-value P-value Drought 80 94*** 5.016 0.000Flood 80.75 57.94*** -6.275 0.000
Landslide 23 80*** 16.557 0.000Strong wind 52 80*** 7.460 0.000
Extreme temperature 25 81*** 16.376 0.000Hailstorm 73 85*** 3.436 0.001
Soil erosion 23 88*** 20.214 0.000 Pest occurrence 92 96* 1.908 0.057
Livestock disease 86 96*** 4.158 0.000 Crop loss 93 88** -2.120 0.034
Livestock loss 79 84 1.367 0.172Asset loss 65 87*** 6.385 0.000
Drying up of springs 34 87*** 15.127 0.000 Invasive species 89 92 1.264 0.207 Biodiversity loss 89 69*** -6.317 0.000
Displacement of HHs 26 15*** -3.411 0.001* Significant at 10%, ** significance at 5% and *** significant at 1% level of significance;
Lake Tana Sub-basin (LSB); Upper Sub-Basin (USB).
Table 6: Farmer’s observations of climate change hazards by agro-ecology.
Climate change Disaster type
Criteria and weightings1
6 3 1 5 2 4 Total Rank Drought weighted
Score3.0 5.0 0.0 0.0 1.0 3.0
47.0 318 15 0 0 2 12
Flood weighted Score
4 3.0 5.0 5.0 4.0 0.071.0 2
24 9.0 5.0 25.0 8.0 0.0
Erratic rainfall Weighted score
5 4.0 3.0 2.0 4.0 5.083.0 1
30.0 12.0 3.0 10.0 8.0 20.0
Extreme temperature Weighted score
2.0 2.0 1.0 1.0 4.0 3.044.0 4
12 6 1 5 8 12
Hailstorm weighted Score
1.0 1.0 4.0 4.0 2.0 1.041.0 5
6.0 3.0 4.0 20.0 4.0 4.0
Others0.0 0.0 3.0 3.0 0.0 0.0
18 60 0 3 15 0 0
Lake Tana Sub-basin (LSB).1Crop loss (6), asset damages (5), biodiversity loss and invasive species emergence (4), livestock loss (3), health problem (2), and infrastructural damages (1).
Table 7: Summary of the weighted ranking analytical techniques in the LSB.
Table 8: Summary of the weighted ranking analytical techniques in the USB.
Climate change Disaster type
Criteria and weightings1 6 3 1 5 2 4 Total Rank
Drought weighted Score 5.0 5.0 0.0 5.0 4.0 5.0
98 130.0 15.0 0.0 25.0 8.0 20.0
Flood weighted Score2.0 2.0 5.0 4.0 4.0 2.0
59 312.0 6.0 5.0 20.0 8.0 8.0
Erratic rainfall Weighted score 4.0 4.0 3.0 3.0 3.0 3.0
72 224.0 12.0 3.0 15.0 6.0 12.0
Extreme temperature Weighted score 3.0 3.0 1.0 1.0 3.0 3.0
51 418.0 9.0 1.0 5.0 6.0 12.0
Hailstorm weighted Score0.0 1.0 3.0 1.0 0.0 0.0
11 60.0 3.0 3.0 5.0 0.0 0.0
Others 1.0 0.0 1.0 0.0 1.0 1.0
13.0 56.0 0.0 1.0 0.0 2.0 4.0
Upper Sub-Basin (USB).(1)Crop loss (6), asset damages (5), biodiversity loss and invasive species emergence (4), livestock loss (3), health problem (2), and infrastructural damages (1).

Citation: Legese SA, Olutayo OA, Sulaiman H, Rao P (2016) Assessing Climate Change Impacts in the Lake Tana Sub-Basin, Ethiopia Using Livelihood Vulnerability Approach. J Earth Sci Clim Change 7: 368. doi: 10.4172/2157-7617.1000368
Page 9 of 10
Volume 7 • Issue 9 • 1000368J Earth Sci Clim Change, an open access journalISSN: 2157-7617
and the impact of CC on theses. The most impacted livelihoods in both of these agro-ecologies were field crop production, animal husbandry (cattle, goat/sheep rearing) and vegetable production.
Conclusion The LVI and LVI–IPCC could be used to assess the impact of a
program or policy by substituting the value of the indicator that is expected to change and recalculating the overall vulnerability index. Limitations of the approach used in this study include the subjectivity involved in selecting sub-components and the directionality of the relationship between the sub-components and vulnerability, the masking of extreme values by utilizing means to calculate the indices, and possible selection bias due to empty households left out of the sample. Replication of this study in the same location over time might provide information about how the exposure, adaptive capacity, and sensitivity of districts change as adaptation practices are initiated. Future work might include refinement of the Social Networks sub-components in order to more accurately evaluate social bonds. Additionally, the LVI approach could be tested at the community level in order to compare vulnerability among communities within a district. In general, it is hoped that the LVI will provide a useful tool for development planners to evaluate livelihood vulnerability to climate change impacts in the communities in which they work and to develop programs to strengthen the most vulnerable sectors. This study showed general and site-specific factors contributing to different components of vulnerability (exposure, sensitivity and adaptive capacity) for mixed agro-livestock smallholders. The findings can be used by the government of Ethiopia as well as AID agencies to reduce vulnerability and enhance adaptive capacity of both the LSB and USB basins. In addition, income and livelihood diversification may be one of the options to reduce vulnerability in all districts.
Acknowledgments
Authors would like to thank the Bahir Dar University administration and the Blue Nile Research Institute for their financial and material support. Additionally, our appreciation also goes to the district agricultural office of the Lake Tana Sub-basin, Amhara National and Regional Government for their contribution of various secondary and primary data, materials and logistics support. We are also grateful to the staff of the Ethiopian Meteorological Service Agency, especially in the data distribution centre for the provision of raw data and Ministry of Water Resources for allowing me to get level of Lake Tana Sub-basin raw data.
References
1. Ministry of Economic Development and Cooperation (MEDaC) (2011) Poverty situation in Ethiopia, Welfare Monitoring Unit, Addis-Ababa.
2. Amjath-Babu TS, Krupnik, TJ, Aravindakshan S, Arshad M, Kaechele H (2016) Climate change and indicators of probable shifts in the consumption portfolios of dryland farmers in Sub-Saharan Africa: Implications for policy. Ecological Indicators 67: 830-838.
3. Di Falco S, Veronesi M, Yesuf M (2011) Does adaptation to climate change provide food security? A micro-perspective from Ethiopia. American Journal of Agricultural Economics 93: 829-846.
4. Debela N, Mohammed C, Bridle K, Corkrey R, McNeil D (2015) Perception of climate change and its impact by smallholders in pastoral/agro-pastoral systems of Borana, South Ethiopia. Springer Plus, 4: 1-12.
5. Kelly PM, Adger WN (2000) Theory and practice in assessing vulnerability to climate change and facilitation adaptation. Climatic Change 47: 925–1352.
6. McCarthy JJ, Canziani OF, Leary NA, Dokken DJ, White KS (2001) Climate change 2001: Impacts, adaptation and vulnerability. Cambridge, UK: Cambridge University Press.
7. Canadian International Development Agency (CIDA) (2003) Methodology used in the CIDA study: An example of India. AIACC Asia-Pacific Region Open Meeting.
8. O’Brien K, Leichenko R, Kelkar U, Venema H, Aandahl G, et al. (2004) Mapping vulnerability to multiple stressors: Climate change and globalization in India. Global Environmental Change 14: 303–313.
9. Liu HL, Willems P, Bao AM, Wang L, Chen X (2016) Effect of climate change on the vulnerability of a socio-ecological system in an arid area. Global and Planetary Change 137: 1-9.
10. Xenarios S, Nemes A, Sarker GW, Sekhar NU (2016) Assessing vulnerability to climate change: Are communities in flood-prone areas in Bangladesh more vulnerable than those in drought-prone areas? Water Resources and Rural Development 7: 1-19.
11. Monirul Alam, Alam GM, Alam K, Mushtaq S, Clarke ML (2017) Vulnerability to climatic change in riparian char and river-bank households in Bangladesh: Implication for policy, livelihoods and social development. Ecological Indicators 72: 23-32.
12. Dow K (1992) Exploring differences in our common future(s): the meaning of vulnerability to global environmental change. Geoforum 23: 417–436.
13. Adger WN, Dessai S, Goulden M, Hulme M, Lorenzoni, I et al. (2009) Are there social limits to adaptation to climate change? Climatic Change 93: 335–354.
14. Architesh P, Upasna S, Ninan N, Anthony P (2013) Adaptive capacity contributing to improved agricultural productivity at the household level: Empirical findings highlighting the importance of crop insurance. Global Environmental Change 23: 782–790.
15. Teshome M (2016) Rural households’ agricultural land vulnerability to climate change in Dembia-woreda, Northwest Ethiopia. J Environmental System Research 5: 14.
16. Cutter S (2003) Vulnerability to environmental hazards. Soc Sci Q 84: 242–261.
17. Eakin H, Luers AL (2006) Assessing the vulnerability of social environmental systems. Annu Rev Environ Resour 31: 365–394.
18. IPCC (2001) Climate change: Impacts, adaptation, and vulnerability. In: McCarthy JJ, Canziani OF, Leary NA, Dokken DJ, White KS (eds.) Contribution of Working Group II to the Third Assessment Report. Cambridge University Press, Cambridge, UK.
19. Turner BL, Kasperson RE, Matson PA, McCarthy JJ, Corell RW, et al. (2003) A framework for vulnerability analysis in sustainability science. Proceedings of the national academy of sciences. 100: 8074-9.
CCI on Livelihood Types (%) LSB USB Test of difference b/n the same category Test of the r/ship b/n variables (CCI & sub-basin
t-test P-value X2- test P-valueField crop 100 94.44*** -3.139 0.002 9.898 0.002Vegetable 77.46 86.51** 1.987 0.048 4.654 0.098
Cattle 94.77 93.65 -0.409 0.683 1.627 0.653Goat/sheep 76.16 97.62*** 5.387 0.000 28.11 0.000
Poultry 71.68 81.75** 2.018 0.045 4.774 0.092Beekeeping 41.62 32.54 1.600 0.111 3.285 0.194
Fishing 61.90 34.40*** -4.823 0.000 26.206 0.000Mining 29.07 09.60*** -4.181 0.000 18.091 0.000
* Significant at 10%, ** significance at 5% and *** significant at 1% level of significance.Lake Tana Sub-basin (LSB); Upper Sub-Basin (USB); Climate Change Impact (CCI).
Table 9: Households (HH’s) responses to the occurrence of climate change impacts on livelihoods.
Citation: Legese SA, Olutayo OA, Sulaiman H, Rao P (2016) Assessing Climate Change Impacts in the Lake Tana Sub-Basin, Ethiopia Using Livelihood Vulnerability Approach. J Earth Sci Clim Change 7: 368. doi: 10.4172/2157-7617.1000368
Page 10 of 10
Volume 7 • Issue 9 • 1000368J Earth Sci Clim Change, an open access journalISSN: 2157-7617
20. Gan Y, Siddique KHM, Turner NC, Li XG, Niu JY, et al. (2013) Chapter Seven- Ridge-furrow mulching systems—An innovative technique for boosting cropproductivity in semiarid rain-fed environments. In: Donald LS (Ed.), Advancesin Agronomy. Academic Press 118: 429-476.
21. Etwire PM, Al-Hassan RM, Kuwornu JKM, Osei-Owusu Y (2013) Application of livelihood vulnerability index in assessing vulnerability to climate change andvariability in Northern Ghana. J Environ Earth Sci 3: 157–170.
22. Pandey R, Kala S, Pandey VP (2014) Assessing climate change vulnerability of water at household level. Mitig. Adapt Strateg Glob Change 20: 1471
23. Shah KU, Dulal HB, Johnson C, Baptiste A (2013) Understanding livelihoodvulnerability to climate change: applying the livelihood vulnerability index inTrinidad and Tobago. Geoforum 47: 125–137.
24. Aryal, A, Brunton D, Raubenheimer D (2014) Impact of climate changeon human-wildlife-ecosystem interactions in the Trans-Himalaya region ofNepal. Theoretical and applied climatology 115: 517-529.
25. IPCC (2007a) Climate Change 2007 Impacts, Adaptation, and Vulnerability.Contribution of Working Group II to the Fourth Assessment Report (Ch. 9).Cambridge University Press, Cambridge, UK.
26. IPCC (2007b) Climate Change: The physical science basis. Contributionof working group I to the Fourth Assessment Report (Ch. 11). CambridgeUniversity Press, Cambridge, UK.
27. Thomas D, Osbahr H, Twyman C, Adger N, Hewitson B (2005) Adaptive:Adaptations to climate change amongst natural resource-dependent societiesin the developing world: across the Southern African climate gradient. TyndallCentre for Climate Change Research. Technical Report 35.
28. Chambers R, Conway G (1992) Sustainable rural livelihoods: Practicalconcepts for the 21st Century. Institute of Development Studies, UK.
29. Koen V, Bruno V, Kitessa H, Bart M (2015) Carbon and biodiversity inthe Afromontane landscapes of South West Ethiopia. J Forest EcologyManagement 343: 22–33.
30. Central Statistical Agency (CSA) (2008) Central Statistical Agency Populationand Housing Census of Ethiopia, Addis Ababa. Retrieved August, 2013, fromCSA database.
31. Mulugeta M. Aster G, Ermias A, Achim B (2015) Tree dieback affects climatechange mitigation potential of a dry afromontane forest in northern Ethiopia.Journal of Forest Ecology and Management 344: 73–83.
32. Yihenew G, Fentanesh A, Solomon A (2015) The effects of land use types,management practices and slope classes on selected soil physico-chemicalproperties in Zikre watershed, North-Western Ethiopia. Journal of Environmental Systems Research 4: 3.
33. Di Falco S, Yesuf M, Kohlin G, Ringler C (2012) Estimating the impact of climate change on agriculture in low-income countries: Household level evidence from the Nile Basin, Ethiopia. J Environ Resource Econ 52: 457–478.
34. NMSA (National Meteorological Service Agency) (2007) Climate ChangeNational Adaptation Program of Action (NAPA) of Ethiopia. NMSA, AddisAbaba.
35. Hurni H (1993) Land degradation, famine, and land resources scenarios inEthiopia. In: Pimentel D. (ed.), World Soil Erosion and Conservation, Cambridge University Press, UK, 28-61.
36. Mamauag SS, Aliño PM, Martinez RJS, Muallil RN, Doctor MVA, et al. (2013) A framework for vulnerability assessment of coastal fisheries ecosystems to climate change—Tool for understanding resilience of fisheries (VA–TURF). Fisheries Research 147: 381-393.
37. Cochran WG (1977) Sampling techniques (3rdedn.). New York: John Wiley &Sons.
38. Boddiger D (2007) Boosting biofuel crops could threaten food security. Lancet370: 923–924.
39. Patz JA, Campbell-Lendrum D, Holloway T, Foley JA (2005) Impact of regional climate change on human health. Nature 438: 310–317.
40. Aymone GG (2009) Understanding farmers’ perceptions and adaptations toclimate change and variability, International Food Policy Research Institute(IFPRI)-wide discussion paper series 00849, Retrieved from April, 2013.