journal of accounting &economids - temple …banker/accounting/11 a field study of the...a field...
TRANSCRIPT

JOURNAL OF Accounting &Economids
ELSEVIER Journal of Accounting and Economics 21 (1996) 195 226
A field study of the impact of a performance-based incentive plan
Rajiv D. Banke r *'a, S e o k - Y o u n g Lee b, G o r d o n Po t t e r c
aCarlson School of Management, University of Minnesota, Minneapolis, MN 55455, USA bDepartment of Management, Sun,qshin Women's University, Seoul, South Korea
CSchool of Hotel Administration, Cornell University, Ithaca, NY 14853, USA
(Received December 1992; final version received July 1995)
Abstract
Much m a n a g e m e n t account ing research focuses on design of incentive compensa t ion contracts . A basic assumpt ion in these contrac ts is tha t per formance-based incentives improve employee performance. This paper reports on a field test of the mult i -per iod incentive effects of a per formance-based compensa t ion plan on the sales of a retail es tabl ishment . Analysis of panel da ta for 15 retail outlets over 66 mon ths indicates a sales increase when the plan is implemented, an effect tha t persists and increases over time. Sales gains are significantly lower in the peak selling season when more t empora ry workers are employed.
Key words: Incent ive compensa t ion; Pay-for-performance; Agency theory; Field study; Retail sales
J E L classification: C93; J33; J41; L81
*Corresponding author.
We are grateful to Carla Ailes, Delores Boehme, Judy Carlson, Robert Girling, Louise Hanne, Birch Holt, Spencer Johnson, Ann Rasmussen, David St. Clair, Joan Starr, and especially Robert Klein and Ertugrul Tuzcu, for providing their time and access to data that made this study possible. Helpful comments and suggestions from Ross Watts (the editor), an anonymous referee, and seminar participants at the 1992 annual meeting of the American Accounting Association, Boston College, Boston University, Carnegie Mellon University, City University of Hong Kong, City University of New York, Cornell University, Dartmouth College, Hong Kong University of Science and Techno- logy, Indiana University, University of Michigan, University of Minnesota, and Vanderbilt Univer- sity are gratefully acknowledged. Seok-Young Lee acknowledges partial research support from the Sungshin Women's University.
0165-4101/96/$15.00 i)' 1996 Elsevier Science B.V. All rights reserved SSDI 01 6 5 - 4 1 0 1 ( 9 5 ) 0 0 4 1 8-1
196 R.D. Banker et al. /Journal of Accounting and Economics 21 (1996) 195-226
1. Introduction
Over the past two decades much management accounting research has addressed the optimal design of incentive compensation contracts. Theoretical models are developed based on the assumption that monetary incentives can improve performance by inducing higher levels of effort. Considerable empirical research in accounting and economics has investigated the predictions of these models by examining the structure of executive compensation contracts and their link with firm performance. While this prior research primarily examines the s tructure of compensation contracts for top executives, our focus is on the impact of a pay-for-performance plan implemented for front-line workers. Spe- cifically, we report on a field test of the multi-period incentive effects of a perfor- mance-based compensation plan implemented by a major retailer for its sales consultants.
Many firms have recently implemented output-based incentive plans that link compensation to measured performance for employees at every level, not just for those at the top (Schlesinger and Heskett, 1991b). Interest in the effect of such incentive plans on worker performance dates back at least to the scientific management studies of Taylor (1911). Much of the related evidence, however, is either anecdotal, or limited to analysis of data for relatively short periods of time without controlling for other factors influencing performance. Some empirical and experimental evidence reported in the organization behavior and related literatures, in fact, cautions against expecting the provision of monetary incen- tives to translate into improved performance (Pearce, Stevensen, and Perry, 1985; Hogar th et al., 1991). 1
In contrast to the prior research in these literatures, our study presents a longitudinal examination of the multi-period impact of an incentive plan at several stores operated by a major firm in the department store industry. The stated objective of this plan is to motivate sales personnel to provide enhanced customer service. The plan provides sales personnel with a bonus payment, in addition to their base hourly wage, for exceeding a prespecified sales goal. It also provides for possible termination of employment in case the sales target is not met in two consecutive quarters. Monetary incentives are particularly important in this firm because they comprise about 20% of base wages, and other reward mechanisms such as promotions are not readily available in a relatively flat
1In the organization behavior literature dating back to the 1960s, expectancy theory (Vroom, 1964) and goal-setting theory research (Locke, Bryan, and Kendall, 1968) based on laboratory experiments suggest a link between monetary incentives and performance under controlled situations. However, cognitive constraints limiting the ability of human decision makers to process complex long-term implications of their actions, and the potentially adverse signal conveyed by monetary incentives when tasks are interesting for their own sake, have been suggested in this literature as limiting the descriptive validity of this theoretical link in actual mulli-period settings.

R.D. Banker et al. /Journal o f Accounting and Economics 21 (1996) 195 226 197
organization. Prior to the plan's implementation, salesforce compensation was based primarily on seniority, not performance. Moreover, the firm implemented the plan on different calendar dates at only 15 of the 34 retail outlets it operates over a relatively homogeneous geographic region. This provides us with a natu- ral control group for our study.
Economic theory of incentives predicts that the implementation of a sales- based bonus plan induces greater effort and also attracts more productive workers and, therefore, on average higher levels of sales are realized. Further- more, the theory predicts that any realized sales gains on implementation persist and even increase as workforce composition changes. Sales gains will increase if customer service is enhanced as expected by firm management because customer satisfaction results in repeat customer purchases in subsequent periods. Finally, because temporary employees cannot trade-off current customer service effort against future multi-period payoffs due to repeat sales to customers, the extent of sales gains is predicted to be lower in peak sales periods when more temporary workers are employed. Our econometric analysis of pooled cross- sectional and time-series data for 15 outlets over a 66-month period provides empirical support for these period-specific hypotheses.
The paper is structured as follows. Section 2 describes the research site and the nature of the performance-based contract. Section 3 develops the hypotheses to be tested based on predictions from economic theory of incentives. The model and estimation procedures are described in Section 4. Empirical results are discussed in Section 5 and sensitivity analysis is presented in Section 6. Conclud- ing remarks are offered in Section 7.
2. Research site
Incentive plans in the retail industry
The past decade has evidenced a concerted effort by many firms to motivate employees to improve performance. Twenty-three percent of the firms in a Coopers and Lybrand (1992) survey indicated that they are implementing new performance-based incentive plans for their employees. In order to deliver quality customer service, many retailers such as Nordstrom, Bloomingdale's, Rich's, Macy's, Carter Hawley Hale, and the Bon (in Boise, Idaho), have implemented or expanded their incentive pay plans (Ginsberg 1989; Barmash, 1989; Lloyd, 1989). Schlesinger and Heskett (1991a) report that Nordstrom, Younkers, and Dayton Hudson have implemented performance-based compen- sation plans intended to produce 'extra employee effort' leading to 'extraordi- narily responsive service'. An Ernst and Young survey of the retail industry (Bivins, 1989) indicates that most department stores currently offer incentive programs such as straight commissions, base salary plus commission, and quota

198 R.D. Banker et aL / Journal q]'Accounting and Economics 21 (1996) 195 -226
bonus programs. Although these programs can add to payroll costs, the survey respondents indicated that they believe these plans have contributed to major improvements in customer service.
Not all retailers, however, are pleased with the performance implications of their output-based plans. Women's Wear Daily (January 16, 1991) reports that Carter Hawley Hale Stores cut its sales commission dramatically and returned to an hourly wage system in four of its divisions. Sears faced a union-organizing drive and a lawsuit from employees. The Wall Street Journal (Schwadel, January 13, 1990) reports: 'The fuss at Sears... reflects industry-wide skepticism among salespeople about retailers' efforts to shift their compensation to commis- sions from guaranteed hourly wages'. Moreover, Simons and Weston (1991) cite complaints by Nordstrom employees which suggest that focusing behavior on retail sales can lead to a feeling of intense competition among sales consul- tants which, in turn, can result in resentment that they are being 'used' by management. 2
An article in Forbes (Koselka, 1991) notes a 36% increase in retail square footage and a drop of 16% in retail sales per square foot in the last decade, and suggests that increasing sales productivity has become a competitive necessity for most retail firms. A N e w York Times article (Stevenson, August 27, 1989) reports: 'After years of concentrating on keeping costs low and luring customers with constant rounds of sale prices, the large department and apparel stores increasingly see competent service from an efficient, cheerful sales staffas the key to success in an increasingly competitive retailing environment...(Nordstrom's) success has spurred (its) rivals.., to initiate strategies like putting salespeople on commission, a step they hope will foster more helpful attitudes in their em- ployees.' A competitive strategy that features customer service led the firm that is the subject of our study to consider using an incentive compensation plan as a means to increase sales at its retail outlets.
Implementation of incentive plan
Our research site is a national retail firm that operates a number of depart- ment stores selling similar merchandise. While the stores cover a large geo- graphic area, most of the stores are located in or near shopping malls or urban areas. The company initiated its performance-based incentive plan in 1987 to support its stated firm-wide strategy of 'customer emphasis' with 'employee empowerment'. Examination of internal correspondence related to the design of
2Baker (1990, p. DI) writes: '... dissent salespeople complain about intense competition between salespeople. Often cited is the court case in King County, Washington, where a jury awarded $180,000 to a former Nordstrom saleswoman who claimed that she was wrongfully dismissed because co-workers wrote anonymous letters claiming that she stole from them by falsely crediting herself with their commissions'.

R.D. Banker et al. / Journal o f Accounting and Economics 21 (1996) 195 226 199
the incentive plan indicated that management expected the plan to result in further enhancement of customer service and consequently in an increase in store sales. Documents distributed to the workers describing the plan also stressed enhanced customer service as its objective.
While we initially selected the firm because of our access to its senior managers, we pursued this research study because it presented a unique oppor- tunity for an experimental design that allowed us to specify and test formal hypotheses about multi-period impacts of the incentive contract. We spent a total of 196 hours at the research site interviewing personnel from human resources, finance, accounting, information systems, and stores departments; meeting with staff working directly with store personnel; visiting retail stores; and collecting relevant data from the company 's accounting records.
The plan was implemented in stores sequentially as company managers intended to examine and evaluate the plan's impact on sales and customer satisfaction. Initially, the firm selected one store from a group of similar stores to begin the implementation. By the end of 1988, four stores had implemented the plan and another seven were added in 1989. In 1990, four more stores imple- mented the plan, bringing the total to 15 out of a total of 34 in this geographic region. Senior managers in finance, human resources, and stores (sales) depart- ments involved in the design and implementation of the plan assured us that stores were chosen initially for implementation only because they were represen- tative of others. Detailed examination of internal correspondence did not reveal any other special consideration in their selection. Company managers decided to hold back some stores until they had assessed the plan's impact on salesforce performance. They closely monitored the sales of the first few stores that implemented the new compensation plan by comparing their sales against the sales of a control group of stores. Sequential implementation was also necessi- tated by the limited number of headquarter staff personnel who were present on site during the initial phases of a store's implementation to explain plan details.
The performance-based incentive plan is best described as a bonus program. At the time of the plan's implementation, sales consultants received little in the form of annual merit increases, and promotions were rare. Bonus payment became the only significant reward for high performance. Each week sales consultants are paid a base hourly rate times hours worked. Under the plan sales consultants can increase their remuneration by receiving a cash bonus at the end of each quarter if the quarterly sales generated by the employee exceed a quarterly sales goal. Failure to meet the goal in two successive quarters may result in termination of employment. Prespecified sales goals are established for each employee based only on the individual's base hourly rate, and department or merchandise group. The bonus is computed as a fixed percentage of the excess sales (actual sales minus prespecified sales goal) by the employee in a quarter. Under the plan, sales department supervisors and managers are also paid a quarterly bonus as a percentage of excess sales. The bonus percentage for

200 R.D. Banker et al. / Journal o f Accounting and Economics 21 (1996) 195 226
these managers is set at one half the bonus rate used for sales consultants. Hence, all operations personnel at the stores who are directly responsible for customer service are covered by the new incentive compensation plan.
Senior managers regarded the incentive plan as a major change for the firm and its salesforce. They expected that the new incentive scheme would motivate many changes in employee behavior that would enhance customer service. Sales consultants were now expected to build a client base to generate repeat sales. Actions consistent with this approach include developing and updating cus- tomer address lists (including details of their needs and preferences), writing thank you notes, contacting customers about upcoming sales and new merchan- dise that matched their preferences, and retrieving merchandise from other departments. These changes in the activities of the salesforce necessitated changes in the role of sales managers. After the plan's implementation, the managers became responsible for supporting the consultants' customer service activities and their role became more of a facilitator as sales personnel gained more autonomy. The plan's implementation also required managers to deal with the administrative problems that result from the plan, such as consultants' demands for prime selling hours, disputes over credit for sales, and instruction to employees who had sub-par selling performance.
To aid the transition, plan implementation was preceded by a number of question and answer sessions and store visits by corporate staff. Prior to actually beginning the plan a party was staged for all store personnel. Corporate staff remained on site for a few months to help store management with the implementation. Because of the many changes, management expected that any sales increases might occur gradually as employees learned how to provide a higher level of service to customers and developed their client base. Personnel managers indicated to us that in November and December temporary em- ployees are used extensively. Company documents examined by us confirmed that compared to the other ten months, the increase in total hours employed in both plan and nonplan stores is almost 20% in November and December. Company officials were concerned that most temporary employees would have limited opportunity to use these new selling strategies emphasizing customer service. Therefore, although they expected sales to increase upon implementa- tion of the plan, and detailed contingent analyses had been prepared, they recognized that assessing the magnitude and persistence of sales gains given the many complexities of the plan and its environment was difficult.
3. Development of hypotheses
Agency theory is one paradigm that suggests a value for performance-based compensation. Examples of agency-theoretic models for examining salesforce compensation include Basu, Lal, Srinivasan, and Staelin (1985), Lal and Staelin

R.D. Banker et al. /Journal o f Accounting and Economics 21 (1996) 195 226 201
(1986), and Rao (1990). John and Weitz (1989) and Coughlan and Narasimhan (1992) use questionnaire surveys to examine factors influencing salesforce com- pensation structure. Empirical research on executive compensation contracts also draws on agency theory to evaluate the link between compensation and alterna- tive measures of performance (e.g., Jensen and Zimmerman, 1985; Murphy, 1985; Coughlan and Schmidt, 1985; Benston, 1985; Gibbs, 1995; Holthausen, Larcker, and Sloan, 1995). For instance, studies such as Lambert and Larcker (1987) and Sloan (1992) provide limited evidence in support of Banker and Datar's (1989) result that the weights placed on different performance signals, such as stock returns and accounting returns, are proportional to the sensitivity and precision of the signals. Antle and Smith (1986) and Jensen and Murphy (1990) find little empirical support for Holmstr6m's (1982) theoretical result that top executive contracts are optimally based on relative performance measures. However, Gibbons and Murphy (1990) find limited evidence that executive compensation is related to industry-adjusted rates of return. In an important article, Baker, Jensen, and Murphy (1988) synthesize the research in this field and reconcile empirical evidence with economic analysis of incentive contracts.
In the basic agency model, a principal designs a contract to motivate a risk- and effort-averse agent to exert unobservable effort in a production process that is characterized by uncertainty. Two optimization assumptions are maintained in this model. First, the principal is assumed to optimally choose a contract based on observable performance signals. Next, given the compensation con- tract, the agent is assumed to optimally trade-off disutility for higher effort against expected utility for higher incentive compensation resulting from im- proved performance. At our field research site, the intent of the management was to test and fine-tune the incentive plan that was implemented for front-line workers. Consequently, we do not expect that this performance-based incentive plan is optimal under the realized conditions nor do we test for its optimality? Our objective instead is to examine whether the performance of the agents changed on the implementation of the new incentive plan as if they were optimizing their effort choices given the contract.
Plan effect
Sales personnel in the retail industry expend considerable effort to provide customer service and to promote and obtain sales. At our research site, straight
3jensen and Murphy (1990, p. 246) note: 'the structure of the Holmstr6m model makes its conclusions irrelevant to most compensat ion con t rac t s . . . His model assumes that the principal knows the utility function of the (agents) as well as the production function relating actions to expected ou tcomes . . . (T)his means that (the principal) knows with certainty all possible actions of the (agents). . . the distribution of outcomes of each ac t ion . . . (and) the set of optimal.., actions. It is unlikely that these conditions are often satisfied'.

202 R.D. Banker et al. / Journal (?./'Accounting and Economics 21 (1996) 195 226
sa lary had been used for the salesforce p r io r to incentive plan implementa t ion . To the extent these flat sa lary levels were above the workers ' going rate, efficiency wage theory suggests that employees had the incentive to exert higher than the min imal effort in o rde r to ma in ta in their current employment . Fur ther , to the extent that sales supervisors and manage r s p rov ided (imperfect) mon i to r - ing of sales consu l tan t s ' effort, consu l tan t s were mo t iva t ed to direct their effort in the desired direct ion. However , supervisory mon i to r ing con t inued after the imp lemen ta t i on of the new incentive plan, and the base salary under the new plan was ma in t a ined at the old level. Therefore, agency theory predicts that the imp lemen ta t i on of this new pe r fo rmance -based incentive con t rac t will induce the sales consu l tan t s and manage r s to exert greater effort to genera te more sales. 4
Pe r fo rmance -based incentives also have tile effect of reveal ing the intr insic p roduc t iv i ty of sales consu l tan t s unknown to the firm (Murphy , 1986). If the more p roduc t ive workers have the bet ter outs ide oppor tuni t ies , imp lemen ta t i on of a pay- fo r -pe r fo rmance system ' a m o u n t s to offering a menu because it a l lows employees to de te rmine their compensa t i on by how hard they choose to work. Indeed, pay ing a wage that is based on measured per formance tends to a t t r ac t and retain the most p roduc t ive j o b app l i can t s and to d i scourage the least p roduct ive , to the employer ' s benefit ' (Mi lg rom and Rober ts 1992, p. 157). As a result, with more p roduc t ive sales consul tants , we expect sales to increase on the imp lemen ta t i on of the new pe r fo rmance-based incentive plan. To test this basic predic t ion , we specify the fol lowing hypothesis :
HI: Ceteris paribus, sales increase.following the implementation o f the perfor- mance-based compensation plan.
While the economic a rguments suppor t ing this hypothes is are intuit ive, p r io r work in the o rgan iza t ion theory l i te ra ture presents con t r a ry evidence. Pearce, Stevensen, and Per ry (1985) repor t no d iscernable effect on per fo rmance when a new incentive compensa t i on plan based on per fo rmance measures such as c la im t u r n a r o u n d t ime was implemen ted for social securi ty admin i s t ra to r s .
'*The ability of the incentive plan to motiwlte increased effort by employees may be attenuated by potential ratcheting effects. The ratcheting effect is a multi-period incentive problem which arises from the tendency of firms to use the most current performance as a criterion in determining the next period's goal (Weitzman, 1980; Homans, 1952). For instance, Clawson (1980) finds that because employers always adjusted the rate they paid to piecework employees downward, piecework incentives rarely worked in the early 1900's as workers quickly learned to restrict output. Dis- cussions with senior managers at our research site, however, indicated that performance goals under the plan were based on industry standards and therefore they did not intend to make any adjustments. Examination of company records also confirmed that no changes occurred during the period of our study. Therefore, we do not expect that dysfunctional behavior was induced by the ratcheting phenomenon.

R.D. Banker et al. / Journal of Accounting and Economics 21 (1996) 195-226 203
Reviewing exper imenta l research, H o g a r t h et al. (1991, p. 735) state: ' I t would be naive to assert that incentives a lways improve performance ' . They cite Deci and Ryan (1985), Lepper , Greene, and Nisbe t t (1973), and Levine and F a s n a c h t (1974) who repor t that in per forming a task tha t subjects find intr insical ly interest ing, i n t roduc t ion of m o n e t a r y incentives decreases subsequent interest and pe r fo rmance because incentives are ' exper ienced as con t ro l l ing and they frequent ly convey a sense of incompetence ' . 5
Behaviora l research in accoun t ing also ques t ions the abi l i ty of m o n e t a r y incentives to improve performance. Awas th i and Pra t t (1990) repor t that provis- ion of m o n e t a r y incentives does not result in improved per fo rmance for subjects with low intui t ive and percep tua l abil i t ies to per form a complex task. Ash ton (1990) appea ls to p r io r research in psycho logy (Condry , 1977; Guzzo , Jette, and Katzel l , 1985; Jenkins, 1986; M c G r a w , 1978; Thaler , 1986) that suggests that while f inancial incentives improve per fo rmance if the task is ' bor ing or m o n o t - onous ' or if ' so lu t ions involve s t ra ight forward , pe rhaps mechanica l so lu t ion p rocedures that c lear ly exist ' , such incentives are de t r imenta l if the task is ' in teres t ing for its own sake ' and if it involves 'ne i ther a clear so lu t ion p rocedure nor an obv ious way to create or d iscover one'. Ash ton finds tha t m o n e t a r y incentives increase pe r fo rmance pressure on a subject, and the increased pres- sure ha rms per fo rmance when the task is d e m a n d i n g and has a high level of preexis t ing pressure. 6 Because enhanced cus tomer service requires more creat ive app l i ca t ion of effort by sales consu l tan t s in a high pressure set t ing where poo r pe r fo rmance may result in t e rmina t ion of employment , the above studies sug- gest that the in t roduc t ion of m o n e t a r y incentives may have a de t r imenta l effect on per formance . O u r s tudy, therefore, serves as a test of the external val idi ty of these exper iments .
Y e a r e f fec t
The conven t iona l w i sdom in the retai l indus t ry is that m o n e t a r y incentives l inking pay to pe r fo rmance mot iva te sales consu l tan t s to p rov ide bet ter cus- tomer service (Schwadel , 1990). Discuss ions with c o m p a n y personnel and
SSimilar arguments are also presented in popular magazines. For instance, Kohn (1988) states that monetary rewards 'encourage people to focus narrowly on a task, to do it as quickly as possible, and to take few risks ... Extrinsic rewards can erode intrinsic interest ... (and), people come to see themselves a being controlled by a reward'. See also Baker, Jensen, and Murphy (1988) for a review of this literature. They note in particular that it is not that monetary incentives do not work, rather they work too well in focusing attention to measured outcomes linked with incentives to the exclusion of other desired outcomes.
6In contrast to these papers, Libby and Lipe (1992) document in their experimental study that performance-based incentives increase effort, and consequently improve performance, when the outcome is sensitive to the effort level.

204 R.D. Banker et al. /Journal o f Accounting and Economics 21 (1996) 195-226
examination of company documents revealed that a similar expectation about enhancement in customer service existed at our research site when the new pay-for-performance plan was implemented. The agency-theoretic notion of 'higher effort' translates in the retail industry into sales consultants developing and maintaining greater information about the wants of the customers, and working to satisfy those wants, thus leading to a higher level of customer satisfaction. While these actions drive current-period sales, they will increase future sales as well, as sales personnel build their own client bases and satisfied customers generate repeat purchases. The cumulative benefits from a sustained higher level of effort under the incentive plan imply, therefore, that the sales gains in subsequent periods will be greater than the gains obtained immediately on implementation.
A concern about this prediction stems from the possible multidimensionality of agents' effort. If the sales consultants direct more effort to enhance customer service, as company management expects, then both current and future sales will increase. However, sales consultants may direct their effort to increase current sales without enhancing customer service. For instance, a Wall Street Journal article (Yin, 1992) reports the California Depar tment of Consumer Affairs' finding that Sears, Roebuck & Co. overcharged auto-repair customers nearly 90% of the time, by an average of $223, for additional and more expensive repairs than were needed. The department believed that the overcharges resulted because of pressure on repairmen to meet quotas of parts and service repair sales for every eight-hour shift.
Such behavior is predicted by Holmstr6m and Milgrom's (1991) two-dimen- sional effort model where the outcome (e.g., customer service) of one of the effort dimensions cannot be measured at all. If monetary incentives are based on the outcome (e.g., current sales) of the other effort dimension, then dysfunctional behavior ensues with excessive effort being directed to the effort dimension being rewarded by performance-based incentives. However, in a multi-period situation such as the one we encounter at our research site, sales in future periods serves as a comparable, though less precise, measure of the customer service effort dimension. Therefore, agents will consider the two measures (current sales and future sales) on which their monetary incentives are based, and both the precision and the sensitivity of the two measures will influence the impact of incentives on effort (Banker and Datar, 1989; Feltham and Xie, 1994). To the extent that the customer at a department store is as well informed about his/her wants as the salesperson (unlike the auto-repair case mentioned earlier), the ability of a salesperson to increase current sales without providing better customer service is limited. Therefore, the sensitivity of the measure (future sales) for customer service effort dimension is higher, even though its precision is lower than that of the short-horizon (current sales) effort dimension. As a result, for salespersons with a longer multi-period decision horizon, provision of incentives based on sales performance is likely to enhance effort along both dimensions,

R.D. Banker et al. / Journal of Accounting and Economics 21 (1996) 195 226 205
rather than only one to the exclusion of the other as in the Holmstr6m Milgrom model.
Sales gains are also expected to increase over time if provision of incentives motivates employees to learn improved ways of performing their tasks over time. Economic theory suggests that workers with a longer multi-period deci- sion horizon will devote some of their effort to learn more productive ways to perform their tasks if they are provided incentives based on improved perfor- mance. Latham and Dossett (1978), for instance, found that incentive wages led to animal trappers learning new ways to identify 'active' animal lairs. Learning effects occur as workers become more familiar with their new responsibilities, adopting more productive procedures and eliminating unproductive activities (Wagner, Rubin, and Callahan, 1988). 7
Sales gains may also increase over time as less effective employees, unhappy with the new performance evaluation program, leave and are replaced by personnel with higher intrinsic ability, who prefer output-based compensation plans (Rao, 1990). As noted earlier, economic theory suggests that in such adverse selection situations involving a pool of workers with different levels of intrinsic ability, a contract that is contingent on performance will induce a separating equilibrium with the higher-ability workers optimally accepting the contingent contract and the lower-ability workers rejecting it. In effect, we expect that over time the firm will attract more high-ability workers and retain such workers already in its employment, but lose the lower-ability workers in its employment at the time the new incentive contract was implemented.
That sales gains will increase over time is predicted by all three explanations: the effect of increased customer satisfaction, the effect of consultants learning improved methods, and the adverse selection effect of attracting more produc- tive workers. With our data limited only to store sales during our sample period, we cannot discriminate between these competing explanations. Instead, we limit ourselves to the more modest task of testing the following hypothesis:
Hz: Ceteris paribus, sales 9ains realized on the implementation of the perfor- mance-based incentive plan persist and increase over time.
In contrast, sales increases realized during the initial stages of the new plan may be explained by the fact that the sales personnel are being given special attention and are enjoying the novel experience. To the extent such a placebo or so-called Hawthorne Effect (Roethlisberger, 1977) is driving performance, sales
VHowever, recent behavioral studies (Kanfer and Ackerman, 1989; Wood, Bandura, and Bailey, 1990) suggest that the presence of monetary incentives diverts needed attention from 'a concern about how to do" a complex task to 'how well one is doing', thus inhibiting learning of that task. Such a shorter-term focus on current output implies that sales gains will not increase over time if sales personnel do not invest their effort in learning the complex tasks in retail selling.

206 R.D. Banker et al. / Journal q[Accounting and EconomRs 21 (1996) 195 226
gains are expected to diminish or even disappear over time (Schlesinger and Heskett, 1991a). While the Hawthorne experiments are popularly associated with the effect of temporary productivity gains arising only because of increased attention during the experiment, careful statistical analysis of the Hawthorne data has revealed a persistent gain due to a learning effect in the presence of increased monetary incentives and performance feedback (Parsons, 1974; Pitcher, 1981). An alternative reason to expect only transient gains is that they arise because of increased monitoring associated with the presence of corporate staff during the implementation phase of the plan. Performance gains attribu- table to this increased monitoring diminish as the involvement of corporate staff at the plan site and in carefully watching and comparing store sales is reduced.
S e a s o n a l e f f ec t
The seasonal nature of the retail business requires firms to hire temporary employees during busy seasons. This fact motivates a further hypothesis derived from the multi-period nature of the impact of higher effort. A permanent sales consultant will take into account the present value of expected future bonuses, and weigh it against the disutility for higher effort. In contrast, a temporary employee has only a short-term focus. This difference in incentives implies that a permanent sales consultant will work more to build a client base than a temporary salesperson. 8 If improved customer service is the predominant means for increasing sales, then the lower effort by temporary workers implies lower sales, on average. In a similar vein, because temporary workers have less incentive to devote effort to learn the retail selling task, they will exhibit lower sales gains. Also, temporary workers may not be as skilled as permanent workers in providing superior customer service and, as a result, the introduction of the incentive plan may not result in as high an improvement in performance. We hypothesize, therefore, that the higher the proport ion of temporary sales- people on the sales floor, the lower the impact of the performance-based program on sales. Because retailers hire considerably more temporary part-time employees for fourth-quarter (holiday season) business, we expect the sales impact of performance-based incentives to be smaller in the fourth quarter than in the other three quarters. Furthermore, many more transient rather than repeat customers shop in the holiday season. Because it is more difficult to provide high levels of service to nonregular customers, the incentive effects of the
8Schlesinger and Heskett (1991b) report that Sears found from its 1989 customer survey that 'the more a store relied on a continually changing group of part-timers, ... the lower the customer ratings it received. The higher its percentage of full-time and regular part-time workers, the more satisfied customers said they felt'.

R.D. Banker et aL / Journal of Accounting and Economics 21 (1996) 195 226 207
plan are reduced during the holiday season. Therefore, we test the following hypothesis:
H3: Ceteris paribus, the impact of the performance-based contract on sales in the fourth quarter is less than its impact in the other three quarters.
In contrast, if temporary workers can take actions that promote current sales, sacrificing future sales as in the Holmstr6m Milgrom (1991) model, they will have the incentive under the new compensation contract to do so; and as a result sales would increase in the period when more temporary workers are used. For instance, a temporary sales consultant will have incentives not to tell the customer to wait and buy the item later after it goes on sale. 9
4. Model specification
Empirical testing of the hypotheses derived in the previous section involves assessing the impact of the incentive plan on store sales. We obtained monthly store sales reports for a 66-month period (from February 1986 to July 1991) for the 15 stores that implemented the incentive plan and the 19 other stores in the same geographic region that did not. To estimate the plan's effect we specify the following model of sales in month t, t = 1 . . . . . 66, of each store s, s = 1 . . . . . 15, that implemented the plan:
15
SALESst = ~ (~D~ + fl~DsAVGCOSALt) + ).lD~SALES86~ s = l
P Y ~ p Q + 22D~tDst SALES86s + zaDstD~t SALES86~
+ 24 D e A VGCOSALt + 2sD~D~ A VGCOSALt
p Q + z6DstDst A V G C O S A L t + est,
where
SALESst A VGCOSALt
(1)
= sales of store s in month t, = average sales in month t of 19 'control' stores that did not
implement the incentive plan,
9Empirical evidence from prior research in the retailing literature suggests that part-time labor has a positive influence on sales productivity, and this influence is stronger for stores that emphasize customer service rather than stores that are primarily self-service (Thurik and Van der Wijst, 1984). One reason for this effect is that temporary employees seek full-time jobs within the organization, and expect to improve their prospects by exhibiting superior performance. Provision of monetary incentives therefore may not appreciably enhance this existing incentive.

208 R.D. Banker et al. /Journal (?/'Accounting and Economics 21 (1996) 195-226
SALES86~
O~ Ds~ Ds~
= average monthly sales of store s in fiscal year February 1986 to January 1987,
= 1 if store s, otherwise zero, = 1 if store is on the incentive plan, otherwise zero, = 1 if store has been on the incentive plan for at least one year,
otherwise zero, = 1 if fourth quarter of fiscal year, otherwise zero.
In this formulation store sales are specified as an intercept es plus a multiple (/~) of AVGCOSAL~. The [:~ parameters vary across stores principally due to relative store size; stores larger than the average 'control ' store have/?'s greater than one, smaller stores less than one. We compute the AVGCOSAL, measure for each month t using the 19 stores that did not implement the plan and thus control for changes in sales over time because of the potentially unique selling strategies of the firm as well as seasonal and regional economy-wide effects. We estimate the model's parameters using pooled time-series data over a 66-month period and cross-sectionally for the 15 stores that implemented the incentive plan.
Observe that we multiply each intercept shift term (the three terms with coefficients 21, 22, and ),3) by SALES86~, the average monthly sales for stores in fiscal year February 1986 to January 1987, the first year in our sample. If we had not multiplied by SALES86s, then the model would have implicitly restricted the impact of the plan to be equal across all 15 stores. But, intuitively, we expect sales gains to be higher for larger stores and lower for smaller stores. We examined this issue by estimating the model in (1) without multiplying the three terms by SALES86s, and correlating its residuals for months subsequent to the plan's implementation with SALES86 for each store. This correlation is signifi- cantly positive (p = 0.002) indicating that the plan impact varies directly with store size, and model (1) estimates will be potentially biased if we do not multiply the three intercept shift terms by SALES86 for each store.
We test for the hypothesized effects of the incentive plan on sales by examin- ing the intercept shift coefficients, 21, )~2, )-3, and slope shift coefficients, 24, 25, 26, in model (1). A positive 2 is interpreted as the incentive plan having a positive effect on sales. We estimate three versions of the model in (1), first with only slope shifts (setting 21 -- ),2 = ).3 = 0), second with only intercept shifts (setting ),4 = ),5 = ).6 = 0), and third with both slope and intercept shifts. The slope- shift model assumes that the impact of incentive plans is proport ional to the A VGCOSAL measure that varies considerably over time due to seasonal and economic factors, but is invariant across stores. The intercept-shift model assumes that plan impact is invariant over time except for the second-year and fourth-quarter effects modeled explicitly in (1). By estimating the three different versions of model (1), we seek to demonstrate the robustness of our results.

R.D. Banker et al. / Journal o f Accounting and Economics 21 (1996) 195-226 209
The first hypothesis, H~, states that sales increase on the implementation of the incentive plan. We test this hypothesis by examining whether the 21 (or 24) coefficient is greater than zero. The second hypothesis, H~, states that sales gains increase over time, and is evaluated by examining whether 22 (or 25) is greater than zero. If the change in performance during plan implementation is only due to the Hawthorne Effect, then a decrease in plan impact over time is expected, as reflected in 22 (or)~5) being less than zero. Finally, the third hypothesis, H3, states that sales gains are negatively related to the presence of temporary employees. Therefore, we test whether the average impact of the plan on fourth-quarter sales, when temporary employment is high, is less than that of the other three quarters, as reflected in 23 (or)~6) being less than zero.
Because we use time-series information to estimate the effect of the incentive plan on sales, serial correlation may bias the standard errors of the coefficients. We control for autocorrelation by using a variant of the Prais-Winsten (1954) estimator proposed by Park and Mitchell (1980) to make first-order autocorre- lation adjustments to the variables. This estimator is consistent and performs especially well for short time series and trended data relative to several other estimators (Doran and Griffiths, 1983). It also reduces the extent to which the autocorrelation coefficient tends to be underestimated (Kmenta and Gilbert, 1970). We test the hypotheses using the parameter estimates from the regression using the transformed variables.
We also expect to find heteroscedasticity, as the observations for larger stores are likely to have bigger variances. The initial OLS results using the Glesjer (1969) test confirm this suspicion as the absolute error terms are significantly correlated (Pearson correlation = 0.501, Spearman correlation = 0.376, p = 0.0001) with the square root of store size measured in square feet. Therefore, we conduct weighted-least-squares (WLS) estimation under the assumption that error term variances are proportional to square feet of store space. We also conduct tests using White's (1980) procedure to obtain consistent estimates of the standard errors from an OLS regression. Standard errors and coefficients were higher using White's procedure, but test results were similar.
5. Empirical results
Table 1 presents average statistics on store sales and square footage by existence of the incentive plan as of the end of our sample period. Because of the sensitivity of the information, the data have been disguised by multiplying by a scalar. The median square feet for the incentive plan and nonplan stores are identical, and the difference in the means is not statistically significant. There are also no statistically significant differences in store size measured in sales for fiscal year 1987-88, the year incentive-plan implementation began. This finding is consistent with management's intent to initially select representative stores for

210 R.D. Banker et al. /Journal of Accounting and Economics 21 (1996) 195 226
Table I Average size of retail outlets by incentive plan existence (means, with medians in parentheses below)
Stores Stores Statistical tests with plan without plan of difference
SQFEET (000's) 1987 88 227.52 220.42 p(t) = 0.88 (187.08} (187.08) p(z) = 0.66
SALES (millions) 1987 88 $43.03 $34.51 p(t) = 0.30 ($35.08) ($22.91 ) p(z) = 0.23
SALES (millions) 1990 91 $51.98 $38.15 p(t) = 0.14 ($43.(13) ($28.10) p(z) = 0.19
Number of stores 15 19
The mean values reported in the table are disguised by multiplying by a scalar. The statistical tests are not affected by this transformation.
Stores that have implemented the performance-based plan as of the end of the sample period are classified as 'stores with plan'.
p(t) = probability that the means of the two groups are equal. p(z} - probability that the medians of the two groups are equal. SQFEET - square footage of retail store in fiscal year February 1987 to January 1988. SALES = annual sales of retail store in fiscal year (in thousand dollars).
i m p l e m e n t a t i o n to he lp assess the i m p a c t o f the p e r f o r m a n c e - b a s e d c o m p e n s a -
t ion plan. As expec ted , the a v e r a g e sales for the p l an s tores h a v e g r o w n m o r e
t h a n t hose for the n o n p l a n s tores by fiscal year 1990 91, the last c o m p l e t e year
in o u r sample , bu t the di f ference is n o t s ta t i s t ica l ly s ignif icant . T a b l e 2 p resen t s
a c o m p a r i s o n of three key f inancia l r a t ios for the p l an a n d n o n p l a n stores. T h e r e are no s ta t i s t ica l ly s igni f icant d i f ferences in i nven to ry / sa l e s , and cos t of
sa les /sa les ra t ios for 1987-88 o r 1990 91. T h e s u p p o r t expenses / sa le s ra t io is
g r ea t e r on a v e r a g e for the n o n p l a n s tores , the di f ference is s ta t i s t ica l ly s igni f icant
for 1990 91.
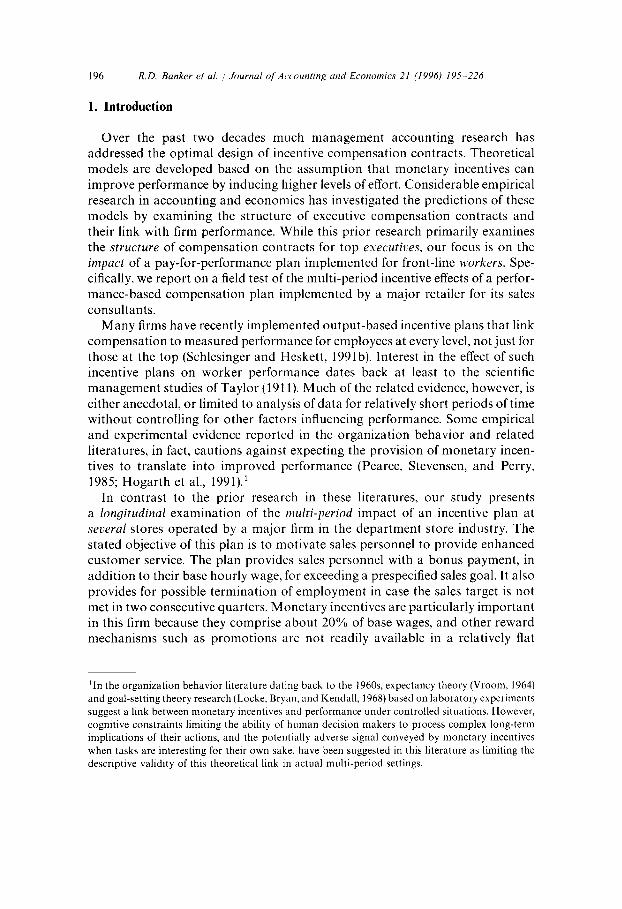
Fig. 1 p resen t s a p lo t of the a v e r a g e s t a n d a r d i z e d sales res idua ls for the 15
p lan stores. T h e res idua ls a re a l i gned in even t t ime wi th m o n t h 0 r ep r e sen t i ng
the da t e of the p lan ' s i m p l e m e n t a t i o n . T h e res iduals for each p l an s tore are
c o m p u t e d as p r e d i c t i o n e r ro r s f rom the fo l l owing mode l : 1°
S A L E S ~ t = ~ + [~ A V G C O S A L , + est. (2)
*°Residuals are standardized by dividing by the square-root of estimated variances, where the out-of-sample prediction error variances include an adjustment for increasing variance (Johnston,1984, p. 43). The apparent increase in monthly variability after the implementation date is explained by the fact that the number of observations decreases over time because of the sequential implementation of the plan.

R.D. Banker et al. / Journal o f Accounting and Economics 21 (1996) 195 226
Table 2
Mean financial ratios for retail outlets by incentive plan existence
211
Stores Stores Statistical tests Financial ratios with plan without plan of difference
Beg. inven tory 1987 88 4.220 4.220 p(t) = 0.45
Sales 1990 91 4.243 4.460 p(t) = 0.24
Cost of sales 1987 88 0.609 0.608 p(t) = 0.80
Sales 1990~91 0.616 0.612 p(t) = 0.38
Support expenses 1987 88 0.034 0.036 p(t) = 0.21
Sales 1991~91 0.028 0.033 p(t) = 0.002
The mean values reported in the table are disguised by multiplying by a scalar. The statistical tests are not affected by this transformation.
Stores that have implemented the performance-based plan as of the end of the sample period are classified as "stores with plan' .
p(t) = probability that the means of the two groups are equal.
Support expenses include indirect labor costs for stocking, cleaning, wrapping, and monitoring merchandise.
where C~s and [3s are stimated using data for up to 24 months prior to the implementation date. The graph reveals a steep increase in sales in the month of the plan's implementation, and that the sales gains persist and increase over the 24-month period following the implementation date. Statistical tests of the nature of performance change follow.
To assess the effect of the incentive plan on store sales, we present in Table 3 the results of WLS estimation of the regression model with Park-Mitchell transformations of the variables. Because there are numerous stores, we report only the coefficients relating to the incentive plan. The regression on the left (column 1) reports results of estimating the following model, restricting the intercept shifts in model (1) to be zero:
15 P SALESs, = ~ (~sDs + fi~Ds A VGCOSALt) + Z4Dst A VGCOSALt
S = 1
P Y P Q + 25DstDst AVGCOSALt + 26DstDst AVGCOSALt + ~t. (la)
Individual store coefficients fls ranged between 0.503 and 2.265, and averaged 1.140. The estimaed 24 coefficient is 0.105 with a t-statistic of 8.94, indicating that the incentive plan had a statistically significant positive effect on sales, thus supporting our first hypothesis. The estimated 25 coefficient (0.051, t-statistic 3.73) reveals that the impact of the incentive plan increases significantly over

212 R.D. Banker et al. / Journal ¢~/ Accounting and Economics 21 (1996) 195 226
2.2
E
E
E i
2.0
1.8
1.6
1.4
1.2
1.0
0.8
0.6
0.4
0.2
0.0
-0.2 V
-0.4
-0.6
-0.8
-24 -22
I I I I -20 -16 -12 - 8 - 4
-18 -14 -10 - 6 -2
I l I I I 0 4 8 12 16 20 24
2 6 10 14 18 22
Months before/after implementat ion
Model: SALES., = or, + 13, AVGCOSAL~ + e~ for each s = l , ... 15, where
SALES,, = Sales of store s in month t, AVGCOSAL, = Average monthly sales of the 19 company stores in the same geographic
region that did not implement the incentive plan, and
~ and [~s are estimated using monthly data for 24 months prior to the plan implementation. 15
Incremental Sales, (standardized) = Z (SALES,, - ~t s -[~ AVGCOSAL0/15 ~r~ar (e~ ) s= l
for t = -24 , . . -1 , 0, 1,...24, where t = 0 is the month of implementation.
Fig. 1. Plot of average incremental sales for 15 stores centered a round each store's own date of plan implementat ion.

R.D. Banker et aL /Journal of Accounting and Economics 21 (1996) 195 226 213
Table 3 WLS estimates of impact of incentive plan on sales (t-statistic in parentheses); n = 990, 15 stores for 66 months from February 1986 to July 1991
SALES~t = ~ (%D~ + fl~D~ A VGCOSALt) + 21D~ SALES86~ + 22D~D~ SALES86~ s 1
+ 23D~D~ SALES86~ + 24D~A VGCOSALt + 25D~D~ A VGCOSALt
+ 26D~D~AVGCOSAL, + e~ t
Parameter estimate Expected
Variable Parameter sign l 2 3
DPSALES86
DPD~SALES86
D~D~SALES86
D~AVGCOSAL
D~D~A VGCOSAL
D~D~A VGCOSAL
p(model) Adjusted R 2
p(21 = 3.4 = 0) p(22 = ;is = 0) p(23 = 26 = 0)
21
22
23
24
As
26
+ - - 0.102 (8.89)
+ 0.023 (1.77)
- 0.026 ( -- 2.13)
+ 0.105 (8.94)
+ 0.051 (3.73)
-- -- 0.056 ( - 4.72)
0.0001 0.0001 0.9781 0.9773
0.063 (3.43)
- 0.005 - 0.28)
- 0.004 - 0.25)
0.054 (2.82)
0.050 (2.56)
- 0.035 1.87)
0.0001 0.9786
0.0001 0.0027 0.0068
Os D~ D~ D~
SALES86
AVGCOSAL
p(model)
p(2i = 21 = 0)
= I if store s, otherwise zero.
= l if store is on the incentive plan, otherwise zero.
= 1 if store has been on the incentive plan for at least one year, otherwise zero.
= 1 if fourth quarter of fiscal year, otherwise zero.
= average monthly store sales in fiscal year 1986 87.
= average sales of 19 stores that did not implement incentive plan.
= probability that all model coefficients are zero.
= probability that coefficients 2~ and ,:o~ are both zero.
t i m e , s u p p o r t i n g o u r s e c o n d h y p o t h e s i s . T h e r e is n o i n d i c a t i o n t h a t t h e i m -
p a c t o f t h e p l a n h a s d i m i n i s h e d o v e r t i m e a n d , t h e r e f o r e , t h e p r e s e n c e o f t h e
H a w t h o r n e E f f e c t a s t h e p r i m a r y d r i v e r o f s a l e s g a i n s d u r i n g t h e e a r l y s t a g e s o f
i m p l e m e n t a t i o n is n o t d i r e c t l y s u p p o r t e d b y t h e d a t a . I t is p o s s i b l e , h o w e v e r ,
t h a t t h e i n c r e a s e o v e r t i m e d u e t o t h e m u l t i - p e r i o d e f fec t o f i n c e n t i v e s is
b e i n g p a r t i a l l y o f f s e t b y a n i n i t i a l p e r i o d H a w t h o r n e Ef fec t . T h e e s t i m a t e d 2 6

214 R.D. Banker et a L / Journal Of Accounting and Economics 21 (1996) 195 226
coefficient is - 0.056 with a t-value of - 4.72. This supports our third hypothe- sis that the sales impact of the plan is lower in the fourth quarter due to the higher proport ion of temporary employees in this quarter.
The estimated `( coefficients can be used to assess percentage increase in sales after the implementation of the incentive plan. The estimated average sales for a plan store s increase from [3s times AVGCOSAL to (//~ + `(4) times A VGCOSAL in the first year (except fiscal quarter 4) after implementation, and to (/3s + 24 + ,(5) times A VGCOSAL in the second year. Because the average fl.~ is 1.14 across all 15 stores, the average percentage increase is approximately 100 ,(4/1.14. The results in Table 3 imply that the average increase is about 9.2% (=0.105/1.14) in the first year after plan implementation and 13.7% ( = (0.105 + 0.051)/1.14) in the second year.
We present the results of estimating the intercept-shift-only version of model (1) in column 2 of Table 3. In this case, we estimate the following equation assuming error variances proportional to store size (WLS):
15
SALES~t = ~ (~sD~ + [~D~ A VGOSALt) + ).lDsVt SALES86~ S--I
. p Q + 22D~D~SALES86~ +/~30~tD~tSALES86s + c,~r. (lb)
The estimated `( coefficients confirm the results from the slope-shift model in column 1. There is an increase in sales on plan implementation averaging 10.2% of 1986 87 sales levels. Sales gains increase by an additional 2.3% (of 1986 87 sales) in the second year and the gains are lower by about 2.6% (of 1986 87 sales) in the fourth quarter.
The specification in column 3 of Table 3 permits both slope and intercept shifts as described in the full model (1). The significantly positive ,;q, `(4, and `(5, and the significantly negative 2(~ support our three hypotheses. The three F-tests in the last panel of the table also indicate that each of the three hypotheses (H~: 21 = 24 = 0, H2:`(2 = `(s = 0, and H3:23 = `(6 = 0) is rejected at the 1% level.
To further evaluate the robustness of our results, we reestimated the slope- shift and the intercept-shift models allowing for store-specific values of 2. By letting the 2 coefficients vary across stores, we allowed for the possibility that the plan impact is different for different stores without constraining this differential impact to be proport ional to store sales in 1986 87. Results of tests evaluating whether the average estimated value of each 2 over the 15 stores is zero are very similar to those reported in Table 3.
6. Sensitivity analysis
While our earlier models attribute the increase in sales to the implementation of the performance-based incentive plan, other factors may explain this result.

R.D. Banker et al. / Journal o f Accounting and Economics 21 (1996) 195 226 215
We investigate three potential alternative explanations: model specification, personal income growth differentials, and sales-related expenses.
Theoretical research in agency theory does not provide an exact functional form to link store sales with agent effort and incentive plan implementation. Therefore, we evaluate the robustness of our results by considering alternative model specifications. Monthly sales of all plan and nonplan stores move to- gether over time because of regional economic factors, seasonality in sales patterns, number of weekends and work days in a month, and company-wide advertising and promotions such as for special anniversary sales. Bivariate correlations between individual store sales for the 15 sample stores and A V G C O S A L over our sample period are high, ranging between 93% and 97%, thus indicating that the primary drivers of store sales are captured by company- wide factors. Therefore, we specify the ratio of store sales to A V G C O S A L as a function of hypothesized incentive plan effects as follows:
SALES~t 15 flsDs + ,~lDst + /'~2LIstLIst -~- / ~ 3 D s ~ D s t + est.
A V G C O S A L t - ~ = 1
The results in Table 4 reveal that a statistically significant 9.3% increase in relative sales gain occurred on plan implementation that increased further by
Table 4
W L S estimates of impact of incentive plan on relative sales (t-statistic in parentheses); n = 990, 15
stores for 66 months from February 1986 to July 1991
1 5 p Y P Q SALESs~/AVGCOSALt = ~ [3~D, + 21D,~ +/o2D~D~, + 23D~tDst + ~,~,
s = l
Variable Parameter Expected sign Parameter estimate
D e 21 + 0.093
(6.78) P Y Ds~D, 22 + 0.050
(2.78)
DeD~ 23 -- 0 .016
( - - 1.07)
p(model) 0.0001
Adjusted R z 0.9548
D~ = 1 if store s, otherwise zero.
D e = l if store is on the incentive plan, otherwise zero.
D~I = 1 if store has been on the incentive plan for at least one year, otherwise zero.
D~ = 1 if fourth quarter of fiscal year, otherwise zero.
SALES86 = average monthly store sales in fiscal year 1986 87.
A V G C O S A L - average sales of 19 stores that did not implement incentive plan.
p(model) = probability that all model coefficients are zero.

216 R.D. Banker et al. / Journal q f Accounting and Economics 2l (1996) 195 226
5.0% in the second year. The estimated lower relative sales gain of 1.6% in the fourth quar ter is not significant.
We also consider the possibility that managemen t selected the stores located in high growth areas for the initial implementa t ion of the incentive plan so that the measured increase in sales for plan stores would exceed that for n o n p l a n stores and, therefore, the implementa t ion of the new plan would appear success- ful. Table 5 reports average statistics for the annua l growth rates in total personal income for the county in which each store is located, classified by the existence of the incentive plan. Over the period from 1984 to 1987, growth in personal income was greater for the counties in which plan stores are located than for the counties in which n o n p l a n stores are located, but the difference is not statistically significant at convent iona l levels. However, from 1988 to 1990, the average growth rate in county personal income for the plan stores is significantly greater than that for the n o n p l a n stores. Because more disposable income is believed to translate into more sales, the pos t - implementa t ion sales gains identified in Tables 3 and 4 may be driven by differential personal income growth rates. To examine the impact of income growth on relative sales we reestimate (3) after including relative income growth terms as follows:
S A L E S ~ t 15 P ~ P Y
[:~D~ + ) ' R G I N C ~ , + AiDst -}- A2DstDst A V G C O S A L t ~ = 1
q_ /.3.t~,,stLi,;t'~ FIP13Q q_ 2 4 D ~ R G I N C s t + zsD~tD~tRGINC~t" e r
p Q + z 6 D ~ D ~ t R G I N C s t + est. (4)
Table 5 Average annual personal income growth rate for county of store location by incentive plan existence
Stores Stores Statistical tests with plan without plan of difference
Growth rate 1984-87, Mean 0.067 0.057 p(t) = 0.1702 (Median) 10.063) (0.060) p(z) = 0.2102
Growth rate 1988 90, Mean 0.072 0.059 p(t) = 0.0129 (Median) (0.070) (0.054) p(z) = 0.0515
Number of stores 15 19
Stores that have implemented the performance-based plan as of the end of 1990 are classified as 'stores with plan'.
p(t) = probability that the means of the two groups are equal. p(z) = probability that the medians of the two groups are equal. Growth rate = annual growth rate in county personal income.

R.D. Banker et al. / Journal o f Accounting and Economics 21 (1996) 195 226 217
The additional variable, RGINC, measures the annual growth rate in county personal income for a plan store relative to the annual personal income growth rate for the 19 regional stores that did not. 11 This model is based on the assumption that a A increase in relative income growth results in a 7A increase in relative stores sales, and that this impact increases to a (7 + 24)A increase after plan implementation.
Similar to the model in (1), we estimate slope-shift (21 = )~2 = 23 = 0), inter- cept-shift (24 = 25 = 26 = 0), and both-slope-and-intercept-shifts versions of the model in (4). Two results are evident from Table 6. First, RGINC significantly explains relative store sales. The 7 values of 0.957 and 0.963 in columns 1 and 2 are not significantly different from 1, indicating that relative store sales increase almost proport ionately with relative income growth. That is, a 5% increase in relative income growth results in a nearly 5% increase in relative store sales. Second, after controlling for relative income growth, the results in all three columns provide strong support for the first two hypotheses. The signs of all estimated 2 coefficients in the first two columns are in the hypothesized direction, but 23 and )°6 are not significant. 12
Table 7 presents results of estimating the model obtained by multiplying both sides of (4) by AVGCOSAL. This provides a model similar to model (1) estimated in Table 3. The regression in column 2 is identical to that in column 1 of Table 3 except for the addition of the relative growth term with the I' coefficient. The estimated 2 coefficients in this column of Table 7 are similar to, though slightly lower than, those obtained in the earlier regression suggesting that growth, while important, does not explain all of the increase in sales that coincides with the plan's implementation. Overall, the results in the table support all three of our hypotheses. 13
An alternative approach to modeling the impact of RGINC on store sales is to assume that the coefficient fls in model (1) representing the sales of a store s as a multiple of AVGCOSAL is not invariant over time, and the time-dependent fl~t increase for stores located in counties that exhibit a high personal income growth rate and decrease for other stores. To adress the nonstationarity of fist parameters, we write fl~t = 05~ RGIN~, where ~bs are stationary parameters to
1 Specifically, if l~y and IRr denote the personal incomes in a year y for the county of a store s and the entire region R respectively, then RGINCs, = (L~./1.~. 1987)/(IRy/Ig. 1987) where y is the year corres- ponding to the month t and where I~, 1987 and IR. 1987 denote the personal incomes in the year 1987.
~2Individual coefficients in column 3 should be interpreted cautiously as Belsley-Kuh Welsch diagnostics indicate high collinearity. The highest condition index is 90 for the regression in column 3, well above the highest condition index of 15 for column 3 in Table 3.
13Th e individual coefficients in column 3 of Table 7 should also be interpreted cautiously as the highest Belsley Kuh Welsch condition index is 156.

218 R.D. Banker et al. / Journal of Aecounting and Economics 21 (1996) 195 226
Table 6 W L S es t imates of impac t of incent ive plan and income g rowth on relat ive sales ( t-stat ist ic in parentheses); n = 990, 15 stores for 66 mon ths from Februa ry 1986 to July 1991
~ p Y ~ p Q ~ p SALES~/A VGCOSA Lt = flsD~ + ,,RGINC~, + 2 ID~ +/o2D~tD~, + z3D~,D~, +/.4D. RGINC, t s - i
+ 25DPDYRGINC~, + 26D~DQRGINCs, + ~.~,
P a r a m e t e r es t imate E x p e c t e d
V a r i a b l e P a r a m e t e r s i g n 1 2 3
RGINC ,,' + 0.957 0.963 0.737
(11.97) (12.26) (7.91)
D~ 2~ + 0.059 0.077 (4.70) (0.40)
P Y D~tD~ 22 + 0.035 0.333 (2.22) (1.63)
P (2 D~tD~, 23 -- 0.015 0.212 ( 1.10) (0.72)
D~ * RGINC )4 + 0.055 - 0.005 (4.58) ( -- 0.03)
D~D~ * RGINC )°5 + 0.031 - - - 0.269 (2.10) ( -- 1.41)
P Q D~,D~t * RGINC )~6 0.014 -- 0.215 ( - 1.10) (0.78)
p(model) 0.0001 0.0001 0.0001 Adjus ted R 2 0.9630 0.9633 0.9643
p(21 = 24 = 0) 0.0001 P(-)~2 = /]-5 = 0 ) 0 . 0 0 7 1
p(23 = 26 = 0) 0.3483
RGINC D~
D~
p(model) p(2~ = ;~i = O)
= relat ive g rowth in personal income of county of s tore locat ion. = 1 if s tore s, o therwise zero. = 1 if s tore is on the incent ive plan, o therwise zero. = 1 if s tore has been on the incent ive p lan for at least one year, o therwise zero. = 1 if fourth quar te r of fiscal year, o therwise zero. = p robab i l i t y tha t all model coefficients are zero. = p robab i l i t y tha t coefficients 2~ and 2j are bo th zero.
b e e s t i m a t e d . W e e s t i m a t e t h e f o l l o w i n g m o d e l :
1 5
S A L E S s t = ~ (o~sD~ + c~D, A V G C O S A L t R G I N C ~ t ) s = l
+ 2 1 D ~ S A L E S 8 6 s , + . ; t2D~D~SALES86~
p Q P +/~3D~tDs tSALES86s +/~4Ost A V G C O S A L t R G I N C s t
+ 25D~D~ A V G C O S A L t R G I N C s t
P 12 q- /.6DstD~t A V G C O S A L t R G I N C ~ t + est. (5)

R.D. Banker et al. / Journal o f Accounting and Economics 21 (1996) 195 226 219
Table 7 WLS estimates of impact of incentive plan and income growth on sales (t-statistic in parentheses); n = 990, 15 stores for 66 months from February 1986 to July 1991
15
SALES~t = ~ (:~D~ + fl,D~ A VGCOSALt) + 7A VGCOSAL~ RGINC~, + ).iDeA VGCOSALt s = l
+ 22DPD~A VGCOSALt + 23DPD~A VGCOSALt + 24DPA VGCOSAL, RGINC~t
+ 25DPD~IA VGCOSALt RGINC~, + 26D~D~ A VGCOSALr RGINC~t + ~:~,
Parameter estimate Expected
Variable Parameter sign 1 2 3
R G I N C * A VGCOSA L 7 + 0.871 (5.13)
D~ * A VGCOSAL ).t +
P Y D~,D~ * A VGCOSA L ).2 +
P (2 D~,D~t * A VGCOSA L ).3
D~ * A VGCOSAL * R G I N C 2,, + 0.068 (5.51)
P g . D~,D~t A VGCOSAL * R G I N C 2s + 0.027 t2.15)
DPD~ * A V G C O S A L * R G I N C ).6 - -0.051 ( 4 . 6 9 )
p(model) 0.0001 Adjusted R 2 0.9789
pt21 = ).4 = O) p(22 = 25 - 0) p(23 = 26 = 0)
R G I N C
D~
D~
D~
0.891 1.039 (5.47) (5.69)
0.073 0.111 (5.63) (0.55)
0.030 - 0.032 (2.25) 0.15)
- 0.054 0.468 ( - 4.66) (2.04)
0.043 0.22)
0.061 (0.31)
- 0.491 - 2.29)
0.0001 0 . 0 0 0 1
0.9790 0.9792
0.0001 0.0482 0.0001
= relative growth in personal income of county of store location.
= 1 if store s, otherwise zero.
- 1 if store is on the incentive plan, otherwise zero.
- 1 if store has been on the incentive plan for at least one year. otherwise zero.
= 1 if fourth quarter of fiscal year, otherwise zero.
A V G C O S A L - average sales of 19 stores that did not implement incentive plan.
p(model) - probability that all model coefficients are zero.
p(2~ = ).j = 0) - probability that coefficients 2~ and ).j are both zero.
P a r a m e t e r e s t i m a t e s r e p o r t e d in T a b l e 8 i n d i c a t e t h a t w h i l e all t he 2 c o e f f i c i e n t s
in t h e f i rs t t w o c o l u m n s h a v e t h e h y p o t h e s i z e d s igns , t h e e x t e n t o f t h e p l a n
i m p a c t is d i m i n i s h e d c o m p a r e d to t h a t i n d i c a t e d in T a b l e 3 a n d h y p o t h e s i s H 2 is
n o t r e j e c t e d b e c a u s e w e n o w c o n t r o l fo r i n c o m e g r o w t h d i f f e r en t i a l s . H o w e v e r ,

220 R.D. Banker et al. / Journal o f Accounting and Economics 21 (1996) 195-226
the plan does have a significantly positive and persistent impact on sales that is lower in the fourth quarter. Overall, the results in Tables 6, 7, and 8 indicate that, while relative income growth is important in explaining store sales, the imple- mentation of the performance-based incentive plan resulted in sales gains that
T a b l e 8 W L S es t ima tes o f i m p a c t o f incent ive p lan a n d i n c o m e g r o w t h o n sales ( t -s tat is t ic in parentheses) ;
n = 990, 15 s to res for 66 m o n t h s f rom F e b r u a r y 1986 to Ju ly 1991
1 5
SALES,, = ~ (~,D~ + fl,D~ A VGCOSAL, RGINC~t) + 2tD~SALES86, s = l
+ 22D~D~SALES86, " p Q - +/.3D~tD~,SALI:S86, + 2,D~A VGCOSAL, RGINC~,
+ ).sD~D~A VGCOSALt RGINC~, + 26D~D~ A VGCOSAL, RGINC.~t + e~t
P a r a m e t e r e s t ima te
Expec t ed
Var i ab le P a r a m e t e r sign 1 2 3
De * SALES86 )-1 + - 0 .075
(6.95)
D~D~ * SALES86 22 + - - 0.005
0 . 4 5 )
D~D~ * SALES86 23 - - -- 0 .029 ( - 2.52)
P D~t * A VGCOSAL * R G I N C 2,, + 0.067
(6.42) P I: D~D~t * A VGCOSAL * R G I N C )5 + 0.020
(1.68)
D ~ D ~ * A V G C O S A L * R G I N C 26 -- - - 0 . 0 5 0 ( -- 4,74)
p (mode l ) 0.0001 0.0001 A d j u s t e d R 2 0.9799 0 .9796
p(21 = 2 4 = 0 )
p(22 = 2 s - O )
P{'~3 = 26 -- O)
0.056 (3.14)
- 0 .009 - 0.53)
- 0.001
- 0.10)
0.026
(1.50)
0.023
(1.34)
- 0 .036 - 2 . 1 1 )
0.0001
0 .9786
0.0001 0 .3195
0 .0036
R G I N C
D~
D, p, D r
s t
D~ SA LES86
- relat ive g r o w t h in p e r s o n a l i ncome of c o u n t y o f s tore loca t ion .
= 1 if s tore s, o the rwi se zero.
- 1 if s tore is o n the incent ive p lan , o the rwise zero.
= 1 if s tore has been o n the incent ive p l an for a t least one year , o the rwise zero.
= 1 if f ou r th q u a r t e r of fiscal year , o the rwi se zero.
= ave r age m o n t h l y s tore sales in 1986.
A VGCOSAL = ave rage sales of 19 s tores t ha t d id no t i m p l e m e n t incent ive p lan .
p (mode l ) = p r o b a b i l i t y t ha t all m o d e l coefficients a re zero.
p(2~ = 2j = 0) = p r o b a b i l i t y t ha t coefficients 2i a n d 2j are b o t h zero.

R.D. Banker et al. /Journal o f Accounting and Economics 21 (1996) 195 226 221
increase over t ime and tha t these gains are lower when there are more t empor - a ry salespersons.
We cons ider next the poss ib i l i ty tha t sales manage r s and consu l tan t s in the p lan stores increased the c o n s u m p t i o n of sa les- re la ted resources to increase sales. The re la t ion of these costs to the p lan ' s sales impac t is examined in Table 9. One concern is tha t sales personnel ma in ta in add i t i ona l inventor ies on hand to p r o m o t e sales once the incent ive p lan is implemented . The regress ion es t imates r epo r t ed in the left co lumn indicate tha t there was litt le difference in inven to ry tu rnove r rates before and after the p lan ' s implementa t ion .
There is also the poss ib i l i ty tha t sales personne l give more price breaks (they are au tho r i zed to d i scount merchand i se up to 10%), sell less prof i tab le merchan- dise, or encourage cus tomers to purchase (and then return) more goods than they need. All of these factors suggest tha t gross marg ins e rode after the p lan ' s implementa t ion . There is no evidence, however , of any decrease in gross marg ins as the regress ion results r epo r t ed in the midd le co lumn of Table 9 indicate that the cost of goods sold as a percentage of sales remains unchanged after p lan implemen ta t ion .
Add i t i ona l sales cou ld also be genera ted by consuming o ther c o m p a n y resources. Because da t a for suppo r t act iv i ty expenses (such as s tock handl ing, securi ty, admin i s t r a t ion ) were no t ava i lab le to us for the first 12 mon ths of our sample per iod, this regress ion was es t imated with da t a for the remain- ing 54 months . Results r epo r t ed in the r ight co lumn indicate tha t suppo r t expenses as a percen tage of sales d id no t change signif icant ly after the p lan ' s
Table 9 Impact of incentive plan on expenses (t-statistics in parentheses); n = 990, 15 stores for 66 months from February 1986 to July 1991
15 6 6 P Y P Q y~,-/= otj + ~ fl~-/O~ + ~ 6,-~Dr r + ?ljDs~ + 7z-/D,,D~t + 73-/DstDst q- est-/, j = 1, 2, 3
s = 2 t = 2
Beg. inventory,t Cost of sales~, Support expenses~t Salesst / 100 Saless,/100 Salesst / 100
71./ 7.610 0.222 0.017 (0.66) (0.41) (0.26)
72-/ 16.902 - 0.084 - 0.011 (1.56) ( -- 0.17) ( -- 0.19)
~3j 0.476 1.175 -- 0.018 (0.02) (1.19) (0.16)
Adjusted R 2 0.7253 0.5708 0.8588
D r = 1 if month t, otherwise 0.
See Tables 2 and 3 for other variable definitions.

222 R.D. Banker et al. / Journal o['Accounting and Economics 21 (1996) 195 226
implementation. Taken together the results in Table 9 reveal that the sales gains documented above are not obtained because of inventory accumulation, margin erosion, or support cost inflation.
In summary, after considering factors such as income growth, margin reduc- tion, and resource consumption that may impact sales, the empirical evidence indicates that sales gains occur on the implementation of the incentive plan. The signs of the estimated coefficients are remarkably robust across models, all indicating that sales gains increase over time and lower gains obtain in the periods when the proport ion of temporary employees is high, although the statistical significance of the tests differs across models. Overall, the evidence is consistent with the notion that the effects of incentives are considered by sales consultants in their decisions to provide better customer service.
7. Concluding remarks
There has been considerable interest in the management accounting literature on the theoretical derivation of optimal incentive contracts in a principal-agent setting. A fundamental assumption in most agency-theoretic models is that the agents will optimally trade off expected increase in incentive compensation against disutility for greater effort. There have not been many attempts, how- ever, to test whether this assumption is supported by empirical observations over a long span of time. This need for empirical validation is particularly salient because the richer, more complex, theoretical models that consider multi-period consequences of incentive contracts impose a great cognitive burden on the agent's ability to assess effects that are not immediately evident.
In this paper we have examined the impact of a performance-based compen- sation plan at a firm that operates numerous retail outlets. We find that the implementation of the plan is associated with increases in sales that persist and increase over time. As such this finding supports the basic agency-theoretic assumption that output increases when agents are rewarded for performance. There is also strong evidence that the impact of the incentive contract is lower when the proport ion of temporary workers is higher. These observations are consistent with the permanent sales consultants (but not the temporary workers) optimally assessing the multi-period implications of working to develop long- term service relation with customers, or to learn how to perform their task more efficiently, which translates into future sales gain.
A caveat that must be recognized, however, stems from the limitation that field-based research imposes on our ability to control all other factors bearing on the phenomenon being studied, and also on our ability to obtain data on such other factors to assess their influence on our results. The increase in sales gains documented in our study may be caused by multi-period effect of

R.D. Banker et al. /Journal o f Accounting and Economics 21 (1996) 195 226 223
incen t ives on the c o n s u l t a n t s ' a l l o c a t i o n of effort, o r by poss ib i l i t ies such as
p e r f o r m a n c e - b a s e d incen t ives a t t r a c t i n g w o r k e r s wi th h i g h e r in t r ins ic abi l i ty ,
i m p r o v i n g the a v e r a g e p e r f o r m a n c e of the sa lesforce o v e r t ime. D a t a ava i l ab l e
to us for this s tudy d o n o t a l l ow us to d i s c r i m i n a t e b e t w e e n these a l t e r n a t i v e
ways in wh ich p r o v i s i o n o f incen t ives can i m p r o v e o r g a n i z a t i o n a l p e r f o r m a n c e .
O u r s t udy is a l so l imi ted to an ana lys i s o f the i m p a c t of the c o m p e n s a t i o n p l an on sales a n d s o m e re l a t ed r e sources only. W e h a v e n o t e x a m i n e d the
ove ra l l i m p a c t o f the p l an on the f i rm's p e r f o r m a n c e to assess w h e t h e r it
is the o p t i m a l plan. N o t w i t h s t a n d i n g these cavea ts , the s tudy i l lus t ra tes the
v a l u e of f i e ld -based r e sea rch to he lp e v a l u a t e t heo re t i c a l p r e d i c t i o n s tha t
u l t ima t e ly a re i n t e n d e d to i n f o r m us on the b e h a v i o r of e c o n o m i c agen t s in the
field.
References
Antle, R. and A. Smith, 1986, An empirical investigation of the relative performance evaluation of corporate executives, Journal of Accounting Research 24, 1 39.
Awasthi, V. and J. Pratt, 1990, The effect of monetary incentives on effort and decision performance: The role of cognitive characteristics, The Accounting Review 65, 797 811.
Ashton, R.H., 1990, Pressure and performance in accounting decision settings: Paradoxical effects of incentives, feedback and justification, Journal of Accounting Research 28, Suppl., 148 180.
Baker, B., 1990, The other Nordstrom, Los Angeles Times, Feb. 4, D1. Baker, G.P., M.C. Jensen, and K.J. Murphy, 1988, Compensation and incentives: Practice vs. theory,
Journal of Finance 43, 593-616. Banker, R.D. and S.M. Datar, 1989, Sensitivity, precision and linear aggregation of signals for
performance evaluation, Journal of Accounting Research 27, 21-39. Barmash, I., 1989, Bloomingdale's in Manhattan to put staff on commission, New York Times,
July 6. Basu, A.K., R. Lal, B. Srinivasan, and R. Staelin, 1985, Salesforce compensation plans: An agency
theoretical perspective, Marketing Science 4, 267-291. Belsley, D.A., E. Kuh, and R.E. Welsch, 1980, Regression diagnostics (Wiley, New York, NY). Benston, G., 1985, The self-serving management hypothesis: Some evidence, Journal of Accounting
and Economics 7, 67-84. Bivins, J., 1989, Focus on compensation: (1) Commissions and more, (2) New study: How stores are
paying, (3) Keys to measuring compensation programs, and (4) How Younkers satisfaction plus' program works, Stores, Sept. 25 30.
Christie, A.A., 1987, On cross-sectional analysis in accounting research, Journal of Accounting and Economics 9, 231 258.
Clawson, D., 1980, Bureaucracy and the labor process (Monthly Review Press, New York, NY). Condry, J., 1977, Enemies of exploration: Self initiated versus other initiated learning, Journal of
Personality and Social Psychology 35, 459-477. Coopers and Lybrand, 1992, Compensation planning for 1993 (New York, NY). Coughlan, A.T. and C. Narasimhan, 1992, An empirical analysis of sales-force compensation plans,
Journal of Business 65, 93 121. Coughlan, A.T. and R.M. Schmidt, 1985, Executive compensation, management turnover and firm
performance: An empirical investigation, Journal of Accounting and Economics 7, 43-66.

224 R.D. Banker et al. / Journal o f Accounting and Economics 21 (1996) 195 226
Deci, E.L. and R.M. Ryan, 1985, Intrinsic motivation and self-determination in human behavior (Plenum Press, New York, NY).
Doran, H.E. and W.E. Griffiths, 1983, On the relative efficiency of estimators which include the initial observations in the estimation of seemingly unrelated regressions with first-order auto- regressive disturbances, Journal of Econometrics 23, 165 191.
Gallagher, R., 1992, Editor's page: Compensation, Stores, Aug. 6. Gibbons, R. and K.J. Murphy, 1990, Relative performance evaluation for chief executive officers,
Industrial and Labor Relations Review 43, 30S-73S. Gibbs, M., 1995, Incentive compensation in a corporate hierarchy, Journal of Accounting and
Economics 19, 247-277. Ginsberg, S., 1989, Commission sales growing in big stores, Women's Wear Daily, Oct. 4, 1. Glesjer, H., 1969, A new test for heteroscedasticity, Journal of the American Statistical Association
64, 316-323. Guzzo, R.A., R.D. Jette, and R.A. Katzell, 1985, The effects of psychologically-based intervention
programs on worker productivity: A meta-analysis, Personnel Psychology, Summer, 275-291. Hogarth, R.M., B.J. Gibbs, C.R.M. McKenzie, and M.A. Marquis, 1991, Learning from feedback:
Exactingness and incentives, Journal of Experimental Psychology: Learning, Memory, and Cognition 17, 734-752.
Holmstr6m, B., 1982, Moral hazard in teams, Bell Journal of Economics 13, 324-340. Holmstr6m, B. and P. Milgrom, 1991, Multitask principal-agent analyses: Incentive contracts, asset
ownership, and job design, Journal of Law, Economics and Organizations 7, 24-52. Holthausen, R.W., D.F. Larcker, and R.G. Sloan, 1995, Business unit innovation and the structure of
executive compensation, Journal of Accounting and Economics 19, 279-313. Homans, G.C., 1952, Group factors in worker productivity, in: G.E. Swanson, T.M. Newcomb, and
E.L. Hartley, eds., Readings in social psychology, Rev. ed. (Holt, New York, NY) 637-649. Jenkins, G.D., 1986, Financial incentives, in: E.A. Locke, ed., Generalizing from laboratory to field
settings (Heath, Lexington, MA). Jensen, M.C. and K.J. Murphy, 1990, Performance pay and top-management incentives, Journal of
Political Economy 98, 225-264. Jensen, M.C. and J.L. Zimmerman, 1985, Management compensation and the managerial labor
market, Journal of Accounting and Economics 7, 3 9. John, G. and B. Weitz, 1989, Salesforce compensation: An empirical investigation of factors related
to use of salary versus incentive compensation, Journal of Marketing Research 26, 1-14. Johnston, J., 1984, Econometric methods, 3rd ed. (McGraw-Hill, New York, NY). Kanfer, R. and P.L. Ackerman, 1989, Motivation and cognitive abilities: An integrative/apti-
tude-treatment interaction approach to skill acquisition, Journal of Applied Psychology 74, 657 690.
Kmenta, J. and R.F. Gilbert, 1970, Estimation of seemingly unrelated regressions with autoregres- sive disturbance, Journal of the American Statistical Association 65, 186 197.
Kohn, A., 1988, Incentives can be bad for business, INC., Jan., 93-94. Koselka, R., 1991, Fading into history, Forbes, Aug. 19, 70-71. Lal, R. and R. Staelin, 1986, Salesforce compensation plans in environments with asymmetric
information, Marketing Science 5, 179 198. Lambert, R. and D. Larcker, 1987, An analysis of the use of accounting and market measures of
performance in executive compensation contracts, Journal of Accounting Research 25, 85-129. Latham, G.P. and D.L. Dossett, 1978, Designing incentive plans for union employees: A comparison
of continuous and variable reinforcement schedules, Personnel Psychology 31, 47-61. LaMer, E.E., 1981, Pay and organizational development (Addison-Wesley, Reading, MA). Lepper, M.R., D. Greene, and R.E. Nisbett, 1973, Undermining children's intrinsic interest with
extrinsic reward: A test of the overjustification hypothesis, Journal of Personality and Social Psychology 28, 129 137.

R.D. Banker et al. / Journal o f Accounting and Economics 21 (1996) 195 226 225
Levine, F.M. and G. Fasnacht, 1974, Token rewards may lead to token learning, American Psychologist, 29, 816-820.
Libby, R. and M.G. Lipe, 1992, Incentives, efforts, and the cognitive processes involved in ac- counting-related judgments, Journal of Accounting Research 30, 249 273.
Lloyd, B., 1989, Rich's total sales force going on commission, Daily News Record, Feb. 22, 11. Locke, E., J.F. Bryan, and L.M. Kendall, 1968, Goals and intentions as mediators of the effects of
monetary incentives and behavior, Journal of Applied Psychology 52, 104-121. McGraw, K.O., 1978, The detrimental effects of reward on performance: A literature review and
a prediction model, in: M.R. Lepper and D. Greene, eds., The hidden costs of reward (Erlbaum, Hillside, N J).
Milgrom, P. and J. Roberts, 1992, Economics, organization and management (Prentice-Hall, Englewood Cliffs, N J).
Murphy, K.J., 1985, Corporate performance and managerial remuneration: An empirical analysis, Journal of Accounting and Economics 7, 11 42.
Murphy, K.J., 1986, Incentives, learning, and compensation: A theoretical and empirical investiga- tion of managerial labor contracts, Rand Journal of Economics 17, 59-76.
Park, R.E. and B.M. Mitchell, 1980, Estimating the autocorrelated error model with trended data, Journal of Econometrics 13, 185 201.
Pearce, J.L., W.B. Stevenson, and J.L. Perry, 1985, Managerial compensation based on organization performance: A time series analysis of the effects of merit pay, Academy of Management Journal 28, 261-278.
Prais, S.J. and C.B. Winsten, 1954, Trend estimators and serial correlation, Cowles Commission discussion paper no. 383 (Chicago, IL).
Rao, R.C., 1990, Compensating heterogeneous salesforces: Some explicit solutions, Marketing Science 9, 319-41.
Roethlisberger, F.J., 1977, The elusive phenomena, edited by G.F.F. Lombard (Harvard University Press, Cambridge, MA).
Schlesinger, L.A. and J.L. Heskett, 1991a, Enfranchisement of service workers, California Manage- ment Review, Summer, 83-100.
Schlesinger, L.A. and J.L. Heskett, 1991b, The service-driven service company, Harvard Business Review, Sept. Oct., 71 81.
Schwadel, F., 1990a, At Sears, unpopular pay policy reflects fuss in retail industry, Wall Street Journal, Jan. 13, BI.
Schwadel, F., 1990b, Chain finds incentives on hard sell, Wall Street Journal, July 5, B1. Simons, R. and H. Weston, 1991, Nordstrom: Dissension in the ranks?, Paper no. 9-191-002
(Harvard Business School, Boston, MA). Sloan, R., 1993, Accounting earnings and top executive compensation, Journal of Accounting and
Economics 16, 55 100. Stevenson, R.W., 1989, Watch out Macy's, here comes Nordstrom, New York Times Magazine, Aug.
27, 34 40. Taylor, F.W., 1911, The principles of scientific management (Norton, New York, NY). Thaler, R., 1986, The psychology of choice and the assumptions of economics, in: A.E. Roth, ed.,
Laboratory experimentation in economics: Six points of view (Cambridge University Press, New York, NY).
Thurik, R. and N. Van der Wijst, 1984, Part-time labor in retailing, Journal of Retailing 60, 62-80. Vroom, V.H., 1965, Work and motivation (Wiley, New York, NY). Wagner, J.A, P.A. Rubin, and T.J. Callahan, 1988, Incentive payment and nonmanagerial producti-
vity: An interrupted time series analysis of magnitude and trend, Organizational Behavior and Human Decision Processes 42, 47 74.
Weitzman, M.L., 1980, The 'Ratchet Principle' and performance incentives, Bell Journal of Eco- nomics, Spring, 302 308.

226 R.D. Banker et al. / Journal of Accounting and Economics' 21 (1996) 195 226
White, H., 1980, A heteroskedasticity-consistent covariance matrix estimator and a direct test for heteroskedasticity, Econometrica 48, 817 838.
Wood, R., A. Bandura, and T. Bailey, 1990, Mechanisms governing organizational performance in complex decision-making environments, Organizational Behavior and Human Decision Pro- cesses 46, 181 201.
Yin, T., 1992, Sears is accused of billing fiaud at auto centers, Wall Street Journal, June 12, BI. WSJ, 1989, Commission selling spreads at department stores, Wall Street Journal, March 21. WWD, 1988, Younkers sets sales incentives, Women's Wear Daily, March 29. WWD, 1991, CHH cutting back on commissions, Women's Wear Daily, Jan. 16, 5.