management accounting field lab: implementation of …
TRANSCRIPT

A Work Project presented as part of the requirements for the Award of an International
Master’s degree in Finance from the Nova School of Business and Economics.
MANAGEMENT ACCOUNTING FIELD LAB:
IMPLEMENTATION OF A COSTING SYSTEM FOR THE HYBRID ORGANIZATION
SEMEAR BIPP
Vinicius Giunta Bueno - 40596
Work project carried out under the supervision of
Professor Marta Almeida
04th January 2021
1
Abstract
A consulting project developed during a four-month period aimed at implementing managerial
accounting tools such as a costing system for a Portuguese Hybrid called Semear BIPP was
used with excel worksheets. The tool is easily updated and can support managers’ decision-
making processes in a timely and accurate manner. In order to have a better understanding of
the costs, a model that was tailored regarding each business unit specificity was provided. A
single overhead rate using a Traditional Costing System was implemented for the charity
business, and a Time Driven Activity Based Costing System was implemented for the
commercial business.
Keywords: Consulting Project, Costing System, Hybrid Organization, Time Driven Activity
Based Costing System, Traditional Costing System
This work used infrastructure and resources funded by Fundação para a Ciência e a Tecnologia
(UID/ECO/00124/2013, UID/ECO/00124/2019 and Social Sciences DataLab, Project 22209),
POR Lisboa (LISBOA-01-0145-FEDER-007722 and Social Sciences DataLab, Project 22209)
and POR Norte (Social Sciences DataLab, Project 22209).

2
Table of Contents
Abstract ................................................................................................................................................... 1
II. Individual Part ..................................................................................................................................... 3
4. Introduction to Costing Systems ..................................................................................................... 3
4.1. Cost Object ............................................................................................................................... 3
4.2. Direct and Indirect Costs .......................................................................................................... 4
4.3. Cost Driver and Cost Driver Rate .............................................................................................. 4
4.4. Period Cost ................................................................................................................................ 5
4.5. Budgeted Costs and Actual Costs ............................................................................................. 5
4.6. Cost Behaviour ......................................................................................................................... 5
4.7. Cause-and-effect and Arbitrary allocation ............................................................................... 5
4.8. Costing System ......................................................................................................................... 6
5. Implementing Costing System in a Hybrid Organization ............................................................... 10
5.1. Consulting Project Introduction ............................................................................................. 10
5.2. Semear Academia costing system .......................................................................................... 10
5.3. Semear Mercearia costing system ......................................................................................... 12
5.4. Semear Terra costing system ................................................................................................. 14
6. Conclusions and Future Recommendations .................................................................................. 15
III. References ........................................................................................................................................ 17
IV. Appendixes ....................................................................................................................................... 18
Appendix 5. Table 3 – Assembling Time for all Semear Products ..................................................... 18
Appendix 6. Table 4 – Packing time for Semear Products ................................................................ 18
Appendix 7. Table 5 – Cooking time for Semear Products ................................................................ 19
Appendix 8. Graph 1 – Budgeted Costs and Teaching Volume for Academia 3 during 2021 ........... 20

3
II. Individual Part
4. Introduction to Costing Systems
To contextualize the topic of costing systems, it is important to point out that the role of
management accounting is to provide information to managers inside the organization to
support them to make better decisions and improve operations (Drury, 2014, p. 34). One of the
differences between management accounting and financial accounting lies in the users of
information provided, the first focusing on internal reporting and the second on external
reporting. External reporting follows GAAP - Generally Accepted Accounting Principles.
Although the different information users, there is an important piece of information that both
fields of accounting have a combined interest: costs.
In order to report profitability, following GAAP rules, it is important to allocate costs
between Cost of goods sold (COGS) and inventories, this is related with the financial reporting
function (KAPLAN, 1999) and to do so, the calculation of the product’s cost is mandatory.
From an internal perspective, knowing the cost of each product, for instance, is important to
make better decisions as measuring the product cost can be used to define a pricing strategy
and calculate profitability (KAPLAN; ANDERSON, 2007). In this thesis, the calculation of
product costs will be done through a management accounting system that provides timely cost
information (KAPLAN, 1999) for managers within the organization. This system requires the
allocation of indirect costs to cost objects, practice for this allocation process has faced many
changes after the 1980s with the increase in the usage of information systems. To understand
a costing system, some terms used in the literature must be introduced.
4.1. Cost Object
The first concept to be introduced is cost object, which is basically putting a cost on
something (Horngreen; Datar; Rajan, 2015). The cost object is what the managers want to know

4
the cost of. Typically, it can be for a product, a service, clients, or an activity. Assigning costs
to cost objects can be done through direct and indirect costs.
4.2. Direct and Indirect Costs
Direct costs are directly related to the cost object in a sense that it is only possible to have
a direct cost if it can be traced to a cost object (Drury, 2014); otherwise, it will be an indirect
cost, also known as overhead. Direct costs are all costs that do not need an allocation. They
will be traced directly to the cost object, such as direct materials and direct labor. An example
of direct material could be an ingredient used to produce a pie. In this simple example, the pie
is the cost object and the ingredients used to produce this pie are the direct materials. Following
the same example, direct labor would be someone whose only job is to mix all the ingredients
so as to have the pie baked.
Indirect cost can provide resources for more than one product (Kaplan; Atkinson, 1998)
therefore it cannot be traced directly to a product. The rent of the bakery store cannot be directly
traced to the pie that was baked. In order to allocate this cost to the pie, an allocation process
will be required, and ideally it should be done through an accurate costing system. The costing
system will be able to calculate a cost driver rate in order to guarantee a proportion of the cost
of the rent in the final cost of the pie.
4.3. Cost Driver and Cost Driver Rate
Cost Driver is the allocation base, which is the basis that is used to allocate costs to costs
objects (Drury, 2014) that has a cause-effect relation between an indirect cost and a cost object
(Horngren; Datar; Raja, 2015) and it can be, for instance, the level of activity, or volume if any
cause-effect exists. The process of cost allocation needs an estimate, a cost driver rate, which
will reflect the proportion each cost object consumed from the cost driver. Until the Activity
Based Costing System introduction in the 1980s, cost allocation was done mainly through
traditional costing systems (Drury, 2014) which will be better explained in section 4.8.

5
4.4. Period Cost
The difference between a period cost and a product cost is that period costs cannot be
traced to inventory valuation. Period cost will always be reported in the profit and loss of the
period whereas a product cost, if the product is not sold, will be treated as an asset, and will be
recorded in the balance sheet in the inventory section. For Semear BIPP only managers’ wages
were assumed to be period costs and all other costs were allocated to a cost object.
4.5. Budgeted Costs and Actual Costs
A costing system informs managers what the budgeted costs are and when a month passes
by it should also show managers what the actual costs are. A budgeted cost is used in planning
and decision-making processes. If a company has historical data, it can be easier to budget
costs in a more accurate manner. After the budgeting period, managers must compare the
budgeted costs with actual costs. If the variance between the actual and the budgeted costs is
considerably high, it might lead managers to change pricing strategy, for example, will change
to maintain the expected product margin based on actual costs.
4.6. Cost Behaviour
The term cost behaviour is related to fixed and variable costs. Fixed costs, as the name
suggests, will remain constant for a specific time period regardless of the volume of activity,
such as the rent of the bakery store. On the other hand, variable costs will vary in proportion to
the level of activity. A good example of a variable cost is direct materials. Returning to the pie
example introduced earlier to explain direct materials, the total cost of ingredients to produce
a given product will change according to the number of pies produced, which is then multiplied
by the unit variable cost of each ingredient, whilst the rent will remain fixed no matter the
amount of pies produced.
4.7. Cause-and-effect and Arbitrary allocation
The allocation process can be done using arbitrary or cause-and-effect allocation basis.
An arbitrary allocation tries to allocate costs using a cost driver that is as reasonable as possible,

6
but it is not always a significant determinant of the cost (Drury, 2014) therefore it can cause an
inaccurate allocation of indirect costs to the cost object. The cause-and-effect allocation uses a
cost driver that is determinant of the cost, meaning that it will achieve a more accurate cost
compared to an arbitrary allocation. The difficulty is to find a clear cause-and-effect base to
allocate some overheads to cost objects.
4.8. Costing System
There are two types of costing systems: Traditional Costing Systems (TCS) and Activity
Based Costing Systems (ABC). This section introduces both costing systems along with
specificities that can be applied to each one. One of the goals, for both costing systems is to
allocate indirect costs to a cost object. Managers also want to rely on information provided by
the costing system to make strategic decisions related, for instance, to performance and control.
Since the Medieval Era, guild members used detailed cost information to certify product
quality (KAPLAN; ATKINSON, 1998). In the early nineteenth century, the textile industry
introduced the cost driver concept, such as cost per yard and it was further developed with the
scientific management movement1 by introducing the TCS that relies mainly on cost drivers
that confer an arbitrary cost allocation to a cost object (Topic Gateway Series, 2008) and will
rarely meet a cause-and-effect cost allocation. TCS allocation process aims to define a cost
driver rate that can be used to allocate costs to the cost object. An example to illustrate this
could be the allocation of 5% of an indirect labor of the bakery shop, to the pie, because it
corresponds to 5% of the total production. There is no clear cause-and-effect in the cost driver
to be allocated like that, because in this case, the amount of hours spent in the activity would
allocate more consistently indirect labor salary. The cost could be allocated to an activity before
allocating it to a cost object.
1 Administration model developed by Frederick Taylor

7
This can illustrate one of the reasons why a traditional costing system is simpler but not
always the most accurate. According to Kaplan and Anderson (2007) TCS requires only three
cost categories: labor, material and overhead. Eaton (2005) said that to perform a TCS three
steps are needed: calculate the total cost of a specific department, allocate overheads to
production departments then allocate the costs of the production departments to cost object.
The most simplistic TCS will do the allocation process with a single cost driver when the
overhead consumption in a cost object is likely to be in the same proportion therefore it will
use a single overhead rate to allocate overhead costs. More complex TCS use multiple overhead
rates established for a department before allocating the overhead cost to a cost object.
Activity-Based Costing Systems were introduced in 1980s to correct deficiencies of the
TCS, such as the arbitrary allocation. This new costing system arises from the fact that
technologies are already well introduced in the production. Kaplan and Anderson (2007) also
mentioned that many companies shifted from a massive production strategy to a more client
focus oriented one. The result is mainly related to a decrease in direct costs, and an increase in
indirect costs with more engineers, marketing, machine setups, etc.
The arbitrary allocation used in the TCS was no longer able to calculate the correct
profitability of its cost objects with today’s globalization where competition within
multinational corporations is intensive and managers should use correct insights in order to
survive. Cost drivers used in traditional costing systems were simple and usually did not reflect
the correct relation between product cost and the consumption of work activities it consumes
(Cokins; Paul, 2016). Calculating costs inaccurately can lead managers to choose a losing
strategy (Kaplan, 1988) and can put a company out of business (Robin Cooper, 1989).
The ABC model arises from a need, and the allocation process involves tracing resource
consumption assigned to activities and allocating it to a cost object based on consumption
estimates (Topic Gateway Series, 2008). ABC tends to have a more accurate costing by adding

8
to the cost object costs from activities such as packing orders. The main change from the TCS
relies on the perception that activities, not departments, cause additional costs.
The process of ABC to understand the consumption of resources by each activity was
done mainly through interviews, surveys, and observation to understand the amount of time
employees spend on each activity (Kaplan; Anderson, 2003). After calculating this time, it was
possible to compute an activity cost driver rate – the total cost to perform the activity divided
by the total amount of time available. This rate will be used to allocate the activity cost to a
cost object. By inserting this activity cost to a cost driver, accuracy was achieved, although
also adding more complexity when there will probably be at least more activities to achieve
the objective of calculating the real consumption by using a cause-and-effect allocation instead
of the arbitrary allocation used in TCS.
To maintain its accuracy ABC system needs to be updated to reflect the reality after any
change in a company’s operation. In practical terms ABC often fails to be maintained and
therefore, costs estimates are no longer reliable. In addition, overall, “ABC Systems are
expensive to build, complex to sustain and difficult to modify” (Kaplan; Anderson, 2003, p.
16). While companies could understand the value proposition ABC system brought to the
process of cost allocation, they noted that it was not totally accurate in a sense that each activity
could have a specificity, and the model was built to allocate cost for activities in a standardized
way. ABC always assumes a practical capacity of a hundred per cent, which means that every
employee is productive during the entire day, which, in turn, for example, inflates product
costs.
The complexity process of interviews and the inaccurate activity allocation had
“prevented activity-based cost systems due to being an effective, timely, and up-to-date
management tool” (Kaplan; Anderson, 2003 p. 15). An adaptation of this model called Time-
Driven ABC (TDABC) was created and it is easy and fast to implement and provides

9
meaningful and actionable information, to managers which is both quicker, and inexpensive
(Kaplan; Anderson, 2003 p. 15).
TDABC costing system avoids the costly and time-consuming process of conventional
ABC (Kaplan; Anderson, 2007) by creating a time equation that assigns resources’ costs to a
cost center and cost objects. Only three parameters are needed to allocate consumed resources
costs. Firstly, two parameters used to calculate the capacity cost rate, have as the numerator,
the total cost of the resources used to perform an activity such as personnel, and the numerator
is this total cost using the practical capacity – practical time available from all resources
performing this activity, generally employees. The output is often the cost per hour/minute of
the capacity supplied.
The last parameter is capacity usage that estimates a unit time to perform each activity
that no longer needs precision, “rough accuracy is sufficient” (Kaplan; Anderson, 2003). It is
now possible to calculate the unit cost for each activity by multiplying the capacity cost rate,
calculated previously, by the total time to perform a specific activity. This approach replaces
the process of interview and all information required to achieve a powerful costing system can
be easily accessed in any ERP system.
For the current global competition scenario, TDABC tends to appear the most effective
and efficient system to be used to extract relevant and accurate information without wasting
time due to the easy adaptability of the model, should any change be needed in the time
equation. To guarantee that the system output corresponds to the managers’ expectations, some
investing in technology could be needed to guarantee better results. To confirm that this
investment must be implemented the trade-off between having inaccurate information and the
investment should rely on minimizing total costs (Cooper, 1998). Therefore, it is not always
the case that this trade-off will show that changing the costing system will pay off.

10
5. Implementing Costing System in a Hybrid Organization
5.1. Consulting Project Introduction
A consulting project carried out within a Portuguese social hybrid organization called
Semear started in September 2020. A deep process to extract information through interviews/
meetings and from data bases was started (Appendix 2). After analyzing all collected data, the
model for Mercearia started to be created. The first presentation of the early-stage model was
important to grab attention from some of the Semear’s managers, who started to rely on us.
This was a huge leap towards the goal of the project, because the company’s management was
mainly focused on daily problems and could not invest time building tools to plan for the future.
Focusing on the costing systems built for Semear and the reasons behind the decisions to
solve each specificity, the next sub-sections present the different approaches used to allocate
the indirect costs to a cost object for each of Semear business units. Each business unit will
have a tailored costing system according to the specific needs of each business, meaning that
different costing systems were used according to their businesses.
5.2. Semear Academia costing system
Semear Academia is the charity business inside Semear BIPP and is the reason why all
other commercial businesses exist. Providing a service for the community allows Semear
Academia to be part of a government program called IEFP. This program is responsible for
reimbursing on a bi-monthly basis, almost all costs related to Academia 3. To guarantee this
reimbursement there is a driver for the IEFP related to the total volume of classes given, which
means that IEFP can only reimburse Semear costs, if students have attended classes.
This piece of information was an important step to define the best costing system to be
implemented. Even though Academia had other degrees, the main issue to resolve according
to Semear BIPP CFO, was the process to guarantee the IEFP reimbursement by the end of each
month in a clear and simple way in addition to maximizing the reimbursement as much as

11
possible. This process was completely manual and inaccurate, where each month, Academia’s
administrative staff, had to collect information of the amount of time spent in Academia 3 to
allocate part of the salary of each fixed labor to guarantee IEFP reimbursement. For other
overheads, a random ratio was inserted in order to allocate costs to Academia 3.
The allocation process was extremely hard to understand and to prove, and the way
Semear was doing it, they would never be able to maximize the grant received by IEFP, if they
were not tracing the most important driver to allocate all costs: the total volume of formation
per month. To solve Academia’s problem, it was decided that we would allocate all costs using
only the cost driver that was important to receive IEFP reimbursement, which is also the driver
of the core activity performed by the business unit. Therefore, a single overhead rate of the
core activity became the most important piece of information of Academia’s costing system
since the consumption of the resources is likely to be in the same proportion as the cost object,
and it is the driver that guides the government’s reimbursement process. As shown in Graph 1
(Appendix 8) costs will have a high correlation with the total volume of attendees.
To extract the best information for management decision regarding actual and budgeted
costs, two main pieces of information should be inserted in the model. The first one is the plan
for the upcoming year, for each degree. In this plan, the amount of time expected to be spent
on each degree during each month should be specified. This will be useful to calculate the total
possible volume of attendees if all students attend all classes. This piece of information will be
crucial to understand how much money Academia can receive as a reimbursement from the
government. The second and most crucial piece of information for the model and for the
reimbursement process is the invoice for the actual result which will be inserted during each
activity/class; how many students attended the classes as well as other relevant qualitative
information from the classes.

12
This invoice process will guarantee that administrative staff will not need to receive a
monthly excel file from anyone and it will calculate how much Academia 3 will be reimbursed
by the end of each month, since the information can be collected on a daily basis within seconds
and the actual cost driver will be the proportion Academia staff will allocate for other costs
such as, for example, security, water, electricity, among others.
Another goal that Academia had was to prove to IEFP that the Academia 2 degree,
besides having more students throughout the year; was able to insert more individuals with
disabilities into the job market. In addition, BIPP CFO wanted to prove that this degree had a
lower student cost than the unit cost for Academia 3 so that they could prove to IEFP that it
was also financially better. It was only possible to make a comparison if there was a standard
model that could receive the planned activities for both degrees for 2021 to compare them.
The tool built for Academia achieved all the goals Semear’s top management were
expecting from the project. The median hourly cost per student for Academia 3 for 2021 is 8.88
euros while for Academia 2 it is 5.24 euros, and this piece of information could be found in
less than a minute. The other important piece of information was the monthly allocation process
to receive the reimbursement from the IEFP. For 2021, Academia 3 is expected to have an
average monthly cost around nineteen thousand euros, which represents around 45% of the
total Semear Academia’s budgeted costs. Variances in the actual dashboards were also included
to identify how much of the total costs will be Academia’s responsibilities, which had not been
planned. The Academia model is already in use and it was the main source of information for
the CFO to come up with the budgeting for 2021.
5.3. Semear Mercearia costing system
Mercearia is a manufacturing and merchandizing business whose objective is to support
BIPP’s financial sustainability. To provide financial sustainability, Mercearia has as its main
source of revenue the sale of a product called “cabaz” – a basket of food related products –

13
during Christmas time. These products, as mentioned earlier, were divided into three categories
– P1, P2 and P3. In 2020, these revenues accounted for more than one million euros and
represented more than 90% of the total annual sales.
The project started in September and Mercearia was starting a massive sales period when
they realized they did not have a working system, from which they could check inventory
information. Hence, the first focus of the entire project was to guarantee Mercearia’ s annual
sales. As inventory is an important part of a costing system, it was possible to realize how
important a more accurate costing system could be for Mercearia Managers.
After coming up with this transactions model, where it was possible to register all the
movements of the ingredients and the products from the order from a supplier until the sale to
a client, Mercearia’ s Operations Manager, could start the Christmas sales process with all the
information needed in one excel file. The remaining problem was to guarantee that Mercearia
was not selling products at a loss; therefore, a more powerful tool started to be built to allocate
indirect costs to cost objects.
To trace direct costs – ingredients and materials - it is important to mention that when
producing food related products, a normal loss may occur, and it should be considered in the
production process. By knowing the cost of each ingredient and material, and how much was
used in the production, a BOM - Bill of Materials - was built to facilitate and guarantee a more
accurate cooking, assembling, and packaging process for each product and a Standard Cost
Card was also included in all the costs of all the materials. In order to have an accurate unit
cost for each product, the company decided to allocate indirect costs by using the principles of
a TDABC costing system. It should be simple, accurate and inexpensive.
Fixed labor that cannot be directly traced to product and manufacturing overheads costs,
such as water, for example was divided into Mercearia’s three main activities: Cooking,
Packing and Assembling. The time equation built considers a specific time for each product
14
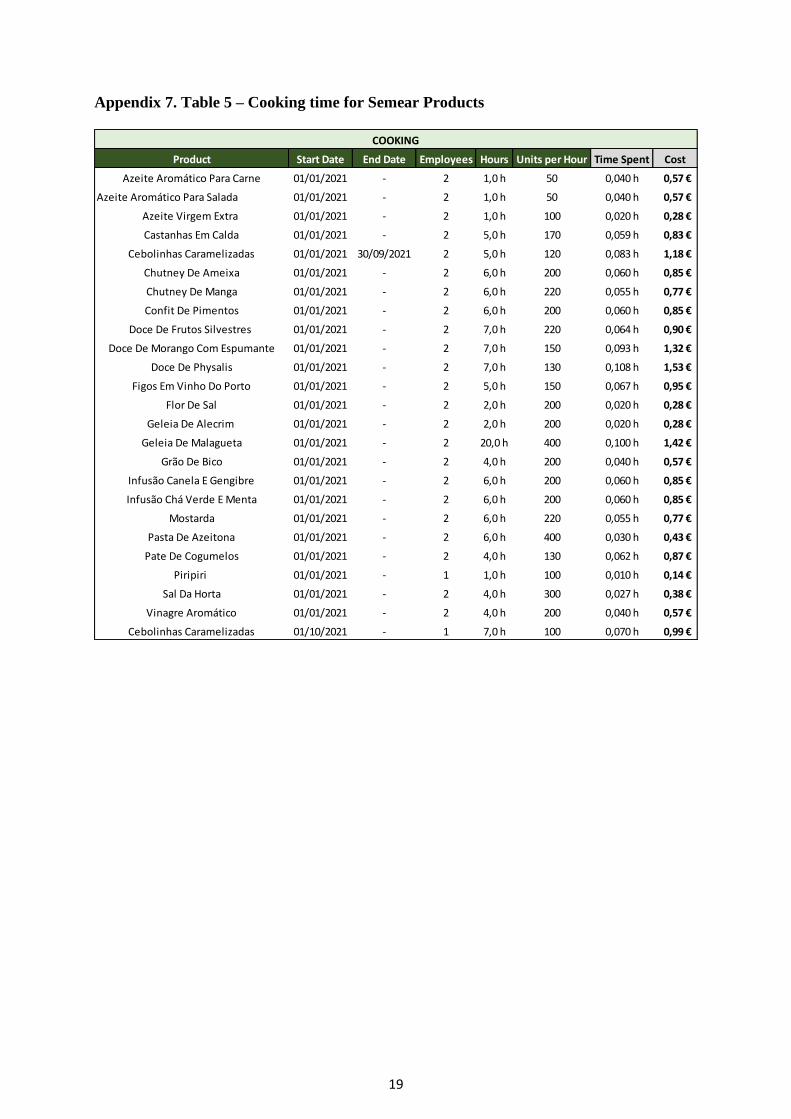
and can be accessed in the appendix (Appendix 5, 6 and 7). It is important to highlight that the
model was adapted to better fit the way Mercearia’ s Operations Manager did the observation
when allocating the time for each activity and for each product. If, in the future this time
changes, as it should happen with continuous improvement, it will be easy to change this piece
of information, and it will directly reflect in the Standard Cost Card. Now it is important to
know the cost per minute of capacity supplied. Mercearia only has six employees working full
time. An arbitrary practical capacity rate of 90% was used - it can be easily changed to reflect
reality - and the numerator of the capacity cost rate was about to 850 hours available per month
to perform activities, out of a total of 950 hours. The total cost of the resources used to perform
an activity was about eleven thousand euros per month. Therefore, we were able to calculate
the cost rate of around thirteen euros per hour.
The combination of the cost rate and the amount of time expected to perform each activity
enables the model to calculate manufacturing overhead unit costs, which were missing in the
product profitability dashboard, in a timely manner, and can be easily changed if necessary.
5.4. Semear Terra costing system
A costing system for was not a priority for Semear Terra. It has a new manager, and
many process and strategic decisions are being revised for the upcoming years, such as a
decrease in the number of products produced. Besides talking to the consulting team, Terra’s
Managers could not invest the same amount of time to the project compared to Semear
Academia and Mercearia. Therefore, it was not easy to develop a powerful and tailored tool
due to time and interest issues.
To prepare a model for Terra, managers decided to replicate Mercearia’s model, since
the main product of both business units, “cabaz”, is somehow similar, but in this case, they are
biological products. Not many changes were made, basically the changes were the
“ingredients” used to produce the final product are now seeds. The activities were adapted to

15
reflect Terra’s business of planting. It was possible to calculate costs using harvest activity,
since we only had the time from planting to harvest. Therefore, it was not possible to have a
more consistent allocation for overheads that has no relation with production process, but it is
performing other activities such as assembling bio cabaz and delivering it to each client.
Semear Terra is going through a dramatic change with the new manager, and it seems
that not enough time is available, and there is not much interest in having a tailored costing
system that takes the business specificity to have the most accurate costing; because in this
business, price is often set by the market, and adding complexity to Terra’s model will not
guarantee many benefits compared to Academia and Mercearia. Due to the project’s time
frame, it was decided to focus on the business units that were willing to implement an accurate
costing system.
6. Conclusions and Future Recommendations
BIPP top managers can now, in a timely manner, provide information to guarantee
Academia 3‘s reimbursement and hopefully will convince IEFP to accept Academia 2 in IEFP
program. Mercearia’s Operations Manager now has access to information related to inventory
and product in a more reliable and timely way. This combination can give Mercearia managers
a better position to make more accurate decisions more efficiently, which will lead the business
unit into continuing its growth process without selling any product at a loss or losing a client
because it was not possible to answer the client’s request in a timely manner due to inventory
issues.
Defining the best costing system is not an easy task and deciding which of the options
available are the best ones to be implemented is crucial. Also, the reality and the moment of
the organization should be considered. The literature focuses on large companies that have
thousands of employees and activities to induce a better cost system, but that is not always the
case. Cases of small business or even a hybrid organization with fewer than 50 employees were

16
not found in the literature. There is no case study that show trade-off from one costing system
to another for smaller businesses. Hence, there was not a clear step by step to follow to
introduce or improve a costing system for a hybrid organization.
This demonstrate a limitation in the literature related to costing systems for businesses
that have a source of revenue from the government that can be directly attached to attached to
a cost driver, which is one more reason to implement a reliable costing system in this type of
organization in order to provide information to the government and to guarantee a financial
stability of the business. Therefore, future studies could explore the implementation of costing
systems in hybrid organizations as one of the examples that would represent a highly interesting
and important step towards those organizations’ independence.

17
III. References
Cokins, Gary; Paul, Douglas D. Time-Driven or Driver Rate-Bases ABC?. (2016) Strategic
Finance Magazine. February 1, 2016. Accessed December 01, 2020
<https://sfmagazine.com/post-entry/february-2016-time-driven-or-driver-rate-based-abc/>
Cooper, Robin. 1998. You Need a New Cost System When. Harvard Business Review February
1989. Accessed December 12, 2020 < https://hbr.org/1989/01/you-need-a-new-cost-system-
when>
Cooper, Robin. Kaplan, Robert S. 1989. The Design of Cost Management Systems, 2nd edition.
Prentice-Hall, Inc. 1991.
Drury, Colin. 2008. Management and Cost Accounting, 7th Edition. Cengage Learning. 2008
Horngreen, Charles T.; Datar, Srikant M.; Rajan, Madhav V. 2015. Cost Accounting –
Amanagerial Emphasis. Pearson Education Limited.
Kaplan, Robert S. One Cost System Isn’t Enough. Harvard Business Review Magazine, January
1988. Accessed December 18, 2020 <https://hbr.org/1988/01/one-cost-system-isnt-enough>
Kaplan, Robert S., and Atkinson, Anthony A. 1998. Advanced Management Accounting, Third
Edition. New Jersey: Prentice Hall.
Kaplan, Robert S.; Anderson, Steven R. 2007. Time-Driven Activity-Based Costing - A
simpler and more powerful path to higher profits. Harvard Business School Publishing
Corporation.
Smith, Wendy K.; Besharov, Marya L. (2019). Bowing before Dual Gods: How Structured
Flexibility Sustains Organizational Hybridity. Administrative Science Quarterly, Vol. 64(1)1-
44. Accessed December 12, 2020
<https://journals.sagepub.com/doi/10.1177/0001839217750826>.

18
IV. Appendixes
Appendix 5. Table 3 – Assembling Time for all Semear Products
Appendix 6. Table 4 – Packing time for Semear Products
Product Start Date End Date Employees Hours Units per Hour Time Spent Cost
All Products 01/01/2021 - 10 3,5 h 760 0,046 h 0,65 €
ASSEMBLING
Product Start Date End Date Employees Hours Units per Hour Time Spent Cost
Amendoim Caramelizado 01/01/2021 - 1 1,0 h 100 0,010 h 0,14 €
Areias 01/01/2021 - 3 6,0 h 500 0,036 h 0,51 €
Azeite Aromático Para Carne 01/01/2019 - 2 4,0 h 300 0,027 h 0,38 €
Azeite Aromático Para Salada 01/01/2021 - 2 4,0 h 300 0,027 h 0,38 €
Azeite Virgem Extra 01/01/2021 - 2 4,0 h 300 0,027 h 0,38 €
Broas De Noz E Mel 01/01/2021 - 3 6,0 h 500 0,036 h 0,51 €
Castanhas Em Calda 01/01/2021 - 7 3,0 h 1150 0,018 h 0,26 €
Cebolinhas Caramelizadas 01/01/2021 31/10/2021 7 3,0 h 1150 0,018 h 0,26 €
Chutney De Ameixa 01/01/2021 - 7 3,0 h 1150 0,018 h 0,26 €
Chutney De Manga 01/01/2021 - 7 3,0 h 1150 0,018 h 0,26 €
Confit De Pimentos 01/01/2021 - 7 3,0 h 1150 0,018 h 0,26 €
Doce De Abóbora 01/01/2021 - 7 3,0 h 1150 0,018 h 0,26 €
Doce De Frutos Silvestres 01/01/2021 - 7 3,0 h 1150 0,018 h 0,26 €
Doce De Morango Com Espumante 01/01/2021 - 7 3,0 h 1150 0,018 h 0,26 €
Doce De Physalis 01/01/2021 - 7 3,0 h 1150 0,018 h 0,26 €
Doce De Tomate 01/01/2021 - 7 3,0 h 1150 0,018 h 0,26 €
Figos Em Vinho Do Porto 01/01/2021 - 7 3,0 h 1150 0,018 h 0,26 €
Flor De Sal 01/01/2021 - 7 3,0 h 1150 0,018 h 0,26 €
Geleia De Alecrim 01/01/2021 - 7 3,0 h 1150 0,018 h 0,26 €
Geleia De Malagueta 01/01/2021 - 7 3,0 h 1150 0,018 h 0,26 €
Grão De Bico 01/01/2021 - 2 1,0 h 100 0,020 h 0,28 €
Infusão Canela E Gengibre 01/01/2021 - 1 1,0 h 100 0,010 h 0,14 €
Infusão Chá Verde E Menta 01/01/2021 - 1 1,0 h 100 0,010 h 0,14 €
Mostarda 01/01/2021 - 7 3,0 h 1150 0,018 h 0,26 €
Pasta De Azeitona 01/01/2021 - 7 3,0 h 1150 0,018 h 0,26 €
Pate De Cogumelos 01/01/2021 - 7 3,0 h 1150 0,018 h 0,26 €
Piripiri 01/01/2021 - 2 4,0 h 300 0,027 h 0,38 €
Sal Da Horta 01/01/2021 - 7 3,0 h 1150 0,018 h 0,26 €
Vinagre Aromático 01/01/2021 - 2 4,0 h 300 0,027 h 0,38 €
Cebolinhas Caramelizadas 01/11/2021 - 6 4,0 h 1000 0,024 h 0,34 €
PACKING
19
Appendix 7. Table 5 – Cooking time for Semear Products
Product Start Date End Date Employees Hours Units per Hour Time Spent Cost
Azeite Aromático Para Carne 01/01/2021 - 2 1,0 h 50 0,040 h 0,57 €
Azeite Aromático Para Salada 01/01/2021 - 2 1,0 h 50 0,040 h 0,57 €
Azeite Virgem Extra 01/01/2021 - 2 1,0 h 100 0,020 h 0,28 €
Castanhas Em Calda 01/01/2021 - 2 5,0 h 170 0,059 h 0,83 €
Cebolinhas Caramelizadas 01/01/2021 30/09/2021 2 5,0 h 120 0,083 h 1,18 €
Chutney De Ameixa 01/01/2021 - 2 6,0 h 200 0,060 h 0,85 €
Chutney De Manga 01/01/2021 - 2 6,0 h 220 0,055 h 0,77 €
Confit De Pimentos 01/01/2021 - 2 6,0 h 200 0,060 h 0,85 €
Doce De Frutos Silvestres 01/01/2021 - 2 7,0 h 220 0,064 h 0,90 €
Doce De Morango Com Espumante 01/01/2021 - 2 7,0 h 150 0,093 h 1,32 €
Doce De Physalis 01/01/2021 - 2 7,0 h 130 0,108 h 1,53 €
Figos Em Vinho Do Porto 01/01/2021 - 2 5,0 h 150 0,067 h 0,95 €
Flor De Sal 01/01/2021 - 2 2,0 h 200 0,020 h 0,28 €
Geleia De Alecrim 01/01/2021 - 2 2,0 h 200 0,020 h 0,28 €
Geleia De Malagueta 01/01/2021 - 2 20,0 h 400 0,100 h 1,42 €
Grão De Bico 01/01/2021 - 2 4,0 h 200 0,040 h 0,57 €
Infusão Canela E Gengibre 01/01/2021 - 2 6,0 h 200 0,060 h 0,85 €
Infusão Chá Verde E Menta 01/01/2021 - 2 6,0 h 200 0,060 h 0,85 €
Mostarda 01/01/2021 - 2 6,0 h 220 0,055 h 0,77 €
Pasta De Azeitona 01/01/2021 - 2 6,0 h 400 0,030 h 0,43 €
Pate De Cogumelos 01/01/2021 - 2 4,0 h 130 0,062 h 0,87 €
Piripiri 01/01/2021 - 1 1,0 h 100 0,010 h 0,14 €
Sal Da Horta 01/01/2021 - 2 4,0 h 300 0,027 h 0,38 €
Vinagre Aromático 01/01/2021 - 2 4,0 h 200 0,040 h 0,57 €
Cebolinhas Caramelizadas 01/10/2021 - 1 7,0 h 100 0,070 h 0,99 €
COOKING

20
Appendix 8. Graph 1 – Budgeted Costs and Teaching Volume for Academia 3 during
2021