josé a. blakeley software architect database systems group microsoft corporation
TRANSCRIPT

Supporting Large Scale Scientific and Engineering Applications Using Database TechnologyJosé A. BlakeleySoftware ArchitectDatabase Systems GroupMicrosoft Corporation
I D I E S 2009, August 26, 2009

Key takeawaysDatabase systems and surrounding data services are a viable platform for data-intensive scienceDatabase Management System
Data representation: tables + rich data types + filesScience-specific libraries as extensions in database: .NET, C#Declarative language: SQL Automatic parallelism, cost-based query optimizationService broker – reliable messaging across databases
Surrounding Data ServicesRicher semantic models (EDM) and mapping: ADO.NET EF + LINQReporting, data analysis (cubes, data mining, Excel)Extraction, Transformation, Loading ToolsIntegration with other data sources (file formats + DBMSs)Streaming, complex event processing
Scalability – Data size and Computation

A Data Platform for Science
Entity Framework (EDM, Entity SQL, O-R mapping)
Science models (e.g., HDF5, FASTQ, RDF)
Visualization & Reporting Svcs
Libraries (MATLAB,…)
Web Services(XML, REST, RSS)
OLAP, Data Mining, Excel
StreamingComplex Events
.NET Languages with Language Integrated Query
Parallel DBMS cluster
External Files HDF5, FASTQ
DBMS
Data Type
New Index
BLOB
TVFs
Some Case StudiesAstronomy: SkyServer, Pan-STARRSGlobal scale carbon flux – FLUXNETPredictive medicine – Clalit Health ServicesHigh-throughput genomics – 1000 genome
Massive sequence alignment (UT Austin)Microsoft Life Sciences
… many more

Emerging Problems & Solution Patterns
Dealing with extremely large data volumes
Computation and analysis on large data volumesIntegrating and cleansing heterogeneous dataLeveraging the increasing volumes of unstructured data
Bridging the growing “semantic gap” between data and application models
Computation and Analysis on large data volumesDistributed, scale-out
database system
Moving rich computation closer to the data
Dr. Alex Szalay, JHU
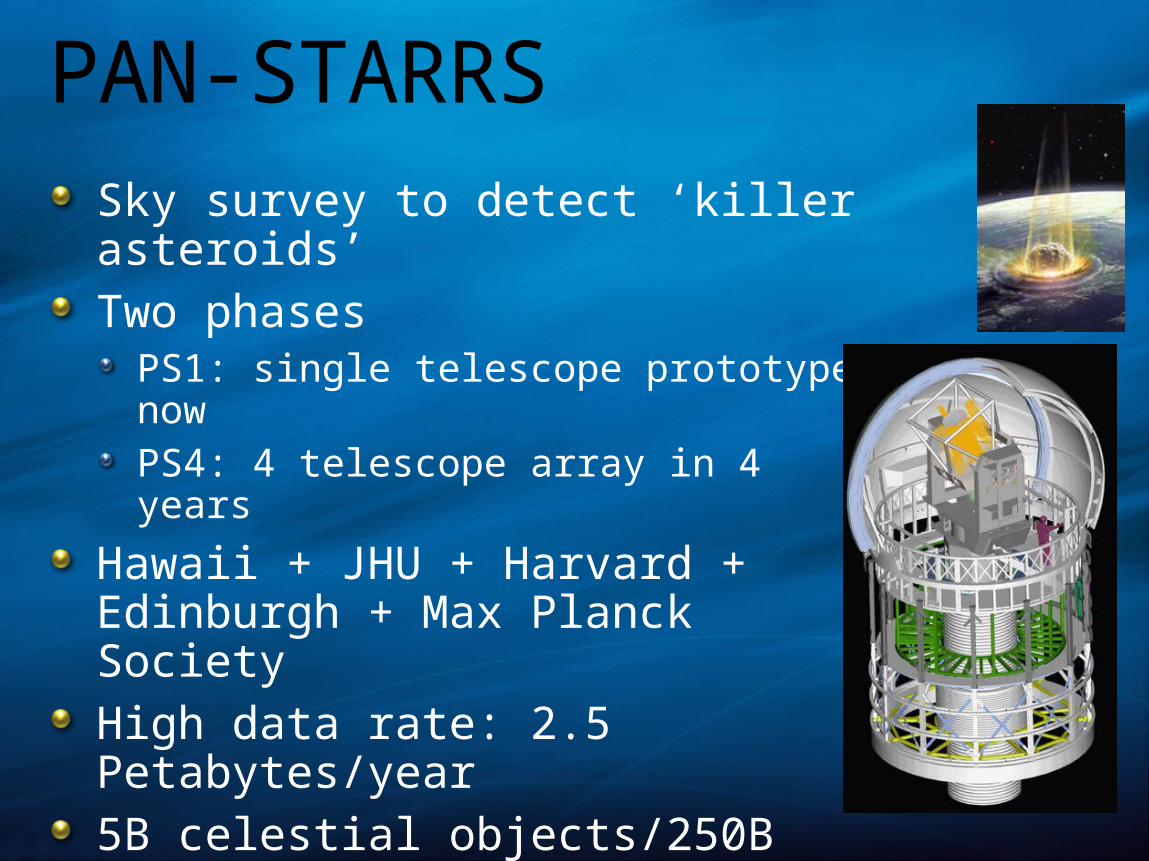
PAN-STARRSSky survey to detect ‘killer asteroids’Two phases
PS1: single telescope prototype nowPS4: 4 telescope array in 4 years
Hawaii + JHU + Harvard + Edinburgh + Max Planck SocietyHigh data rate: 2.5 Petabytes/year5B celestial objects/250B detections100TB prototype database built at JHU with Microsoft help

Integrating and cleansing heterogeneous dataLeveraging Reporting and Data Analysis to increase quality of data
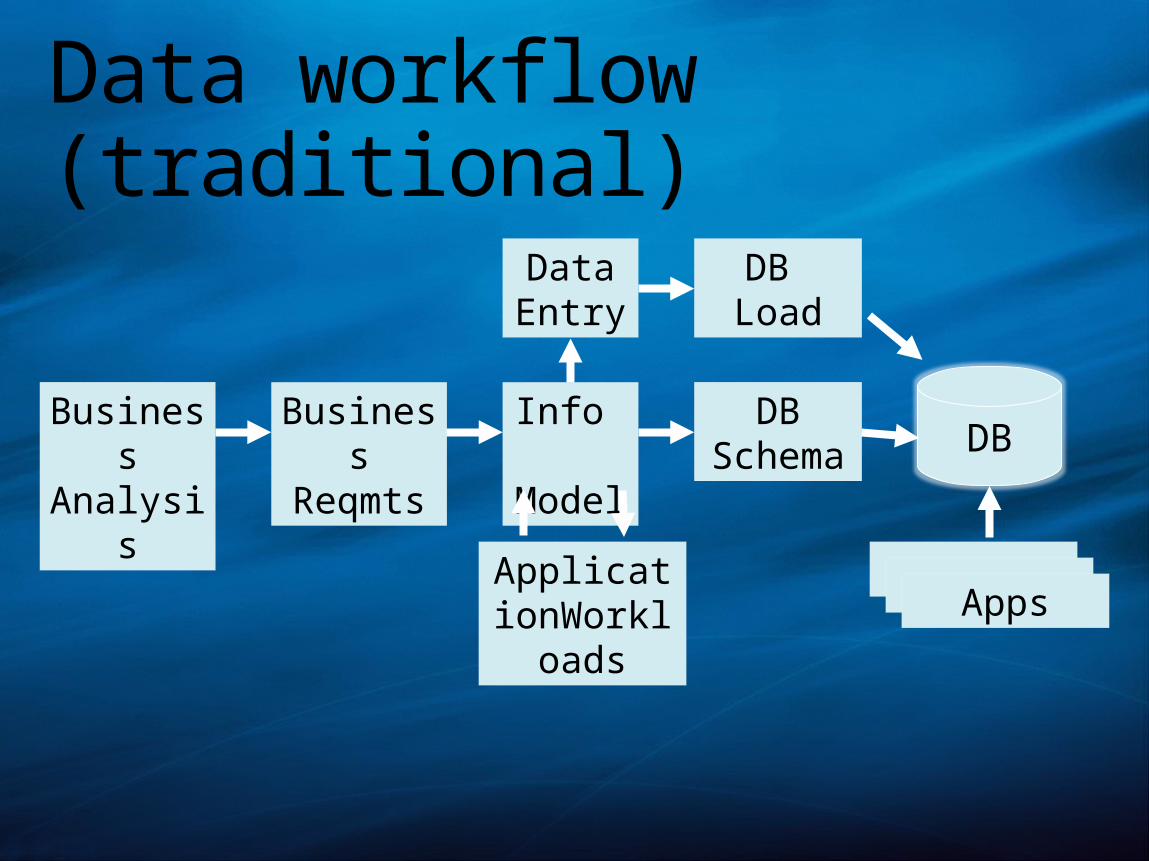
Data workflow (traditional)
Business
Analysis
Business
Reqmts
Info Model
ApplicationWorkloa
ds
DBDB
Schema
DB Load
Data Entry
Apps

Data workflow (emerging)Legac
y
Sen-sors
Staging
OLAP/Minin
g
AnalysisETL
ETL
Production
OLAP/Minin
g
Reports
Apps

Case study
Supporting Global Scale Carbon Flux Research at Berkeley Water Center
Dr. Deborah Agarwal and Dr. Catharine van Ingen
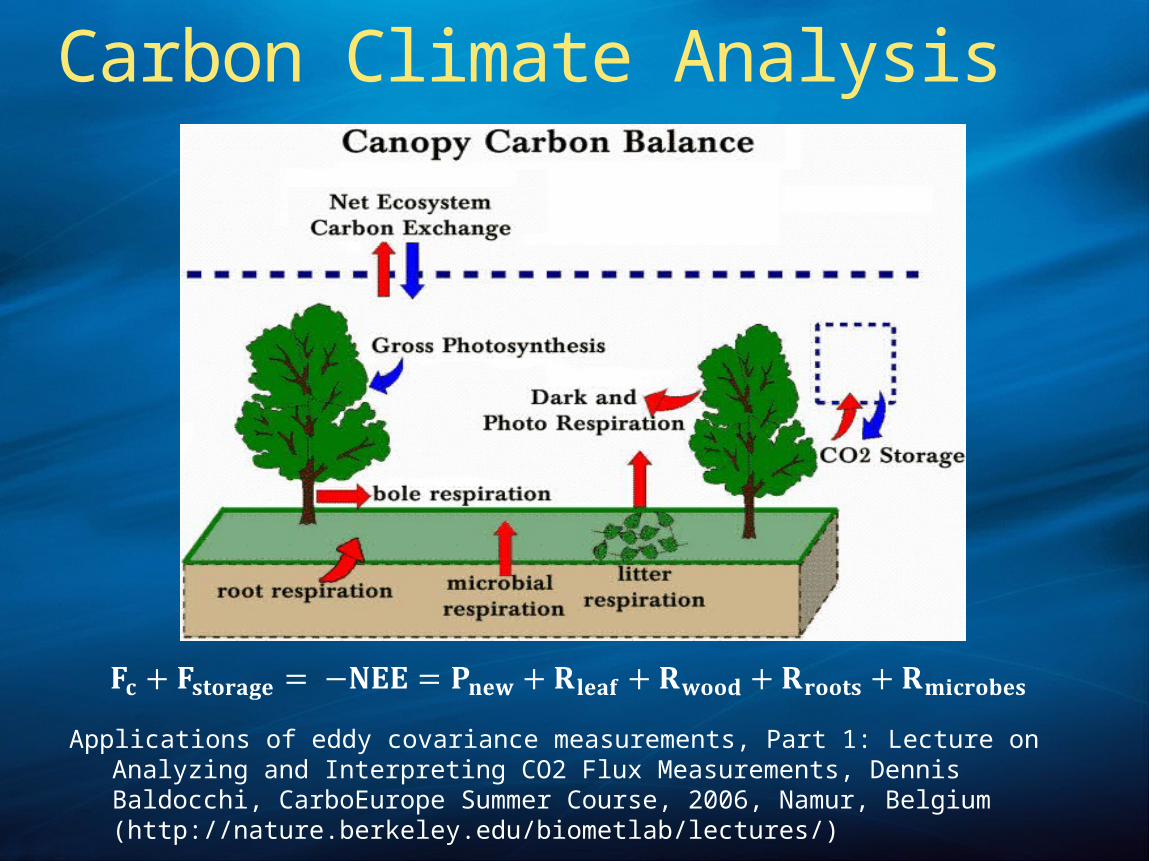
Applications of eddy covariance measurements, Part 1: Lecture on Analyzing and Interpreting CO2 Flux Measurements, Dennis Baldocchi, CarboEurope Summer Course, 2006, Namur, Belgium (http://nature.berkeley.edu/biometlab/lectures/)
Carbon Climate Analysis
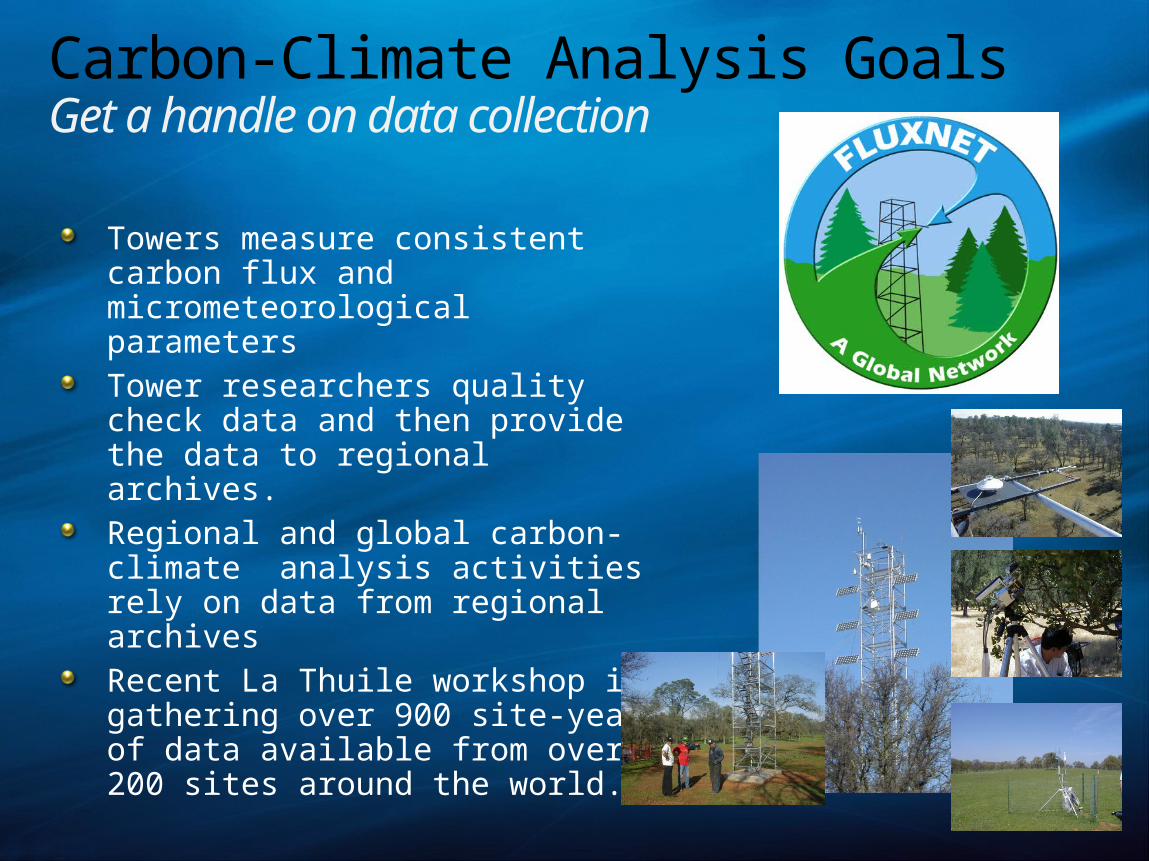
Carbon-Climate Analysis GoalsGet a handle on data collection
Towers measure consistent carbon flux and micrometeorological parametersTower researchers quality check data and then provide the data to regional archives.Regional and global carbon-climate analysis activities rely on data from regional archivesRecent La Thuile workshop is gathering over 900 site-years of data available from over 200 sites around the world.
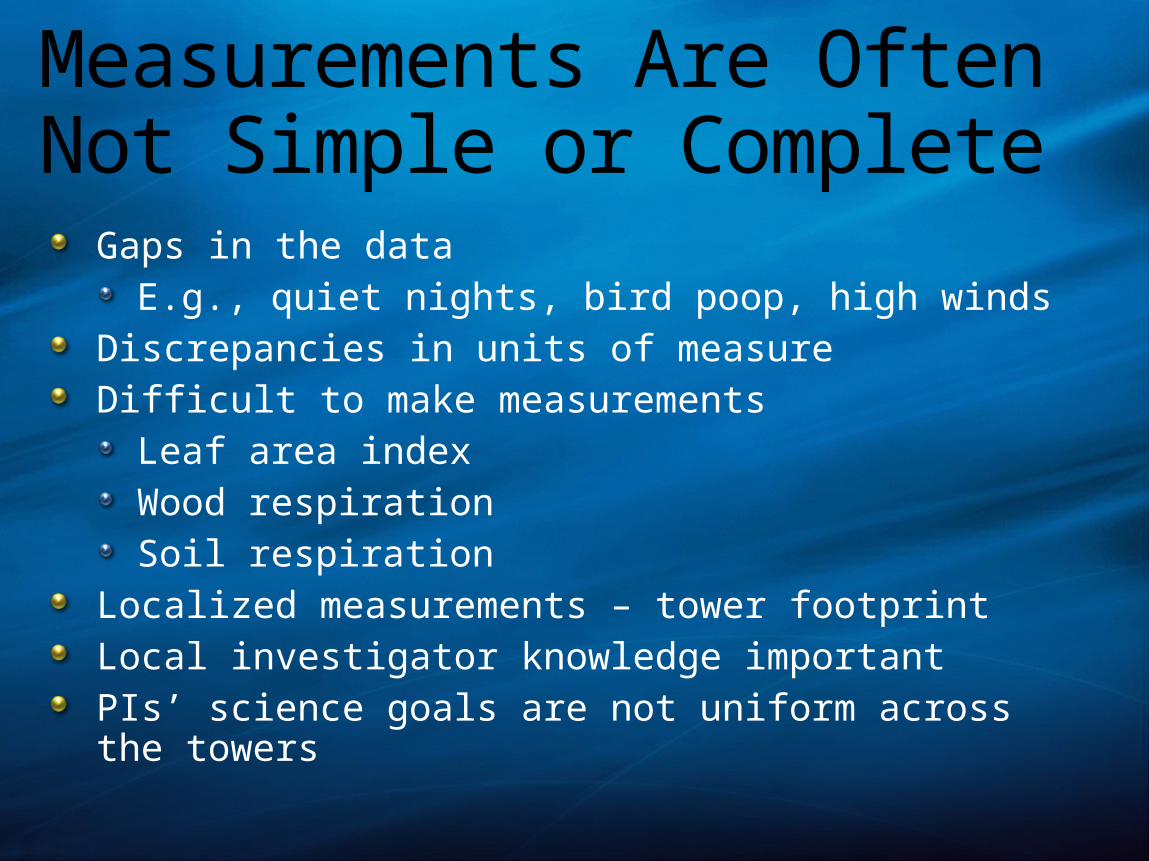
Measurements Are Often Not Simple or Complete
Gaps in the data E.g., quiet nights, bird poop, high winds
Discrepancies in units of measureDifficult to make measurements
Leaf area indexWood respirationSoil respiration
Localized measurements – tower footprintLocal investigator knowledge importantPIs’ science goals are not uniform across the towers
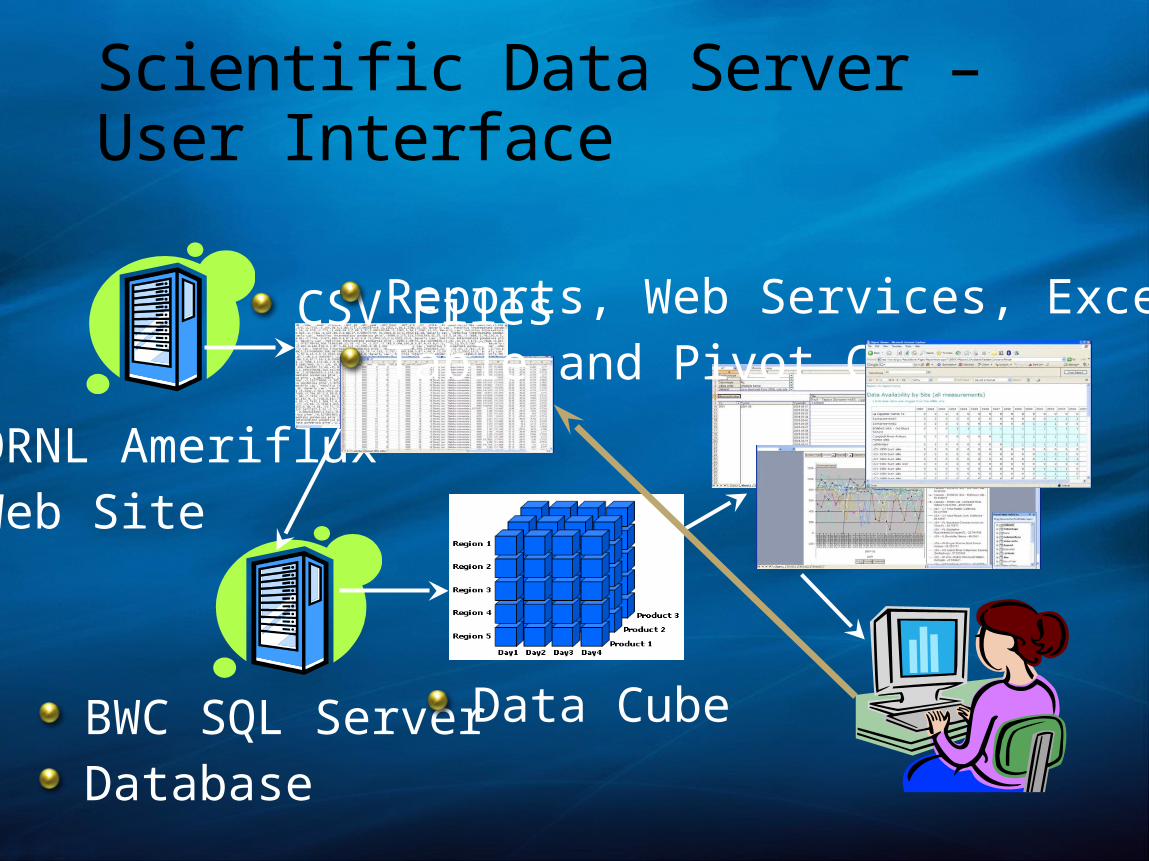
Scientific Data Server – User Interface
ORNL AmerifluxWeb Site
CSV Files
BWC SQL Server Database
Data Cube
Reports, Web Services, Excel Pivot Table and Pivot Chart
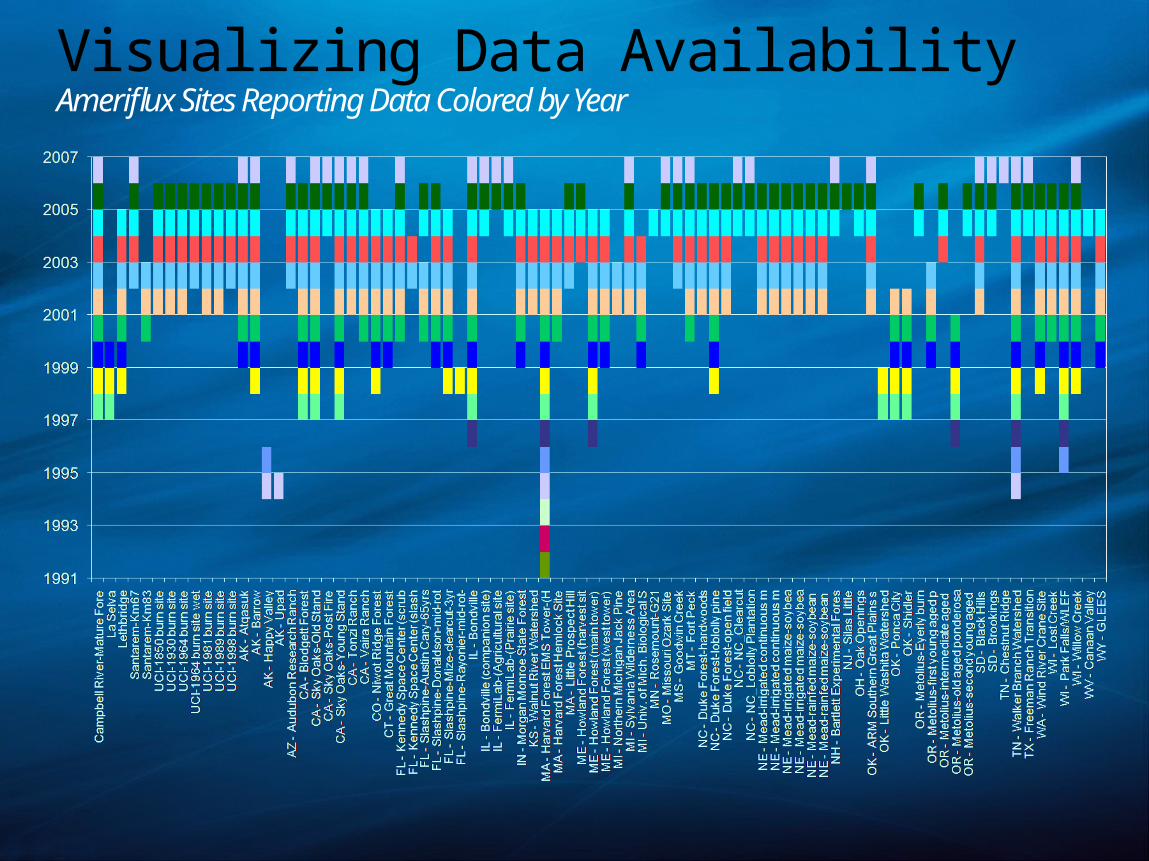
Visualizing Data AvailabilityAmeriflux Sites Reporting Data Colored by Year
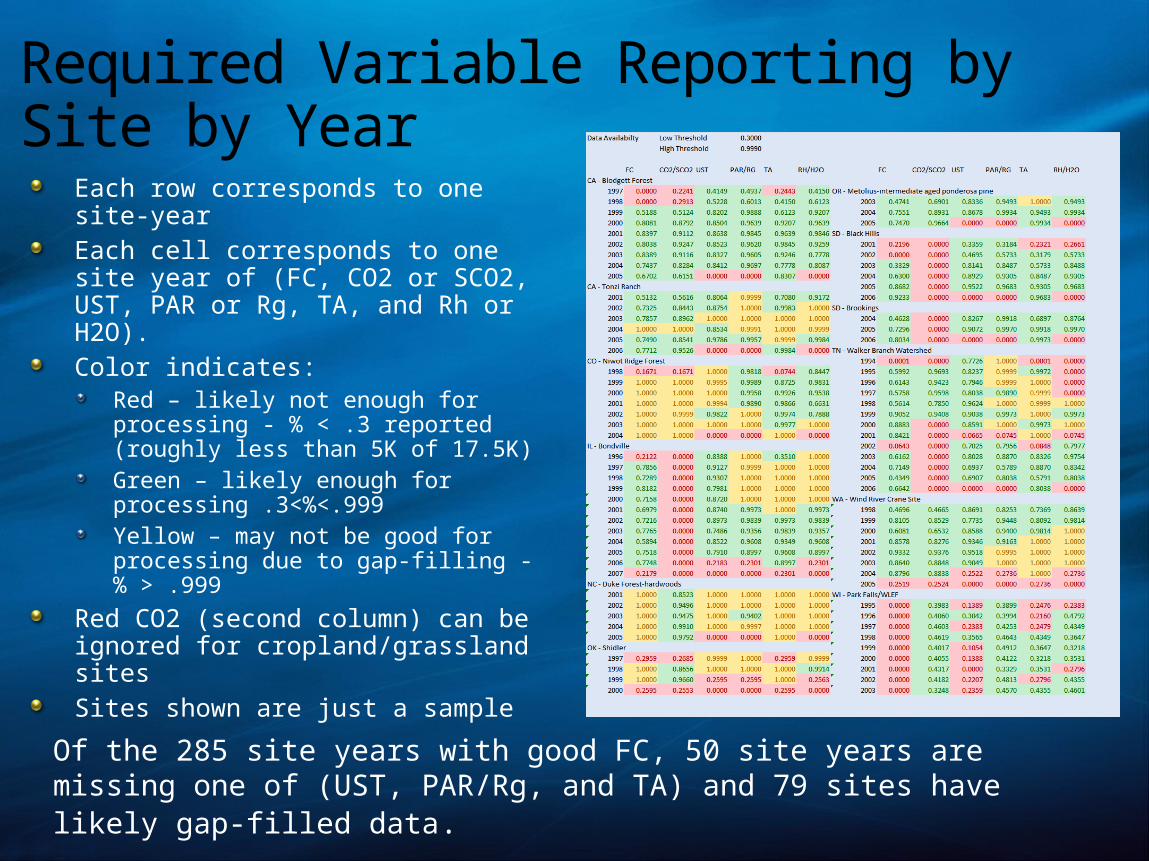
Required Variable Reporting by Site by Year
Each row corresponds to one site-year Each cell corresponds to one site year of (FC, CO2 or SCO2, UST, PAR or Rg, TA, and Rh or H2O). Color indicates:
Red – likely not enough for processing - % < .3 reported (roughly less than 5K of 17.5K)Green – likely enough for processing .3<%<.999 Yellow – may not be good for processing due to gap-filling - % > .999
Red CO2 (second column) can be ignored for cropland/grassland sitesSites shown are just a sample
Of the 285 site years with good FC, 50 site years are missing one of (UST, PAR/Rg, and TA) and 79 sites have likely gap-filled data.
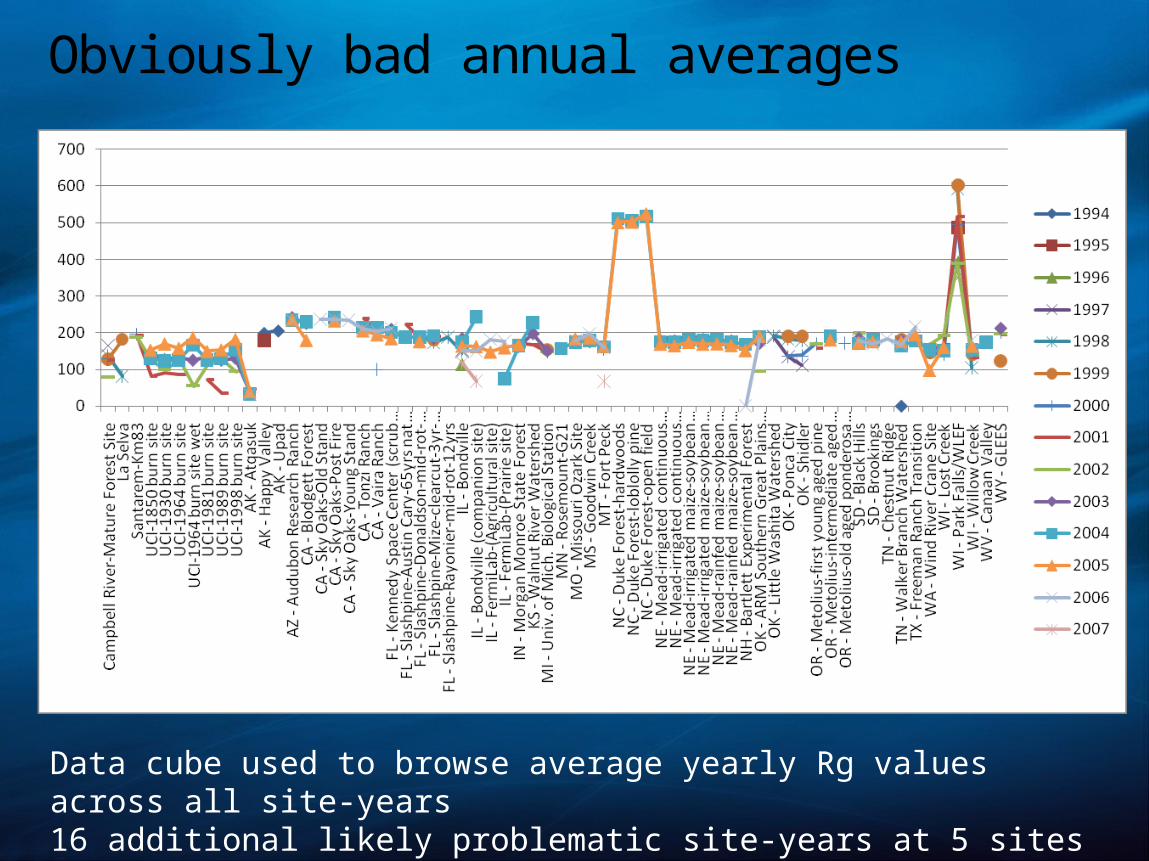
Obviously bad annual averages
Data cube used to browse average yearly Rg values across all site-years16 additional likely problematic site-years at 5 sites
Case study
High-Throughput Genomics
Data Modeling, In-situ Data Management, Aggregation in database
Collaboration with Prof. Uwe Roehm

1000 Genome PipelineWet Lab:SamplePreparation
IlluminaSequencer
1 flowcell
1 image per tile / base / cycle
Level 0 Data:TIF Images
Level 1 Data:Short Reads
Image analysis
Reference Seq.
Level 2 Data:Alignments
Alignment
Level 3 Data:Sequences
380,160 images 8 SRF files (1 per lane) 1 file per lane 1 file per sample
750 GB / run 10-15 GB / run 0.5 GB / run ~3 GB
Consensus

About the Scale of the Problem
Sanger Institute has currently 28 instruments24 x 7 (in avg 20 in use at any given time)=> per week: ~75 TB Level 0 data (images) 0.5 TB Level 1 data (short-reads)
Plan for another 10 Solexas by end of yearOnly one of 3 labs worldwideTechnology constantly improving

Level 2 Data
Reference Data
Workflow Meta-Data
Level 1 Data
ReferenceSeq
has
belongs to
1
N
1..N
M
N1
readlen sequence
sequence
pos strand
insert size
paired flag# mismatchessum qual
mapping qual
# 0 mismatches in first 24bp# 1 mismatches in first 24bp
Project
id
has
1
+ProvenanceData !!
Library
Nnr
quality-arr
date
title
lanes
description
nrlane
tile
coord1
coord2
Alignment
1..N
seq_id
name
Instrument Run
1..8
1..2
id startdate
+more dataabt. refseqs
Paired runs:Same batch, but
2 consequtive instrument runs
consistsof
Read
1
consistsof
Sample
Nid
description
depth
machineId
paired
flowcell_id
lanes
comment
…
name
concentration
…
Level 3 Data
define1
sequenceseq_id
Batch
runs
1
1..N
batch_id
pairNo
controlLane
read datais probabilistic
SNPcalling
N M
Concensus
description
Data Model

EDM Model
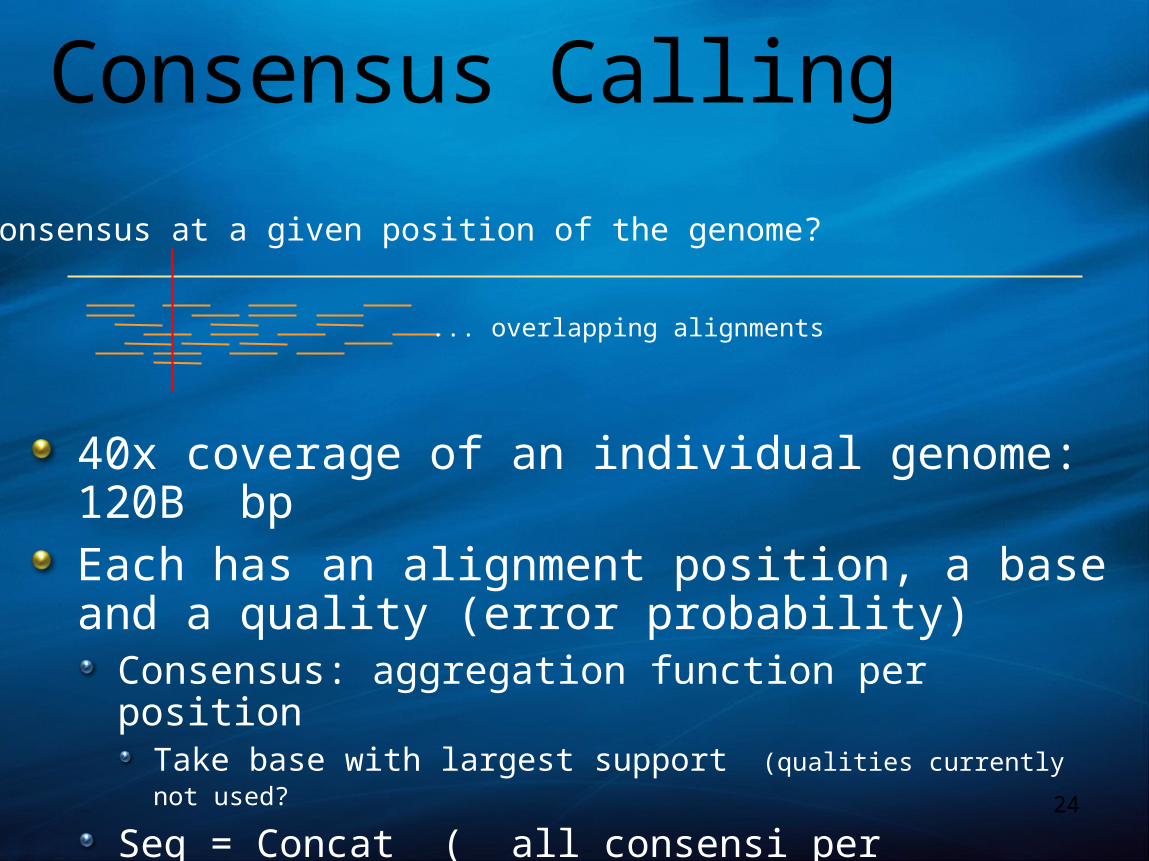
Consensus Calling
40x coverage of an individual genome: 120B bpEach has an alignment position, a base and a quality (error probability)
Consensus: aggregation function per positionTake base with largest support (qualities currently not used?
Seq = Concat ( all consensi per position )24
... overlapping alignments
Consensus at a given position of the genome?

Aggregation to the ExtremeImagine, we could assemble a whole
genome inside the database:
Shows benefits of SQL-CLR integration
25
SELECT chromosome, AssembleSequence(position,base) FROM ( SELECT chromosome,position, CallBase(base,qual) FROM Alignments CROSS APPLY PivotAlignment(position,strand,seq,quals) WHERE a_e_id=… GROUP BY chromosome, position ) GROUP BY chromosome

Consensus calling
26

Consensus calling
PivotAlignment(…)Table-valued function that pivots a short-read (with quality values) into table of the form: (position, base, quality)
CallBase(b,q)aggregate function that decides which base is the consensus among all alignments on a pos.
SELECT chromosome,position, CallBase(base,qual) FROM Alignments CROSS APPLY PivotAlignment(position,strand,seq,quals) WHERE a_e_id=… GROUP BY chromosome, position

Thank you!
Happy Birthday Alex!

© 2007 Microsoft Corporation. All rights reserved. Microsoft, Windows, Windows Vista and other product names are or may be registered trademarks and/or trademarks in the U.S. and/or other countries. The information herein is for informational purposes only and represents the current view of Microsoft Corporation as of the date of this presentation. Because Microsoft must respond to changing market conditions, it should not be interpreted to be a commitment on the part of Microsoft, and Microsoft cannot guarantee the accuracy of any information provided
after the date of this presentation. MICROSOFT MAKES NO WARRANTIES, EXPRESS, IMPLIED OR STATUTORY, AS TO THE INFORMATION IN THIS PRESENTATION.