jordan food security survey in the poverty pockets august
TRANSCRIPT
Jordan Food Security Survey in the Poverty Pockets
August-September 2008
(JAAH)
2
Contents Executive Summary ............................................................................................... 4 Introduction ............................................................................................................ 6 Part 1- Study objectives and methodology ......................................................... 8
1.1 Objectives ................................................................................................. 8 1.2 Methodology.............................................................................................. 8 1.3 Limitations ................................................................................................. 9
Part 2 – Survey Results ....................................................................................... 10 2.1 Family and socioeconomic characteristics .............................................. 10 2.1.1 Family size ........................................................................................... 10 2.1.2 Education ............................................................................................. 10 2.1.3 Health................................................................................................... 11 2.1.4 Migration .............................................................................................. 11 2.2 Livelihoods and sources of income ......................................................... 11 2.2.1 Distribution of Livelihoods .................................................................... 11 2.2.2 Income ................................................................................................. 13 2.2.3 Income trends ...................................................................................... 15 2.3 Family Expenditures................................................................................ 16 2.3.1 Expenditures distribution...................................................................... 16 2.3.2 Expenditures trends ............................................................................. 17 2.3.3 Debts and loans ................................................................................... 18
Part 3- Food security ........................................................................................... 20 3.1 Household food consumption pattern ..................................................... 20 3.2 Coping strategies .................................................................................... 21 3.3 Household Food Consumption Score ..................................................... 21 3.3.1 Household Food Consumption profiles ................................................ 21 3.3.2 Geographic Distribution of Consumption Profiles................................. 22 3.4 Food Access ........................................................................................... 23 3.4.1 Geographic distribution of access profiles ........................................... 24 3.5 Household Food security ........................................................................ 25 3.5.1 Food security profiling .......................................................................... 25 3.5.2 Geographic breakdown of food security profiles .................................. 26 3.5.3 Food security and the level of education.............................................. 27 3.5.4 Food security and the family size......................................................... 27 3.5.5 Food security in urban and rural setups............................................... 28 3.6 Food security and the agricultural potentials........................................... 28 3.6.1 Agricultural eco-zones.......................................................................... 29
Part 4 - Assistance available............................................................................... 35 4.1 Overall level of assistance ...................................................................... 35 4.2 Prevailing types of assistance................................................................. 35
Recommendations ............................................................................................... 36 Annex I: Food security questionnaire................................................................ 38 Annex II: Food security map of Jordan.............................................................. 45
3
Figures and Tables Table 1: Breakdown of HHH as per the level of education .................................... 11 Table 2: Distribution of households as per the source of income .......................... 12 Table 3: Average Monthly income per household (JOD) ....................................... 13 Table 4: Change trends of income compared to same period of last year............. 15 Table 5: Monthly Income/Expenditure gap as per poverty pockets ....................... 17 Table 6: Average monthly expenditures trend for Energy, Food and Transportation
....................................................................................................................... 18 Table 7: Food groups and items used in the FCS.................................................. 21 Table 8: Household food consumption profiles ...................................................... 22 Table 9: Geographic Distribution of Consumption Profiles .................................... 22 Table 10: Household access profiling .................................................................... 24 Table 11: Geographic distribution of access groups (%) ....................................... 24 Table 12: Household food security Profiles............................................................ 25 Table 13: Poverty pockets under eco-zone 1......................................................... 29 Table 14: Most reported factors hindering plant production................................... 30 Table 15: Most reported factors hindering animal production activities ................. 30 Table 16: Food security levels in eco-zone 1......................................................... 30 Table 17: Poverty pockets under eco-zone 2......................................................... 31 Table 18: Most reported factors hindering plant production in eco-zone 2 ............ 31 Table 19: Most reported factors hindering animal production activities in eco-zone 2
....................................................................................................................... 32 Table 20: Food security levels in eco-zone 2......................................................... 32 Table 21: Poverty pockets under eco-zone 3......................................................... 33 Table 22: Most reported factors hindering plant production................................... 33 Table 23: Most reported factors hindering animal production activities ................. 34 Table 24: Food security levels in eco-zone 1......................................................... 34
Figure 1: Consumer Price index in Jordan 2004-2009............................................. 6 Figure 2: Average family size in the surveyed area compared to the national
average .......................................................................................................... 10 Figure 3: Households Subsiding on Gifts and Handouts (%)................................. 11 Figure 4: Average Monthly income per source of income-JOD (Top six)............... 14 Figure 5: : Breakdown of monthly expenditures among food and non-food items . 16 Figure 6: Distribution of debts, loans and borrowings according to the reason ..... 19 Figure 7: Distribution of families who changed their food consumption pattern as
per the number of adapted routines ............................................................... 20 Figure 8: Distribution of food security profiles in poverty pockets with highest rates
of food insecurity (%)...................................................................................... 26 Figure 9: Relationship between food security and the level of education .............. 27 Figure 10: Relationship between food security and the family size ....................... 28
4
Executive Summary
The report presents the findings of a High Food Price increase survey, which came in a time where the world has gone through an unprecedented increase in food prices. The crises has laid heavy burdens on the whole world, and jeopardized the food security of developing and underdeveloped countries. A number of studies have discussed food security at the macro level, but this survey is considered the first at the household level. The objective of the survey is to assess the impact of food price increase on the food security in the pockets of poverty, identified by the Ministry of Planning and International Cooperation (MoPIC), and identify the areas most vulnerable to food insecurity. The survey should help the Jordanian Alliance Against Hunger (JAAH) to prioritize their assistance and interventions, in light of the findings. The average family size of the surveyed area was found at 6.6 members; which is higher than the national family size of 5.4 members per family. This fact was further analyzed and found to have a direct relationship with the level of food security. Families with large number of members revealed higher levels of food insecurity than smaller families. The rate of illiteracy among heads of households is considerably higher than the national average. At 44 years average age of the heads of households, 25% illiteracy rate is said t be high. The figures revealed a rather important fact; almost 70% of the bread makers are employees, whether by government, military/civil defense/public security bodies, or by private sector firms. The fact that leaves most of the households highly dependant on salary adjustments in coping with external shocks and prices' fluctuations. Almost 11% of the households are totally dependent on gifts and handouts. A rather worrying fact that requires further investigation. Those are concentrated in the areas of Roweished, Salihiya, North Ghour, and least found in Bseira, Deisi and Balaama. The share of food expenditures is in line with the national rate of 36.5%. Yet, in absolute terms, the average monthly food expenditures per capita are significantly lower than the national average. While the calculated national average monthly expenditures on food is 41 JOD per capita, this number is almost halved in the poverty pockets at 17.1 JOD. The income/expenditure gap was estimated at 21%. A fact that reveals negative savings and suggests a prevailing pattern of increased dependency on remittances, loans, and assets liquidation. A percentage of 25-50% increase was reported in food, energy and transportation expenditures by 82%, 86% and 85% of the households respectively. The study revealed an expected reaction of households' spending behavior in response to the global/national food/energy price increases. The increase in food prices was most reported in the areas of Housha, Roweished, Qatrana, North Ghour and Salihiya. Energy expenditure increases were mostly felt in the areas of North West Badia, Housha, Qatrana, Arajan and North Ghour, while the highest reported cases in transportation expenditure increase were in the areas of North West Badia, North Ghour, Housha, Wadi Araba and Salihiya.
5
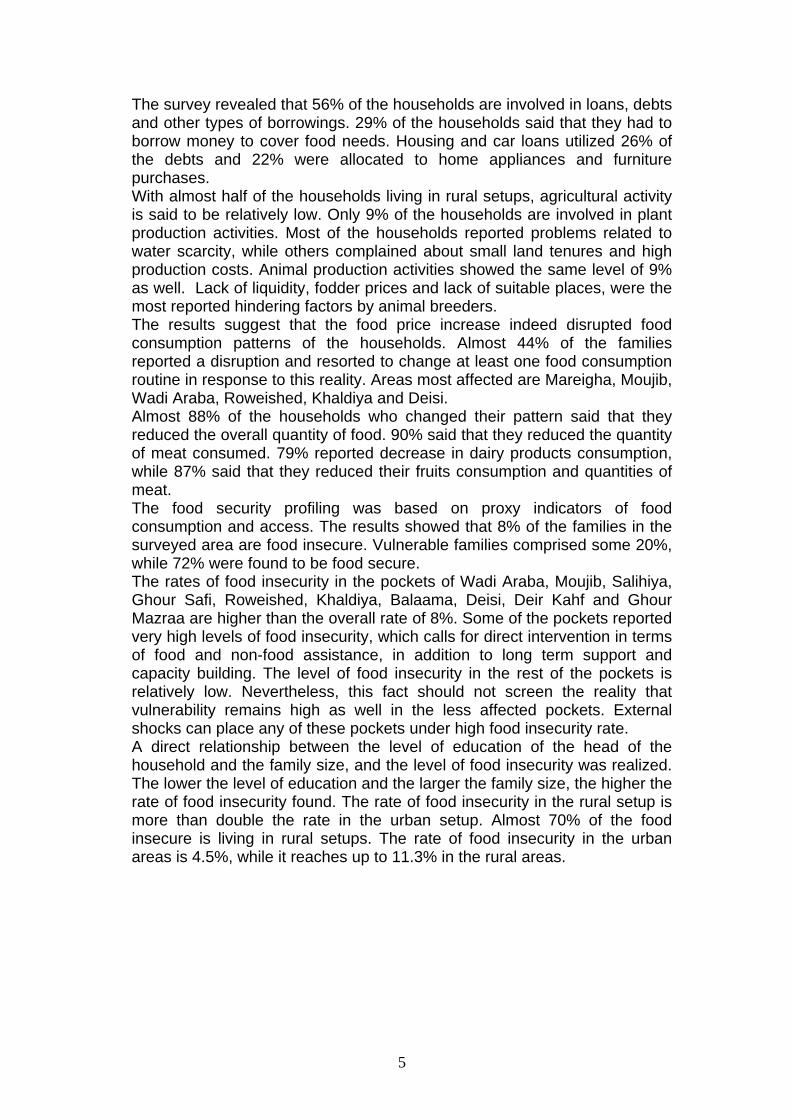
The survey revealed that 56% of the households are involved in loans, debts and other types of borrowings. 29% of the households said that they had to borrow money to cover food needs. Housing and car loans utilized 26% of the debts and 22% were allocated to home appliances and furniture purchases. With almost half of the households living in rural setups, agricultural activity is said to be relatively low. Only 9% of the households are involved in plant production activities. Most of the households reported problems related to water scarcity, while others complained about small land tenures and high production costs. Animal production activities showed the same level of 9% as well. Lack of liquidity, fodder prices and lack of suitable places, were the most reported hindering factors by animal breeders. The results suggest that the food price increase indeed disrupted food consumption patterns of the households. Almost 44% of the families reported a disruption and resorted to change at least one food consumption routine in response to this reality. Areas most affected are Mareigha, Moujib, Wadi Araba, Roweished, Khaldiya and Deisi. Almost 88% of the households who changed their pattern said that they reduced the overall quantity of food. 90% said that they reduced the quantity of meat consumed. 79% reported decrease in dairy products consumption, while 87% said that they reduced their fruits consumption and quantities of meat. The food security profiling was based on proxy indicators of food consumption and access. The results showed that 8% of the families in the surveyed area are food insecure. Vulnerable families comprised some 20%, while 72% were found to be food secure. The rates of food insecurity in the pockets of Wadi Araba, Moujib, Salihiya, Ghour Safi, Roweished, Khaldiya, Balaama, Deisi, Deir Kahf and Ghour Mazraa are higher than the overall rate of 8%. Some of the pockets reported very high levels of food insecurity, which calls for direct intervention in terms of food and non-food assistance, in addition to long term support and capacity building. The level of food insecurity in the rest of the pockets is relatively low. Nevertheless, this fact should not screen the reality that vulnerability remains high as well in the less affected pockets. External shocks can place any of these pockets under high food insecurity rate. A direct relationship between the level of education of the head of the household and the family size, and the level of food insecurity was realized. The lower the level of education and the larger the family size, the higher the rate of food insecurity found. The rate of food insecurity in the rural setup is more than double the rate in the urban setup. Almost 70% of the food insecure is living in rural setups. The rate of food insecurity in the urban areas is 4.5%, while it reaches up to 11.3% in the rural areas.
6
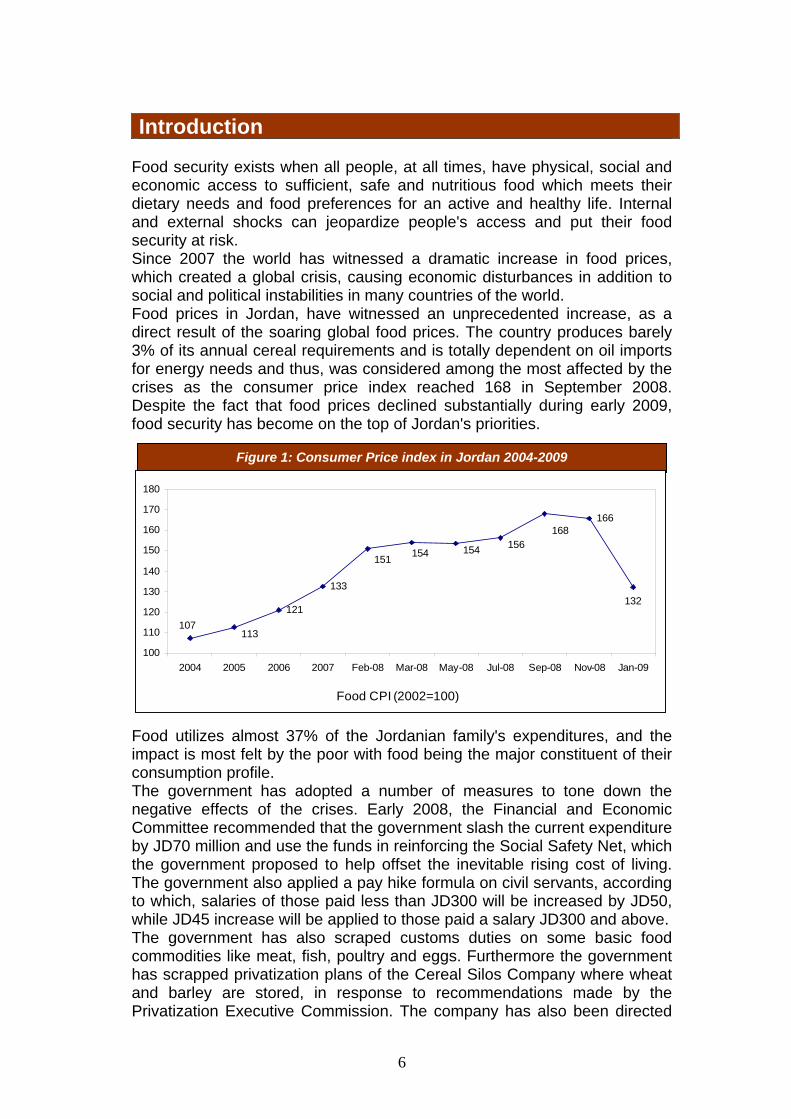
Figure 1: Consumer Price index in Jordan 2004-2009
Food CPI (2002=100)
121
133
166
107113
151 154
132
168156154
100
110
120
130
140
150
160
170
180
2004 2005 2006 2007 Feb-08 Mar-08 May-08 Jul-08 Sep-08 Nov-08 Jan-09
Introduction
Food security exists when all people, at all times, have physical, social and economic access to sufficient, safe and nutritious food which meets their dietary needs and food preferences for an active and healthy life. Internal and external shocks can jeopardize people's access and put their food security at risk. Since 2007 the world has witnessed a dramatic increase in food prices, which created a global crisis, causing economic disturbances in addition to social and political instabilities in many countries of the world. Food prices in Jordan, have witnessed an unprecedented increase, as a direct result of the soaring global food prices. The country produces barely 3% of its annual cereal requirements and is totally dependent on oil imports for energy needs and thus, was considered among the most affected by the crises as the consumer price index reached 168 in September 2008. Despite the fact that food prices declined substantially during early 2009, food security has become on the top of Jordan's priorities. Food utilizes almost 37% of the Jordanian family's expenditures, and the impact is most felt by the poor with food being the major constituent of their consumption profile. The government has adopted a number of measures to tone down the negative effects of the crises. Early 2008, the Financial and Economic Committee recommended that the government slash the current expenditure by JD70 million and use the funds in reinforcing the Social Safety Net, which the government proposed to help offset the inevitable rising cost of living. The government also applied a pay hike formula on civil servants, according to which, salaries of those paid less than JD300 will be increased by JD50, while JD45 increase will be applied to those paid a salary JD300 and above. The government has also scraped customs duties on some basic food commodities like meat, fish, poultry and eggs. Furthermore the government has scrapped privatization plans of the Cereal Silos Company where wheat and barley are stored, in response to recommendations made by the Privatization Executive Commission. The company has also been directed
7
to expand its storage capacities of these two strategic commodities and to supply them to all governorates in Jordan. World Food Programme (WFP) and the Jordanian Alliance Against Hunger (JAAH) who are mandated to work towards reducing hunger and improving food security of the poor in Jordan, have realized the importance of assessing the impact of food price increase on the food security in the poverty pockets. The survey should also draw a baseline and recommend prioritized intervention areas for the Alliance. This survey is considered as the first at the household level in the field of food security.

8
Part 1- Study objectives and methodology
1.1 Objectives The general objective of the survey is to assess the impact of food price increase on the food security in the pockets of poverty and to help JAAH to formulate guidelines to identify the most vulnerable areas to prioritize their assistance and interventions. More specifically, the survey aims at:
• Collecting baseline data on food security at the household level in the pockets of poverty, identified in the latest poverty surveys by the Ministry of Planning and International Cooperation (MOPIC) and Department of Statistics (DoS).
• Identifying and characterizing areas within poverty pockets, that are most vulnerable to food insecurity, and most affected by food price increase.
• Establishing database flexible enough to map areas with different level of food vulnerability, monitor development and changing pattern of livelihood in different areas as impacted by changing economic conditions and food accessibility, and poverty lines within areas of different social, economical conditions, and within areas of different level of environmental stresses.
• Characterizing means of sustained assistance for targeted groups to improve their livelihoods.
1.2 Methodology A household questionnaire was designed to collect quantitative and qualitative data, in 20 sub-districts, identified by the MoPIC as poverty pockets. The questionnaire collected data on household demographics, health, income, expenditures, agricultural activities, food consumption and patterns, coping mechanisms and shocks. 91 enumerators were trained on the questionnaire. They were familiarized with the new concepts related to food security and special attention was paid to the recall periods for the purposes of the survey. The data was collected during Mid August till early September 2008. The two stage-sample frame consisted of 3,000 households and was designed and withdrawn by the DoS. All data was then analyzed using SPSS.
9
1.3 Limitations The survey was conducted as rigorously as possible, nevertheless, some limitations must be highlighted: Representation: The results of the survey are representative at the level of poverty pockets only. No generalizations can be made at the country level. More geographic areas are to be surveyed in order to generalize the results on country level. Quality: The quality of data may have been affected due to inaccurate information pertaining to recall periods. Although, the enumerators have emphasized that no direct benefits are to be expected being selected in the survey, social desirability and expectations may have had a negative effect on the data quality. Questionnaire: In order to assure common understanding of all terminology, all enumerators were trained by the same facilitators, and were given adequate time to understand the questionnaire. Nevertheless, it was expected that a number of enumerators demonstrate a slightly different understanding of some terminologies. Limited use of some figures: Some of the figures were calculated based on limited volume of data. These figures were used as proxy indicators for the purposes of this survey, and should be dealt with carefully in other contexts.
10
Part 2 – Survey Results
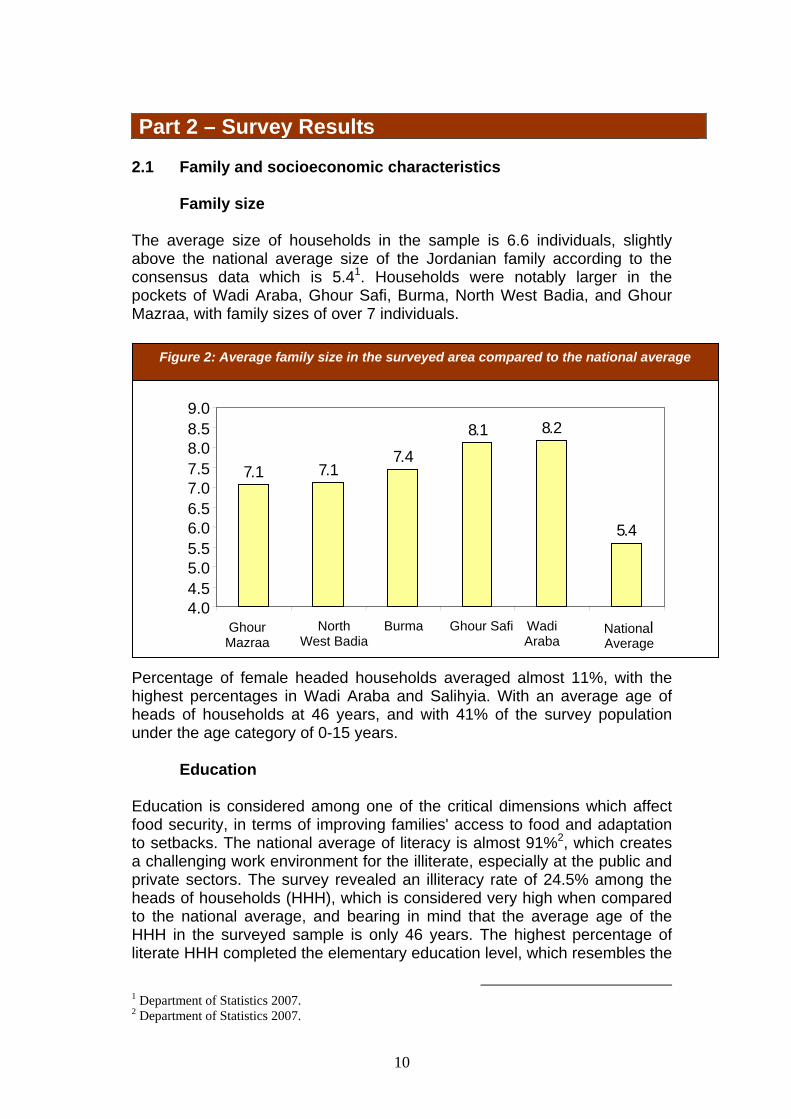
2.1 Family and socioeconomic characteristics Family size The average size of households in the sample is 6.6 individuals, slightly above the national average size of the Jordanian family according to the consensus data which is 5.41. Households were notably larger in the pockets of Wadi Araba, Ghour Safi, Burma, North West Badia, and Ghour Mazraa, with family sizes of over 7 individuals. Percentage of female headed households averaged almost 11%, with the highest percentages in Wadi Araba and Salihyia. With an average age of heads of households at 46 years, and with 41% of the survey population under the age category of 0-15 years. Education Education is considered among one of the critical dimensions which affect food security, in terms of improving families' access to food and adaptation to setbacks. The national average of literacy is almost 91%2, which creates a challenging work environment for the illiterate, especially at the public and private sectors. The survey revealed an illiteracy rate of 24.5% among the heads of households (HHH), which is considered very high when compared to the national average, and bearing in mind that the average age of the HHH in the surveyed sample is only 46 years. The highest percentage of literate HHH completed the elementary education level, which resembles the
1 Department of Statistics 2007. 2 Department of Statistics 2007.
7.1 7.17.4
8.1 8.2
5.4
4.04.55.05.56.06.57.07.58.08.59.0
Ghour Mazraa
North West Badia
Burma Ghour Safi WadiAraba
NationalAverage
Figure 2: Average family size in the surveyed area compared to the national average
11
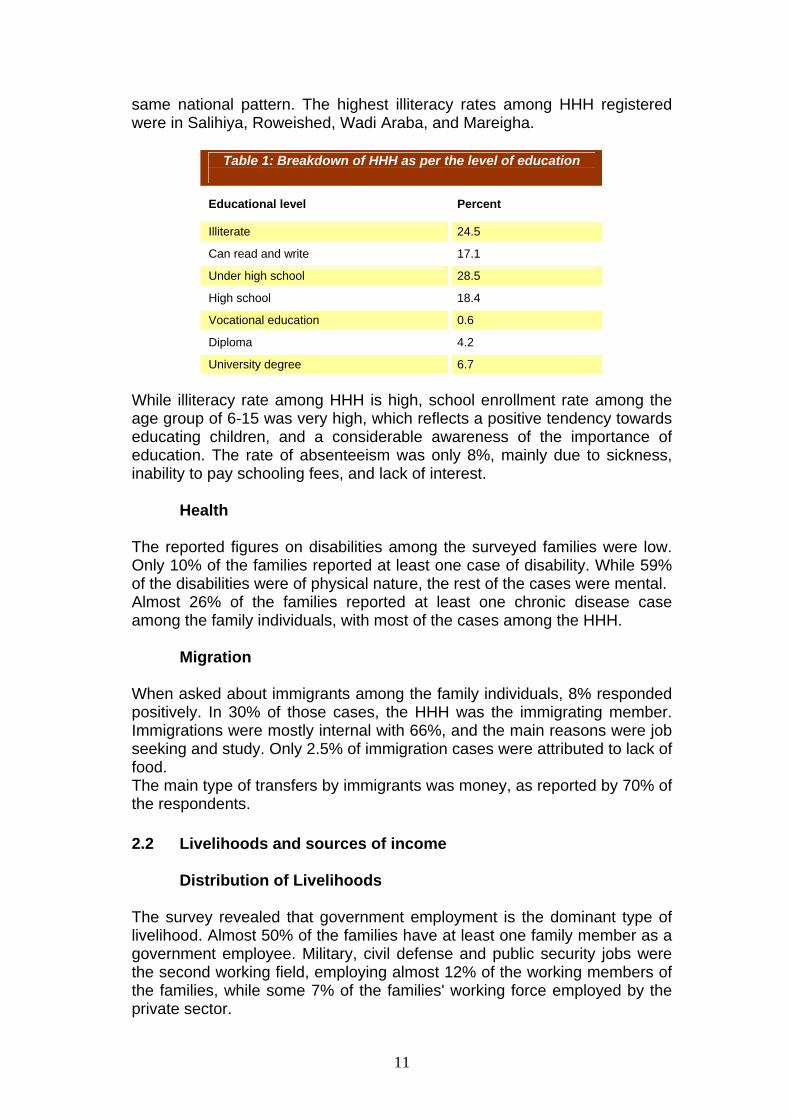
same national pattern. The highest illiteracy rates among HHH registered were in Salihiya, Roweished, Wadi Araba, and Mareigha.
Table 1: Breakdown of HHH as per the level of education
Educational level Percent
Illiterate 24.5
Can read and write 17.1
Under high school 28.5
High school 18.4
Vocational education 0.6
Diploma 4.2
University degree 6.7 While illiteracy rate among HHH is high, school enrollment rate among the age group of 6-15 was very high, which reflects a positive tendency towards educating children, and a considerable awareness of the importance of education. The rate of absenteeism was only 8%, mainly due to sickness, inability to pay schooling fees, and lack of interest. Health The reported figures on disabilities among the surveyed families were low. Only 10% of the families reported at least one case of disability. While 59% of the disabilities were of physical nature, the rest of the cases were mental. Almost 26% of the families reported at least one chronic disease case among the family individuals, with most of the cases among the HHH. Migration When asked about immigrants among the family individuals, 8% responded positively. In 30% of those cases, the HHH was the immigrating member. Immigrations were mostly internal with 66%, and the main reasons were job seeking and study. Only 2.5% of immigration cases were attributed to lack of food. The main type of transfers by immigrants was money, as reported by 70% of the respondents.
2.2 Livelihoods and sources of income Distribution of Livelihoods
The survey revealed that government employment is the dominant type of livelihood. Almost 50% of the families have at least one family member as a government employee. Military, civil defense and public security jobs were the second working field, employing almost 12% of the working members of the families, while some 7% of the families' working force employed by the private sector.
12
0
20
40
60
80
100
Roweished Salihiya NorthGhour
Bseria Desi Balaama Total
Gifts and Handouts Other sources of income
Table 2: Distribution of households as per the
source of income
Source Percent
Government employee/retirees 49.6
Private sector employee 7.3
Trade 1.6
Real estate business 0.3
Money transfer 0.3
Family business 2.1
Daily labor 6.8
Transport 1.2
Plant production 1.7
Animal production 1.1 Daily labor (in kind payment) 1.0
Gifts and handouts 11.1
Handicrafts 1.1
Home garden sales 0.1
Sell of animals 0.2 Militant/civil defense/public security 12.4
Other 2.1
Total 100.0
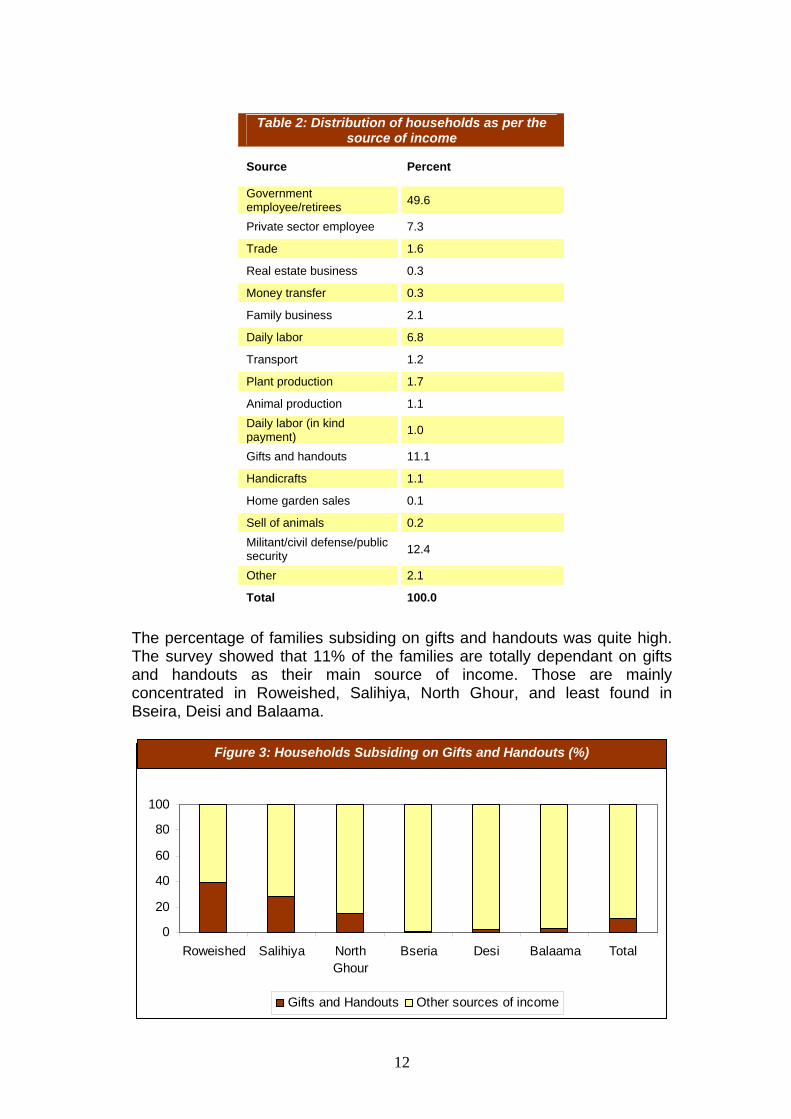
The percentage of families subsiding on gifts and handouts was quite high. The survey showed that 11% of the families are totally dependant on gifts and handouts as their main source of income. Those are mainly concentrated in Roweished, Salihiya, North Ghour, and least found in Bseira, Deisi and Balaama.
Figure 3: Households Subsiding on Gifts and Handouts (%)
13
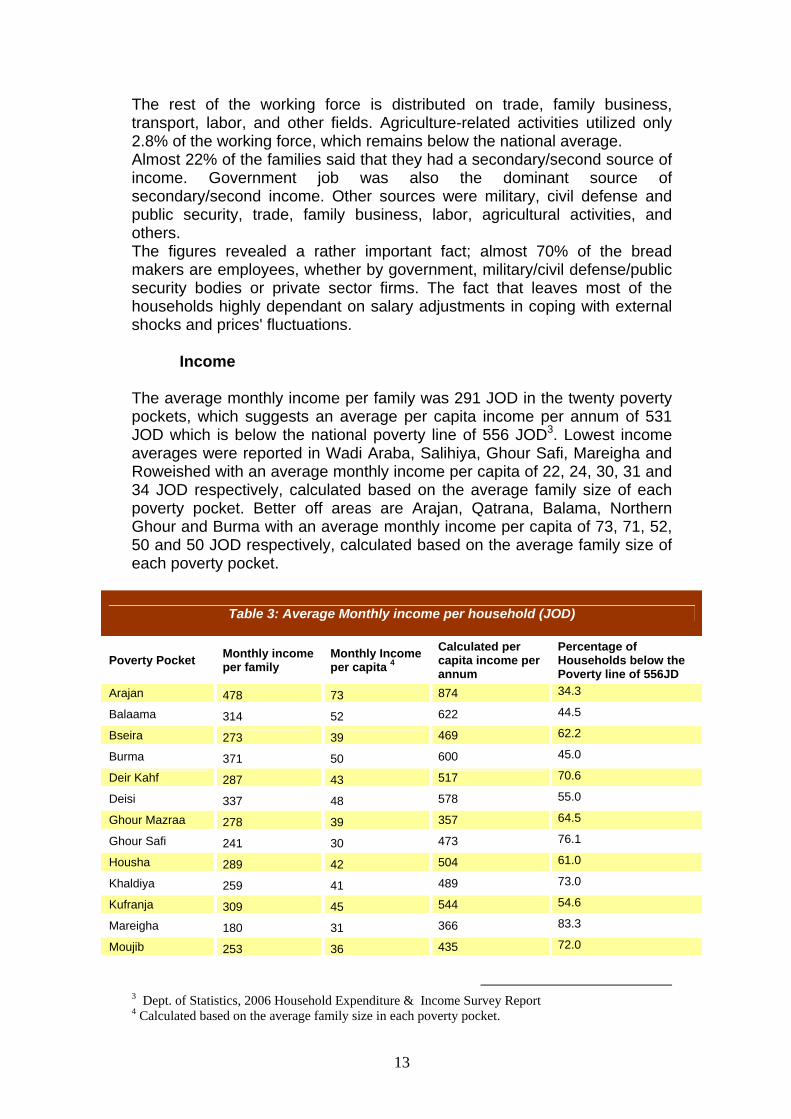
The rest of the working force is distributed on trade, family business, transport, labor, and other fields. Agriculture-related activities utilized only 2.8% of the working force, which remains below the national average. Almost 22% of the families said that they had a secondary/second source of income. Government job was also the dominant source of secondary/second income. Other sources were military, civil defense and public security, trade, family business, labor, agricultural activities, and others. The figures revealed a rather important fact; almost 70% of the bread makers are employees, whether by government, military/civil defense/public security bodies or private sector firms. The fact that leaves most of the households highly dependant on salary adjustments in coping with external shocks and prices' fluctuations. Income The average monthly income per family was 291 JOD in the twenty poverty pockets, which suggests an average per capita income per annum of 531 JOD which is below the national poverty line of 556 JOD3. Lowest income averages were reported in Wadi Araba, Salihiya, Ghour Safi, Mareigha and Roweished with an average monthly income per capita of 22, 24, 30, 31 and 34 JOD respectively, calculated based on the average family size of each poverty pocket. Better off areas are Arajan, Qatrana, Balama, Northern Ghour and Burma with an average monthly income per capita of 73, 71, 52, 50 and 50 JOD respectively, calculated based on the average family size of each poverty pocket.
Table 3: Average Monthly income per household (JOD)
Poverty Pocket Monthly income per family
Monthly Income per capita 4
Calculated per capita income per annum
Percentage of Households below the Poverty line of 556JD
Arajan 478 73 874 34.3
Balaama 314 52 622 44.5
Bseira 273 39 469 62.2
Burma 371 50 600 45.0
Deir Kahf 287 43 517 70.6
Deisi 337 48 578 55.0
Ghour Mazraa 278 39 357 64.5
Ghour Safi 241 30 473 76.1
Housha 289 42 504 61.0
Khaldiya 259 41 489 73.0
Kufranja 309 45 544 54.6
Mareigha 180 31 366 83.3
Moujib 253 36 435 72.0
3 Dept. of Statistics, 2006 Household Expenditure & Income Survey Report 4 Calculated based on the average family size in each poverty pocket.

14
238
268265264
318329 335
100
150
200
250
300
350
Governmentemployee/ret irees
Private sectoremployee
M ilitant/civildefense/public
security
Trade M oney transfer Real estatebusiness
Total Average
Table 3: Average Monthly income per household (JOD)
Poverty Pocket Monthly income per family
Monthly Income per capita 5
Calculated per capita income per annum
Percentage of Households below the Poverty line of 556JD
North Ghour 302 50 460 52.0
North West Badia 273 38 606 66.9
Qatrana 367 71 849 28.6
Queira 312 47 565 55.9
Roweished 220 34 409 68.8
Salihiya 160 24 282 78.7
Wadi Araba 177 22 261 87.5
Total average 291 44 531 58.8
Continued The calculated per capita income per annum suggests that 60% of the households are below the poverty line of 5566 JOD per capita per annum. The poverty rates are considerably high in all the pockets. The poverty rates in Qatrana, Arajan, Burma and Balaama are below 50%, but they remain above the national rate. It is worth mentioning that this rate is calculated based on limited amount of data, and should be cautiously considered, though, it can be used as a proxy indicator for the purposes of this survey. The survey revealed that real estate business, money transfer, and trade were the sources of highest returns. Followed by employees of army/civil defense/public security, private sector, and government.
5 Calculated based on the average family size in each poverty pocket. 6 Department of Statistics
Figure 4: Average Monthly income per source of income-JOD (Top six)
15
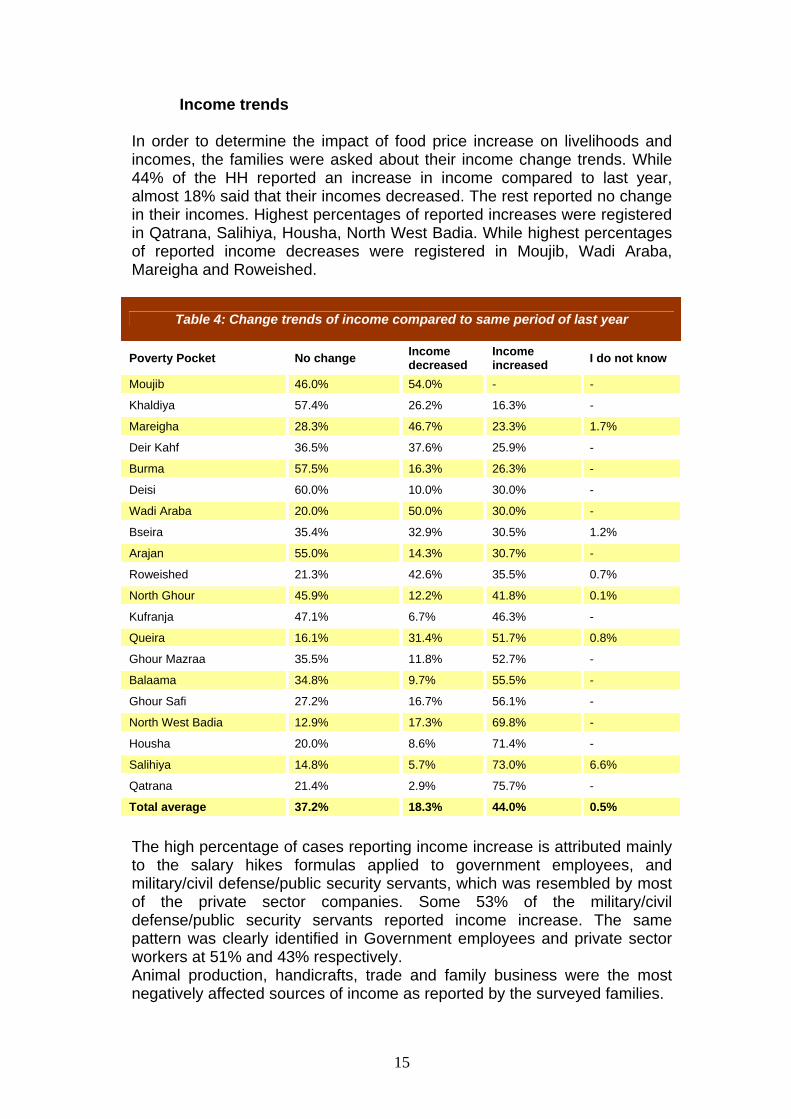
Income trends
In order to determine the impact of food price increase on livelihoods and incomes, the families were asked about their income change trends. While 44% of the HH reported an increase in income compared to last year, almost 18% said that their incomes decreased. The rest reported no change in their incomes. Highest percentages of reported increases were registered in Qatrana, Salihiya, Housha, North West Badia. While highest percentages of reported income decreases were registered in Moujib, Wadi Araba, Mareigha and Roweished.
Table 4: Change trends of income compared to same period of last year
Poverty Pocket No change Income decreased
Income increased I do not know
Moujib 46.0% 54.0% - -
Khaldiya 57.4% 26.2% 16.3% -
Mareigha 28.3% 46.7% 23.3% 1.7%
Deir Kahf 36.5% 37.6% 25.9% -
Burma 57.5% 16.3% 26.3% -
Deisi 60.0% 10.0% 30.0% -
Wadi Araba 20.0% 50.0% 30.0% -
Bseira 35.4% 32.9% 30.5% 1.2%
Arajan 55.0% 14.3% 30.7% -
Roweished 21.3% 42.6% 35.5% 0.7%
North Ghour 45.9% 12.2% 41.8% 0.1%
Kufranja 47.1% 6.7% 46.3% -
Queira 16.1% 31.4% 51.7% 0.8%
Ghour Mazraa 35.5% 11.8% 52.7% -
Balaama 34.8% 9.7% 55.5% -
Ghour Safi 27.2% 16.7% 56.1% -
North West Badia 12.9% 17.3% 69.8% -
Housha 20.0% 8.6% 71.4% -
Salihiya 14.8% 5.7% 73.0% 6.6%
Qatrana 21.4% 2.9% 75.7% -
Total average 37.2% 18.3% 44.0% 0.5%
The high percentage of cases reporting income increase is attributed mainly to the salary hikes formulas applied to government employees, and military/civil defense/public security servants, which was resembled by most of the private sector companies. Some 53% of the military/civil defense/public security servants reported income increase. The same pattern was clearly identified in Government employees and private sector workers at 51% and 43% respectively. Animal production, handicrafts, trade and family business were the most negatively affected sources of income as reported by the surveyed families.
16
37%
2%
13%4%
15%
5%
12%
12%
FoodHealthEnergyEducationTransportationResidenceClothingCeremonies
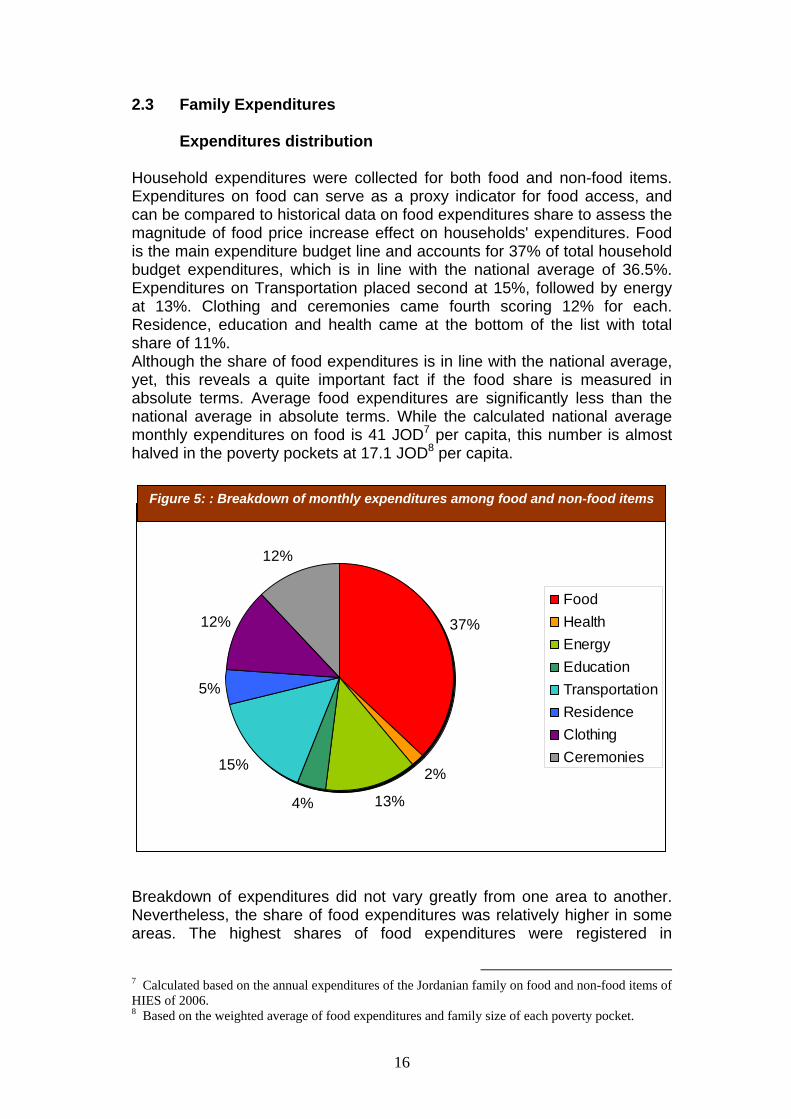
2.3 Family Expenditures Expenditures distribution Household expenditures were collected for both food and non-food items. Expenditures on food can serve as a proxy indicator for food access, and can be compared to historical data on food expenditures share to assess the magnitude of food price increase effect on households' expenditures. Food is the main expenditure budget line and accounts for 37% of total household budget expenditures, which is in line with the national average of 36.5%. Expenditures on Transportation placed second at 15%, followed by energy at 13%. Clothing and ceremonies came fourth scoring 12% for each. Residence, education and health came at the bottom of the list with total share of 11%. Although the share of food expenditures is in line with the national average, yet, this reveals a quite important fact if the food share is measured in absolute terms. Average food expenditures are significantly less than the national average in absolute terms. While the calculated national average monthly expenditures on food is 41 JOD7 per capita, this number is almost halved in the poverty pockets at 17.1 JOD8 per capita.
Breakdown of expenditures did not vary greatly from one area to another. Nevertheless, the share of food expenditures was relatively higher in some areas. The highest shares of food expenditures were registered in
7 Calculated based on the annual expenditures of the Jordanian family on food and non-food items of HIES of 2006. 8 Based on the weighted average of food expenditures and family size of each poverty pocket.
Figure 5: : Breakdown of monthly expenditures among food and non-food items
17
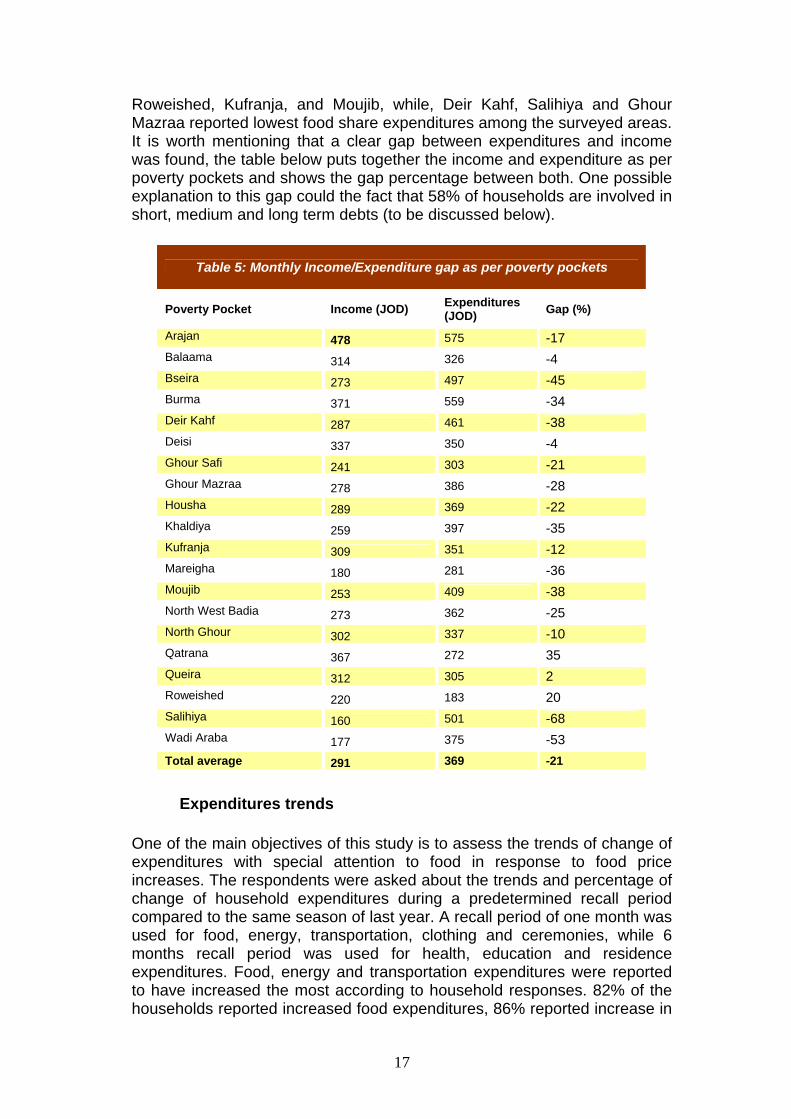
Roweished, Kufranja, and Moujib, while, Deir Kahf, Salihiya and Ghour Mazraa reported lowest food share expenditures among the surveyed areas. It is worth mentioning that a clear gap between expenditures and income was found, the table below puts together the income and expenditure as per poverty pockets and shows the gap percentage between both. One possible explanation to this gap could the fact that 58% of households are involved in short, medium and long term debts (to be discussed below).
Table 5: Monthly Income/Expenditure gap as per poverty pockets
Poverty Pocket Income (JOD) Expenditures (JOD) Gap (%)
Arajan 478 575 -17 Balaama 314 326 -4 Bseira 273 497 -45 Burma 371 559 -34 Deir Kahf 287 461 -38 Deisi 337 350 -4 Ghour Safi 241 303 -21 Ghour Mazraa 278 386 -28 Housha 289 369 -22 Khaldiya 259 397 -35 Kufranja 309 351 -12 Mareigha 180 281 -36 Moujib 253 409 -38 North West Badia 273 362 -25 North Ghour 302 337 -10 Qatrana 367 272 35 Queira 312 305 2 Roweished 220 183 20 Salihiya 160 501 -68 Wadi Araba 177 375 -53 Total average 291 369 -21
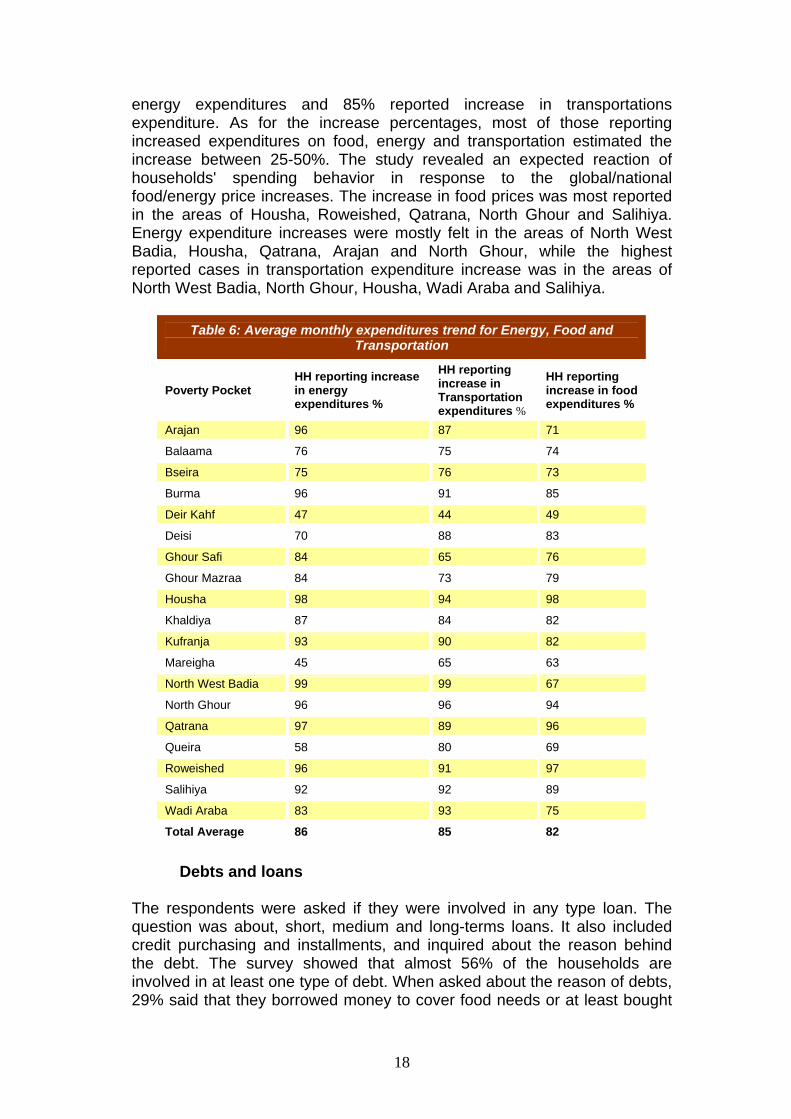
Expenditures trends One of the main objectives of this study is to assess the trends of change of expenditures with special attention to food in response to food price increases. The respondents were asked about the trends and percentage of change of household expenditures during a predetermined recall period compared to the same season of last year. A recall period of one month was used for food, energy, transportation, clothing and ceremonies, while 6 months recall period was used for health, education and residence expenditures. Food, energy and transportation expenditures were reported to have increased the most according to household responses. 82% of the households reported increased food expenditures, 86% reported increase in
18
energy expenditures and 85% reported increase in transportations expenditure. As for the increase percentages, most of those reporting increased expenditures on food, energy and transportation estimated the increase between 25-50%. The study revealed an expected reaction of households' spending behavior in response to the global/national food/energy price increases. The increase in food prices was most reported in the areas of Housha, Roweished, Qatrana, North Ghour and Salihiya. Energy expenditure increases were mostly felt in the areas of North West Badia, Housha, Qatrana, Arajan and North Ghour, while the highest reported cases in transportation expenditure increase was in the areas of North West Badia, North Ghour, Housha, Wadi Araba and Salihiya.
Table 6: Average monthly expenditures trend for Energy, Food and Transportation
Poverty Pocket HH reporting increase in energy expenditures %
HH reporting increase in Transportation expenditures %
HH reporting increase in food expenditures %
Arajan 96 87 71
Balaama 76 75 74
Bseira 75 76 73
Burma 96 91 85
Deir Kahf 47 44 49
Deisi 70 88 83
Ghour Safi 84 65 76
Ghour Mazraa 84 73 79
Housha 98 94 98
Khaldiya 87 84 82
Kufranja 93 90 82
Mareigha 45 65 63
North West Badia 99 99 67
North Ghour 96 96 94
Qatrana 97 89 96
Queira 58 80 69
Roweished 96 91 97
Salihiya 92 92 89
Wadi Araba 83 93 75
Total Average 86 85 82
Debts and loans The respondents were asked if they were involved in any type loan. The question was about, short, medium and long-terms loans. It also included credit purchasing and installments, and inquired about the reason behind the debt. The survey showed that almost 56% of the households are involved in at least one type of debt. When asked about the reason of debts, 29% said that they borrowed money to cover food needs or at least bought
19
28.9%
8.9%
4.7%
1.5%
1.0%
0.7%
21.5%
2.0%
4.6%
0.5%
25.6%
0.1%
Cover food needs Cover Education feesCover Health expenses Purchase Agricultural inputsPurchase of animal fodders or Veterinaries Purchase of animalsPurchase home appliances Rent payCeremonies ClothingBuilding of House or purchase of car Not specified
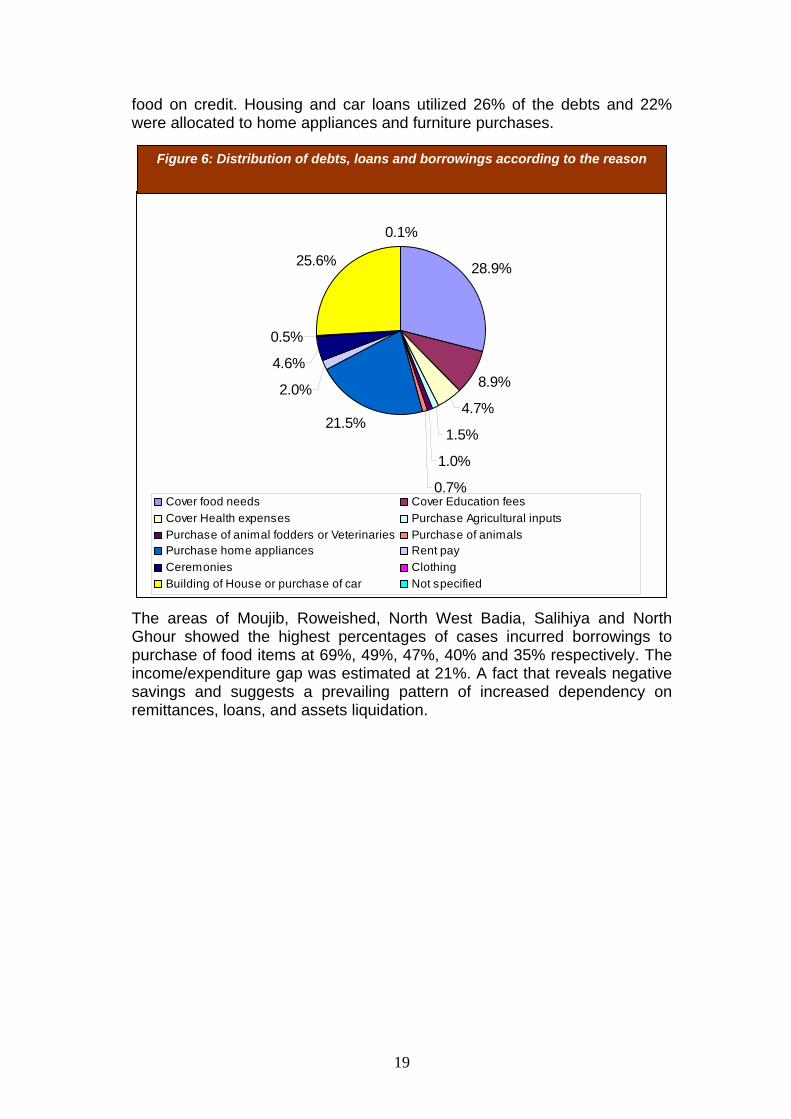
food on credit. Housing and car loans utilized 26% of the debts and 22% were allocated to home appliances and furniture purchases. The areas of Moujib, Roweished, North West Badia, Salihiya and North Ghour showed the highest percentages of cases incurred borrowings to purchase of food items at 69%, 49%, 47%, 40% and 35% respectively. The income/expenditure gap was estimated at 21%. A fact that reveals negative savings and suggests a prevailing pattern of increased dependency on remittances, loans, and assets liquidation.
Figure 6: Distribution of debts, loans and borrowings according to the reason
20
2
6
10
13
69
0 20 40 60 80 100
One routine
Two Routines
Three Routines
Four Routines
Five Routines
Part 3- Food security
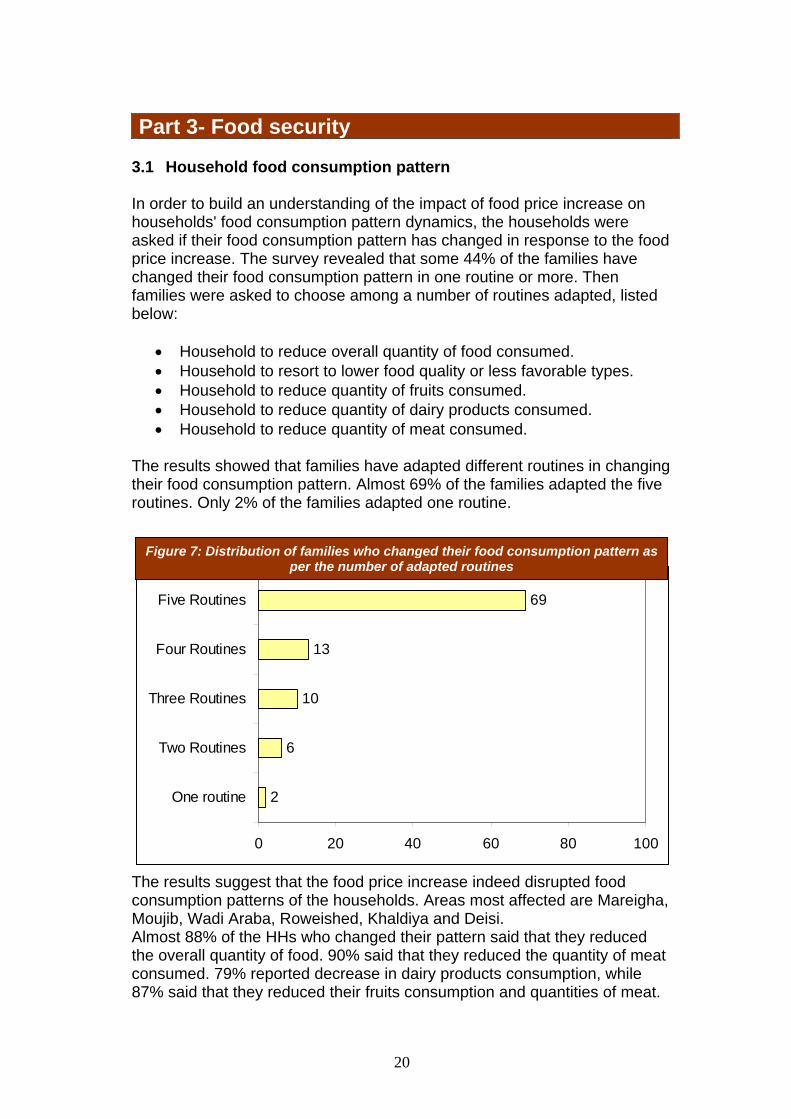
3.1 Household food consumption pattern In order to build an understanding of the impact of food price increase on households' food consumption pattern dynamics, the households were asked if their food consumption pattern has changed in response to the food price increase. The survey revealed that some 44% of the families have changed their food consumption pattern in one routine or more. Then families were asked to choose among a number of routines adapted, listed below:
• Household to reduce overall quantity of food consumed. • Household to resort to lower food quality or less favorable types. • Household to reduce quantity of fruits consumed. • Household to reduce quantity of dairy products consumed. • Household to reduce quantity of meat consumed.
The results showed that families have adapted different routines in changing their food consumption pattern. Almost 69% of the families adapted the five routines. Only 2% of the families adapted one routine. The results suggest that the food price increase indeed disrupted food consumption patterns of the households. Areas most affected are Mareigha, Moujib, Wadi Araba, Roweished, Khaldiya and Deisi. Almost 88% of the HHs who changed their pattern said that they reduced the overall quantity of food. 90% said that they reduced the quantity of meat consumed. 79% reported decrease in dairy products consumption, while 87% said that they reduced their fruits consumption and quantities of meat.
Figure 7: Distribution of families who changed their food consumption pattern as per the number of adapted routines
21
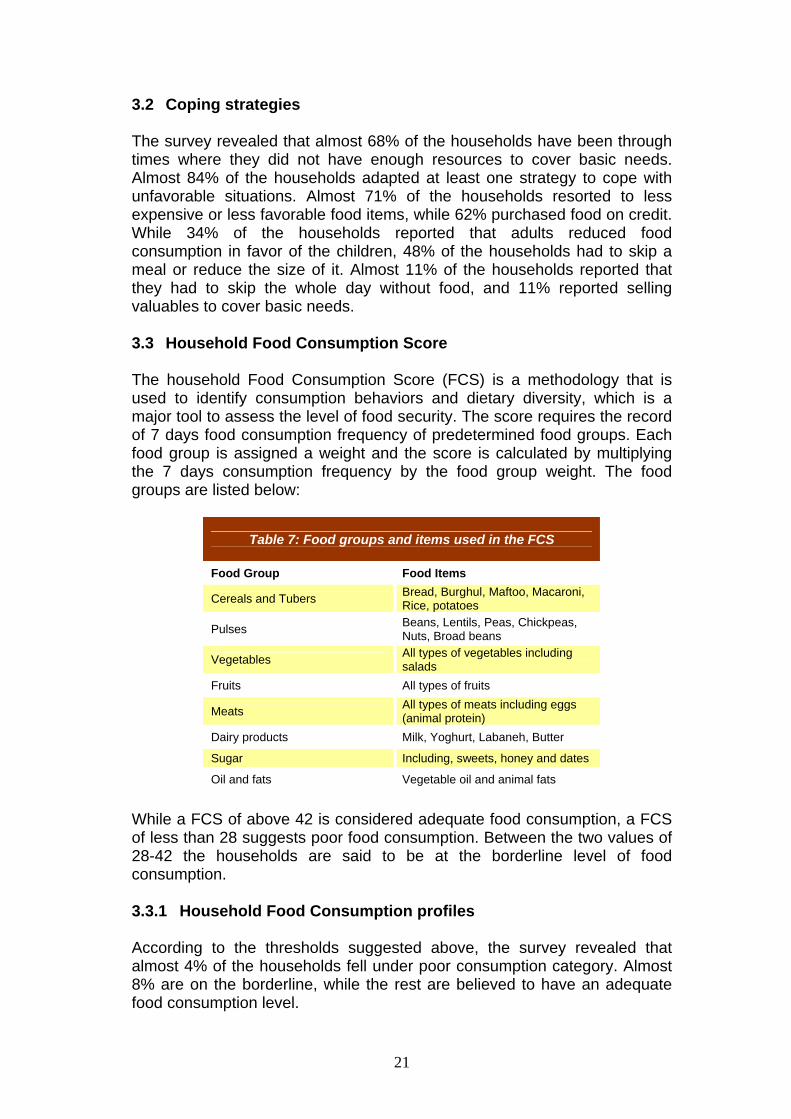
3.2 Coping strategies The survey revealed that almost 68% of the households have been through times where they did not have enough resources to cover basic needs. Almost 84% of the households adapted at least one strategy to cope with unfavorable situations. Almost 71% of the households resorted to less expensive or less favorable food items, while 62% purchased food on credit. While 34% of the households reported that adults reduced food consumption in favor of the children, 48% of the households had to skip a meal or reduce the size of it. Almost 11% of the households reported that they had to skip the whole day without food, and 11% reported selling valuables to cover basic needs. 3.3 Household Food Consumption Score The household Food Consumption Score (FCS) is a methodology that is used to identify consumption behaviors and dietary diversity, which is a major tool to assess the level of food security. The score requires the record of 7 days food consumption frequency of predetermined food groups. Each food group is assigned a weight and the score is calculated by multiplying the 7 days consumption frequency by the food group weight. The food groups are listed below:
Table 7: Food groups and items used in the FCS
Food Group Food Items
Cereals and Tubers Bread, Burghul, Maftoo, Macaroni, Rice, potatoes
Pulses Beans, Lentils, Peas, Chickpeas, Nuts, Broad beans
Vegetables All types of vegetables including salads
Fruits All types of fruits
Meats All types of meats including eggs (animal protein)
Dairy products Milk, Yoghurt, Labaneh, Butter
Sugar Including, sweets, honey and dates
Oil and fats Vegetable oil and animal fats
While a FCS of above 42 is considered adequate food consumption, a FCS of less than 28 suggests poor food consumption. Between the two values of 28-42 the households are said to be at the borderline level of food consumption. 3.3.1 Household Food Consumption profiles According to the thresholds suggested above, the survey revealed that almost 4% of the households fell under poor consumption category. Almost 8% are on the borderline, while the rest are believed to have an adequate food consumption level.
22
Table 8: Household food consumption profiles
Household Food Consumption Group % of HH
1. Poor food consumption group Household diet is mainly based on cereals (bread mostly). Limited consumption of pulses, vegetables, dairy products, meat, oils and sugars (mostly 0-1 days per week). Consumption of fruits is very limited (0 days per week in most of the cases).
3.7
2. Borderline food consumption group Almost regular (daily) consumption of cereals (bread mostly). Consumption of vegetables varies between 1 to 3 times per week. Fruits are seldom consumed (once a week). Meats and dairies are consumed mostly once or twice a week. Oils and sugars are seen in most of the days.
8.4
3. Adequate food consumption group Daily consumption of cereals. Frequent consumption of pulses (1-3). Consumption of vegetables is 3-7 days per week and in most of the cases 7 days. Fruits consumption is sporadic (0-3 days per week). Meat and dairies are consumed in most of the cases between 3 and 7 days per week. Oils and sugars are consumed almost on daily basis.
87.9
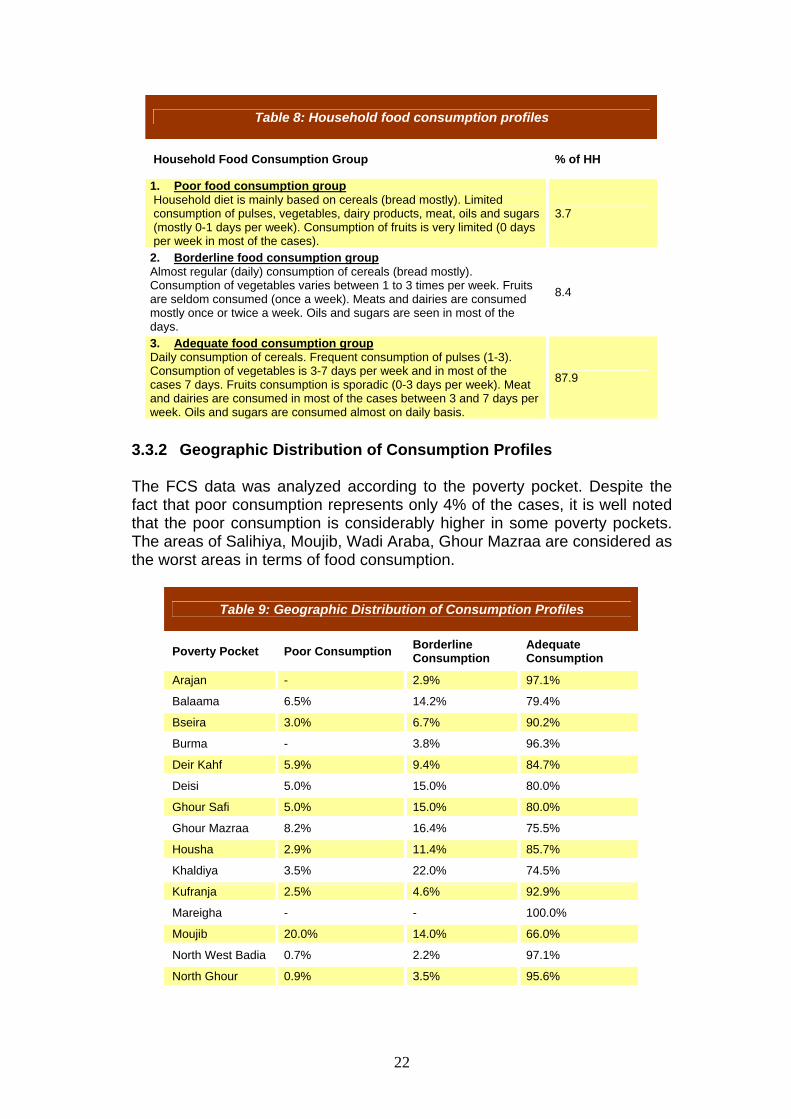
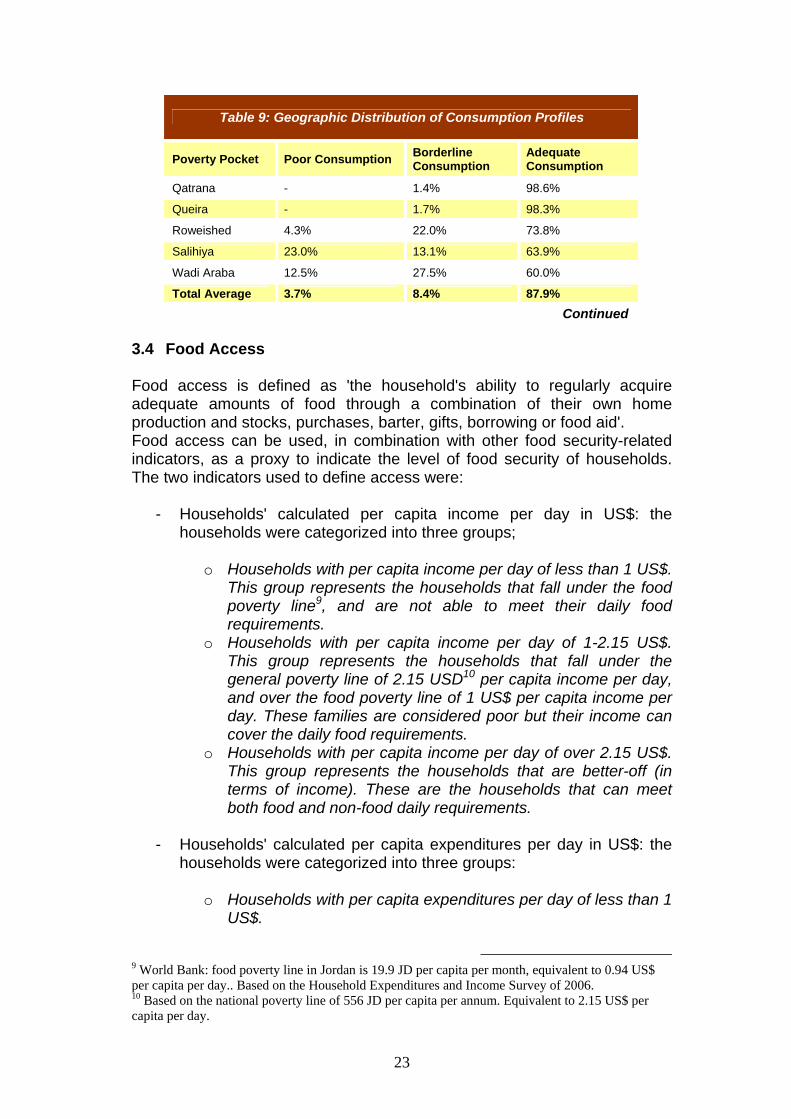
3.3.2 Geographic Distribution of Consumption Profiles The FCS data was analyzed according to the poverty pocket. Despite the fact that poor consumption represents only 4% of the cases, it is well noted that the poor consumption is considerably higher in some poverty pockets. The areas of Salihiya, Moujib, Wadi Araba, Ghour Mazraa are considered as the worst areas in terms of food consumption.
Table 9: Geographic Distribution of Consumption Profiles
Poverty Pocket Poor Consumption Borderline Consumption
Adequate Consumption
Arajan - 2.9% 97.1%
Balaama 6.5% 14.2% 79.4%
Bseira 3.0% 6.7% 90.2%
Burma - 3.8% 96.3%
Deir Kahf 5.9% 9.4% 84.7%
Deisi 5.0% 15.0% 80.0%
Ghour Safi 5.0% 15.0% 80.0%
Ghour Mazraa 8.2% 16.4% 75.5%
Housha 2.9% 11.4% 85.7%
Khaldiya 3.5% 22.0% 74.5%
Kufranja 2.5% 4.6% 92.9%
Mareigha - - 100.0%
Moujib 20.0% 14.0% 66.0%
North West Badia 0.7% 2.2% 97.1%
North Ghour 0.9% 3.5% 95.6%
23
Table 9: Geographic Distribution of Consumption Profiles
Poverty Pocket Poor Consumption Borderline Consumption
Adequate Consumption
Qatrana - 1.4% 98.6%
Queira - 1.7% 98.3%
Roweished 4.3% 22.0% 73.8%
Salihiya 23.0% 13.1% 63.9%
Wadi Araba 12.5% 27.5% 60.0%
Total Average 3.7% 8.4% 87.9% Continued 3.4 Food Access Food access is defined as 'the household's ability to regularly acquire adequate amounts of food through a combination of their own home production and stocks, purchases, barter, gifts, borrowing or food aid'. Food access can be used, in combination with other food security-related indicators, as a proxy to indicate the level of food security of households. The two indicators used to define access were:
- Households' calculated per capita income per day in US$: the
households were categorized into three groups; o Households with per capita income per day of less than 1 US$.
This group represents the households that fall under the food poverty line9, and are not able to meet their daily food requirements.
o Households with per capita income per day of 1-2.15 US$. This group represents the households that fall under the general poverty line of 2.15 USD10 per capita income per day, and over the food poverty line of 1 US$ per capita income per day. These families are considered poor but their income can cover the daily food requirements.
o Households with per capita income per day of over 2.15 US$. This group represents the households that are better-off (in terms of income). These are the households that can meet both food and non-food daily requirements.
- Households' calculated per capita expenditures per day in US$: the
households were categorized into three groups: o Households with per capita expenditures per day of less than 1
US$.
9 World Bank: food poverty line in Jordan is 19.9 JD per capita per month, equivalent to 0.94 US$ per capita per day.. Based on the Household Expenditures and Income Survey of 2006. 10 Based on the national poverty line of 556 JD per capita per annum. Equivalent to 2.15 US$ per capita per day.
24
o Households with per capita expenditure per day of 1-2.15 US$. o Households with per capita expenditures per day of over 2.15
US$. In order to classify the families as per access profiling, income and expenditure groups were cross tabulated and the following access patterns were identified:
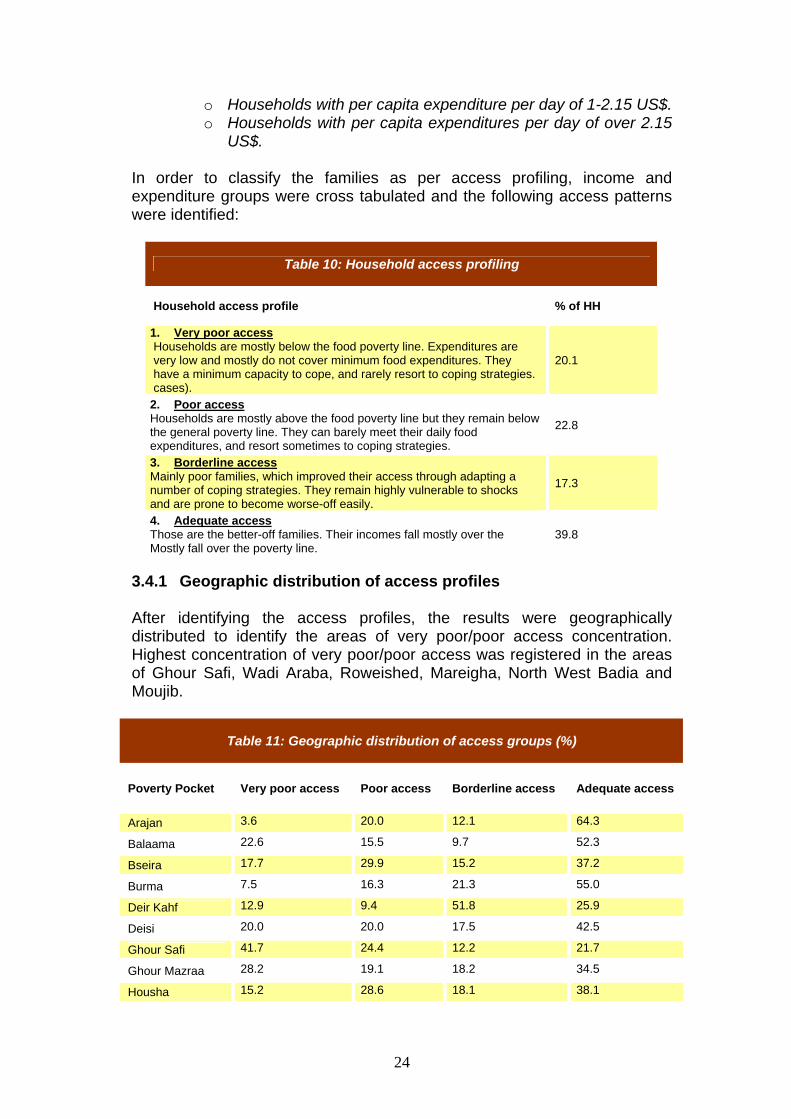
Table 10: Household access profiling
Household access profile % of HH
1. Very poor access Households are mostly below the food poverty line. Expenditures are very low and mostly do not cover minimum food expenditures. They have a minimum capacity to cope, and rarely resort to coping strategies. cases).
20.1
2. Poor access Households are mostly above the food poverty line but they remain below the general poverty line. They can barely meet their daily food expenditures, and resort sometimes to coping strategies.
22.8
3. Borderline access Mainly poor families, which improved their access through adapting a number of coping strategies. They remain highly vulnerable to shocks and are prone to become worse-off easily.
17.3
4. Adequate access Those are the better-off families. Their incomes fall mostly over the Mostly fall over the poverty line.
39.8
3.4.1 Geographic distribution of access profiles After identifying the access profiles, the results were geographically distributed to identify the areas of very poor/poor access concentration. Highest concentration of very poor/poor access was registered in the areas of Ghour Safi, Wadi Araba, Roweished, Mareigha, North West Badia and Moujib.
Table 11: Geographic distribution of access groups (%)
Poverty Pocket Very poor access Poor access Borderline access Adequate access
Arajan 3.6 20.0 12.1 64.3
Balaama 22.6 15.5 9.7 52.3
Bseira 17.7 29.9 15.2 37.2
Burma 7.5 16.3 21.3 55.0
Deir Kahf 12.9 9.4 51.8 25.9
Deisi 20.0 20.0 17.5 42.5
Ghour Safi 41.7 24.4 12.2 21.7
Ghour Mazraa 28.2 19.1 18.2 34.5
Housha 15.2 28.6 18.1 38.1
25
Table 11: Geographic distribution of access groups (%)
Poverty Pocket Very poor access Poor access Borderline access Adequate access
Khaldiya 19.1 23.4 30.5 27.0
Kufranja 19.2 23.3 14.6 42.9
Mareigha 35.0 36.7 11.7 16.7
Moujib 28.0 30.0 16.0 26.0
North West Badia 30.9 17.3 21.6 30.2
North Ghour 13.7 21.6 17.6 47.1
Qatrana 10.0 15.7 4.3 70.0
Queira 13.6 30.5 12.7 43.2
Roweished 39.7 27.0 5.7 27.7
Salihiya 23.8 20.0 26.2 21.3
Wadi Araba 40.0 15.5 20.0 12.5
Total average 20.1 29.9 17.3 39.8
Continued
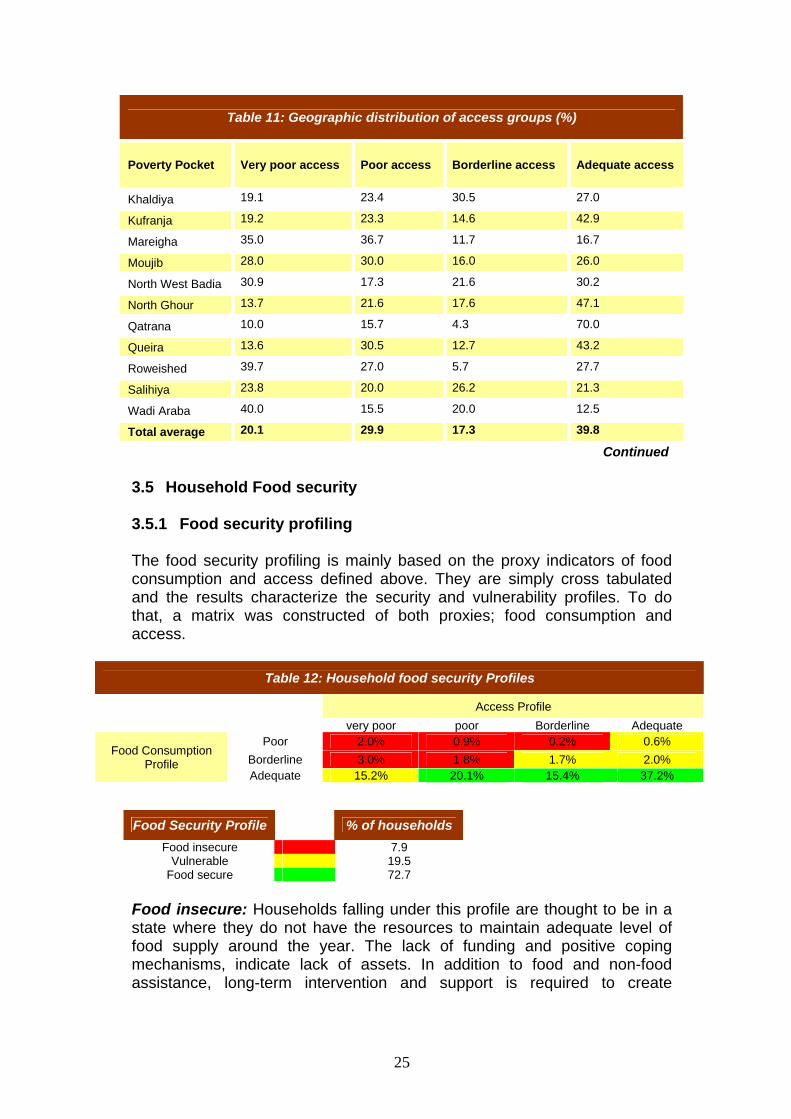
3.5 Household Food security 3.5.1 Food security profiling The food security profiling is mainly based on the proxy indicators of food consumption and access defined above. They are simply cross tabulated and the results characterize the security and vulnerability profiles. To do that, a matrix was constructed of both proxies; food consumption and access.
Table 12: Household food security Profiles
Access Profile very poor poor Borderline Adequate
Poor 2.0% 0.9% 0.2% 0.6% Borderline 3.0% 1.8% 1.7% 2.0%
Food Consumption Profile
Adequate 15.2% 20.1% 15.4% 37.2%
Food Security Profile % of households Food insecure 7.9
Vulnerable 19.5 Food secure 72.7
Food insecure: Households falling under this profile are thought to be in a state where they do not have the resources to maintain adequate level of food supply around the year. The lack of funding and positive coping mechanisms, indicate lack of assets. In addition to food and non-food assistance, long-term intervention and support is required to create
26
11 12 13 14 16 17 17
26 28
3535
5
18 1821
40
32
18 18
28
55
84
70 6863
43
5156 54
38
0
10
20
30
40
50
60
70
80
90
100
GhourMazraa
Deir Kahf Deisi Balaama Khaldiya Roweished Ghour Safi Salihiya Moujib WadiAraba
Food Insecure Vulnerable Food Secure
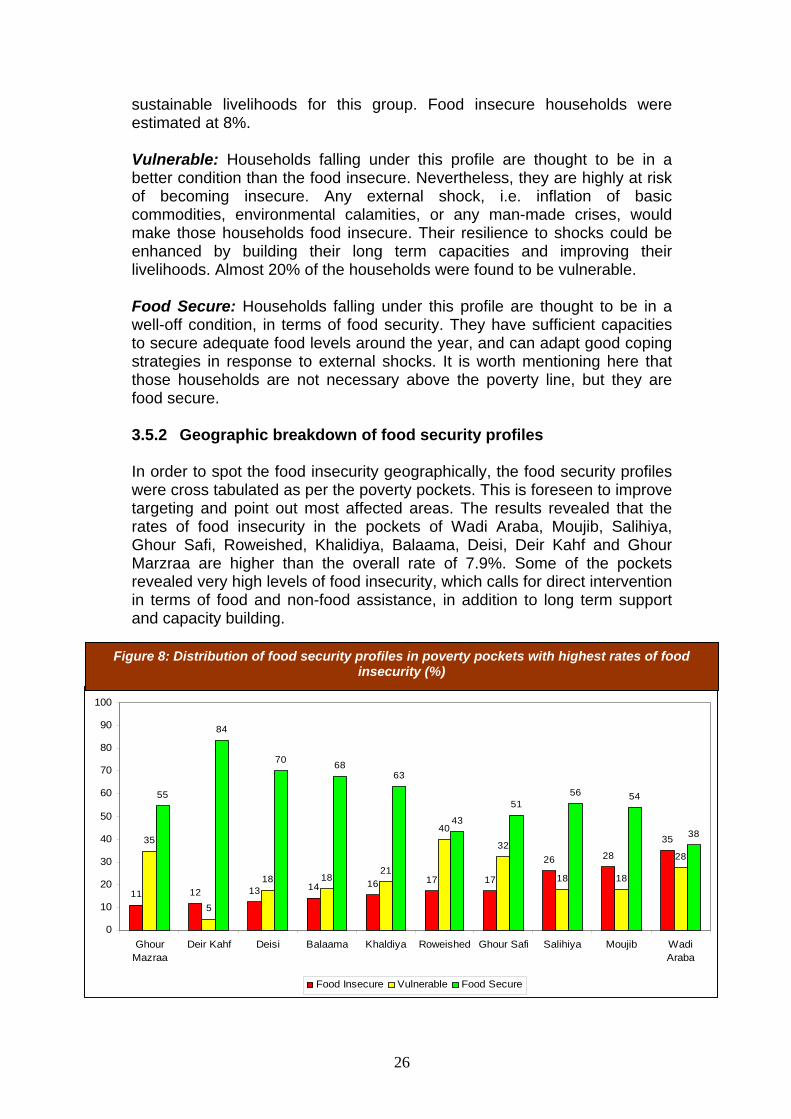
sustainable livelihoods for this group. Food insecure households were estimated at 8%. Vulnerable: Households falling under this profile are thought to be in a better condition than the food insecure. Nevertheless, they are highly at risk of becoming insecure. Any external shock, i.e. inflation of basic commodities, environmental calamities, or any man-made crises, would make those households food insecure. Their resilience to shocks could be enhanced by building their long term capacities and improving their livelihoods. Almost 20% of the households were found to be vulnerable. Food Secure: Households falling under this profile are thought to be in a well-off condition, in terms of food security. They have sufficient capacities to secure adequate food levels around the year, and can adapt good coping strategies in response to external shocks. It is worth mentioning here that those households are not necessary above the poverty line, but they are food secure. 3.5.2 Geographic breakdown of food security profiles In order to spot the food insecurity geographically, the food security profiles were cross tabulated as per the poverty pockets. This is foreseen to improve targeting and point out most affected areas. The results revealed that the rates of food insecurity in the pockets of Wadi Araba, Moujib, Salihiya, Ghour Safi, Roweished, Khalidiya, Balaama, Deisi, Deir Kahf and Ghour Marzraa are higher than the overall rate of 7.9%. Some of the pockets revealed very high levels of food insecurity, which calls for direct intervention in terms of food and non-food assistance, in addition to long term support and capacity building.
Figure 8: Distribution of food security profiles in poverty pockets with highest rates of food insecurity (%)
27
Rate of food insecurity
15.4
1.51.63.6
6.09.0
0.0
5.0
10.0
15.0
20.0
Illiterate Can readand write
Under highschool
Highschool
Diploma Universitydegree
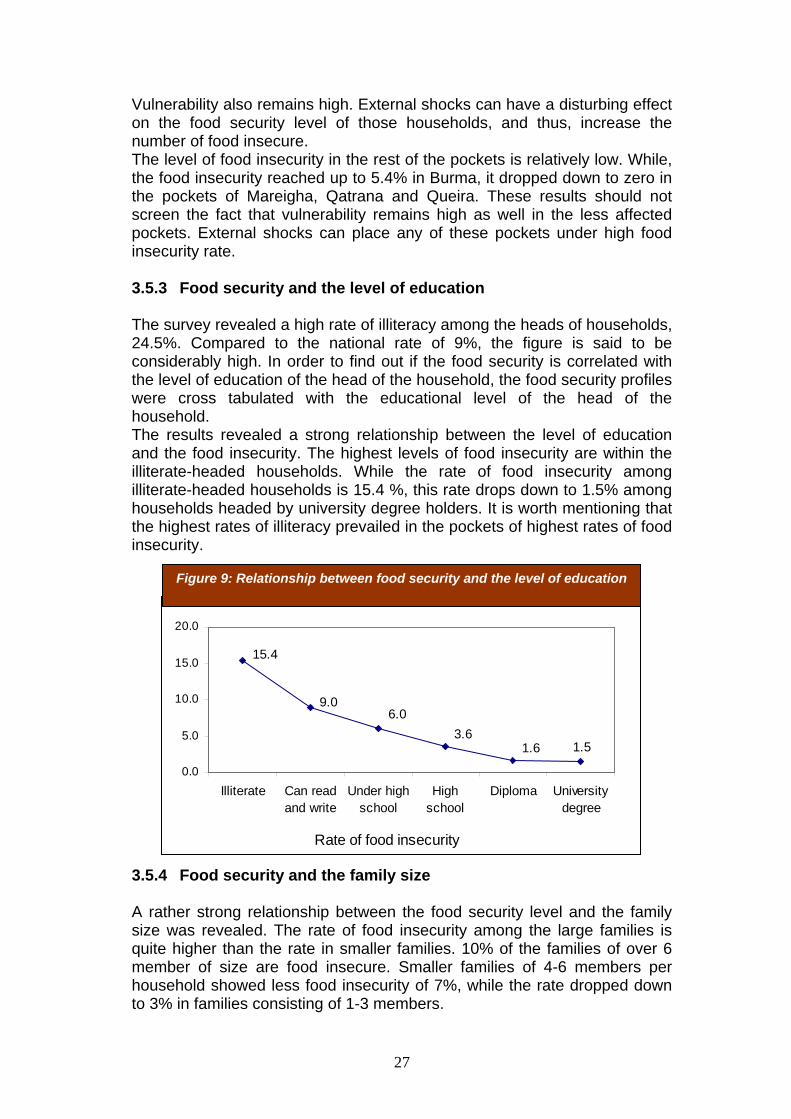
Vulnerability also remains high. External shocks can have a disturbing effect on the food security level of those households, and thus, increase the number of food insecure. The level of food insecurity in the rest of the pockets is relatively low. While, the food insecurity reached up to 5.4% in Burma, it dropped down to zero in the pockets of Mareigha, Qatrana and Queira. These results should not screen the fact that vulnerability remains high as well in the less affected pockets. External shocks can place any of these pockets under high food insecurity rate. 3.5.3 Food security and the level of education The survey revealed a high rate of illiteracy among the heads of households, 24.5%. Compared to the national rate of 9%, the figure is said to be considerably high. In order to find out if the food security is correlated with the level of education of the head of the household, the food security profiles were cross tabulated with the educational level of the head of the household. The results revealed a strong relationship between the level of education and the food insecurity. The highest levels of food insecurity are within the illiterate-headed households. While the rate of food insecurity among illiterate-headed households is 15.4 %, this rate drops down to 1.5% among households headed by university degree holders. It is worth mentioning that the highest rates of illiteracy prevailed in the pockets of highest rates of food insecurity. 3.5.4 Food security and the family size A rather strong relationship between the food security level and the family size was revealed. The rate of food insecurity among the large families is quite higher than the rate in smaller families. 10% of the families of over 6 member of size are food insecure. Smaller families of 4-6 members per household showed less food insecurity of 7%, while the rate dropped down to 3% in families consisting of 1-3 members.
Figure 9: Relationship between food security and the level of education

28
3
13
84
711
82
10
28
62
0
15
30
45
60
75
90
Food insecure Vulnerable Food Secure
Small Family Average Family Large Family
3.5.5 Food security in urban and rural setups The rate of food insecurity in the rural setup is more than double the rate in the urban setup. Almost 70% of the food insecure is living in rural setups. The rate of food insecurity in the urban areas is 4.5%, while it reaches up to 11.3% in the rural areas. 3.6 Food security and the agricultural potentials Maximizing utilization of resources and identifying potential developments in the agricultural sector is of utmost importance in augmenting food production and improving the level of food security. In order to assess the current level of agricultural activities in the poverty pockets, and to identify the problems most faced by the farmers, households were asked if they were involved in agricultural activities at the plant/animal production levels. They were also asked about the problems they considered as hindering factors. In addition to the food security breakdown, the data on agricultural activities was then analyzed at the level of eco-zones.
Figure 10: Relationship between food security and the family size

29
3.6.1 Agricultural eco-zones Jordan is classified into three ecological zones according to the average annual rainfall: Zone 1: Below 100 mm annual rainfall Zone 2: 100-200 mm annual rainfall Zone 3: Over 200 mm annual rainfall All areas were then broken down as per agricultural eco-zones, and the food security data was analyzed in light of the current level of agricultural activities and related information surveyed. Eco-zone 1 The average annual rainfall in this zone is less than 100mm and includes the following pockets:
Table 13: Poverty pockets under eco-zone 1
Poverty Pocket Average annual rainfall (mm)
Deisi 30
Ghour Safi 80
Ghour Mazraa 80
Mareigha 40
Moujib 30
Queira 30
Roweished 70
Wadi Araba 75
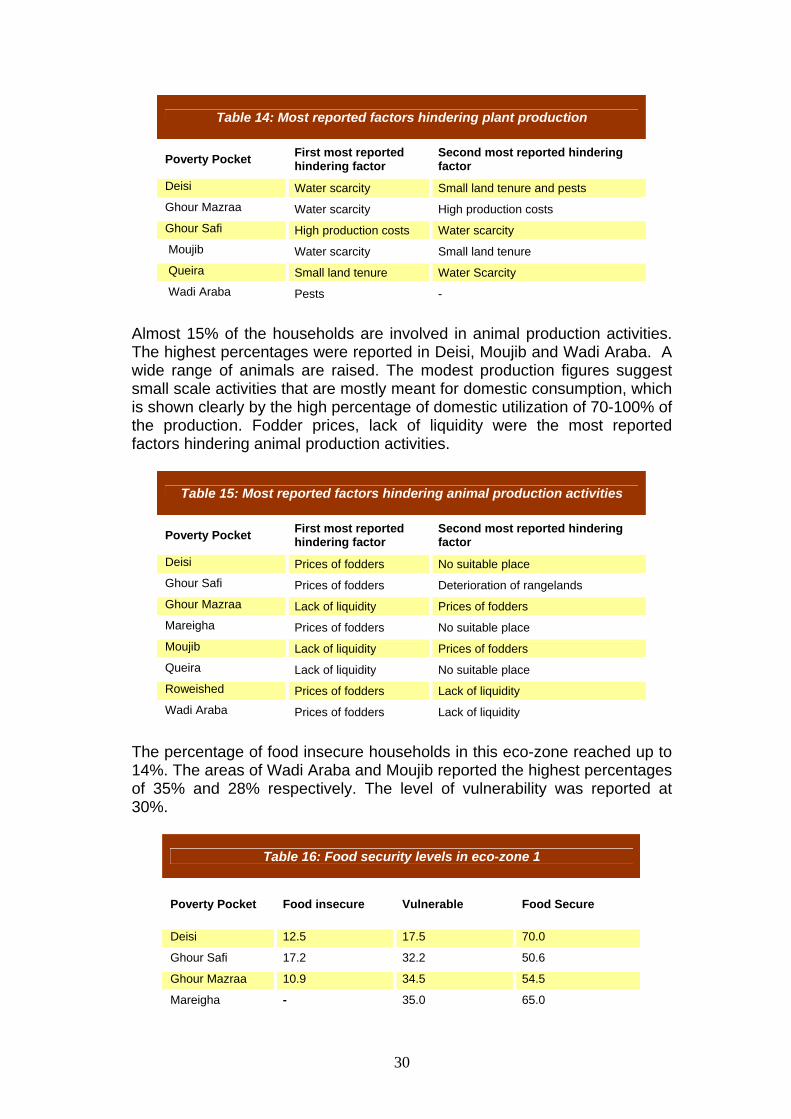
Agricultural activities: Almost 12% of the households are involved in plant production activities. The highest percentages were reported in Moujib, and Deisi, while zero percent was reported in each of Mareigha and Roweished. Vegetables, olives and wheat are the dominant crops in the area. With the average annual rainfall, it is expected that most of the crops are irrigated. The households were asked about the allocation of the agricultural products. A domestic consumption of 41-42% against 58-59% sales suggests a semi-subsistence farming pattern. Most reported problems that hider plant production activities were water scarcity, high production costs and small land tenures.
30
Table 14: Most reported factors hindering plant production
Poverty Pocket First most reported hindering factor
Second most reported hindering factor
Deisi Water scarcity Small land tenure and pests Ghour Mazraa Water scarcity High production costs Ghour Safi High production costs Water scarcity Moujib Water scarcity Small land tenure Queira Small land tenure Water Scarcity Wadi Araba Pests -
Almost 15% of the households are involved in animal production activities. The highest percentages were reported in Deisi, Moujib and Wadi Araba. A wide range of animals are raised. The modest production figures suggest small scale activities that are mostly meant for domestic consumption, which is shown clearly by the high percentage of domestic utilization of 70-100% of the production. Fodder prices, lack of liquidity were the most reported factors hindering animal production activities.
Table 15: Most reported factors hindering animal production activities
Poverty Pocket First most reported hindering factor
Second most reported hindering factor
Deisi Prices of fodders No suitable place Ghour Safi Prices of fodders Deterioration of rangelands Ghour Mazraa Lack of liquidity Prices of fodders Mareigha Prices of fodders No suitable place Moujib Lack of liquidity Prices of fodders Queira Lack of liquidity No suitable place Roweished Prices of fodders Lack of liquidity Wadi Araba Prices of fodders Lack of liquidity
The percentage of food insecure households in this eco-zone reached up to 14%. The areas of Wadi Araba and Moujib reported the highest percentages of 35% and 28% respectively. The level of vulnerability was reported at 30%.
Table 16: Food security levels in eco-zone 1
Poverty Pocket Food insecure Vulnerable Food Secure
Deisi 12.5 17.5 70.0
Ghour Safi 17.2 32.2 50.6
Ghour Mazraa 10.9 34.5 54.5
Mareigha - 35.0 65.0
31
Table 16: Food security levels in eco-zone 1
Poverty Pocket Food insecure Vulnerable Food Secure
Moujib 28.0 18.0 54.0
Queira - 15.3 84.7
Roweished 17.0 39.7 43.3
Wadi Araba 35.0 27.5 37.5
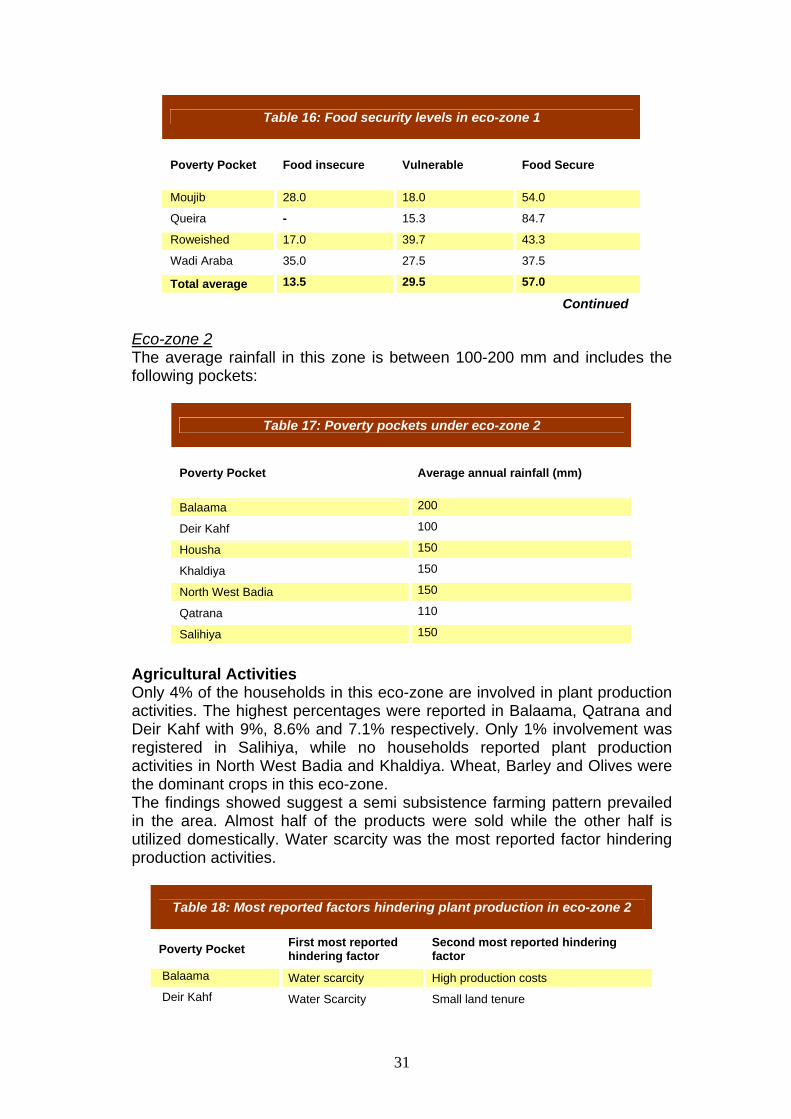
Total average 13.5 29.5 57.0
Continued Eco-zone 2 The average rainfall in this zone is between 100-200 mm and includes the following pockets:
Table 17: Poverty pockets under eco-zone 2
Poverty Pocket Average annual rainfall (mm)
Balaama 200
Deir Kahf 100
Housha 150
Khaldiya 150
North West Badia 150
Qatrana 110
Salihiya 150
Agricultural Activities Only 4% of the households in this eco-zone are involved in plant production activities. The highest percentages were reported in Balaama, Qatrana and Deir Kahf with 9%, 8.6% and 7.1% respectively. Only 1% involvement was registered in Salihiya, while no households reported plant production activities in North West Badia and Khaldiya. Wheat, Barley and Olives were the dominant crops in this eco-zone. The findings showed suggest a semi subsistence farming pattern prevailed in the area. Almost half of the products were sold while the other half is utilized domestically. Water scarcity was the most reported factor hindering production activities.
Table 18: Most reported factors hindering plant production in eco-zone 2
Poverty Pocket First most reported hindering factor
Second most reported hindering factor
Balaama Water scarcity High production costs Deir Kahf Water Scarcity Small land tenure

32
Table 18: Most reported factors hindering plant production in eco-zone 2
Housha Water scarcity - Qatrana Marketing Water scarcity Salihiya Water scarcity -
Continued Almost 8% of the households are involved in animal production activities. Deir Kahf and Qatrana reported the highest percentages of 26% and 24% respectively. Goats and poultry are the main types of animals reared. The level of domestic utilization suggests a subsistence pattern of animal production activities. Most reported problems were fodder prices, lack of liquidity11 and deterioration of rangelands.
Table 19: Most reported factors hindering animal production activities in eco-zone 2
Poverty Pocket First most reported hindering factor
Second most reported hindering factor
Balaama Prices of Fodders Deterioration of rangelands Deir Kahf No suitable place Lack of liquidity Housha Prices of fodders Deterioration of rangelands Khaldiya Lack of liquidity - North West Badia Prices of fodders No suitable place Qatrana Prices of fodders Lack of liquidity Salihiya Lack of liquidity No suitable place
The percentage of food insecure households in this eco-zone is almost 12%. The areas of Salihiya, Khaldiya and Balaama reported the highest levels. Vulnerability was found at 19%.
Table 20: Food security levels in eco-zone 2
Poverty Pocket Food insecure Vulnerable Food Secure
Balaama 14.3 17.5 68.2
Deir Kahf 11.8 4.7 83.5
Housha 4.8 21.9 73.3
Khaldiya 15.6 21.3 63.1
North West Badia 2.9 29.5 67.6
Qatrana 11.4 88.6
Salihiya 26.2 18.0 55.7
Total 11.6 19.0 69.4
11 Lack of liquidity refers to insufficient working capital needed to cover production costs.

33
Eco-zone 3 The average annual rainfall in this zone is over 200 mm and includes the following pockets:
Table 21: Poverty pockets under eco-zone 3
Poverty Pocket Average annual rainfall (mm)
Arajan 550
Bseira 280
Burma 500
Kufranja 550
North Ghour 400
Agricultural activities: Almost 9% of the households are involved in plant production activities. The highest percentages were reported in Arajan and Burma. Olives, vegetables and wheat are the dominant crops in the area. The households were asked about the allocation of the agricultural products. A domestic consumption of 50-60% against 40-50% sales suggests a semi-subsistence farming pattern. Most reported problems which hindered plant production activities were water scarcity and small land tenures.
Table 22: Most reported factors hindering plant production
Poverty Pocket First most reported hindering factor
Second most reported hindering factor
Arajan Water scarcity Small land tenure
Bseira Water scarcity Small land tenure
Burma Water scarcity Small land tenure
North Ghour Water scarcity Small land tenure
Kufranja Water Scarcity Small land tenure
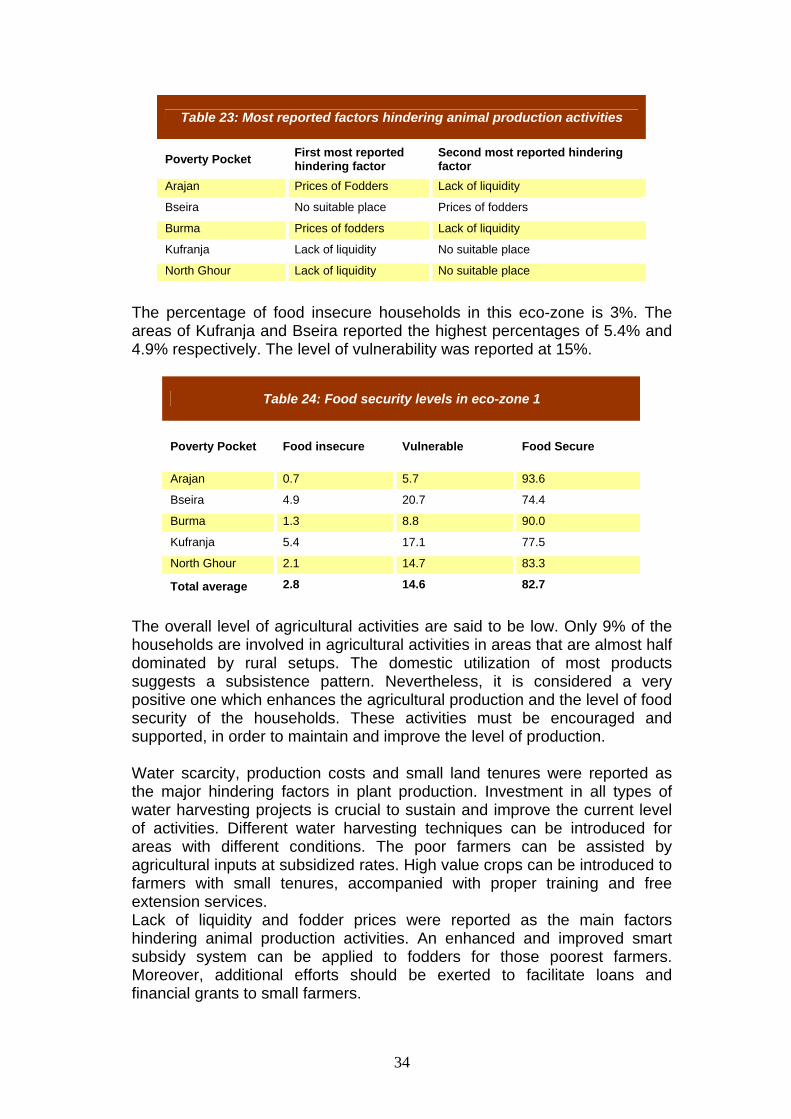
Almost 6% of the households are involved in animal production activities. The highest percentages were reported in Burma and Bseira. Poultry and goats were the dominant type of animals reared. The modest production figures suggest small scale activities that are mostly meant for domestic consumption. Fodder prices, lack of liquidity were the most reported factors hindering animal production activities.
34
Table 23: Most reported factors hindering animal production activities
Poverty Pocket First most reported hindering factor
Second most reported hindering factor
Arajan Prices of Fodders Lack of liquidity
Bseira No suitable place Prices of fodders
Burma Prices of fodders Lack of liquidity
Kufranja Lack of liquidity No suitable place
North Ghour Lack of liquidity No suitable place
The percentage of food insecure households in this eco-zone is 3%. The areas of Kufranja and Bseira reported the highest percentages of 5.4% and 4.9% respectively. The level of vulnerability was reported at 15%.
Table 24: Food security levels in eco-zone 1
Poverty Pocket Food insecure Vulnerable Food Secure
Arajan 0.7 5.7 93.6
Bseira 4.9 20.7 74.4
Burma 1.3 8.8 90.0
Kufranja 5.4 17.1 77.5
North Ghour 2.1 14.7 83.3
Total average 2.8 14.6 82.7
The overall level of agricultural activities are said to be low. Only 9% of the households are involved in agricultural activities in areas that are almost half dominated by rural setups. The domestic utilization of most products suggests a subsistence pattern. Nevertheless, it is considered a very positive one which enhances the agricultural production and the level of food security of the households. These activities must be encouraged and supported, in order to maintain and improve the level of production. Water scarcity, production costs and small land tenures were reported as the major hindering factors in plant production. Investment in all types of water harvesting projects is crucial to sustain and improve the current level of activities. Different water harvesting techniques can be introduced for areas with different conditions. The poor farmers can be assisted by agricultural inputs at subsidized rates. High value crops can be introduced to farmers with small tenures, accompanied with proper training and free extension services. Lack of liquidity and fodder prices were reported as the main factors hindering animal production activities. An enhanced and improved smart subsidy system can be applied to fodders for those poorest farmers. Moreover, additional efforts should be exerted to facilitate loans and financial grants to small farmers.

35
Part 4 - Assistance available 4.1 Overall level of assistance In order to have an idea about the level of assistance available in the poverty pockets, the households were asked if they received any type of assistance during a recall period of six months. Almost 32% of the households reported that they benefited from at least one type of free assistance during the last six months. 4.2 Prevailing types of assistance Below is a summary of most prevailing types of assistance as reported by the households. School feeding rations: school feeding programme is the most prevailing type of assistance. The national programme aims at distribution food rations universally in all schools around the country. 60% of the households who received assistance said that their children received rations through the national school feeding programme. This figure represents 30% of the total households in the surveyed area with children at schooling age. Free food rations: free food is distributed to the neediest families in Jordan through a number of local NGOs and charities. Almost 8% of the households said that they benefited from free food distribution. Financial Support: almost 6% of the households said that they received financial support from social bodies. It is most likely that support comes through the National Aids Fund (NAF). Free Health Care: 5% of the households reported receiving free health care. Only 1% of the households said that they benefited from financial support to small projects. Agriculture assistance is also marginal. In total, the percentage of households reported receiving assistance in funding agricultural tools and inputs, free fodders, veterinary services was only 2.4%.
36
Recommendations
Fields of assistance
Direct food and non-food assistance to the food insecure
It is important to streamline food and non-food assistance for the food insecure. Those are thought to be in drastic conditions and are believed to be in dire need for all types of direct assistance. Targeting is very crucial at this point and direct assistance shall be prioritized according to the concentration areas.
Assets creation and livelihood support
It is of utmost importance that direct food and non-food aids are complimented in parallel with livelihood support and asset creation projects. Assets' creation should be based on market's needs, available resources, logistical conditions and sustainability. Beneficiaries should be offered a number of activities that are tailored to the needs of the locale. For example, plant production-based projects are to be presented in areas with adequate water resources and suitable climate, and so on. Creating sustainable resources for those food insecure would pull them out from the hunger pool into a self-reliant state. This has also to be augmented with capacity building, and skills improvement, especially with the high prevalence of illiteracy rate among the food insecure. The survey revealed a direct relationship between the level of education and food security. Enhancement of educational facilities and support to the school feeding program are necessary to maintain high rates of enrollment.
Optimized current aids and ongoing efforts Current food and non-food aids should be optimized and better allocated. Social safety nets, school feeding programme, National Aids Fund, free health care can all be augmented in the most affected areas. More funding should be streamlined to support small projects. Families should receive proper assistance to help them in choosing the most profitable projects to improve their opportunities in securing funds. They must also be made aware of their potential resources and receive proper vocational training.
Protection of agriculture
Support agricultural-based activities can enhance food production in one hand and improve the livelihoods of farmers in the other. The survey revealed that the level of support to agriculture-based livelihoods is quite modest, while it is expected to be more focused and enhanced, especially in the poverty pockets. Water scarcity was reported as the major hindering factor in plant production activities. Thus, investment in all types of water harvesting projects becomes
37
an imminent prerequisite to sustain agricultural activities and maximize the level of utilization of the diminishing water resources. Introducing drought-resistant crops would also mitigate the water scarcity problem, especially in arid zones. The problem of small land tenures was reported by farmers as well. Introducing high value crops, aligned with proper training would maximize returns in the small tenures. Price of fodders was reported as a hindering factor by most of the animal breeders. A smart fodder-subsidy system (which includes a number of fodders in addition to barely) could be adopted, focusing on the marginalized farmers in the poverty pockets. Rehabilitation of rangelands could serve a big section of animal breeders in the poverty pockets, which could be achieved only by parallel establishment/enhancement of adjacent water harvesting structures.
38
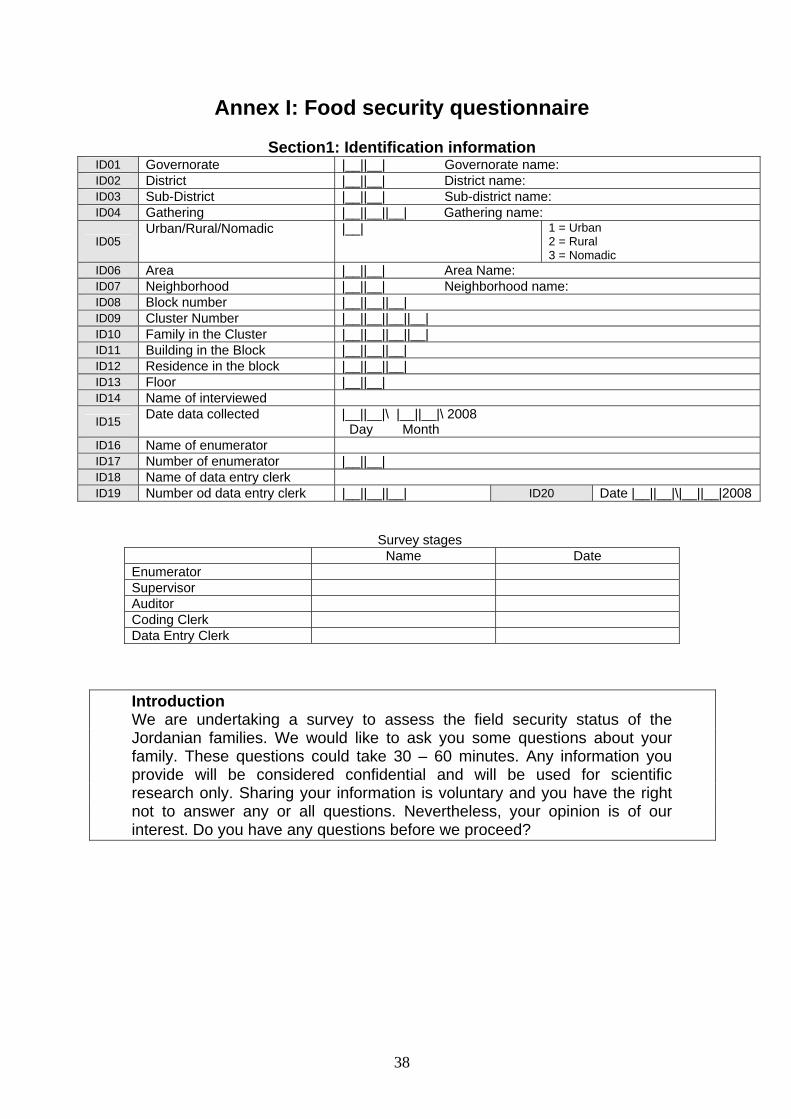
Annex I: Food security questionnaire
Section1: Identification information ID01 Governorate |__||__| Governorate name: ID02 District |__||__| District name: ID03 Sub-District |__||__| Sub-district name: ID04 Gathering |__||__||__| Gathering name:
ID05 Urban/Rural/Nomadic |__| 1 = Urban
2 = Rural 3 = Nomadic
ID06 Area |__||__| Area Name: ID07 Neighborhood |__||__| Neighborhood name: ID08 Block number |__||__||__| ID09 Cluster Number |__||__||__||__| ID10 Family in the Cluster |__||__||__||__| ID11 Building in the Block |__||__||__| ID12 Residence in the block |__||__||__| ID13 Floor |__||__| ID14 Name of interviewed
ID15 Date data collected |__||__|\ |__||__|\ 2008 Day Month
ID16 Name of enumerator ID17 Number of enumerator |__||__| ID18 Name of data entry clerk ID19 Number od data entry clerk __||__||__|| ID20 Date |__||__|\|__||__|2008
Survey stages Name Date Enumerator Supervisor Auditor Coding Clerk Data Entry Clerk
Introduction We are undertaking a survey to assess the field security status of the Jordanian families. We would like to ask you some questions about your family. These questions could take 30 – 60 minutes. Any information you provide will be considered confidential and will be used for scientific research only. Sharing your information is voluntary and you have the right not to answer any or all questions. Nevertheless, your opinion is of our interest. Do you have any questions before we proceed?
39
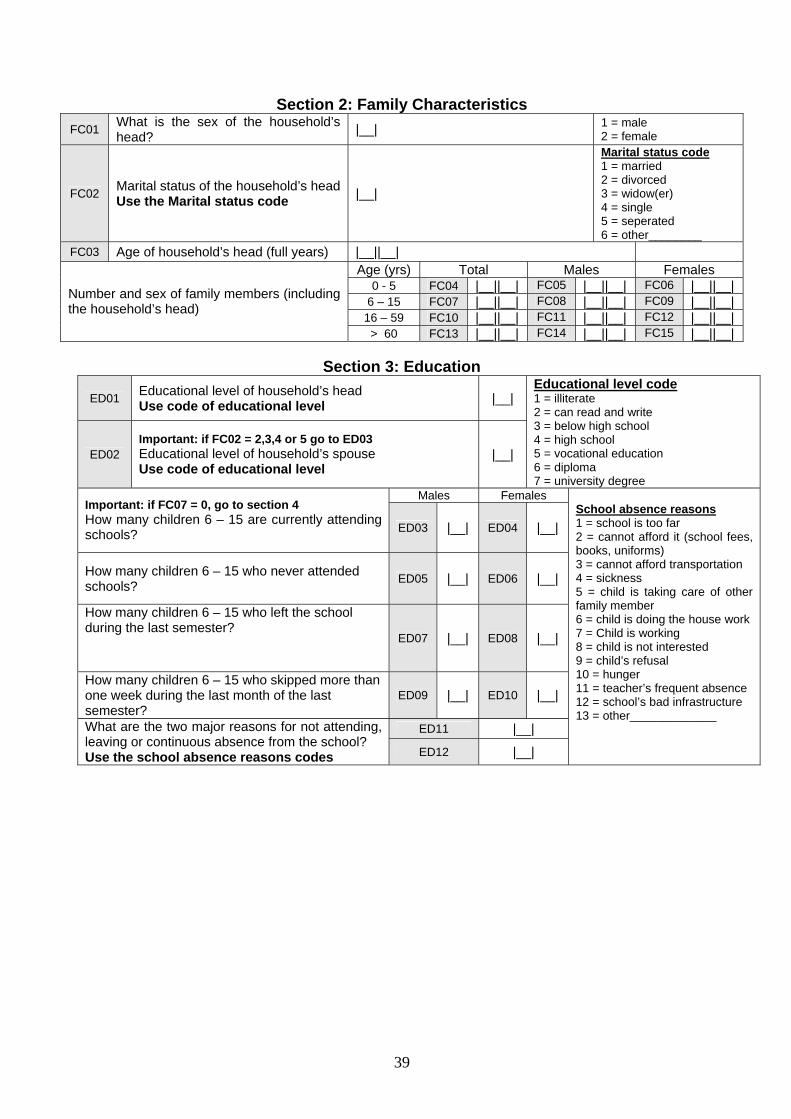
Section 2: Family Characteristics FC01 What is the sex of the household’s
head? |__| 1 = male 2 = female
FC02 Marital status of the household’s head Use the Marital status code |__|
Marital status code 1 = married 2 = divorced 3 = widow(er) 4 = single 5 = seperated 6 = other________
FC03 Age of household’s head (full years) |__||__| Age (yrs) Total Males Females
0 - 5 FC04 |__||__| FC05 |__||__| FC06 |__||__| 6 – 15 FC07 |__||__| FC08 |__||__| FC09 _||__||_
16 – 59 FC10 |__||__| FC11 |__||__| FC12 |__||__| Number and sex of family members (including the household’s head)
> 60 FC13 |__||__| FC14 |__||__| FC15 |__||__|
Section 3: Education
ED01 Educational level of household’s head Use code of educational level |__|
ED02 Important: if FC02 = 2,3,4 or 5 go to ED03 Educational level of household’s spouse Use code of educational level
|__|
Educational level code 1 = illiterate 2 = can read and write 3 = below high school 4 = high school 5 = vocational education 6 = diploma 7 = university degree
Males Females Important: if FC07 = 0, go to section 4 How many children 6 – 15 are currently attending schools? ED03 |__| ED04 |__|
How many children 6 – 15 who never attended schools? ED05 |__| ED06 |__|
How many children 6 – 15 who left the school during the last semester?
ED07 |__| ED08 |__|
How many children 6 – 15 who skipped more than one week during the last month of the last semester?
ED09 |__| ED10 |__|
ED11 |__| What are the two major reasons for not attending, leaving or continuous absence from the school? Use the school absence reasons codes ED12 |__|
School absence reasons 1 = school is too far 2 = cannot afford it (school fees, books, uniforms) 3 = cannot afford transportation 4 = sickness 5 = child is taking care of other family member 6 = child is doing the house work 7 = Child is working 8 = child is not interested 9 = child’s refusal 10 = hunger 11 = teacher’s frequent absence 12 = school’s bad infrastructure 13 = other_____________
40
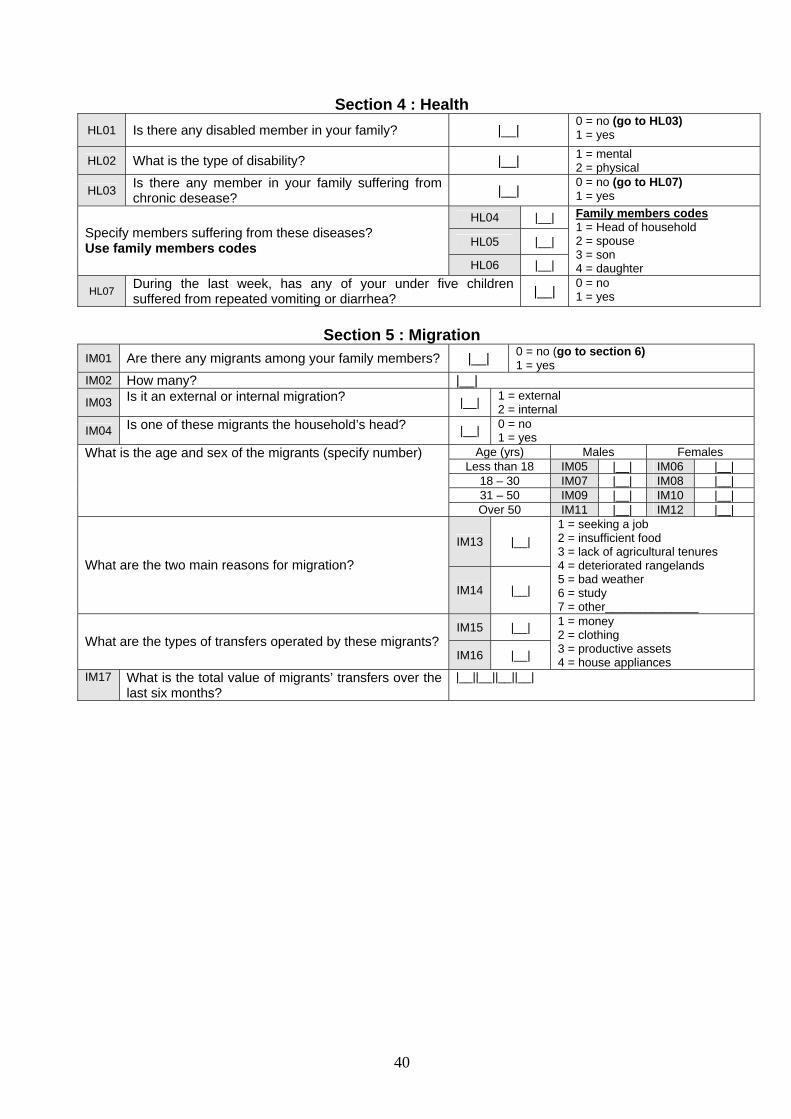
Section 4 : Health HL01 Is there any disabled member in your family? |__|
0 = no (go to HL03) 1 = yes
HL02 What is the type of disability? |__| 1 = mental 2 = physical
HL03 Is there any member in your family suffering from chronic desease? |__|
0 = no (go to HL07) 1 = yes
HL04 |__|
HL05 |__| Specify members suffering from these diseases? Use family members codes
HL06 |__|
Family members codes 1 = Head of household 2 = spouse 3 = son 4 = daughter
HL07 During the last week, has any of your under five children suffered from repeated vomiting or diarrhea? |__| 0 = no
1 = yes
Section 5 : Migration
IM01 Are there any migrants among your family members? |__| 0 = no (go to section 6) 1 = yes
IM02 How many? |__| IM03 Is it an external or internal migration? |__| 1 = external
2 = internal
IM04 Is one of these migrants the household’s head? |__| 0 = no 1 = yes
Age (yrs) Males Females Less than 18 IM05 |__| IM06 |__|
18 – 30 IM07 |__| IM08 |__| 31 – 50 IM09 |__| IM10 |__|
What is the age and sex of the migrants (specify number)
Over 50 IM11 |__| IM12 |__|
IM13 |__|
What are the two main reasons for migration?
IM14 |__|
1 = seeking a job 2 = insufficient food 3 = lack of agricultural tenures 4 = deteriorated rangelands 5 = bad weather 6 = study 7 = other______________
IM15 |__| What are the types of transfers operated by these migrants?
IM16 |__|
1 = money 2 = clothing 3 = productive assets 4 = house appliances
IM17 What is the total value of migrants’ transfers over the last six months?
|__||__||__||__|
41
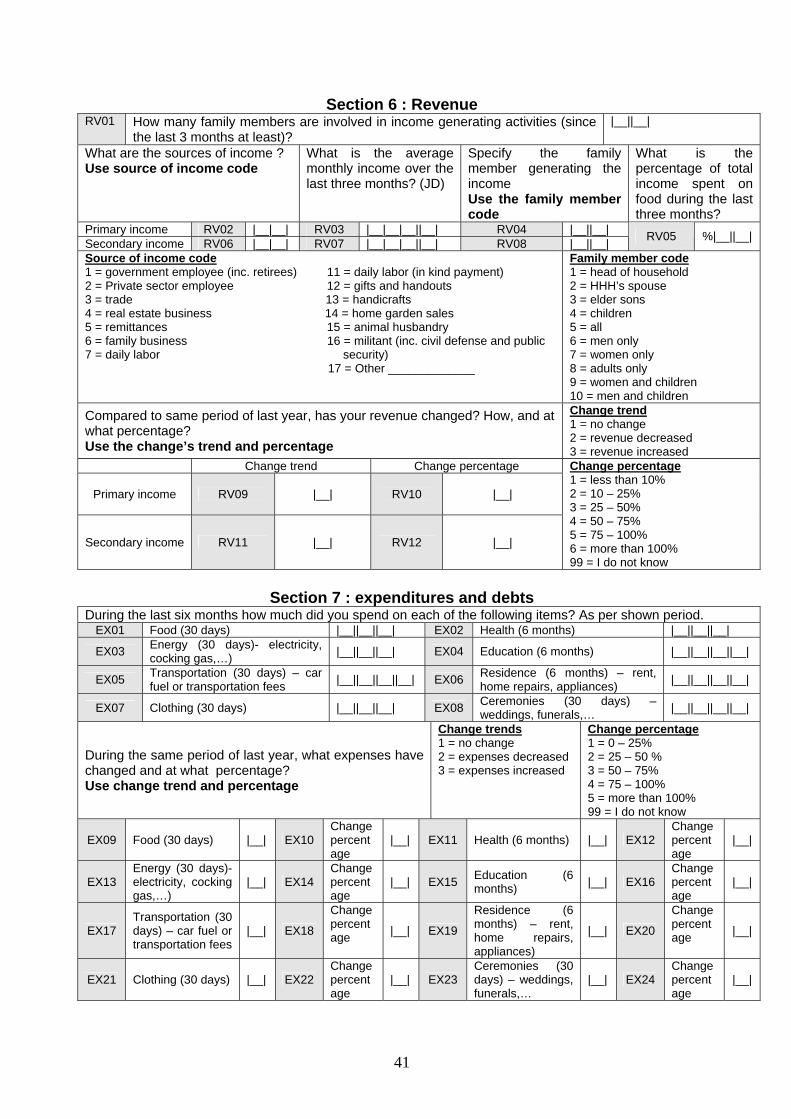
Section 6 : Revenue RV01 How many family members are involved in income generating activities (since
the last 3 months at least)? |__||__|
What are the sources of income ? Use source of income code
What is the average monthly income over the last three months? (JD)
Specify the family member generating the income Use the family member code
What is the percentage of total income spent on food during the last three months?
Primary income RV02 |__|__| RV03 |__|__|__||__| RV04 |__||__| Secondary income RV06 |__|__| RV07 |__|__|__||__| RV08 |__||__| RV05 |__||__|%
Source of income code 1 = government employee (inc. retirees) 11 = daily labor (in kind payment) 2 = Private sector employee 12 = gifts and handouts 3 = trade 13 = handicrafts 4 = real estate business 14 = home garden sales 5 = remittances 15 = animal husbandry 6 = family business 16 = militant (inc. civil defense and public 7 = daily labor security) 17 = Other _____________
Family member code 1 = head of household 2 = HHH’s spouse 3 = elder sons 4 = children 5 = all 6 = men only 7 = women only 8 = adults only 9 = women and children 10 = men and children
Compared to same period of last year, has your revenue changed? How, and at what percentage? Use the change’s trend and percentage
Change trend 1 = no change 2 = revenue decreased 3 = revenue increased
Change trend Change percentage
Primary income RV09 |__| RV10 |__|
Secondary income RV11 |__| RV12 |__|
Change percentage 1 = less than 10% 2 = 10 – 25% 3 = 25 – 50% 4 = 50 – 75% 5 = 75 – 100% 6 = more than 100% 99 = I do not know
Section 7 : expenditures and debts
During the last six months how much did you spend on each of the following items? As per shown period. EX01 Food (30 days) |__||__||__| EX02 Health (6 months) |__||__||__|
EX03 Energy (30 days)- electricity, cocking gas,…) |__||__||__| EX04 Education (6 months) |__||__||__||__|
EX05 Transportation (30 days) – car fuel or transportation fees |__||__||__||__| EX06 Residence (6 months) – rent,
home repairs, appliances) |__||__||__||__|
EX07 Clothing (30 days) |__||__||__| EX08 Ceremonies (30 days) – weddings, funerals,… |__||__||__||__|
During the same period of last year, what expenses have changed and at what percentage? Use change trend and percentage
Change trends 1 = no change 2 = expenses decreased 3 = expenses increased
Change percentage 1 = 0 – 25% 2 = 25 – 50 % 3 = 50 – 75% 4 = 75 – 100% 5 = more than 100% 99 = I do not know
EX09 Food (30 days) |__| EX10 Change percentage
|__| EX11 Health (6 months) |__| EX12 Change percentage
|__|
EX13 Energy (30 days)- electricity, cocking gas,…)
|__| EX14 Change percentage
|__| EX15 Education (6 months) |__| EX16
Change percentage
|__|
EX17 Transportation (30 days) – car fuel or transportation fees
|__| EX18
Change percentage |__| EX19
Residence (6 months) – rent, home repairs, appliances)
|__| EX20
Change percentage |__|
EX21 Clothing (30 days) |__| EX22 Change percentage
|__| EX23 Ceremonies (30 days) – weddings, funerals,…
|__| EX24 Change percentage
|__|
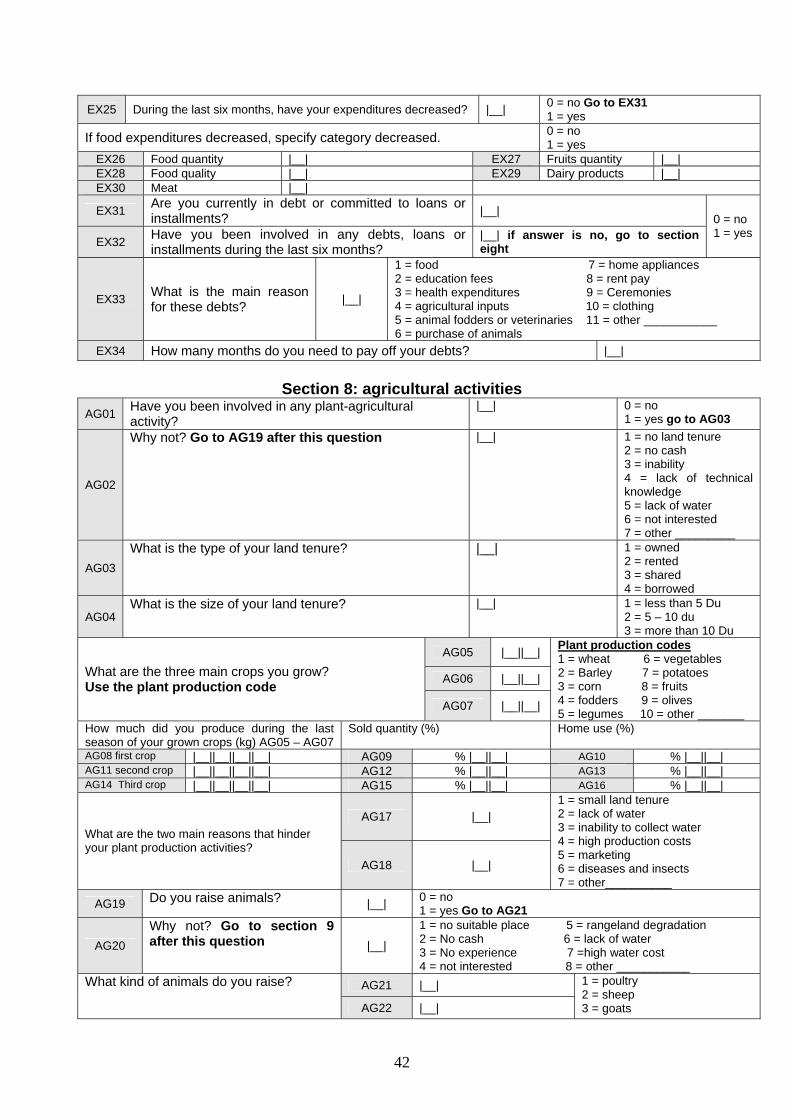
42
EX25 During the last six months, have your expenditures decreased? |__| 0 = no Go to EX31 1 = yes
If food expenditures decreased, specify category decreased. 0 = no 1 = yes
EX26 Food quantity |__| EX27 Fruits quantity |__| EX28 Food quality |__| EX29 Dairy products |__| EX30 Meat |__|
EX31 Are you currently in debt or committed to loans or installments? |__|
EX32 Have you been involved in any debts, loans or installments during the last six months?
|__| if answer is no, go to section eight
0 = no 1 = yes
EX33 What is the main reason for these debts? |__|
1 = food 7 = home appliances 2 = education fees 8 = rent pay 3 = health expenditures 9 = Ceremonies 4 = agricultural inputs 10 = clothing 5 = animal fodders or veterinaries 11 = other ___________ 6 = purchase of animals
EX34 How many months do you need to pay off your debts? |__|
Section 8: agricultural activities
AG01 Have you been involved in any plant-agricultural activity?
|__| 0 = no 1 = yes go to AG03
AG02
Why not? Go to AG19 after this question |__| 1 = no land tenure 2 = no cash 3 = inability 4 = lack of technical knowledge 5 = lack of water 6 = not interested 7 = other _________
AG03 What is the type of your land tenure? |__| 1 = owned
2 = rented 3 = shared 4 = borrowed
AG04 What is the size of your land tenure? |__| 1 = less than 5 Du
2 = 5 – 10 du 3 = more than 10 Du
AG05 |__||__|
AG06 ||__||__ What are the three main crops you grow? Use the plant production code
AG07 |__||__|
Plant production codes 1 = wheat 6 = vegetables 2 = Barley 7 = potatoes 3 = corn 8 = fruits 4 = fodders 9 = olives 5 = legumes 10 = other _______
How much did you produce during the last season of your grown crops (kg) AG05 – AG07
Sold quantity (%) Home use (%)
AG08 first crop |__||__||__||__| AG09 |__||__|% AG10 |__||__|% AG11 second crop |__||__||__||__| AG12 |__||__|% AG13 |__||__|% AG14 Third crop |__||__||__||__| AG15 |__||__|% AG16 |__||__|%
AG17 |__| What are the two main reasons that hinder your plant production activities?
AG18 |__|
1 = small land tenure 2 = lack of water 3 = inability to collect water 4 = high production costs 5 = marketing 6 = diseases and insects 7 = other__________
AG19 Do you raise animals? |__| 0 = no 1 = yes Go to AG21
AG20 Why not? Go to section 9 after this question |__|
1 = no suitable place 5 = rangeland degradation 2 = No cash 6 = lack of water 3 = No experience 7 =high water cost 4 = not interested 8 = other ___________
AG21 |__| What kind of animals do you raise?
AG22 |__|
1 = poultry 2 = sheep 3 = goats
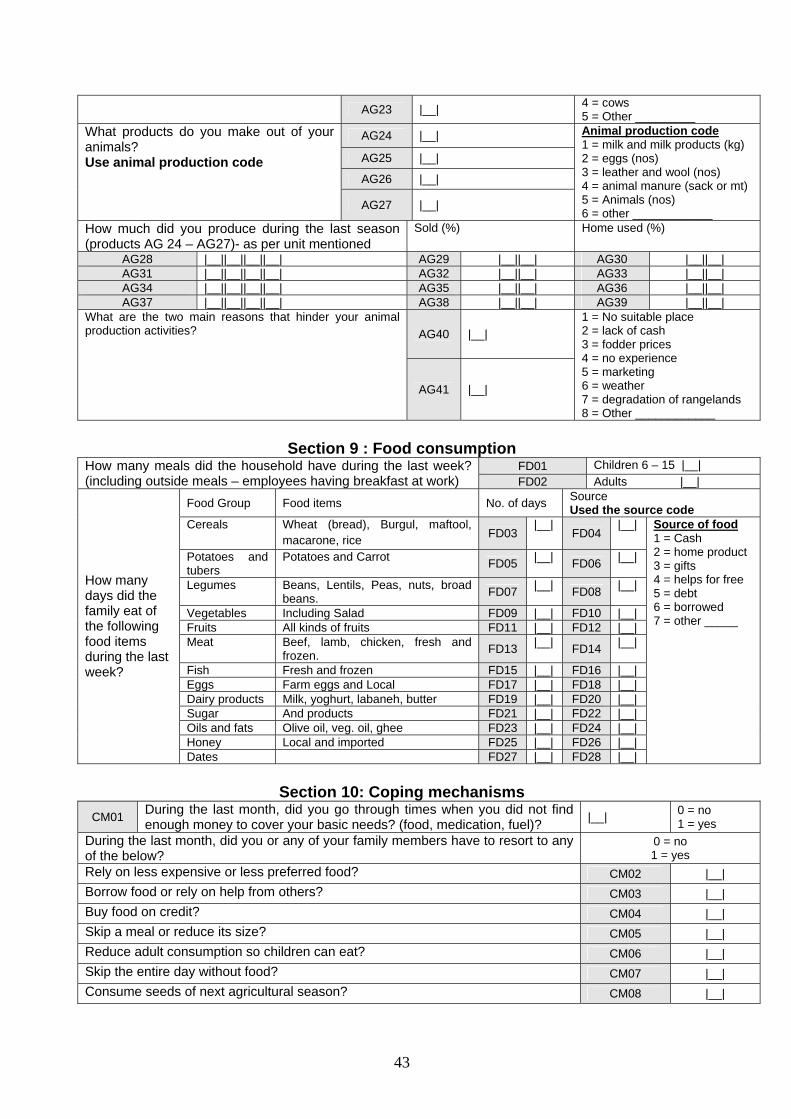
43
AG23 |__| 4 = cows 5 = Other _________
AG24 |__|
AG25 |__|
AG26 |__|
What products do you make out of your animals? Use animal production code
AG27 |__|
Animal production code 1 = milk and milk products (kg) 2 = eggs (nos) 3 = leather and wool (nos) 4 = animal manure (sack or mt) 5 = Animals (nos) 6 = other ____________
How much did you produce during the last season (products AG 24 – AG27)- as per unit mentioned
Sold (%) Home used (%)
AG28 |__||__||__||__| AG29 |__||__| AG30 |__||__| AG31 |__||__||__||__| AG32 |__||__| AG33 |__||__| AG34 |__||__||__||__| AG35 |__||__| AG36 |__||__| AG37 |__||__||__||__| AG38 |__||__| AG39 |__||__|
AG40 |__| What are the two main reasons that hinder your animal production activities?
AG41 |__|
1 = No suitable place 2 = lack of cash 3 = fodder prices 4 = no experience 5 = marketing 6 = weather 7 = degradation of rangelands 8 = Other ____________
Section 9 : Food consumption
FD01 Children 6 – 15 |__| How many meals did the household have during the last week? (including outside meals – employees having breakfast at work) FD02 Adults |__|
Food Group Food items No. of days Source Used the source code
Cereals Wheat (bread), Burgul, maftool, macarone, rice FD03
|__| FD04
|__|
Potatoes and tubers
Potatoes and Carrot FD05 |__| FD06 |__|
Legumes Beans, Lentils, Peas, nuts, broad beans. FD07 |__| FD08 |__|
Vegetables Including Salad FD09 |__| FD10 |__| Fruits All kinds of fruits FD11 |__| FD12 |__| Meat Beef, lamb, chicken, fresh and
frozen. FD13 |__| FD14 |__|
Fish Fresh and frozen FD15 |__| FD16 |__| Eggs Farm eggs and Local FD17 |__| FD18 |__| Dairy products Milk, yoghurt, labaneh, butter FD19 |__| FD20 |__| Sugar And products FD21 |__| FD22 |__| Oils and fats Olive oil, veg. oil, ghee FD23 |__| FD24 |__| Honey Local and imported FD25 |__| FD26 |__|
How many days did the family eat of the following food items during the last week?
Dates FD27 |__| FD28 |__|
Source of food 1 = Cash 2 = home product 3 = gifts 4 = helps for free 5 = debt 6 = borrowed 7 = other _____
Section 10: Coping mechanisms
CM01 During the last month, did you go through times when you did not find enough money to cover your basic needs? (food, medication, fuel)? |__| 0 = no
1 = yes During the last month, did you or any of your family members have to resort to any of the below?
0 = no 1 = yes
Rely on less expensive or less preferred food? CM02 |__| Borrow food or rely on help from others? CM03 |__| Buy food on credit? CM04 |__| Skip a meal or reduce its size? CM05 |__| Reduce adult consumption so children can eat? CM06 |__| Skip the entire day without food? CM07 |__| Consume seeds of next agricultural season? CM08 |__|
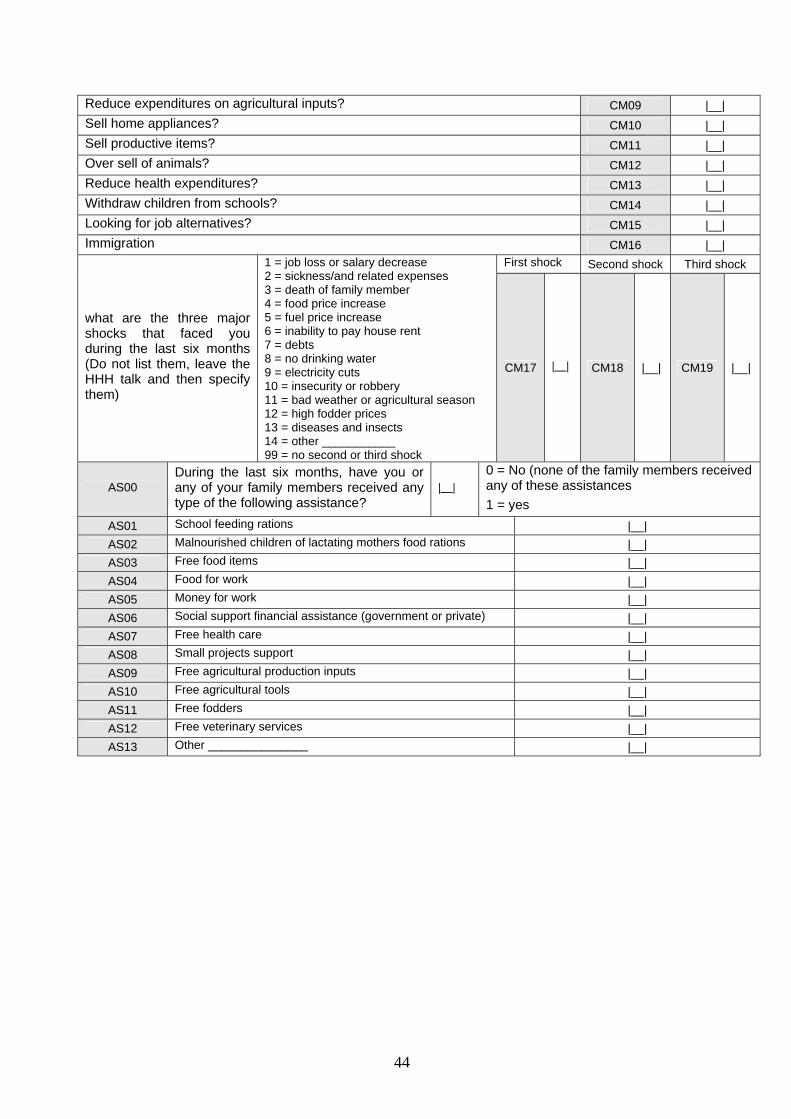
44
Reduce expenditures on agricultural inputs? CM09 |__| Sell home appliances? CM10 |__| Sell productive items? CM11 |__| Over sell of animals? CM12 |__| Reduce health expenditures? CM13 |__| Withdraw children from schools? CM14 |__| Looking for job alternatives? CM15 |__| Immigration CM16 |__|
First shock Second shock Third shock
what are the three major shocks that faced you during the last six months (Do not list them, leave the HHH talk and then specify them)
1 = job loss or salary decrease 2 = sickness/and related expenses 3 = death of family member 4 = food price increase 5 = fuel price increase 6 = inability to pay house rent 7 = debts 8 = no drinking water 9 = electricity cuts 10 = insecurity or robbery 11 = bad weather or agricultural season 12 = high fodder prices 13 = diseases and insects 14 = other ___________ 99 = no second or third shock
CM17 |__| CM18 |__| CM19 |__|
AS00 During the last six months, have you or any of your family members received any type of the following assistance?
|__| 0 = No (none of the family members received any of these assistances 1 = yes
AS01 School feeding rations |__| AS02 Malnourished children of lactating mothers food rations |__| AS03 Free food items |__| AS04 Food for work |__| AS05 Money for work |__| AS06 Social support financial assistance (government or private) |__| AS07 Free health care |__| AS08 Small projects support |__| AS09 Free agricultural production inputs |__| AS10 Free agricultural tools |__| AS11 Free fodders |__| AS12 Free veterinary services |__| AS13 Other _______________ |__|
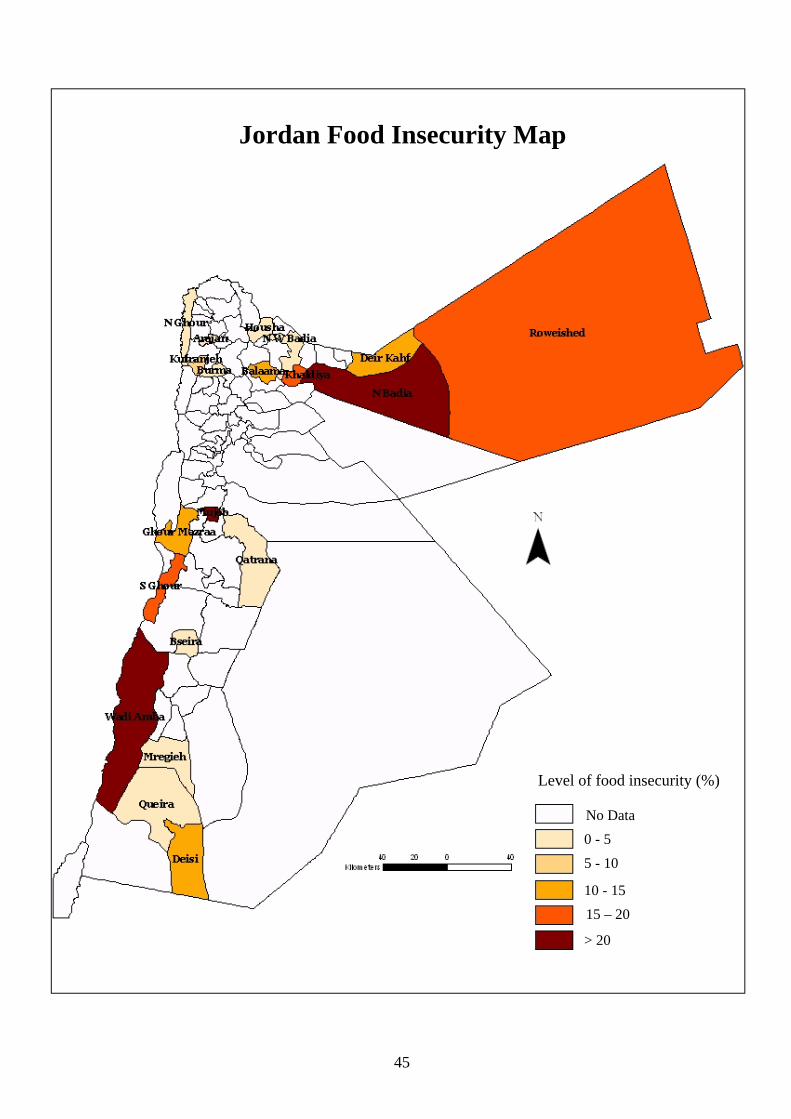
45
Level of food insecurity (%)
No Data 0 - 5 5 - 10
10 - 15 15 – 20
> 20
Jordan Food Insecurity Map