)joebxj1vcmjtijoh$psqpsbujpo …downloads.hindawi.com/archive/2014/582672.pdf · c- chipiona las...
TRANSCRIPT

Research ArticleGenetic Diversity of Fusarium oxysporum f sp dianthi inSouthern Spain
Rauacutel Castantildeo1 Barbara Scherm2 and Manuel Avileacutes1
1 Department of Agroforestry Sciences Escuela Tecnica Superior de Ingenierıaa Agronomica (ETSIA) University of SevilleCarretera de Utrera Km 1 41013 Seville Spain
2Department of Plant Protection University of Sassari Via Enrico de Nicola 9 07100 Sassari Italy
Correspondence should be addressed to Raul Castano rcasmungmailcom
Received 18 February 2014 Accepted 20 May 2014 Published 6 July 2014
Academic Editor Praveen Rao Juvvadi
Copyright copy 2014 Raul Castano et al This is an open access article distributed under the Creative Commons Attribution Licensewhich permits unrestricted use distribution and reproduction in any medium provided the original work is properly cited
The diversity of races and prevalence of pathogenic populations of Fusarium oxysporum f sp dianthi (Fod) were surveyed in an areain southern Spain From 54 farms 132 isolates were collected from wilted carnation plants Isolates were characterized by RAPD-PCR DNA sequence analysis of the TEF1-120572 gene and race-specific molecular markers Selected isolates from RAPD groups werephenotypically evaluated by pathogenicity tests Data analysis showed that Fod race 2 was the most frequent and prevalent race inthe study area followed by race 18 Moreover phylogenetic analyses showed similar results which were different to those of therace-specific PCR assays It was concluded that (i) seven isolates were not classified in groups where Fod testers were clustered eventhey showed different results when race-specific markers were used (ii) ten isolates with retarded race 1 or race 8 specific band werecharacterized as F proliferatum by TEF1-120572 gene sequencing and clustered into an outgroup and (iii) six isolates failed to generatean amplification signal using race-specific markers Furthermore three of them were grouped close to race 2 tester according tothe phylogenetic analyses showing the same differential pathogenicity as race 2 This may indicate a Fod race 2 subgroup in thisregion
1 Introduction
Fusarium oxysporum Schlechtend Emend W C Snyder ampH N Hans is a species complex of morphologically similarfungi with multiple phylogenetic origins that fall into threewell-supported clades [1] Pathogenic isolates of F oxysporumoften display a high degree of host specificity and can besubdivided into formae speciales on the basis of the plantspecies affected The forma specialis dianthi (Fod) causesFusarium wilt of carnation (Dianthus caryophyllus L) adisease that is responsible for severe losses in areas wherethis flower is grown The pathogen is widespread in soilsworldwide [2ndash5]
In 2009 Andalusia accounted for 554 of the totalcarnations produced in Spain and 621 of this was fromthe province of Cadiz [6] which is the greatest producerin Europe [7] In this area Fusarium wilt disease appearedfive years after the introduction of the first carnation plantsin 1975 Since then it has been reported continuously [8]
Despite this exhaustive studies on race diversity and patternof Fod distribution in this area are lacking [5]
Fod can be distinguished into physiological races on thebasis of the capacity of the pathogen to attack differentialcarnation cultivars To date ten races have been describedworldwide [5] Races 1 and 8 apparently originated in theItalian Riviera where they are associated withMediterraneancarnation ecotypes found in Italy France and Spain Race2 is widespread in all areas of carnation cultivation in theworld Race 4 is found in carnation cultivars in the UnitedStates Italy Israel Spain and Colombia Race 3 was initiallyclassified as a Fod race but DNA-based methods recentlyreclassified it as F redolens revealing that F redolens and Foxysporum not only are different species but also lack a sistergroup relationship [1] The other races described have notbeen found in carnation crops in the Spanish areas studiedso far [9]
Race classification of Fod can be established by testing itsvirulence using differential carnation cultivars [4 5] or PCR
Hindawi Publishing CorporationJournal of MycologyVolume 2014 Article ID 582672 14 pageshttpdxdoiorg1011552014582672
2 Journal of Mycology
2 (6)3 (6)
4 (5)
18 (3)13 (2)
6 (3)
25 (1)
24 (2)1 (5)11 (7)
17 (7)5 (8)15 (6)
10 (13) 7 (20)16 (1)
21 (5)
14 (1)
20 (1)
19 (3)9 (7)
12 (4)23 (6)
N
C adiz
NESE
SW NW
Figure 1 Wilted carnation plants collected in the north-west of theprovince of Cadiz Top left map of Andalusia showing the north-west area of the province of Cadiz Bottom the locations of someof the areas studied are represented in bold with code numbers andreferenced in Table 1 In parentheses numbers of isolates recoveredin each zone
with specific molecular markers to determine Fod races 24 and jointly 1 and 8 [10] Regarding race-specific primersthey were designed on the basis of transposable elements Fot1and impala whose restriction profiles show a race-associatedpolymorphic pattern using Southern hybridization [10] Fin-gerprinting techniques (such as random amplification ofpolymorphic DNA polymerase chain reaction RAPD-PCR)have been applied to evaluate the level of genetic diversityin various F oxysporum formae speciales including dianthi[3 4 11] This technique can also separate Fod races [4 11]Moreover previous studies to establish a reliable molecularmarker for phylogenetic studies on different Fusarium specieshave been conducted The TEF1-120572 gene is considered highlyinformative for differentiating Fusarium spp and manyformae speciales within the F oxysporum species complex[12ndash15]These phylogenetic techniques could provide furtherinformation and reinforce the separation of Fod races usingspecific markers
The determination of race and genetic diversity inpathogen populations in a given region provides relevantinformation of practical significance [16] which is useful fordeveloping resistance breeding programs aimed at selectingcultivars that can reduce the devastating effects of Fusariumwilt in a given area [17 18] The aim of this study was tosurvey the racial diversity and prevalence of a Fod populationin the north-west of the Cadiz province a region with along tradition of carnation cultivation using phenotypic andmolecular assays
2 Materials and Methods
21 Sampling Process Wilted carnation plants were sampledfrom 54 randomly selected farms in three municipal areasof Andalucia Spain (Chipiona Sanlucar de Barrameda andRota) from 2004 to 2006 One isolate was obtained from eachdisease focus in different greenhouses per farmThe samplinglocations are shown in Table 1 and Figure 1
22 Pathogen Isolation Plants were cut at the stem base andthe obtained pieces were surface-sterilized using 10 (vv)sodiumhypochlorite for 2min After twowash steps in steriledistilled water (SDW) the stem fragments were air-dried andtransferred toKomadarsquosFusarium semiselectivemedium [19]Plates were incubated at 25∘Cand fungi weremonitored dailyLater fungi were transferred to potato dextrose agar (PDAMerck) plates A total of 132 isolates displaying Fusariummorphology were recovered Two monosporic cultures fromeach isolate were stored in silica gel at 5 to 10∘C [20]
23 Total DNA Isolation Fungi stored on silica gel weregrownon sterile cellophane disk plates onPDAand incubatedat 25∘C for 7 to 8 days Mycelium was recovered andtransferred to a sterile Eppendorf tube Tubeswere frozen andthen lyophilized (Telstar Cryodos Telstar UK) for 24 h Totalgenomic DNA was extracted from the lyophilized isolates asdescribed by Cassago et al [21] with minor modificationsApproximately 02 g of lyophilized mycelium was used DNAwas resuspended in 40 120583L of TE-Rnase (10 120583gmL) at 37∘Cfor 30min Concentration and purity of total DNA weredetermined by spectrophotometric measurements at 260 nmand 280 nm
24 RAPD-PCR Analysis Population profiles were createdby RAPD-PCR fingerprinting Five 10-mer oligonucleotideswere chosen on the basis of (i) previous genetic diversitystudies with Fod and other F oxysporum pathogens (OPB-01 [22 23] and OPE-11 and OPE-16 [4]) and (ii) polymorphicband patterns (OPH-19 and OPH-20 (Operon TechnologiesAlameda CA USA))
The amplifications were performed in a total volume of20120583L containing 75 ng 120583Lminus1 of genomic DNA 1x Biotoolsstandard reaction buffer 25mM of MgCl
2 100 120583M of dNTP
(Biotools Madrid Spain) 1 120583M of each primer and 1U ofBiotools DNA polymerase (Biotools Madrid Spain) Theamplification conditions were as follows a denaturation stepfor 5min at 94∘C followed by 45 amplification cycles of 30 s at94∘C 1min at 36∘C and 2min at 72∘C A final extension stepwas performed for 5min at 72∘C Reactions were performedwith a thermal cycler (Gene Amp PCR System 2700 AppliedBiosystems) Amplified DNA products were run on 15agarose gels and separated by electrophoresis and DNAwas visualized and photographed under UV light with aTransilluminator (BioDoc-it System UVP)
Each band in the RAPD profiles was considered an inde-pendent locus with two alleles and transformed into binarycodes on the basis of presence versus absence of amplificationproducts (1 for presence and 0 for absence)The amplificationproducts of different primers recorded on photos were scored
Journal of Mycology 3
Table 1 Fusarium oxysporum populations from diseased carnation cultivars in the north-west of the province of Cadiz ordered by farm
Isolatea Municipal areasb Zonesc Code zoned Farme Cultivare Racef
C4-06 Chipiona Espantamonos 1 1a Ashely R1-8C8-13 Chipiona Espantamonos 1 1a Ashely R1-8C8-15 Chipiona Espantamonos 1 1b Bellami R2C8-23 Chipiona Espantamonos 1 1c Pasodoble R1-8C9-06 Chipiona Espantamonos 1 1c Pasodoble R1-8C4-10 Sanlucar de Barrameda La Algaida 2 2a Rossini R2C9-21 Sanlucar de Barrameda La Algaida 2 2a Rossini R2C10-06 Sanlucar de Barrameda La Algaida 2 2a Rossini R2C7-04 Sanlucar de Barrameda La Algaida 2 2b Baltico R2C7-05 Sanlucar de Barrameda La Algaida 2 2b Delphi R2C9-24 Sanlucar de Barrameda La Algaida 2 2b Liberty R2C4-13 Sanlucar de Barrameda La Algaida Punta del Muro 3 3a Liberty R1-8C9-02 Sanlucar de Barrameda La AlgaidaPunta del Muro 3 3b Liberty R2C9-10 Sanlucar de Barrameda La AlgaidaPunta del Muro 3 3b Liberty R2C9-03 Sanlucar de Barrameda La AlgaidaPunta del Muro 3 3c Ivana Orange R2C9-04 Sanlucar de Barrameda La AlgaidaPunta del Muro 3 3c Ivana Orange R2C9-11 Sanlucar de Barrameda La AlgaidaPunta del Muro 3 3c Ivana Orange R2C4-17 Sanlucar de Barrameda La Algaida CC 4 4a Gram Slam R1-8C4-18 Sanlucar de Barrameda La Algaida CC 4 4a Gram Slam R1-8C10-08 Sanlucar de Barrameda La Algaida CC 4 4a Gram Slam R1-8C4-19 Sanlucar de Barrameda La Algaida CC 4 4b Orange Prestige R2C4-20 Sanlucar de Barrameda La Algaida CC 4 4b Orange Prestige R1-8C4-21 Chipiona Los Rizos 5 5a Gaudina R1-8C4-22 Chipiona Los Rizos 5 5a Gaudina R1-8C4-23 Chipiona Los Rizos 5 5a Gaudina R1-8C5-01 Chipiona Los Rizos 5 5b Liberty R2C5-16 Chipiona Los Rizos 5 5b Liberty R2C6-21 Chipiona Los Rizos 5 5b Liberty R2C5-05 Chipiona Los Rizos 5 5c While Ashley R1-8C5-06 Chipiona Los Rizos 5 5c While Ashley R1-8C5-03 Sanlucar de Barrameda Hato de la Carne 6 6a Barbara R1-8C5-04 Sanlucar de Barrameda Hato de la Carne 6 6a Barbara R1-8C6-23 Sanlucar de Barrameda Hato de la Carne 6 6a Barbara R1-8C5-07 Chipiona Las Machuelas 7 7a Gaudina R1-8C5-08 Chipiona Las Machuelas 7 7a Gaudina R1-8C5-09 Chipiona Las Machuelas 7 7a Gaudina R1-8C5-19 Chipiona Las Machuelas 7 7b Pilar R2C5-20 Chipiona Las Machuelas 7 7b Pilar R2C5-24 Chipiona Las Machuelas 7 7b Pilar R2C6-14 Chipiona Las Machuelas 7 7c Pilar NBC6-15 Chipiona Las Machuelas 7 7c Pilar NBC7-02 Chipiona Las Machuelas 7 7c Pilar NBC7-08 Chipiona Las Machuelas 7 7d Capineira R1-8C10-11 Chipiona Las Machuelas 7 7d Capineira R1-8C10-24 Chipiona Las Machuelas 7 7d Capineira R1-8C7-09 Chipiona Las Machuelas 7 7e Natila R1-8C9-07 Chipiona Las Machuelas 7 7e Natila R1-8C10-20 Chipiona Las Machuelas 7 7e Natila R1-8C8-03 Chipiona Las Machuelas 7 7f Ticotico R2C8-04 Chipiona Las Machuelas 7 7f Ticotico R2C8-05 Chipiona Las Machuelas 7 7f Ticotico R2
4 Journal of Mycology
Table 1 Continued
Isolatea Municipal areasb Zonesc Code zoned Farme Cultivare Racef
C10-04 Chipiona Las Machuelas 7 7f Ticotico R1-8C10-13 Chipiona Las Machuelas 7 7g Star R1-8C5-21 Chipiona Huerta San Juan 8 8a Eveling R2C6-24 Chipiona Huerta San Juan 8 8a Eveling R2C9-20 Chipiona Huerta San Juan 8 8a Eveling R2C5-22 Chipiona Majada de las vacas 9 9a Master NBC5-23 Chipiona Majada de las vacas 9 9a Master NBC5-25 Chipiona Majada de las vacas 9 9a Master R1-8C6-01 Chipiona Majada de las vacas 9 9a Master NBC6-03 Chipiona Majada de las vacas 9 9b Pilar R2C6-04 Chipiona Majada de las vacas 9 9b Pilar R2C6-07 Chipiona Majada de las vacas 9 9b Pilar R2C6-06 Chipiona Escalereta 10 10a Baltico R2C6-08 Chipiona Escalereta 10 10a Baltico R2C10-10 Chipiona Escalereta 10 10a Baltico R2C6-09 Chipiona Escalereta 10 10b Maestro R2C6-10 Chipiona Escalereta 10 10b Maestro R2C6-25 Chipiona Escalereta 10 10b Maestro R2C7-12 Chipiona Escalereta 10 10c Imagine R1-8C7-13 Chipiona Escalereta 10 10c Imagine R1-8C7-14 Chipiona Escalereta 10 10c Imagine R2C7-17 Chipiona Escalereta 10 10c Imagine R2C7-20 Chipiona Escalereta 10 10c Imagine R1-8C9-18 Chipiona Escalereta 10 10c Imagine R2C10-03 Chipiona Escalereta 10 10c Imagine R2C6-11 Chipiona Pinar Martın 11 11a Berry R1-8C7-01 Chipiona Pinar Martın 11 11a Berry R1-8C6-12 Chipiona Pinar Martın 11 11b Medea R1-8C6-13 Chipiona Pinar Martın 11 11b Medea R2C8-10 Chipiona Pinar Martın 11 11c Rayo de Sole R2C8-11 Chipiona Pinar Martın 11 11c Rayo de Sole R2C10-05 Chipiona Pinar Martın 11 11c Rayo de Sole R1-8C6-16 Chipiona El Olivar 12 12a Dover R2C6-17 Chipiona El Olivar 12 12a Dover R2C7-03 Chipiona El Olivar 12 12a Dover R2C11-03 Chipiona El Olivar 12 12b Arena R2C7-06 Sanlucar de Barrameda Madre del Agua 13 13a Firato R2C10-17 Sanlucar de Barrameda Madre del Agua 13 13a Firato R2C7-11 Chipiona Majadales 14 14a Tempo R2C7-16 Chipiona Los Llanos 15 15a Lolita R2C7-18 Chipiona Los Llanos 15 15a Lolita R2C11-04 Chipiona Los Llanos 15 15a Lolita R2C10-14 Chipiona Los LlanosEnvidio 15 15b Claudia R1-8C10-15 Chipiona Los LlanosEnvidio 15 15b Claudia R1-8C10-16 Chipiona Los LlanosEnvidio 15 15b Claudia R1-8C8-02 Chipiona Cerro Colon 16 16a Delfi R2C8-06 Chipiona Loma Baja 17 17a Splendido R2C8-07 Chipiona Loma Baja 17 17a Splendido R2C8-08 Chipiona Loma Baja 17 17a Splendido R1-8C8-09 Chipiona Loma Baja 17 17a Splendido R1-8C8-19 Chipiona Loma Baja 17 17b Eilat R2
Journal of Mycology 5
Table 1 Continued
Isolatea Municipal areasb Zonesc Code zoned Farme Cultivare Racef
C8-20 Chipiona Loma Baja 17 17b Eilat R2C8-24 Chipiona Loma Baja 17 17b Eilat R2C8-22 Sanlucar de Barrameda Santa Tecla 18 18a Montezuma R2C8-14 Sanlucar de Barrameda Santa Tecla 18 18b Tauroc R1-8C9-05 Sanlucar de Barrameda Santa Tecla 18 18b Tauroc R1-8C8-21 Chipiona Majadales alto 19 19a Solar Oro R1-8C9-17 Chipiona Majadales alto 19 19b White Fleurette R1-8C11-02 Chipiona Majadales alto 19 19c Millenium R2C9-08 Rota Pena del Aguila 20 20a Rebeca R1-8C4-01 Chipiona Aulagar 21 21a Pink Ashley R2C4-02 Chipiona Aulagar 21 21a Pink Ashley R2C4-03 Chipiona Aulagar 21 21a Pink Ashley R2C4-04 Chipiona Aulagar 21 21b Pink Ashley R2C7-10 Chipiona Aulagar 21 21b Pink Ashley R2C4-14 Chipiona Monteruco 22 22a Cerise R Barb R1-8C4-15 Chipiona Monteruco 22 22a Cerise R Barb R1-8C4-16 Chipiona Monteruco 22 22a Cerise R Barb R1-8C10-07 Chipiona Monteruco 22 22a Cerise R Barb R1-8C7-07 Chipiona Monteruco 22 22b Orbit R1-8C9-14 Chipiona Monteruco 22 22b Orbit R1-8C9-25 Chipiona Monteruco 22 22b Orbit R1-8C7-21 Chipiona Lopina 23 23a Nogalte R2C7-22 Chipiona Lopina 23 23a Nogalte R2C7-23 Chipiona Lopina 23 23a Nogalte R2C7-24 Chipiona Lopina 23 23a Nogalte R2C7-25 Chipiona Lopina 23 23a Nogalte R2C8-01 Chipiona Lopina 23 23a Nogalte R2C9-15 Chipiona La Loma 24 24a Spectro R1-8C9-19 Chipiona La Loma 24 24b Spectro R1-8C10-02 Chipiona Copina 25 25a Delphi R2aNames of population isolatesbMunicipal areas (Chipiona Sanlucar de Barrameda and Rota)cZones in which farms were studieddA random code assigned to each zoneeCarnation cultivar finding in the corresponding farm which isolates were obtained Code zone with the same number but different letters means same zonebut different farmsfFusarium oxysporum f sp dianthi (Fod) determination using specific primers [10] R1-8 Fod race 1 or race 8 R2 Fod race 2 R1-8 in bold retardedelectrophoretic mobility band NB nonamplified band
manually and a binarymatrix was thus generated [24] Forty-one markers were analyzed using five operon primers Fromthe binary data matrix the distances were estimated usingthe distance estimation method described by Link et al [25]using TREECON [26] of the Windows software packageTree topology was inferred with the UPGMA (unweightedpaired group method with arithmetic averages) clusteringmethod to construct an unrooted tree [24] Amplificationswere repeated once with each monosporic culture from eachisolate
25 Isolate Determination by DNA Sequencing A portionof the translation elongation factor 1-120572 gene (TEF1-120572) wasamplified using EF1 and EF2 primers Each 50120583L of PCRreaction contained 75 ng120583Lminus1 of genomic DNA 1x Biotools
standard reaction buffer 375mMofMgCl2 100 120583Mof dNTP
(Biotools Madrid Spain) 05 120583M of each primer and 1Uof Biotools Pfu DNA polymerase (Biotools Madrid Spain)The PCR for both primer pairs was run at 95∘C for 2minfollowed by 10 cycles of 94∘C for 1min 54∘C for 2min andan elongation phase at 72∘C for 2min and 20 cycles of 94∘Cfor 1min 54∘C for 2min and an elongation phase at 72∘C for2min with an increase of 4 s per cycle concluded by a finalelongation phase at 72∘C for 5min Reactionswere performedwith a thermal cycler (Gene Amp PCR System 2700 AppliedBiosystems) Amplified DNA products were run on 15agarose gels and DNA was photographed under UV lightas described previously The expected amplification productsize was 700 bp PCR products were purified using SpeedtoolsPCRClean-UpKit (BiotoolsMadrid Spain) Sequencingwasperformed by Secugen (Secugen Madrid Spain)
6 Journal of Mycology
Table 2 Response of five carnation cultivars tested to races 1 2 4 6 and 8 of Fusarium oxysporum f sp dianthi
Race 1 Race 2 Race 4 Race 6 Race 8Eilat R S R R RNew Elsy S R R R RSuprema R S NT NT RReina R S R NT NTMayor S S NT S NTR resistant S susceptible NT not tested
Table 3 Selected isolates from the RAPD study
Isolatea Municipalareab Species namec Raced RAPD
GroupTEFGroup
GenBankaccessione
C5-20 Chipiona F oxysporum 2 I I GU199330C6-15 Chipiona F oxysporum NB I I GU199333C6-25 Chipiona F oxysporum 2 I I GU226824C9-10 Sanlucar de B F oxysporum 2 II I GU226828C5-23 Chipiona F oxysporum NB IV IV GU199331C6-01 Chipiona F oxysporum NB IV IV GU199332C10-07 Chipiona F oxysporum 1-8 V IV GU226826C8-08 Chipiona F oxysporum RB VI IV GU226825C4-17 Sanlucar de B F oxysporum 1-8 VII III GU199328C4-22 Chipiona F oxysporum 1-8 VIII III GU199329C10-14 Chipiona F oxysporum 1-8 VIII III GU226827C4-15 Chipiona F proliferatum RB IX V GU191842
R1 Marismas deLebrija F oxysporum 1-8 VIII III
R2 Chipiona F oxysporum 2 I IR4 Italy F oxysporum 4 III IIR8 Italy F oxysporum 1-8 VIII IIIFr South Africa F redolens mdash mdash mdashaR1 (race 1) R2 (race 2) R4 (race 4) R8 (Race 8) and Fr (Fusarium redolens)bMunicipal area as shown in Table 1cdetermined by query and comparison with sequence databases using TEF1-120572 gene sequencesdRace assignments using specific primers 2 Race 2 NB no band amplification 1-8 race 1 or race 8 RB retarded race 1 or race 8 band 4 race 4eAccession numbers of TEF1-120572 gene sequences
Sequences were edited and then blasted against theGenBank database (httpblastncbinlmnihgovBlastcgi)To match the TEF1-120572 gene in conjunction with GenBanktheFusarium-IDdatabase (httpfusariumcbiopsuedu)wasused This database is publicly available and containsvouchered and well-characterized sequences of Gibberellafujikuroi F oxysporum and F solani species [15] Accessionnumbers of TEF1-120572 regions from selected isolates are shownin Table 3
26 Phylogenetic Distance Tree Using TEF1-120572 Gene SequencesSequences were edited using Sequence Scanner v10 software(Applied Biosystems) and aligned to construct a phyloge-netic tree using the MEGA5 software [27] Evolutionaryhistory was inferred from the maximum likelihood methodbased on the Kimura 2-parameter model [28] The treewith the highest log-likelihood (minus14136427) is shown Thepercentage of trees in which the associated taxa clusteredtogether is shown next to the branches Initial tree(s) for
the heuristic search (Close-Neighbor-Interchange algorithm)were obtained automatically as follows When the number ofcommon sites was lt100 or less than one fourth of the totalnumber of sites the maximum parsimony method was usedotherwise the BIONJ method with a maximum compositelikelihood (MCL) distance matrix was used The tree wasdrawn to scale with branch lengths measured in the numberof substitutions per site The analysis involved 137 nucleotidesequences All positions containing gaps and missing datawere eliminated There were a total of 640 positions in thefinal dataset
27 Bacterial F redolens and Fod Race-Specific PCR AssaysBacterial 16S rDNA was used to control the presence andaccessibility of eubacterial DNA which could amplify falseRAPDmarkers For this purpose 704f and 1495r primers [29]were used Specific Fusarium redolens (Fr) primers redolens-F and redolens-R [1] were used to detect the presence of thispathogen in the population Fod races were determined using
Journal of Mycology 7
a multiplex PCR with race-specific primers (Ft3f IMP2fR81r R21r and R42r) designed by Chiocchetti et al [10]Primers were obtained from cVIRAL (Alcobendas MadridSpain) Negative and positive controls were included in allexperiments The bacterial isolate 911 (Collection of Dr MAviles University of Seville Spain) F redolens (provided byDr ET Steenkamp University of Pretoria Pretoria SouthAfrica) and the Fod race testers (provide by Dr JM MeleroCSIC Cordoba Spain) were used as positive controls for eachPCR assay
Twenty microliters of reaction volume containing75 ng 120583Lminus1 of genomic DNA 1x Biotools standard reactionbuffer 25mM ofMgCl
2 100 120583Mof dNTP (Biotools Madrid
Spain) and 1U of Biotools DNA polymerase (BiotoolsMadrid Spain) were used Primers were added as follows05 120583M each for eubacterial DNA detection [29] 05 120583M eachfor Fr detection [1] and 25 120583M each for race determination[10] Reactions were performed with a thermal cycler (GeneAmp PCR System 2700 Applied Biosystems) followingthe respective authorsrsquo protocols After amplification thereaction mixture was loaded onto a 15 agarose gel andphotographed under UV light as described previouslyThe expected amplification product sizes were 800 bp foreubacteria 386 bp for Fr and 295 564 and 1315 bp for Fodraces 18 race 2 and race 4 respectively Analyses wererepeated one with each monosporic culture from eachisolate
28 FusariumWilt Pathogenicity Test Determination of raceis based on the response of the different cultivars to aparticular isolate For this phenotypic assay at least oneisolate of each RAPD group was selected on the basis ofthe similarity index after the fingerprinting study [9 16 23]Pathogenicity test was performedwith five different carnation(D caryophyllus) cultivars (Reina NewElsyMayor SupremaandEilat summarized response inTable 2) in a greenhouse inSeville (Seville Spain) from June to August 2009 Plants wereprovided by Barberet amp Blanc (Murcia Spain) as bare-rootcuttings (8 to 12 true-leaf stages) Fungi were grown for 7 to10 days on AMAP (10 g Lminus1 agar 10 g Lminus1 malt extract (DifcoLe Pont de Claix France) and 2 g Lminus1 asparagine (DifcoLe Pont de Claix France)) plates at 25∘C Five mL of SDWwere added to the plates and the surface was scraped witha sterile spatula Inocula were filtered through two layers ofsterile gauze The concentration of conidia was determinedwith a hemocytometer and then diluted in SDW to givesuspensions of 106 conidia mLminus1 These suspensions wereused to inoculate carnation cuttings by root dipping for30min using 50 to 80mL per plant Controls were carriedout by dipping plant roots in sterile water Inoculated cuttingswere individually planted in pots containing peat fertilizedwith 05 g Lminus1 of Peterrsquos Foliar Feed (27 + 15 + 12 N + P
2O5+
K2O and micronutrients Scotts Heerlen the Netherlands)
and 05 g Lminus1 of Fertigreen (Bures Barcelona Spain) Theexperimental design involved five plants for each isolate andcultivar combination randomized within each cultivar
Disease severity was scored using the symptom severityscale described by Baayen and van der Plas [30] as follows
0 = asymptomatic plant (0 disease) 1 = weakly affectedplant (5) 2 = local base-stem symptoms (20) 3 =unilateral and well-developed symptoms (50) 4 = strongdisease symptoms throughout the plant (80) 5 = deadplant (100) Disease severity was monitored twice a weekAt each assessment the mean disease severity per pot wascalculated The standardized area under the disease progresscurve (AUDPC) was calculated by disease severity integratedbetween symptom onset and the final time of the assay anddivided by the total duration (days) of the epidemic in eachbioassayTherefore AUDPC data can range from 0 to 1 Highseverity was considered when AUDPC was higher than 045Moderate severity was considered when AUDPC data rangebetween 045 and 030 and low severity was considered whenAUDPC data range between 030 and 020 Pathogenicity testwas repeated twice Each test lasted three months
29 Statistical Analyses Data collected from the pathogenic-ity bioassaywere analyzedwith the Statgraphics Plus program(version 51 Statistical Graphics Corp Rockville MD) Datawere analyzed using one-way ANOVA The means werecompared using Tukeyrsquos test (119875 lt 005)
3 Results
31 Classification of Isolates Using RAPD Analysis All iso-lates were independently subjected to RAPD-PCR analysisemploying five random decamer primers In the preliminaryexperiments all the tested primers produced distinct andreproducible band profiles (Figure 2) Reproducible markerswere used in cluster analysis On the basis of a similaritymatrix a dendrogram using the UPGMA was constructed toillustrate the level of similarity among isolates (Figure 3(a))According to the patterns of all five primers isolates wereclassified into nine RAPDgroups ldquohaplogroupsrdquo correspond-ing to a similarity of more than 90 Each RAPD groupshowed high genetic homogeneity
Distance-based analyses of the RAPD groups are shownin Figure 3(a) Cluster analysis separated the Fod race testerswith an approximately 60 similarity index with a bootstrapsupport of 93 Seventy-three isolates (plus the Fod race 2tester) were placed in RAPD group I The RAPD group IIshowed one isolate (C9-10) while Fod race 4 was clusteredin RAPD group III (Figure 3(a)) Between RAPD groupsIII and VII seven isolates were clustered in three distinctgroups (RAPD groups IV V and VI) The RAPD group VIIshowed only one isolate (C7-14) Forty isolates were clusteredin RAPD group VIII together with the Fod races 1 and 8testers Finally ten isolates were outgroups (Figure 3(a)) andclustered in RAPD group IX F redolens was also clustered asan outgroup closer to RAPD group IX
32 PhylogenyUsing the TEF1-120572 Sequence Phylogenetic anal-ysis of the partial TEF1-120572 gene from all isolates (Figure 3(b))revealed five groups and F redolens as an outgroup The Fodrace 2 tester was found in TEF group I along with 74 isolates(the same as RAPD groups I and II) Race 4 tester as in RAPDanalysis was the only one to cluster in TEF group II Races 1and 8 testers and 41 isolates (the same as RAPD groups VII
8 Journal of Mycology
R1 R2 R4 R8 FROPB-01
R1 R2 R4 R8 FROPE-11
R1 R2 R4 R8 FROPE-16
R1 R2 R4 R8 FROPH-19
R1 R2 R4 R8 FROPH-20
1000
750
500
250
2000
1500
(bp)
Figure 2 Random amplified polymorphisms DNA (RAPD) patterns of the different Fod race testers and one F redolens obtained with fiveprimers Left molecular weight marker (1 kb DNA ladder) Races belonging to R1 Fod race 1 R2 Fod race 2 R4 Fod race 4 R8 Fod race 8and FR Fusarium redolens
and VIII) were clustered in TEF group III Isolates clusteredin the RAPD groups IV V and VI (Figure 3(a)) were in TEFgroup IV (Figure 3(b)) while TEF group V comprised thesame ten isolates as RAPD group IXThe TEF1-120572 gene regionfrom C4-15 (a representative isolate from RAPD group IX)was subjected to a BlastN enquiry inGenBank which showedthat this isolate had high sequence similarity to F proliferatum(a single mismatch) and had 100 similarity with isolate165PGF (Accession no GU066714)
33 Bacterial F redolens and Fod Race-Specific PCR AssaysRace-correlated amplifications from 9545 of the isolateswere obtained using race-specific primers as described byChiocchetti et al [10] For the 132 isolates Forty-three andseventy of the isolates produced a 295 bp (diagnostic for race1 or race 8) or a 564 bp (specific for race 2) amplificationproduct respectively The 1315 bp amplification productcorresponding to race 4 was never detected in the sampledisolates Thirteen isolates produced race 1 or race 8 bandwith retarded electrophoretic mobility while six isolatesdid not show any amplification signalband All isolatesare classified in Table 1 by race using race-specific primersNeither F redolens nor eubacteria were detected among thetested isolates Race characterization and presence of specificamplification bands for F redolens (Figure 4(b)) eubacteria(Figure 4(c)) and certain isolates (Figure 4(a)) are shown inFigure 4
Isolates C6-14 C6-15 andC7-02 (fromRAPDgroup I andTEF group I where Fod race 2 tester is included) did notshow a race-specific band Furthermore seven isolates weredistributed in three RAPD groups (RAPD groups IV V andVI) that were clustered in the same TEF group (TEF groupIV) RAPD group IV (three isolates) did not produce anyrace-specific band RAPD group V (only one isolate) showeda typical race 1- or race 8-specific band RAPDgroupVI (threeisolates) showed an unusual race 1 or race 8 specific bandwithretarded electrophoretic mobility Similarly isolates fromRAPD group IX (all included in the TEF group V) showedrace 1 or race 8 band with retarded electrophoretic mobility
(see isolate C4-15) Certain isolates from those RAPD groupsare shown in Figure 4(a)
Isolates C10-07 (RAPD group V) C8-08 (RAPD groupVI) and C4-15 (RAPD group IX) and the Fod race 8 testershowed an amplification product (race 1 or race 8 band withretarded electrophoretic mobility sim295 bp) only with therace-specific primers Ft3R81 As expected sequencing ofthis amplicon (Figure 5) showed that it included the 31015840 endof Fot1 transposon and Fot1-flanking genomic region (Fot1-37 GenBank accession X64799) similar to that observed inthe Fod race 8 tester Moreover the difference in mobilityof the amplified bands from isolates C4-15 and C8-08 couldbe explained by an additional sequence of 17 nucleotides(CAGGGGGGGTCGGTTAC) located downstream to the 31015840inverted terminal repeat of the Fot1 transposon which wasnot observed in the Fod race 8 tester
As complementary data to determine whether the Fot-1 transposon was moved or the primer target sequencesmodified Southern blot analyses using a Fot1-specific probewere performed with two isolates (C6-14 and C6-15) withoutspecific amplification but clustered near the Fod race 2tester by both phylogenetic analyses The restriction patternconfirmed that these two isolates had the same restrictionpattern as the Fod race 2 tester therefore confirming that theyindeed belonged to Fod race 2 (data not shown)
34 Pathogenicity Assay Given the high number of isolatesa pathogenicity test was conducted with a subset of thepopulation (Table 3) using RAPD analysis as the referenceFor this purpose at least one representative isolate fromeach RAPD groupwas selected Cultivars ldquoSupremardquo ldquoReinardquoand ldquoEilatrdquo were susceptible to isolates C5-20 C6-15 C6-25and C9-10 and race 2 tester but resistant to others (Table 4)But only ldquoEilatrdquo showed moderate severity when inoculatedwith race 4 tester Moreover the cultivar ldquoReinardquo showedlower severity values than cultivars ldquoSupremardquo and ldquoEilatrdquoThe opposite was found with the cultivar ldquoNew Elsyrdquo whichwas susceptible to isolates C4-17 C4-22 and C10-14 and torace 1 tester but not race 8 tester This cultivar could be
Journal of Mycology 9
C10-03C10-06C9-24C10-02C9-11C9-18C9-20C9-21C8-20C8-22C8-15C8-19C8-24C9-02C9-03C9-04C7-24C7-25C7-22C7-23C7-14C7-16C7-18C7-21C8-04C8-05C8-02C8-03C8-06C8-07C8-10C8-11C5-01C5-16C4-10C4-19C4-01C4-02C4-03C4-04C10-17C11-02C11-03C11-04C6-07C6-08C6-04C6-06C5-19C5-20C5-24C6-03C6-13C6-15C6-09C6-10C7-02C7-04C7-05C7-10C7-06C7-11C6-17C7-03C10-10C5-21C6-16C6-14C6-24C6-25C6-21C8-01Fod race 2C9-10Fod race 4C5-22C6-01C5-23C10-07C10-04C8-08C8-09C4-17C4-21C4-22C5-06Fod race 1Fod race 8C9-17C4-23C5-04C10-11C10-15C10-16C8-21C9-14C9-19C7-07C7-08C5-07C4-06C4-13C10-24C10-14C10-20C9-07C9-08C9-25C10-08C6-11C6-12C5-09C5-25C4-18C5-03C5-05C5-08C7-09C8-13C6-23C7-01C8-14C8-23C9-05C9-06
C7-20C9-15C7-12C7-13C10-05C10-13C4-14C4-15C4-16C4-20
RAPD group I
RAPD group II-IIIRAPD group IVRAPD group VRAPD group VIRAPD group VII
RAPD group VIII
RAPD group IX
75
75
88
100
100
99
82
86
82
93
100
0102030405
F redolens
(a)
C11-02C11-03C10-17C10-10C10-06C10-03Fod race 2C10-02C9-24C9-21C9-20C9-18C9-11C9-10C9-04C9-03C9-02C8-22C8-20C8-19C8-15C8-11C8-10C8-07C8-06C8-05C8-04C8-03C8-02C8-01C7-25C7-24C7-23C7-21C7-18C7-17C7-16C7-14C7-11C7-10C7-06C7-05C7-04C7-03C7-02C6-25C6-24C6-21C6-17C6-16C6-15C6-14C6-13C6-10C6-09C6-08C6-07C6-06C6-04C5-24C5-21C5-20C5-19C5-16C5-01C4-19C4-10C4-04C4-03C4-01C4-02C11-04
C7-22C6-03
Fod race 4C4-06C4-13C4-17C4-18C4-21C4-22C4-23C5-03C5-04C5-05C5-06C5-07C5-08C5-09C5-25C6-11C6-12C6-23C7-01C7-07C7-08C7-09C8-13C8-14C8-21C8-23C9-05C9-06C9-07C9-08C9-14C9-17C9-19C9-25C10-08C10-11C10-14C10-15C10-16C10-20C10-24Fod race 1Fod race 8
C5-22C5-23C6-01C8-08C8-09C10-04C10-07
C4-14C4-15C4-16C4-20C7-12C7-13C7-20C9-15C10-05C10-13
Tef group I
Tef group II
Tef group III
Tef group IV
Tef group V
99
98
62
92
99
001
F redolens
(b)
Figure 3 Phylogenetic analyses using molecular tools (a) cluster analysis of the RAPD data was performed by the UPGMAmethod RAPDgroups are shown on the right of the tree (b) Most likelihood trees were generated by TEF1-120572 gene sequencing Evolutionary history wasinferred from themaximum likelihoodmethodbased on theKimura 2-parametermodelThe treewith the highest log-likelihood (minus14136427)is shown TEF groups are shown on the right of the tree The numbers on the branches are values from bootstrap analysis in percentageswith 100 replications for both types of phylogenetic analyses
10 Journal of Mycology
1250
1000
750
500
250
500
250
1000
750
500
250
20 23 01 15 25 08 07 14 10 FR 91115 17 22M (pb)
C4 C5 C6 C10C8 C9
R1 R2 R4 R8
Testers
(a)
(b)
(c)
Figure 4 Specific Fod-race primers showing different amplification products Agarose gel electrophoresis (15) of PCR products from thegenomic DNA of 12 representative RAPD group isolates four Fod testers and one Fusarium redolens isolate (a) Multiplex PCR in whichfive primers were mixed in the same reaction tube where combinations of Ft3R81 Ft3R21 and Ft3R42 resulted in bands of 295 (race18) 564 (race 2) and 1315 bp (race 4) respectively bands with retarded electrophoretic mobility are shown with an arrow (b) MultiplexPCR products obtained with the LSU (not shown) and Fusarium redolens-specific primers with a resulting band of 386 bp (c) PCR of theeubacterial primers 704f and 1495r where a 900 bp product was not amplified Fod testers R1 (race 1) R2 (race 2) R4 (race 4) and R8 (race 8)Fr Fusarium redolens and 911 (bacterial tester) M molecular size marker (1 kb ladder Biotools) sizes (base pairs) are indicated on the left
AAATAGATCGATGGATTTTCTGAGTCTTGCAGATGGGTCGGTTACCAGGGGGGGTCGGTTACATGGGTGCTTGACTTAAATAGATCGATGGATTTTCTGGGTCTTGCAGATGGGTCGGTTACCAGGGGGGGTCGGTTACATGGGTGCTTGACTTAAATAGATCGATGGATTTTCTGGGTCTTACAGATGGGTCGGTTAC ATGGGTGCTTGACTTAAATAGATCGATGGATTTTCTGAGTCTTGCAGATGGGTCGGTTAC ATGGGTGCTTGACTT
AAATAGATCGATGGATTTTCTGAGTCTTGCAGGTGGGTCGGTTACCAGGGGGGGTCGGTTACATGGGTGCTTGACT
3998400-3998400-3998400-3998400-
3998400-
-5998400-5998400-5998400-5998400
-5998400
Isolate C4-15Isolate C8-08Isolate C10-07
Additional sequence
Isolate Fod race8 tester
Fot1-37 (terminal sequence)
Figure 5 Aligned DNA sequences of the Fot1 final portion and the inverted terminal repeat (ITR) from F melonis Fod race 8 (tester) andthree isolates from our population using primers Ft3R81 A sequence complementary to the Fot1 primer in the ITR is displayed in the boxThe perfect direct repeats in the ITR are given in bold
used to differentiate between races 1 and 8 Cultivar ldquoNewElsyrdquo considered resistant to race 2 in our assay conditionsshowed a moderate severity for C6-15 and C6-25 isolatesand a low severity for C5-20 and C9-10 Isolate C6-15 wasconfirmed to belong to race 2 as expected from the results ofthe phylogenetic analyses (Figure 3) The isolates C5-23 C6-01 C8-08 and C10-07 were not pathogenic to any cultivaralthough C10-07 isolate showed 019 AUDPC value in ldquoNewElsyrdquo In the cultivar ldquoMayorrdquo these four isolates did not show
severity as opposed to the other isolates and Fod races 1 and 2testers This last result agrees with data supported in Table 2F proliferatum (isolate C4-15) produced low disease severityin cultivars ldquoEilatrdquo and ldquoNew Elsyrdquo although severity wassignificantly higher than in the control (data not shown)
35 Fod Race Frequency and Prevalence Taking into accountall the data the frequency and prevalence of each race in thetested area were calculated (Table 5) Regarding frequency
Journal of Mycology 11
Table 4 Standardized AUDPC for carnation cultivars
RAPDGroup IsolatesTesters Carnation cultivars
Suprema Reina New Elsy Eilat MayorI C5-20 056 (002) a 034 (006) ab 023 (004) bc 067 (000) a 064 (002) aI C6-15 061 (006) a 043 (005) a 031 (002) b 075 (002) a 064 (001) aI C6-25 064 (003) a 045 (004) a 031 (007) b 074 (001) a 062 (001) aII C9-10 054 (003) a 047 (003) a 021 (003) bc 065 (002) a 061 (003) aIV C6-01 007 (002) bcd 004 (002) c 010 (001) cd 005 (002) c 003 (001) bV C5-23 005 (001) cd 004 (001) c 013 (002) cd 005 (005) c 002 (001) bVI C10-07 018 (006) b 007 (001) c 019 (004) bc 010 (001) c 001 (000) bVII C8-08 009 (002) bc 012 (004) bc 014 (002) cd 005 (001) c 008 (003) bVIII C4-17 000 (000) d 000 (000) c 056 (004) a 002 (001) c 063 (002) aVIII C4-22 001 (001) cd 002 (001) c 061 (002) a 002 (001) c 066 (002) aIX C10-14 000 (000) d 002 (001) c 058 (000) a 002 (001) c 055 (008) aVIII R1 001 (001) d 003 (001) c 057 (002) a 004 (001) c 054 (004) aI R2 050 (006) a 037 (004) a 013 (004) cd 063 (002) a 059 (003) aIII R4 000 (000) d 013 (008) c 006 (002) d 041 (011) b 006 (003) bVIII R8 006 (001) bcd 005 (004) c 017 (001) bc 001 (001) c 007 (005) bEach cultivar was infested using a root-dipping technique in a solution with 106 conidia mLminus1 from each isolate Testers isolates R1 Fod race 1 R2 Fod race2 R4 Fod race 4 and R8 Fod race 8 For each cultivar (columns) numbers with the same letter were not significantly different according to Tukeyrsquos test at119875 lt 005 In parentheses SE of the mean (119899 = 5)
Table 5 Frequency and prevalence of each race by PCR using specific primers and TEF1-120572 gene
RacesSpecific primers TEF1-120572
Frequency Prevalencea Groups Frequency PrevalenceIb IbTi F FtF Ip IpTi F FtF
Race 1-8 42 318 21 389 III 41 311 20 370Race 2 71 538 31 574 I 74 561 32 593Retardedband 13 98 V (Fp) 10 76 6 111aPrevalence was expressed as the ratio ldquonumber of farms in which a specific race was foundtotal farm numbersrdquo as a percentageIb Isolates with race-specific amplified bandIp Isolates using TEF groupingTi Total isolates (119899 = 132)F Numbers of farms in which a specific race F proliferatum or TEF group was foundtF Total farms (119899 = 54)Fp Fusarium proliferatum
using Fod-specific primers 318 (41 isolates plus C10-07)and 538 (71 isolates) of the total population belonged torace 1 or race 8 and race 2 respectively Thirteen of the 132isolates showed a retarded band where ten of these could beascribed to F proliferatum RAPD-PCR and TEF1-120572 analysisshowed similar results The TEF1-120572 analyses identified 311(41 isolates) and 561 (71 isolates plus C6-14 C6-15 and C7-02) of the total population to belong to race 1 or race 8 andrace 2 respectively
In this study 54 farms in 25 zones (Table 1) were sampledAnalysis with specific primers showed a prevalence of 389and 574 for race 1 or race 8 and race 2 respectivelyPhylogenetic analysis showed a different prevalence 370and 593 for race 1 or race 8 and race 2 respectively
Fod race 2 and race 1 or race 8 were located together in10 zones but their concurrent presence was found on onlyone farm (11b Table 1) Moreover 11 zones displayed only Fodrace 2 while 4 zones had only Fod races 1 or 8 indicating
that Fod race 2 was spatially more widespread than Fod race1 or race 8 in the studied area The presence of F proliferatumwas independent from that of pathogenic Fod races (farms 4b10c 11c and 22a) Isolates without specific band amplificationgrouping in RAPD group IV (C5-22 C5-23 and C6-01) werefound on the same farm (9a) together with race 1 or race 8isolate (C5-25) Isolate C10-07 which showed a specific Fodrace 1 or race 8 amplification was found on a farm coexistingwith F proliferatum (22a) RAPD group VI was identified ontwo farms (7f 17a) coexisting with Fod race 2 isolates Isolateswithout the race 2-specific amplicon (C6-14 C6-15 and C7-02) were found on the same farm (7c)
4 Discussion
41 Racial Frequency andPrevalence in the Studied PopulationWe conclude that Fod race 2 was the most frequent andprevalent in the study area followed by race 1 or race 8
12 Journal of Mycology
which is consistent with another study in the same region[5] However the previous report detected a much lowerfrequency of race 1 than that reported here for 1 or 8 EarlierFod race diversity reports in other Spanish regions haveconfirmed frequent and widespread distribution of Fod race2 in carnation crops [9 31] However race 8 has not beendocumented in Spain [5 9 31] Genetic variation studies inthis region have previously shown a race structure similar tothat encountered worldwide [2 3 32] Based on these datacarnations cultivars with resistance to race 2 and races 1 and8 are the most recommended in the studied area
42 Molecular Tools RAPD-PCR Sequencing of the TEF1-120572Gene and Diagnosis of the Fod Race-Specific Primers Amongthe diagnostic protocols for Fusarium species PCR assaysare considered to be one of the most rapid and reliablemethods [33] RAPD fingerprinting and TEF1-120572 sequenceanalyses showed strikingly similar and well-resolved cladesfor Fod races both approaches complementing each otherSeveral studies have applied RAPD fingerprinting to identifyall major races of Fod present in other countries [4 11]Regarding sequence data the TEF1-120572 gene has been resolvedas the most phylogenetically reliable molecular marker ofthe Fusarium genus relative to the 120573-tubulin gene ITSregions and CYP51C gene [14] Our study demonstratedthat TEF1-120572 could be used as a molecular marker to groupFod isolates into races this method taking less time andbeing more reliable than RAPD-PCR Indeed a previousreport revealed a higher level of homoplasy shown by RAPD-based phylogeny than the TEF1-120572 and mtSSU rDNA genesequencing data using F oxysporum from maize [12] Thehigh genetic homogeneity within the races found in thispopulationwas consistentwith that reported in earlier studies[3 32]
We propose that PCRwith specific primers whose ampli-fication is related with the Fot1-transposable element [10] isnot sufficient to confirm the presence of Fod in a given areadue to differences in the target genomic sequences Indeedthese markers showed variable specificity in our populationas described in a previous study [5] As an example 13 isolatesshowed a retarded Fod race 1 or race 8 band when the specificprimerswere usedMoreover Fot1 elements exhibit a very lowlevel of polymorphism in the Fusarium oxysporum complex[34] Our data using race-specific primers showed that Fodrace 8 (and probably Fod race 1) has 17 nucleotides less inthis region than otherFusarium species A possible horizontaltransfer of Fot1 transposon between Fusarium species [34]could create a deletion in this region differentiating isolatesrelated to Fod from the others (ie Fusariumproliferatum andF oxysporum isolate C8-08)
Although molecular techniques were reliable they mustbe validated with a phenotypic pathogenicity test Despitethe reasonable degree of disease severity found in thepathogenicity test the assay showed results that were notexpected for example susceptible responses in New Elsyand Eilat to race 2 and race 4 respectively Pathogenicitytests conducted in semicontrolled conditions by Ben-Yephetand Shtienberg [35] indicated that the carnation response toFod is substantially influenced by environmental conditions
(mainly solar radiation temperature and substrate) whichcould explain the observed results
43 Pathogenicity Test In our pathogenicity test the isolateC6-15 (which did not show a Fod race 2-specific band)behaved like Fod race 2 and was as virulent as other race2 isolates such as C6-14 and C7-02 Southern blot analysis(using Fot1 transposon as the probe) showed that two isolatesgenerated the same restriction pattern as the Fod race 2 tester(data not shown [10]) suggesting that the absence of specificamplification was not due to a movement of Fot1 but due toa change in the target sequences of these primers Thus wepropose that the presence of these isolates (C6-14 C6-15 andC7-02) in the population could form a possible Fod race 2subgroup To define subgroups within Fod race 2 an extensivevirulence study of isolates would have to be carried out
Isolates selected from the seven clustered inRAPDgroupsIV V and VI and TEF group IV did not show severity in anyof the carnation cultivars tested These isolates recovered ondifferent farms from wilted carnations were characterized asF oxysporum byTEF1-120572 sequencingTheymay be saprophyticF oxysporum possibly associated with the carnation rhizo-sphere as found in previous studies [4]
Ten isolates (76 of the collection) belonging to F pro-liferatum (RAPD group IX and TEF group V) were found tobe nonpathogenic in our phenotypic assay In a similar studyseven nonpathogenic isolates of F proliferatum obtainedfrom carnation crops in Italy Israel and theNetherlandswereclearly recognized on the basis of their RAPD fingerprint[4] However Aloi and Baayen [2] obtained 11 isolates of Fproliferatum belonging to a distinct vegetative compatibilitygroups from Fod which were associated with the basal rot ofcarnation This fungus has also been identified as a pathogenin asparagus [36] and as an opportunistic fungus in wheat[37] and palms [13]
5 Conclusions
In conclusion population characterization showed that Fodrace 2 was widely distributed along the north-west of Cadizfollowed by race 1 or race 8 Molecular techniques suchas TEF1-120572 sequencing or RAPD-PCR allowed (mainly theformer) a better identification and clustering of different Fodraces than using Fod race-specific primers Indeed isolatesfailing to generate an amplification signal with Fod race-specific primers may indicate the presence of a Fod race 2subgroup in this area
Conflict of Interests
The authors declare that there is no conflict of interestsregarding the publication of this paper
Acknowledgments
This researchwas supported byGrants from theMinisterio deEducacion y Ciencia (AGL2005-08137-C03-02) Consejerıade Innovacion Ciencia y Empresa de la Junta de Andalucıa
Journal of Mycology 13
(P06-AGR-02313) and the Ministerio de Ciencia e Inno-vacion (AGL2008-05414-C03-01) of SpainThe authors thankQ Migheli for critically reading the manuscript and mak-ing valuable suggestions prior to submission and Drs ETSteenkamp and J M Melero-Vara for providing F redolensand reference strains of Fod The authors also thank MLCastillo and S Castillo for their excellent technical assistance
References
[1] M Bogale B D Wingfield M J Wingfield and E T Steen-kamp ldquoSpecies-specific primers for Fusarium redolens and aPCR-RFLP technique to distinguish among three clades ofFusarium oxysporumrdquo FEMS Microbiology Letters vol 271 no1 pp 27ndash32 2007
[2] C Aloi and R P Baayen ldquoExamination of the relationshipsbetween vegetative compatibility groups and races in Fusariumoxysporum f sp dianthirdquo Plant Pathology vol 42 no 6 pp 839ndash850 1993
[3] R P Baayen F van Dreven M C Krijger and C WaalwijkldquoGenetic diversity in Fusarium oxysporum f sp dianthi andFusarium redolens f sp dianthirdquo European Journal of PlantPathology vol 103 no 5 pp 395ndash408 1997
[4] Q Migheli E Briatore and A Garibaldi ldquoUse of random amp-lified polymorphic DNA (RAPD) to identify races 1 2 4 and 8of Fusarium oxysporum f sp dianthi in Italyrdquo European Journalof Plant Pathology vol 104 no 1 pp 49ndash57 1998
[5] AM Prados-LigeroM J Basallote-Ureba C J Lopez-Herreraand JMMelero-Vara ldquoEvaluation of susceptibility of carnationcultivars to Fusarium Wilt and determination of Fusariumoxysporum f sp dianthi races in Southwest SpainrdquoHortSciencevol 42 no 3 pp 596ndash599 2007
[6] Anonymous Anuario de Estadıstica Agroalimentaria Cap2020723 Ministerio de Medio Ambiente y Medio Rural yMarino Madrid Spain 2008
[7] J A Navas BecerraApuntes sobre el cultivo del clavel Consejerıade Agricultura y Pesc Junta de Andalucıa Sevilla Spain 1988
[8] AGarcıa RuizM deCaraM Santos and J C Tello ldquoFusariumwilt of carnation in northwestern coast of Cadiz (Spain)rdquoBoletın de Sanidad Vegetal vol 35 pp 317ndash328 2009
[9] J L Andres M J Vicente J L Cenis et al ldquoGenetic and path-ogenic variation of Fusarium oxysporum f sp dianthi in SpainrdquoBoletın de Sanidad Vegetal Plagas vol 27 pp 249ndash257 2001
[10] A Chiocchetti I Bernardo M Daboussi et al ldquoDetection ofFusarium oxysporum f sp dianthi in Carnation tissue by PCRamplification of transposon insertionsrdquo Phytopathology vol 89no 12 pp 1169ndash1175 1999
[11] S Manulis N Kogan M Reuven and Y Ben-Yephet ldquoUse ofthe RAPD technique for identification of Fusarium oxysporumf sp dianthi from carnationrdquo Phytopathology vol 84 no 1 pp98ndash101 1994
[12] K OrsquoDonnell H C Kistlerr E Cigelnik and R C Ploetz ldquoMul-tiple evolutionary origins of the fungus causing panama diseaseof banana Concordant evidence from nuclear and mitochon-drial gene genealogiesrdquo Proceedings of the National Academy ofSciences of the United States of America vol 95 no 5 pp 2044ndash2049 1998
[13] M L Elliott E A Des Jardin K OrsquoDonnell D M Geiser N AHarrison and T K Broschat ldquoFusarium oxysporum f sp pal-marum a novel forma specialis causing a lethal disease of
syagrus romanzoffiana and Washingtonia robusta in FloridardquoPlant Disease vol 94 no 1 pp 31ndash38 2010
[14] D Fernandez-Ortuno E Loza-Reyes S L Atkins and B AFraaije ldquoThe CYP51C gene a reliable marker to resolve inters-pecific phylogenetic relationships within the Fusarium speciescomplex and a novel target for species-specific PCRrdquo Interna-tional Journal of Food Microbiology vol 144 no 2 pp 301ndash3092010
[15] D M Geiser M D M Jimenez-Gasco S Kang et alldquoFUSARIUM-ID v 10 a DNA sequence database for identify-ing Fusariumrdquo European Journal of Plant Pathology vol 110 no5-6 pp 473ndash479 2004
[16] N Shafagh M F Rastegar and B Jafarpour ldquoPhysiological raceand genetic diversity determination of Fusarium oxysporum fsp melonis by differential hosts and molecular marker RAPDin Northern and Razavi Khorasan provincesrdquo Research Journalof Biological Sciences vol 3 pp 790ndash793 2008
[17] F M Alves-Santos L Cordeiro-Rodrigues J M Sayagues et alldquoPathogenicity and race characterization of Fusarium oxys-porum f sp phaseoli isolates from Spain and Greecerdquo PlantPathology vol 51 no 5 pp 605ndash611 2002
[18] A Garibaldi and M L Gullino ldquoFusarium wilt of carnationpresent situation problems and perspectivesrdquo Acta Horticul-turae vol 216 pp 45ndash54 1987
[19] O D Dhingra and J B Sinclair Basic Plant Pathology MethodsLewis Boca Raton Fla USA 2nd edition 1995
[20] L L Singleton J D Mihail and C M RushMethods for Rese-arch on Soil-Borne Phytopathogenic Fungi American Phytopa-thological Society Press St Paul Minn USA 1992
[21] A Cassago R A Panepucci A M T Baiao and F Henrique-Silva ldquoCellophane basedmini-prepmethod forDNAextractionfrom the filamentous fungus Trichoderma reeseirdquo BMC Micro-biology vol 2 article 1 2002
[22] C Carbonell D Cifuentes J Tello and J L Cenis ldquoDifferen-tiation of Fusarium oxysporum f sp lycopersici and Fo f spradicis-lycopersici and its detection in plant by RAPDmarkersrdquoBoletın de Sanidad Vegetal Plagas vol 20 pp 919ndash926 1994
[23] D J Vakalounakis and G A Fragkiadakis ldquoGenetic diversity ofFusarium oxysporum isolates from cucumber differentiation bypathogenicity vegetative compatibility and RAPD fingerprint-ingrdquo Phytopathology vol 89 no 2 pp 161ndash168 1999
[24] Z Q Zhou and Y N Li ldquoThe RAPD evidence for the phylo-genetic relationship of the closely related species of cultivatedapplerdquo Genetic Resources and Crop Evolution vol 47 no 4 pp353ndash357 2000
[25] W Link C Dixkens M Singh M Schwall and A E Melch-inger ldquoGenetic diversity in European and Mediterranean fababean germ plasm revealed by RAPD markersrdquo Theoretical andApplied Genetics vol 90 no 1 pp 27ndash32 1995
[26] YVanDePeer andRDeWachter ldquoTreecon forwindows a soft-ware package for the construction and drawing of evolutionarytrees for the microsoft windows environmentrdquo Bioinformaticsvol 10 no 5 pp 569ndash570 1994
[27] S Kumar J Dudley M Nei and K Tamura ldquoMEGA a biol-ogist-centric software for evolutionary analysis of DNA andprotein sequencesrdquo Briefings in Bioinformatics vol 9 no 4 pp299ndash306 2008
[28] M Kimura ldquoA simple method for estimating evolutionary ratesof base substitutions through comparative studies of nucleotidesequencesrdquo Journal ofMolecular Evolution vol 16 no 2 pp 111ndash120 1980
14 Journal of Mycology
[29] V Bianciotto C Bandi D Minerdi M Sironi H V Tighy andP Bonfante ldquoAn obligately endosymbiotic mycorrhizal fungusitself harbors obligately intracellular bacteriardquo Applied andEnvironmental Microbiology vol 62 no 8 pp 3005ndash3010 1996
[30] R P Baayen and C H van der Plas ldquoLocalization ability latentperiod andwilting rate in eleven carnation cultivars with partialresistance to Fusarium wiltrdquo Euphytica vol 59 no 2-3 pp 165ndash174 1992
[31] V Cebolla C Monton P Carrasco and A Rodrıguez La imp-ortancia de las razas I y II de Fusarium oxysporum fsp dianthien los suelos espanoles Jornadas sobre Patologıa Vegetal Mono-grafıa INIA48Ministerio deAgricultura Pesca yAlimentacion(ed) Madrid Spain 1983
[32] G Lori V Edel-Hermann N Gautheron and C AlabouvetteldquoGenetic diversity of pathogenic and nonpathogenic popula-tions of Fusarium oxysporum isolated from carnation fields inArgentinardquo Phytopathology vol 94 no 6 pp 661ndash668 2004
[33] B Lievens M Rep and B P H J Thomma ldquoRecent develop-ments in the molecular discrimination of formae speciales ofFusarium oxysporumrdquo Pest Management Science vol 64 no 8pp 781ndash788 2008
[34] M J Daboussi J Daviere S Graziani andT Langin ldquoEvolutionof the Fot1 transposons in the genus Fusarium discontinuousdistribution and epigenetic inactivationrdquoMolecular Biology andEvolution vol 19 no 4 pp 510ndash520 2002
[35] Y Ben-Yephet and D Shtienberg ldquoEffects of the host the path-ogen the environment and their interactions on fusarium wiltin carnationrdquo Phytoparasitica vol 25 no 3 pp 207ndash216 1997
[36] E Yergeau M Filion V Vujanovic andM St-Arnaud ldquoA PCR-denaturing gradient gel electrophoresis approach to assess Fus-arium diversity in asparagusrdquo Journal of Microbiological Meth-ods vol 60 no 2 pp 143ndash154 2005
[37] S-I Kwon C D Von Dohlen and A J Anderson ldquoGene seq-uence analysis of an opportunistic wheat pathogen an isolate ofFusarium proliferatumrdquoCanadian Journal of Botany vol 79 no9 pp 1115ndash1121 2001
Submit your manuscripts athttpwwwhindawicom
Hindawi Publishing Corporationhttpwwwhindawicom Volume 2014
Anatomy Research International
PeptidesInternational Journal of
Hindawi Publishing Corporationhttpwwwhindawicom Volume 2014
Hindawi Publishing Corporation httpwwwhindawicom
International Journal of
Volume 2014
Zoology
Hindawi Publishing Corporationhttpwwwhindawicom Volume 2014
Molecular Biology International
GenomicsInternational Journal of
Hindawi Publishing Corporationhttpwwwhindawicom Volume 2014
The Scientific World JournalHindawi Publishing Corporation httpwwwhindawicom Volume 2014
Hindawi Publishing Corporationhttpwwwhindawicom Volume 2014
BioinformaticsAdvances in
Marine BiologyJournal of
Hindawi Publishing Corporationhttpwwwhindawicom Volume 2014
Hindawi Publishing Corporationhttpwwwhindawicom Volume 2014
Signal TransductionJournal of
Hindawi Publishing Corporationhttpwwwhindawicom Volume 2014
BioMed Research International
Evolutionary BiologyInternational Journal of
Hindawi Publishing Corporationhttpwwwhindawicom Volume 2014
Hindawi Publishing Corporationhttpwwwhindawicom Volume 2014
Biochemistry Research International
ArchaeaHindawi Publishing Corporationhttpwwwhindawicom Volume 2014
Hindawi Publishing Corporationhttpwwwhindawicom Volume 2014
Genetics Research International
Hindawi Publishing Corporationhttpwwwhindawicom Volume 2014
Advances in
Virolog y
Hindawi Publishing Corporationhttpwwwhindawicom
Nucleic AcidsJournal of
Volume 2014
Stem CellsInternational
Hindawi Publishing Corporationhttpwwwhindawicom Volume 2014
Hindawi Publishing Corporationhttpwwwhindawicom Volume 2014
Enzyme Research
Hindawi Publishing Corporationhttpwwwhindawicom Volume 2014
International Journal of
Microbiology
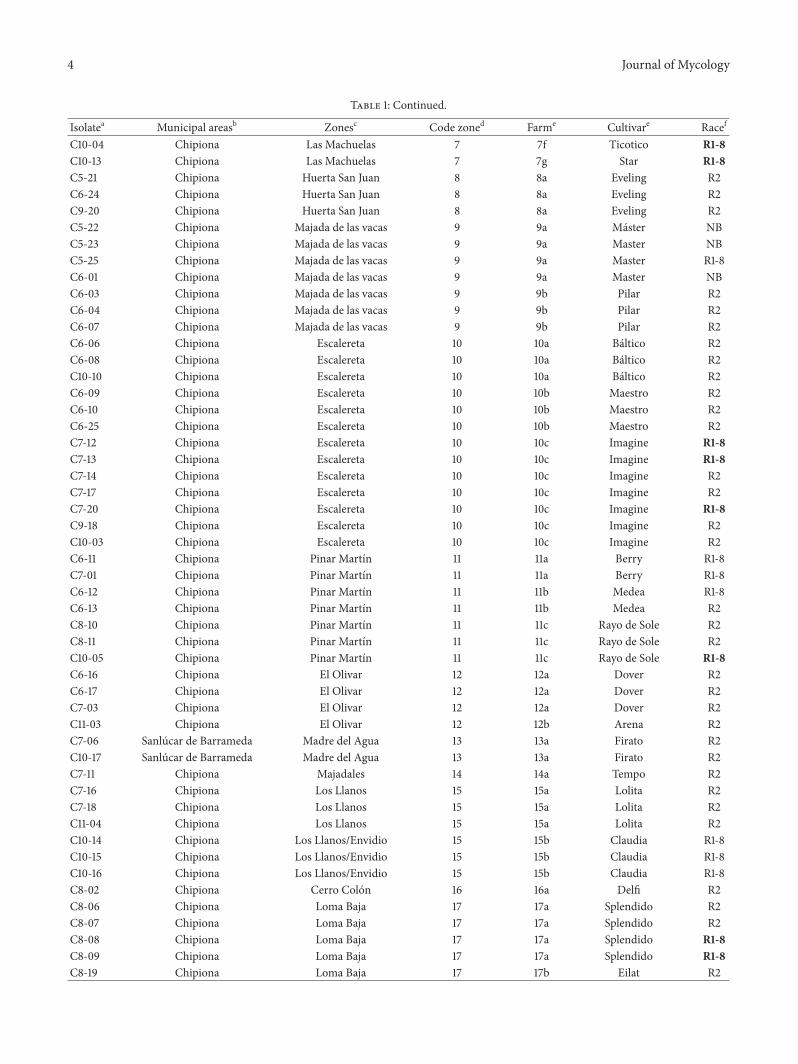
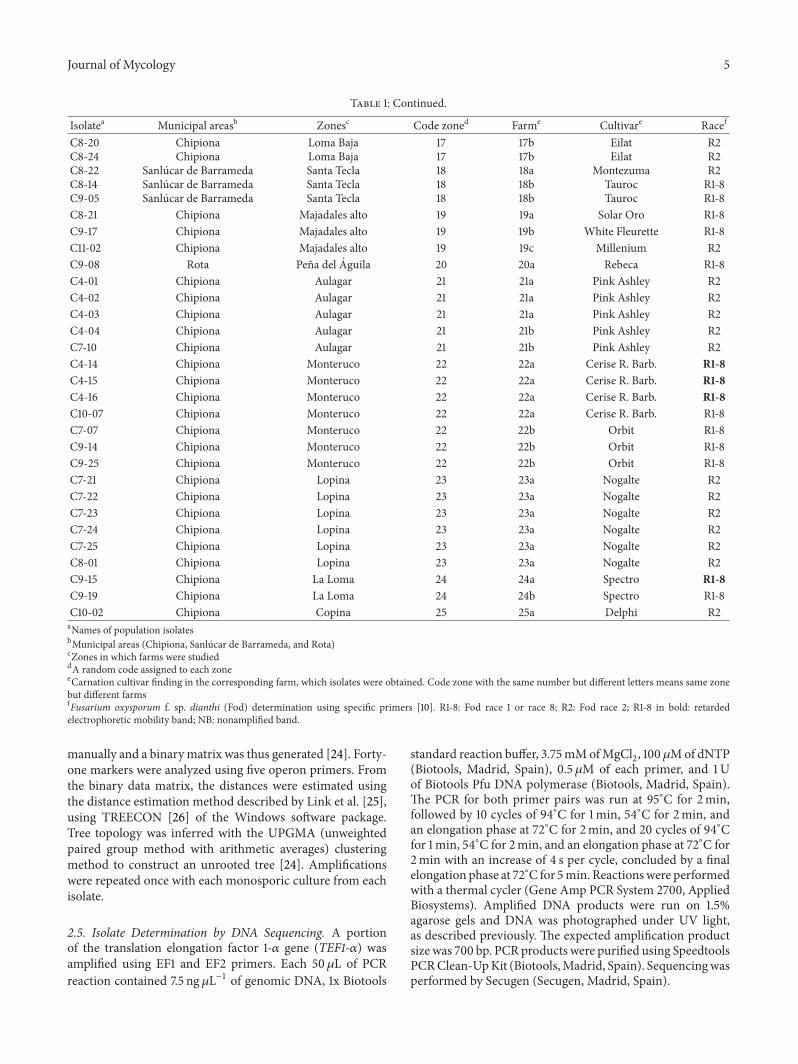
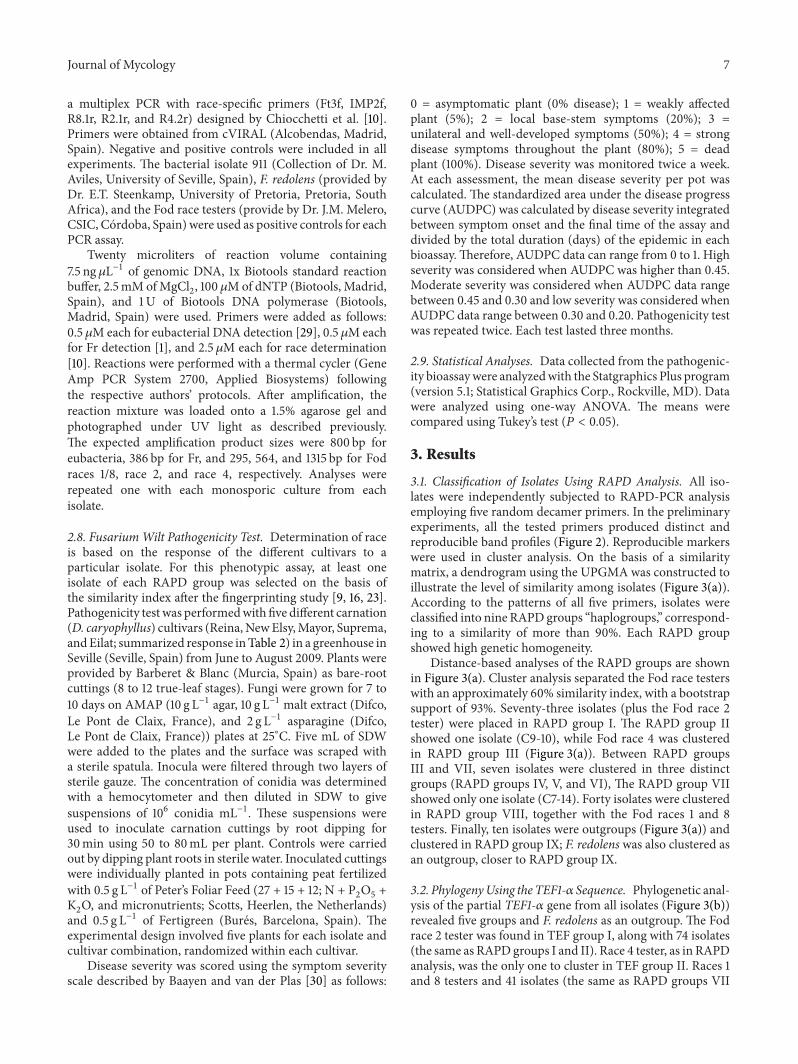
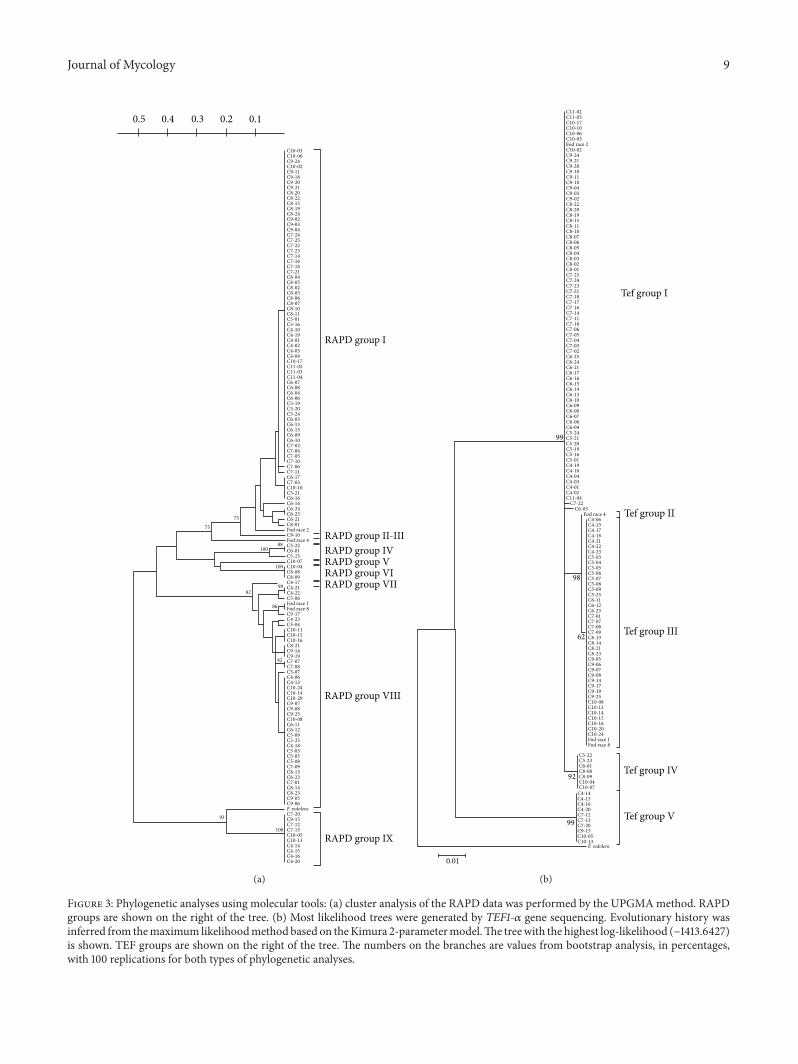
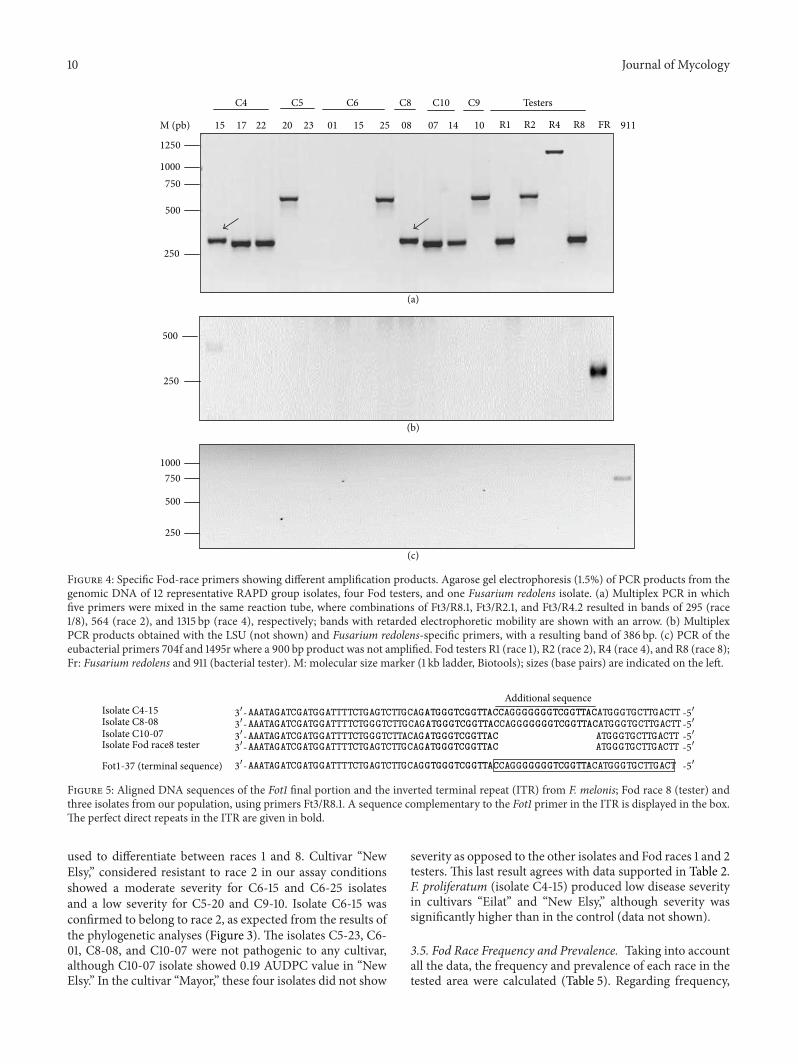