job openings and labor turnover - march 2020
TRANSCRIPT

For release 10:00 a.m. (EDT) Friday, May 15, 2020 USDL-20-0923
Technical information: (202) 691-5870 • [email protected] • www.bls.gov/jlt
Media contact: (202) 691-5902 • [email protected]
JOB OPENINGS AND LABOR TURNOVER – MARCH 2020
The number of total separations increased by 8.9 million to a series high of 14.5 million in March, the
U.S. Bureau of Labor Statistics reported today. Within separations, the quits rate fell to 1.8 percent and
the layoffs and discharges rate increased to 7.5 percent. Job openings decreased to 6.2 million on the last
business day of March. Over the month, hires declined to 5.2 million. The changes in these measures
reflect the effects of the coronavirus (COVID-19) pandemic and efforts to contain it. This release
includes estimates of the number and rate of job openings, hires, and separations for the total nonfarm
sector, by industry, and by four geographic regions.
Job Openings
On the last business day of March, the number and rate of job openings declined to 6.2 million
(-813,000) and 3.9 percent, respectively. Job openings fell in total private (-774,000), with the largest
declines in accommodation and food services (-258,000) and durable goods manufacturing (-82,000).
The number of job openings decreased in the South, Midwest, and West regions. (See table 1.)
Coronavirus (COVID-19) Pandemic Impact on March 2020 JOLTS Data
Data collection for the JOLTS survey was affected by the coronavirus (COVID-19) pandemic. More
information is available at the end of this news release and
www.bls.gov/bls/job-openings-and-labor-turnover-covid19-march-2020.htm
3.0
3.2
3.4
3.6
3.8
4.0
4.2
4.4
4.6
4.8
5.0
Mar-17 Sep-17 Mar-18 Sep-18 Mar-19 Sep-19 Mar-20
Percent
Chart 1. Job openings rate, seasonally adjusted,March 2017 - March 2020
3.0
4.0
5.0
6.0
7.0
8.0
9.0
10.0
Mar-17 Sep-17 Mar-18 Sep-18 Mar-19 Sep-19 Mar-20
Hires
Separations
Percent
Chart 2. Hires and total separations rates, seasonally adjusted,March 2017 - March 2020

- 2 -
Hires
In March, the number and rate of hires decreased to 5.2 million (-658,000) and 3.4 percent, respectively.
The hires level decreased for total private (-654,000) and was little changed for government. Hires
decreased in accommodation and food services (-344,000), health care and social assistance (-87,000),
and durable goods manufacturing (-33,000). Hires increased in federal government (+8,000). The
number of hires decreased in the Northeast, South, and West regions. (See table 2.)
Separations
Total separations includes quits, layoffs and discharges, and other separations. Total separations is
referred to as turnover. Quits are generally voluntary separations initiated by the employee. Therefore,
the quits rate can serve as a measure of workers’ willingness or ability to leave jobs. Layoffs and
discharges are involuntary separations initiated by the employer. Other separations includes separations
due to retirement, death, disability, and transfers to other locations of the same firm.
In March, the number and rate of total separations increased to a series high of 14.5 million
(+8,922,000) and 9.6 percent, respectively. The number of total separations increased for total private to
14.1 million (+8,862,000) and for government to 411,000 (+60,000). Total separations increased in
almost all industries, with the largest increases in accommodation and food services (+3,999,000) and
other services (+839,000). The number of total separations increased in all four regions. (See table 3.)
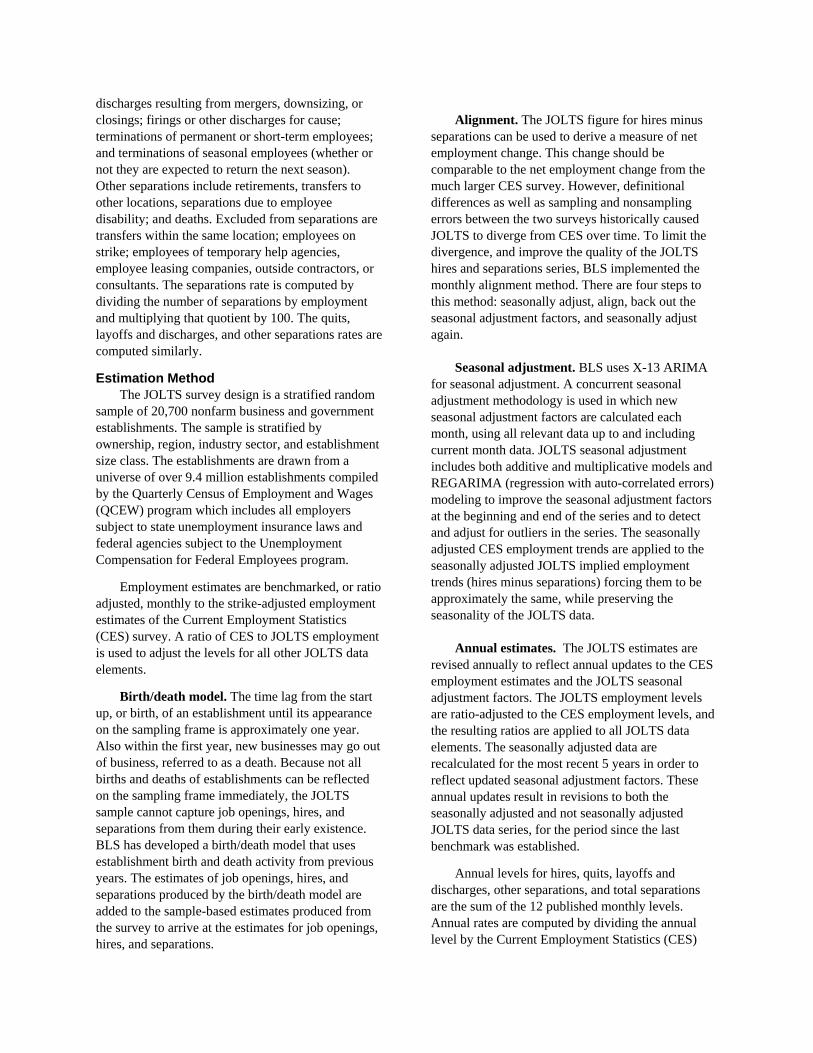
In March, the number and rate of quits decreased to 2.8 million (-654,000) and 1.8 percent, respectively.
Total private quits fell to 2.6 million (-640,000), while government edged down to 177,000 (-14,000).
Quits decreased in a number of industries, with the largest decreases in accommodation and food
services (-145,000) and retail trade (-137,000). The number of quits decreased in all four regions. (See
table 4.)
The number and rate of layoffs and discharges increased in March to a series high of 11.4 million
(+9,526,000) and 7.5 percent, respectively. The number of layoffs and discharges increased for total
private to 11.2 million (+9,445,000) and for government to 175,000 (+80,000). The layoffs and
discharges level increased significantly in all but one industry, with the largest increases in
accommodation and food services (+4,136,000) and retail trade (+908,000). The number of layoffs and
discharges increased in all four regions. (See table 5.)
The number of other separations edged up in March (+50,000). Other separations increased for total
private (+57,000) and edged down for government (-7,000). The largest increase in other separations
was in other services (+17,000). The number of other separations was little changed in all four regions.
(See table 6.)
Net Change in Employment
Large numbers of hires and separations occur every month throughout the business cycle. Net
employment change results from the relationship between hires and separations. When the number of
hires exceeds the number of separations, employment rises, even if the hires level is steady or declining.
Conversely, when the number of hires is less than the number of separations, employment declines, even
if the hires level is steady or rising.

- 3 -
Over the 12 months ending in March, hires totaled 69.8 million and separations totaled 76.9 million,
yielding a net employment loss of 7.1 million. These totals include workers who may have been hired
and separated more than once during the year.
The Job Openings and Labor Turnover Survey estimates for April 2020 are scheduled to be
released on Tuesday, June 9, 2020 at 10:00 a.m. (EDT).
Coronavirus (COVID-19) Pandemic Impact on March 2020 Job Openings and Labor Turnover
Survey Data
Data collection for the JOLTS survey was affected by the coronavirus (COVID-19) pandemic. While
41 percent of data are usually collected by phone at the JOLTS data collection center, most phone
respondents were asked to report electronically via our data collection website. However, data
collection was adversely impacted due to the inability to reach some respondents that normally
respond by phone. The JOLTS response rate for March was 57 percent, while response rates prior to
the pandemic averaged 67 percent.
BLS modified the JOLTS estimates for March to better reflect the impact of the coronavirus (COVID-
19) pandemic. The estimation process usually includes an alignment of monthly hires minus
separations to the over-the-month change in the Current Employment Statistics (CES) employment
estimates. For March estimates, however, BLS suspended the alignment process because the differing
reference periods for the CES employment estimates (pay period including the 12th of the month) and
the JOLTS hires and separations estimates (the entire reference month) led to substantially different
measurement outcomes. The extremely large increase in separations during the latter half of March
were not included in the CES employment change for March, but were included in the JOLTS data for
the month. For more information about the impact of the COVID-19 pandemic on the JOLTS survey,
including more information about the JOLTS estimation methodology, please see
https://www.bls.gov/bls/job-openings-and-labor-turnover-covid19-march-2020.htm
Error in JOLTS federal government estimates
BLS identified errors in the JOLTS federal government estimates for January 2020. These errors also
affect total nonfarm, government, and the regions. JOLTS has suppressed these data from the
LABSTAT database. JOLTS plans to reissue the data, possibly with the release on July 7, 2020.

Table A. Job openings, hires, and total separations by industry, seasonally adjusted
Category
Job openings Hires Total separations
Mar.2019
Feb.2020
Mar.2020p
Mar.2019
Feb.2020
Mar.2020p
Mar.2019
Feb.2020
Mar.2020p
LEVELS BY INDUSTRY(in thousands)
Total. . . . . . . . . . . . . . . . . . . . . . . . . . . . . . . . . . . . . . . . . . . . . . . . . . . 7,364 7,004 6,191 5,689 5,864 5,206 5,553 5,595 14,517
Total private. . . . . . . . . . . . . . . . . . . . . . . . . . . . . . . . . . . . . . . 6,625 6,236 5,462 5,337 5,489 4,835 5,212 5,244 14,106
Mining and logging1. . . . . . . . . . . . . . . . . . . . . . . . . . . . 30 26 14 35 25 20 35 20 44
Construction1. . . . . . . . . . . . . . . . . . . . . . . . . . . . . . . . . . . 354 296 243 363 390 403 346 359 762
Manufacturing. . . . . . . . . . . . . . . . . . . . . . . . . . . . . . . . . . 441 422 320 352 334 299 364 318 732
Durable goods1. . . . . . . . . . . . . . . . . . . . . . . . . . . . . . 286 269 187 186 196 163 202 183 471
Nondurable goods1. . . . . . . . . . . . . . . . . . . . . . . . . . 155 153 132 165 138 136 162 135 261
Trade, transportation, and utilities. . . . . . . . . . . 1,298 1,168 1,092 1,080 1,221 1,171 1,106 1,221 2,327
Wholesale trade. . . . . . . . . . . . . . . . . . . . . . . . . . . . . 217 183 164 128 153 130 136 155 320
Retail trade.. . . . . . . . . . . . . . . . . . . . . . . . . . . . . . . . . . 749 715 706 715 812 806 735 812 1,592
Transportation, warehousing, andutilities1. . . . . . . . . . . . . . . . . . . . . . . . . . . . . . . . . . . . . 332 270 222 238 256 235 236 254 415
Information1. . . . . . . . . . . . . . . . . . . . . . . . . . . . . . . . . . . . . 146 132 126 99 96 83 94 87 113
Financial activities. . . . . . . . . . . . . . . . . . . . . . . . . . . . . . 362 400 337 194 243 221 171 210 347
Finance and insurance. . . . . . . . . . . . . . . . . . . . . 244 306 265 135 161 156 118 150 172
Real estate and rental and leasing1. . . . . . 118 94 72 59 81 65 53 60 175
Professional and business services. . . . . . . . . 1,355 1,357 1,226 1,168 1,104 1,084 1,153 1,073 1,573
Education and health services. . . . . . . . . . . . . . . 1,378 1,252 1,228 740 762 678 702 699 1,695
Educational services1. . . . . . . . . . . . . . . . . . . . . . . 108 121 111 91 95 98 90 93 322
Health care and social assistance. . . . . . . . 1,270 1,131 1,117 649 667 580 612 606 1,374
Leisure and hospitality. . . . . . . . . . . . . . . . . . . . . . . . 1,022 950 699 1,095 1,091 717 1,039 1,036 5,453
Arts, entertainment, and recreation. . . . . . . 104 135 142 165 168 138 140 157 574
Accommodation and food services. . . . . . . 918 815 557 931 923 579 900 880 4,879
Other services. . . . . . . . . . . . . . . . . . . . . . . . . . . . . . . . . . 239 232 176 210 224 159 201 220 1,059
Government. . . . . . . . . . . . . . . . . . . . . . . . . . . . . . . . . . . . . . . 739 769 730 352 375 372 341 351 411
Federal1. . . . . . . . . . . . . . . . . . . . . . . . . . . . . . . . . . . . . . . . . 136 119 125 39 51 59 38 41 40
State and local. . . . . . . . . . . . . . . . . . . . . . . . . . . . . . . . . 604 649 605 313 324 313 303 311 371
State and local education. . . . . . . . . . . . . . . . . . 226 252 216 171 157 157 160 155 181
State and local, excluding education1. . . . 378 397 389 142 167 156 143 156 190
RATES BY INDUSTRY(percent)
Total. . . . . . . . . . . . . . . . . . . . . . . . . . . . . . . . . . . . . . . . . . . . . . . . . . . 4.7 4.4 3.9 3.8 3.8 3.4 3.7 3.7 9.6
Total private. . . . . . . . . . . . . . . . . . . . . . . . . . . . . . . . . . . . . . . 4.9 4.6 4.1 4.2 4.2 3.7 4.1 4.0 10.9
Mining and logging1. . . . . . . . . . . . . . . . . . . . . . . . . . . . 3.9 3.4 2.0 4.7 3.4 2.8 4.8 2.8 6.2
Construction1. . . . . . . . . . . . . . . . . . . . . . . . . . . . . . . . . . . 4.5 3.7 3.1 4.9 5.1 5.3 4.6 4.7 10.0
Manufacturing. . . . . . . . . . . . . . . . . . . . . . . . . . . . . . . . . . 3.3 3.2 2.4 2.7 2.6 2.3 2.8 2.5 5.7
Durable goods1. . . . . . . . . . . . . . . . . . . . . . . . . . . . . . 3.4 3.2 2.3 2.3 2.4 2.0 2.5 2.3 5.8
Nondurable goods1. . . . . . . . . . . . . . . . . . . . . . . . . . 3.1 3.1 2.7 3.5 2.9 2.9 3.4 2.8 5.5
Trade, transportation, and utilities. . . . . . . . . . . 4.5 4.0 3.8 3.9 4.4 4.2 4.0 4.4 8.4
Wholesale trade. . . . . . . . . . . . . . . . . . . . . . . . . . . . . 3.6 3.0 2.7 2.2 2.6 2.2 2.3 2.6 5.4
Retail trade.. . . . . . . . . . . . . . . . . . . . . . . . . . . . . . . . . . 4.6 4.4 4.3 4.6 5.2 5.2 4.7 5.2 10.2
Transportation, warehousing, andutilities1. . . . . . . . . . . . . . . . . . . . . . . . . . . . . . . . . . . . . 5.1 4.2 3.4 3.9 4.1 3.8 3.8 4.1 6.7
Information1. . . . . . . . . . . . . . . . . . . . . . . . . . . . . . . . . . . . . 4.9 4.4 4.2 3.5 3.3 2.9 3.3 3.0 3.9
Financial activities. . . . . . . . . . . . . . . . . . . . . . . . . . . . . . 4.0 4.3 3.7 2.2 2.7 2.5 2.0 2.4 3.9
Finance and insurance. . . . . . . . . . . . . . . . . . . . . 3.7 4.5 3.9 2.1 2.5 2.4 1.8 2.3 2.7
Real estate and rental and leasing1. . . . . . 4.9 3.8 3.0 2.6 3.4 2.8 2.3 2.5 7.4
Professional and business services. . . . . . . . . 6.0 5.9 5.4 5.5 5.1 5.0 5.4 5.0 7.3
Education and health services. . . . . . . . . . . . . . . 5.4 4.8 4.8 3.1 3.1 2.8 2.9 2.8 6.9
Educational services1. . . . . . . . . . . . . . . . . . . . . . . 2.8 3.1 2.8 2.4 2.5 2.6 2.4 2.4 8.4
Health care and social assistance. . . . . . . . 5.9 5.2 5.1 3.2 3.2 2.8 3.0 2.9 6.6
Leisure and hospitality. . . . . . . . . . . . . . . . . . . . . . . . 5.8 5.3 4.1 6.6 6.5 4.4 6.3 6.1 33.3
Arts, entertainment, and recreation. . . . . . . 4.1 5.2 5.4 6.8 6.8 5.6 5.8 6.3 23.3
Accommodation and food services. . . . . . . 6.1 5.4 3.8 6.6 6.4 4.2 6.4 6.1 35.0
Other services. . . . . . . . . . . . . . . . . . . . . . . . . . . . . . . . . . 3.9 3.8 2.9 3.6 3.8 2.7 3.4 3.7 17.9
See footnotes at end of table.

Table A. Job openings, hires, and total separations by industry, seasonally adjusted — Continued
Category
Job openings Hires Total separations
Mar.2019
Feb.2020
Mar.2020p
Mar.2019
Feb.2020
Mar.2020p
Mar.2019
Feb.2020
Mar.2020p
Government. . . . . . . . . . . . . . . . . . . . . . . . . . . . . . . . . . . . . . . 3.2 3.3 3.1 1.6 1.6 1.6 1.5 1.5 1.8
Federal1. . . . . . . . . . . . . . . . . . . . . . . . . . . . . . . . . . . . . . . . . 4.6 4.0 4.2 1.4 1.8 2.0 1.4 1.4 1.4
State and local. . . . . . . . . . . . . . . . . . . . . . . . . . . . . . . . . 3.0 3.2 3.0 1.6 1.6 1.6 1.5 1.6 1.9
State and local education. . . . . . . . . . . . . . . . . . 2.1 2.3 2.0 1.6 1.5 1.5 1.5 1.5 1.7
State and local, excluding education1. . . . 3.9 4.1 4.0 1.5 1.8 1.7 1.5 1.7 2.0
1 No regular seasonal movements could be identified in the job openings series, therefore, the seasonally adjusted and not seasonally adjusted dataare identical.
p Preliminary

Technical Note This news release presents statistics from the Job
Openings and Labor Turnover Survey (JOLTS). The
JOLTS program provides information on labor
demand and turnover. Additional information about
the JOLTS program can be found at
www.bls.gov/jlt/. Estimates are published for job
openings, hires, quits, layoffs and discharges, other
separations, and total separations. The JOLTS
program covers all private nonfarm establishments,
as well as civilian federal, state, and local
government entities in the 50 states and the District
of Columbia. Industries are classified in accordance
with the North American Industry Classification
System.
Definitions
Employment. Employment includes persons on
the payroll who worked or received pay for the pay
period that includes the 12th day of the reference
month. Full-time, part-time, permanent, short-term,
seasonal, salaried, and hourly employees are
included, as are employees on paid vacation or other
paid leave. Proprietors or partners of unincorporated
businesses, unpaid family workers, or employees on
strike for the entire pay period, and employees on
leave without pay for the entire pay period are not
counted as employed. Employees of temporary help
agencies, employee leasing companies, outside
contractors, and consultants are counted by their
employer of record, not by the establishment where
they are working. JOLTS does not publish
employment estimates but uses the reported
employment for validation of the other reported data
elements.
Job Openings. Job openings include all
positions that are open on the last business day of the
reference month. A job is open only if it meets all
three of these conditions:
A specific position exists and there is work
available for that position. The position can
be full-time or part-time, and it can be
permanent, short-term, or seasonal.
The job could start within 30 days, whether
or not the employer can find a suitable
candidate during that time.
The employer is actively recruiting workers
from outside the establishment to fill the
position. Active recruiting means that the
establishment is taking steps to fill a
position. It may include advertising in
newspapers, on television, or on the radio;
posting Internet notices, posting “help
wanted” signs, networking or making
“word-of-mouth” announcements; accepting
applications; interviewing candidates;
contacting employment agencies; or
soliciting employees at job fairs, state or
local employment offices, or similar
sources.
Excluded are positions open only to internal
transfers, promotions or demotions, or recall from
layoffs. Also excluded are openings for positions
with start dates more than 30 days in the future,
positions for which employees have been hired but
the employees have not yet reported for work, and
positions to be filled by employees of temporary help
agencies, employee leasing companies, outside
contractors, or consultants. The job openings rate is
computed by dividing the number of job openings by
the sum of employment and job openings and
multiplying that quotient by 100.
Hires. Hires include all additions to the payroll
during the entire reference month, including newly
hired and rehired employees; full-time and part-time
employees; permanent, short-term, and seasonal
employees; employees who were recalled to a job at
the location following a layoff (formal suspension
from pay status) lasting more than 7 days; on-call or
intermittent employees who returned to work after
having been formally separated; workers who were
hired and separated during the month, and transfers
from other locations. Excluded are transfers or
promotions within the reporting location, employees
returning from strike, employees of temporary help
agencies, employee leasing companies, outside
contractors, or consultants. The hires rate is
computed by dividing the number of hires by
employment and multiplying that quotient by 100.
Separations. Separations include all separations
from the payroll during the entire reference month
and is reported by type of separation: quits, layoffs
and discharges, and other separations. Quits include
employees who left voluntarily with the exception of
retirements or transfers to other locations. Layoffs
and discharges includes involuntary separations
initiated by the employer including layoffs with no
intent to rehire; layoffs (formal suspensions from pay
status) lasting or expected to last more than 7 days;
discharges resulting from mergers, downsizing, or
closings; firings or other discharges for cause;
terminations of permanent or short-term employees;
and terminations of seasonal employees (whether or
not they are expected to return the next season).
Other separations include retirements, transfers to
other locations, separations due to employee
disability; and deaths. Excluded from separations are
transfers within the same location; employees on
strike; employees of temporary help agencies,
employee leasing companies, outside contractors, or
consultants. The separations rate is computed by
dividing the number of separations by employment
and multiplying that quotient by 100. The quits,
layoffs and discharges, and other separations rates are
computed similarly.
Estimation Method
The JOLTS survey design is a stratified random
sample of 20,700 nonfarm business and government
establishments. The sample is stratified by
ownership, region, industry sector, and establishment
size class. The establishments are drawn from a
universe of over 9.4 million establishments compiled
by the Quarterly Census of Employment and Wages
(QCEW) program which includes all employers
subject to state unemployment insurance laws and
federal agencies subject to the Unemployment
Compensation for Federal Employees program.
Employment estimates are benchmarked, or ratio
adjusted, monthly to the strike-adjusted employment
estimates of the Current Employment Statistics
(CES) survey. A ratio of CES to JOLTS employment
is used to adjust the levels for all other JOLTS data
elements.
Birth/death model. The time lag from the start
up, or birth, of an establishment until its appearance
on the sampling frame is approximately one year.
Also within the first year, new businesses may go out
of business, referred to as a death. Because not all
births and deaths of establishments can be reflected
on the sampling frame immediately, the JOLTS
sample cannot capture job openings, hires, and
separations from them during their early existence.
BLS has developed a birth/death model that uses
establishment birth and death activity from previous
years. The estimates of job openings, hires, and
separations produced by the birth/death model are
added to the sample-based estimates produced from
the survey to arrive at the estimates for job openings,
hires, and separations.
Alignment. The JOLTS figure for hires minus
separations can be used to derive a measure of net
employment change. This change should be
comparable to the net employment change from the
much larger CES survey. However, definitional
differences as well as sampling and nonsampling
errors between the two surveys historically caused
JOLTS to diverge from CES over time. To limit the
divergence, and improve the quality of the JOLTS
hires and separations series, BLS implemented the
monthly alignment method. There are four steps to
this method: seasonally adjust, align, back out the
seasonal adjustment factors, and seasonally adjust
again.
Seasonal adjustment. BLS uses X-13 ARIMA
for seasonal adjustment. A concurrent seasonal
adjustment methodology is used in which new
seasonal adjustment factors are calculated each
month, using all relevant data up to and including
current month data. JOLTS seasonal adjustment
includes both additive and multiplicative models and
REGARIMA (regression with auto-correlated errors)
modeling to improve the seasonal adjustment factors
at the beginning and end of the series and to detect
and adjust for outliers in the series. The seasonally
adjusted CES employment trends are applied to the
seasonally adjusted JOLTS implied employment
trends (hires minus separations) forcing them to be
approximately the same, while preserving the
seasonality of the JOLTS data.
Annual estimates. The JOLTS estimates are
revised annually to reflect annual updates to the CES
employment estimates and the JOLTS seasonal
adjustment factors. The JOLTS employment levels
are ratio-adjusted to the CES employment levels, and
the resulting ratios are applied to all JOLTS data
elements. The seasonally adjusted data are
recalculated for the most recent 5 years in order to
reflect updated seasonal adjustment factors. These
annual updates result in revisions to both the
seasonally adjusted and not seasonally adjusted
JOLTS data series, for the period since the last
benchmark was established.
Annual levels for hires, quits, layoffs and
discharges, other separations, and total separations
are the sum of the 12 published monthly levels.
Annual rates are computed by dividing the annual
level by the Current Employment Statistics (CES)

annual average employment level, and multiplying
that quotient by 100. This figure will be
approximately equal to the sum of the 12 monthly
rates. Consistent with BLS practice, annual estimates
are published only for not seasonally adjusted data
and are released with the January news release each
year. Annual estimates are not calculated for job
openings because job openings are a stock, or point-
in-time, measurement for the last business day of
each month.
Reliability of the estimates
JOLTS estimates are subject to both sampling
and nonsampling error. Nonsampling error occurs
when a sample is surveyed rather than the entire
population. There is a chance that the sample
estimates may differ from the true population values
they represent. The difference, or sampling error,
varies depending on the particular sample selected.
This variability is measured by the standard error of
the estimate. BLS analysis is generally conducted at
the 90-percent level of confidence. That means that
there is a 90-percent chance, or level of confidence,
that an estimate based on a sample will differ by no
more than 1.6 standard errors from the true
population value because of sampling error.
Sampling error estimates are available at
www.bls.gov/jlt/jolts_median_standard_errors.htm.
The JOLTS estimates also are affected by
nonsampling error. Nonsampling error can occur for
many reasons including: the failure to include a
segment of the population; the inability to obtain data
from all units in the sample; the inability or
unwillingness of respondents to provide data on a
timely basis; mistakes made by respondents; errors
made in the collection or processing of the data; and
errors from the employment benchmark data used in
estimation.
Other information
Information in this release will be made available
to sensory impaired individuals upon request. Voice
phone: (202) 691-5200; Federal Relay Service: (800)
877-8339.

Table 1. Job openings levels and rates by industry and region, seasonally adjusted1
Industry and region
Levels (in thousands) Rates2
Mar.2019
Nov.2019
Dec.2019
Jan.2020
Feb.2020
Mar.2020p
Mar.2019
Nov.2019
Dec.2019
Jan.2020
Feb.2020
Mar.2020p
Total. . . . . . . . . . . . . . . . . . . . . . . . . . . . . . . . . . . . . . . . . . . . . . . 7,364 6,793 6,552 7,012 7,004 6,191 4.7 4.3 4.1 4.4 4.4 3.9
INDUSTRY
Total private. . . . . . . . . . . . . . . . . . . . . . . . . . . . . . . . . . . 6,625 6,070 5,838 6,231 6,236 5,462 4.9 4.5 4.3 4.6 4.6 4.1
Mining and logging3. . . . . . . . . . . . . . . . . . . . . . . 30 20 13 19 26 14 3.9 2.7 1.8 2.7 3.4 2.0
Construction3. . . . . . . . . . . . . . . . . . . . . . . . . . . . . . . 354 215 216 267 296 243 4.5 2.8 2.8 3.4 3.7 3.1
Manufacturing. . . . . . . . . . . . . . . . . . . . . . . . . . . . . . 441 401 360 408 422 320 3.3 3.0 2.7 3.1 3.2 2.4
Durable goods3. . . . . . . . . . . . . . . . . . . . . . . . . . 286 270 222 256 269 187 3.4 3.2 2.7 3.1 3.2 2.3
Nondurable goods3. . . . . . . . . . . . . . . . . . . . . . 155 131 138 152 153 132 3.1 2.6 2.8 3.1 3.1 2.7
Trade, transportation, and utilities. . . . . . . 1,298 1,271 1,192 1,214 1,168 1,092 4.5 4.4 4.1 4.2 4.0 3.8
Wholesale trade. . . . . . . . . . . . . . . . . . . . . . . . . 217 188 187 172 183 164 3.6 3.1 3.1 2.8 3.0 2.7
Retail trade.. . . . . . . . . . . . . . . . . . . . . . . . . . . . . . 749 752 762 759 715 706 4.6 4.6 4.6 4.6 4.4 4.3
Transportation, warehousing, andutilities3. . . . . . . . . . . . . . . . . . . . . . . . . . . . . . . . . 332 331 244 283 270 222 5.1 5.1 3.8 4.3 4.2 3.4
Information3. . . . . . . . . . . . . . . . . . . . . . . . . . . . . . . . . 146 136 146 152 132 126 4.9 4.5 4.8 5.0 4.4 4.2
Financial activities. . . . . . . . . . . . . . . . . . . . . . . . . 362 348 319 427 400 337 4.0 3.8 3.5 4.6 4.3 3.7
Finance and insurance. . . . . . . . . . . . . . . . . 244 259 235 312 306 265 3.7 3.9 3.5 4.6 4.5 3.9
Real estate and rental and leasing3.. . 118 88 84 115 94 72 4.9 3.6 3.4 4.7 3.8 3.0
Professional and business services. . . . . 1,355 1,217 1,223 1,265 1,357 1,226 6.0 5.4 5.4 5.6 5.9 5.4
Education and health services. . . . . . . . . . . 1,378 1,311 1,203 1,294 1,252 1,228 5.4 5.1 4.7 5.0 4.8 4.8
Educational services3. . . . . . . . . . . . . . . . . . . 108 146 106 133 121 111 2.8 3.7 2.7 3.4 3.1 2.8
Health care and social assistance. . . . 1,270 1,165 1,097 1,161 1,131 1,117 5.9 5.3 5.0 5.3 5.2 5.1
Leisure and hospitality. . . . . . . . . . . . . . . . . . . . 1,022 966 916 919 950 699 5.8 5.5 5.2 5.2 5.3 4.1
Arts, entertainment, and recreation. . . 104 120 127 148 135 142 4.1 4.6 4.9 5.6 5.2 5.4
Accommodation and food services. . . 918 845 789 771 815 557 6.1 5.6 5.2 5.1 5.4 3.8
Other services. . . . . . . . . . . . . . . . . . . . . . . . . . . . . . 239 185 250 264 232 176 3.9 3.0 4.1 4.3 3.8 2.9
Government. . . . . . . . . . . . . . . . . . . . . . . . . . . . . . . . . . . 739 723 715 781 769 730 3.2 3.1 3.1 3.3 3.3 3.1
Federal3. . . . . . . . . . . . . . . . . . . . . . . . . . . . . . . . . . . . . 136 117 88 113 119 125 4.6 3.9 3.0 3.8 4.0 4.2
State and local. . . . . . . . . . . . . . . . . . . . . . . . . . . . . 604 606 626 669 649 605 3.0 3.0 3.1 3.3 3.2 3.0
State and local education. . . . . . . . . . . . . . 226 220 234 275 252 216 2.1 2.0 2.2 2.5 2.3 2.0
State and local, excludingeducation3. . . . . . . . . . . . . . . . . . . . . . . . . . . . . 378 386 393 393 397 389 3.9 4.0 4.0 4.0 4.1 4.0
REGION4
Northeast. . . . . . . . . . . . . . . . . . . . . . . . . . . . . . . . . . . . . . 1,201 1,178 1,135 1,224 1,237 1,156 4.2 4.1 3.9 4.2 4.2 4.0
South. . . . . . . . . . . . . . . . . . . . . . . . . . . . . . . . . . . . . . . . . . . 2,795 2,545 2,439 2,631 2,589 2,383 4.8 4.4 4.2 4.5 4.4 4.1
Midwest. . . . . . . . . . . . . . . . . . . . . . . . . . . . . . . . . . . . . . . . 1,674 1,485 1,400 1,522 1,556 1,309 4.9 4.3 4.1 4.4 4.5 3.8
West. . . . . . . . . . . . . . . . . . . . . . . . . . . . . . . . . . . . . . . . . . . . 1,694 1,585 1,578 1,634 1,621 1,343 4.6 4.3 4.3 4.4 4.4 3.7
1 Job openings are the number of job openings on the last business day of the month.2 The job openings rate is the number of job openings on the last business day of the month as a percent of total employment plus job openings.3 No regular seasonal movements could be identified in this series; therefore, identical numbers appear for the unadjusted and seasonally adjusted
series.4 The states (including the District of Columbia) that comprise the regions are: Northeast: Connecticut, Maine, Massachusetts, New Hampshire, New
Jersey, New York, Pennsylvania, Rhode Island, and Vermont; South: Alabama, Arkansas, Delaware, District of Columbia, Florida, Georgia,Kentucky, Louisiana, Maryland, Mississippi, North Carolina, Oklahoma, South Carolina, Tennessee, Texas, Virginia, and West Virginia; Midwest:Illinois, Indiana, Iowa, Kansas, Michigan, Minnesota, Missouri, Nebraska, North Dakota, Ohio, South Dakota, and Wisconsin; West: Alaska, Arizona,California, Colorado, Hawaii, Idaho, Montana, Nevada, New Mexico, Oregon, Utah, Washington, and Wyoming.
p Preliminary

Table 2. Hires levels and rates by industry and region, seasonally adjusted1
Industry and region
Levels (in thousands) Rates2
Mar.2019
Nov.2019
Dec.2019
Jan.2020
Feb.2020
Mar.2020p
Mar.2019
Nov.2019
Dec.2019
Jan.2020
Feb.2020
Mar.2020p
Total. . . . . . . . . . . . . . . . . . . . . . . . . . . . . . . . . . . . . . . . . . . . . . . 5,689 5,857 5,927 5,925 5,864 5,206 3.8 3.9 3.9 3.9 3.8 3.4
INDUSTRY
Total private. . . . . . . . . . . . . . . . . . . . . . . . . . . . . . . . . . . 5,337 5,485 5,574 5,541 5,489 4,835 4.2 4.2 4.3 4.3 4.2 3.7
Mining and logging.. . . . . . . . . . . . . . . . . . . . . . . . 35 22 25 20 25 20 4.7 3.1 3.6 2.8 3.4 2.8
Construction. . . . . . . . . . . . . . . . . . . . . . . . . . . . . . . . 363 426 467 435 390 403 4.9 5.7 6.2 5.7 5.1 5.3
Manufacturing. . . . . . . . . . . . . . . . . . . . . . . . . . . . . . 352 357 334 311 334 299 2.7 2.8 2.6 2.4 2.6 2.3
Durable goods. . . . . . . . . . . . . . . . . . . . . . . . . . . 186 212 192 174 196 163 2.3 2.6 2.4 2.2 2.4 2.0
Nondurable goods.. . . . . . . . . . . . . . . . . . . . . . 165 145 142 137 138 136 3.5 3.0 3.0 2.9 2.9 2.9
Trade, transportation, and utilities. . . . . . . 1,080 1,170 1,161 1,220 1,221 1,171 3.9 4.2 4.2 4.4 4.4 4.2
Wholesale trade. . . . . . . . . . . . . . . . . . . . . . . . . 128 156 133 138 153 130 2.2 2.6 2.2 2.3 2.6 2.2
Retail trade.. . . . . . . . . . . . . . . . . . . . . . . . . . . . . . 715 763 772 818 812 806 4.6 4.9 4.9 5.2 5.2 5.2
Transportation, warehousing, andutilities. . . . . . . . . . . . . . . . . . . . . . . . . . . . . . . . . . 238 251 256 264 256 235 3.9 4.0 4.1 4.2 4.1 3.8
Information. . . . . . . . . . . . . . . . . . . . . . . . . . . . . . . . . . 99 90 87 86 96 83 3.5 3.1 3.0 3.0 3.3 2.9
Financial activities. . . . . . . . . . . . . . . . . . . . . . . . . 194 236 218 217 243 221 2.2 2.7 2.5 2.5 2.7 2.5
Finance and insurance. . . . . . . . . . . . . . . . . 135 149 135 142 161 156 2.1 2.3 2.1 2.2 2.5 2.4
Real estate and rental and leasing. . . 59 87 83 75 81 65 2.6 3.7 3.5 3.2 3.4 2.8
Professional and business services. . . . . 1,168 1,157 1,151 1,163 1,104 1,084 5.5 5.4 5.4 5.4 5.1 5.0
Education and health services. . . . . . . . . . . 740 730 723 753 762 678 3.1 3.0 3.0 3.1 3.1 2.8
Educational services. . . . . . . . . . . . . . . . . . . . 91 107 104 109 95 98 2.4 2.8 2.7 2.8 2.5 2.6
Health care and social assistance. . . . 649 623 619 644 667 580 3.2 3.0 3.0 3.1 3.2 2.8
Leisure and hospitality. . . . . . . . . . . . . . . . . . . . 1,095 1,078 1,165 1,126 1,091 717 6.6 6.4 6.9 6.7 6.5 4.4
Arts, entertainment, and recreation. . . 165 187 186 176 168 138 6.8 7.6 7.5 7.1 6.8 5.6
Accommodation and food services. . . 931 891 979 949 923 579 6.6 6.2 6.8 6.6 6.4 4.2
Other services. . . . . . . . . . . . . . . . . . . . . . . . . . . . . . 210 220 243 210 224 159 3.6 3.7 4.1 3.5 3.8 2.7
Government. . . . . . . . . . . . . . . . . . . . . . . . . . . . . . . . . . . 352 371 352 384 375 372 1.6 1.6 1.6 1.7 1.6 1.6
Federal. . . . . . . . . . . . . . . . . . . . . . . . . . . . . . . . . . . . . . 39 51 43 48 51 59 1.4 1.8 1.5 1.7 1.8 2.0
State and local. . . . . . . . . . . . . . . . . . . . . . . . . . . . . 313 321 309 336 324 313 1.6 1.6 1.6 1.7 1.6 1.6
State and local education. . . . . . . . . . . . . . 171 160 153 173 157 157 1.6 1.5 1.5 1.6 1.5 1.5
State and local, excludingeducation. . . . . . . . . . . . . . . . . . . . . . . . . . . . . . 142 160 156 163 167 156 1.5 1.7 1.7 1.7 1.8 1.7
REGION3
Northeast. . . . . . . . . . . . . . . . . . . . . . . . . . . . . . . . . . . . . . 898 949 935 949 960 855 3.3 3.4 3.4 3.4 3.4 3.1
South. . . . . . . . . . . . . . . . . . . . . . . . . . . . . . . . . . . . . . . . . . . 2,346 2,296 2,358 2,345 2,321 2,006 4.3 4.1 4.2 4.2 4.2 3.6
Midwest. . . . . . . . . . . . . . . . . . . . . . . . . . . . . . . . . . . . . . . . 1,168 1,304 1,263 1,187 1,231 1,115 3.6 3.9 3.8 3.6 3.7 3.4
West. . . . . . . . . . . . . . . . . . . . . . . . . . . . . . . . . . . . . . . . . . . . 1,277 1,308 1,371 1,444 1,352 1,230 3.7 3.7 3.9 4.1 3.8 3.5
1 Hires are the number of hires during the entire month.2 The hires rate is the number of hires during the entire month as a percent of total employment.3 The states (including the District of Columbia) that comprise the regions are: Northeast: Connecticut, Maine, Massachusetts, New Hampshire, New
Jersey, New York, Pennsylvania, Rhode Island, and Vermont; South: Alabama, Arkansas, Delaware, District of Columbia, Florida, Georgia,Kentucky, Louisiana, Maryland, Mississippi, North Carolina, Oklahoma, South Carolina, Tennessee, Texas, Virginia, and West Virginia; Midwest:Illinois, Indiana, Iowa, Kansas, Michigan, Minnesota, Missouri, Nebraska, North Dakota, Ohio, South Dakota, and Wisconsin; West: Alaska, Arizona,California, Colorado, Hawaii, Idaho, Montana, Nevada, New Mexico, Oregon, Utah, Washington, and Wyoming.
p Preliminary

Table 3. Total separations levels and rates by industry and region, seasonally adjusted1
Industry and region
Levels (in thousands) Rates2
Mar.2019
Nov.2019
Dec.2019
Jan.2020
Feb.2020
Mar.2020p
Mar.2019
Nov.2019
Dec.2019
Jan.2020
Feb.2020
Mar.2020p
Total. . . . . . . . . . . . . . . . . . . . . . . . . . . . . . . . . . . . . . . . . . . . . . . 5,553 5,657 5,762 5,703 5,595 14,517 3.7 3.7 3.8 3.7 3.7 9.6
INDUSTRY
Total private. . . . . . . . . . . . . . . . . . . . . . . . . . . . . . . . . . . 5,212 5,307 5,419 5,382 5,244 14,106 4.1 4.1 4.2 4.2 4.0 10.9
Mining and logging.. . . . . . . . . . . . . . . . . . . . . . . . 35 29 31 24 20 44 4.8 4.0 4.3 3.4 2.8 6.2
Construction. . . . . . . . . . . . . . . . . . . . . . . . . . . . . . . . 346 416 432 386 359 762 4.6 5.5 5.7 5.1 4.7 10.0
Manufacturing. . . . . . . . . . . . . . . . . . . . . . . . . . . . . . 364 318 342 331 318 732 2.8 2.5 2.7 2.6 2.5 5.7
Durable goods. . . . . . . . . . . . . . . . . . . . . . . . . . . 202 184 193 184 183 471 2.5 2.3 2.4 2.3 2.3 5.8
Nondurable goods.. . . . . . . . . . . . . . . . . . . . . . 162 134 149 147 135 261 3.4 2.8 3.1 3.1 2.8 5.5
Trade, transportation, and utilities. . . . . . . 1,106 1,198 1,115 1,220 1,221 2,327 4.0 4.3 4.0 4.4 4.4 8.4
Wholesale trade. . . . . . . . . . . . . . . . . . . . . . . . . 136 147 123 137 155 320 2.3 2.5 2.1 2.3 2.6 5.4
Retail trade.. . . . . . . . . . . . . . . . . . . . . . . . . . . . . . 735 816 741 830 812 1,592 4.7 5.2 4.7 5.3 5.2 10.2
Transportation, warehousing, andutilities. . . . . . . . . . . . . . . . . . . . . . . . . . . . . . . . . . 236 235 250 253 254 415 3.8 3.8 4.0 4.1 4.1 6.7
Information. . . . . . . . . . . . . . . . . . . . . . . . . . . . . . . . . . 94 79 84 75 87 113 3.3 2.7 2.9 2.6 3.0 3.9
Financial activities. . . . . . . . . . . . . . . . . . . . . . . . . 171 213 203 217 210 347 2.0 2.4 2.3 2.5 2.4 3.9
Finance and insurance. . . . . . . . . . . . . . . . . 118 143 134 141 150 172 1.8 2.2 2.1 2.2 2.3 2.7
Real estate and rental and leasing. . . 53 70 69 75 60 175 2.3 3.0 3.0 3.2 2.5 7.4
Professional and business services. . . . . 1,153 1,131 1,134 1,151 1,073 1,573 5.4 5.3 5.3 5.3 5.0 7.3
Education and health services. . . . . . . . . . . 702 663 690 701 699 1,695 2.9 2.7 2.8 2.9 2.8 6.9
Educational services. . . . . . . . . . . . . . . . . . . . 90 89 97 83 93 322 2.4 2.3 2.5 2.2 2.4 8.4
Health care and social assistance. . . . 612 574 593 617 606 1,374 3.0 2.8 2.9 3.0 2.9 6.6
Leisure and hospitality. . . . . . . . . . . . . . . . . . . . 1,039 1,063 1,146 1,090 1,036 5,453 6.3 6.3 6.8 6.5 6.1 33.3
Arts, entertainment, and recreation. . . 140 175 184 172 157 574 5.8 7.1 7.4 6.9 6.3 23.3
Accommodation and food services. . . 900 888 963 918 880 4,879 6.4 6.2 6.7 6.4 6.1 35.0
Other services. . . . . . . . . . . . . . . . . . . . . . . . . . . . . . 201 197 242 187 220 1,059 3.4 3.3 4.1 3.1 3.7 17.9
Government. . . . . . . . . . . . . . . . . . . . . . . . . . . . . . . . . . . 341 350 343 321 351 411 1.5 1.5 1.5 1.4 1.5 1.8
Federal. . . . . . . . . . . . . . . . . . . . . . . . . . . . . . . . . . . . . . 38 41 45 38 41 40 1.4 1.4 1.6 1.3 1.4 1.4
State and local. . . . . . . . . . . . . . . . . . . . . . . . . . . . . 303 309 298 283 311 371 1.5 1.6 1.5 1.4 1.6 1.9
State and local education. . . . . . . . . . . . . . 160 157 164 149 155 181 1.5 1.5 1.6 1.4 1.5 1.7
State and local, excludingeducation. . . . . . . . . . . . . . . . . . . . . . . . . . . . . . 143 152 134 134 156 190 1.5 1.6 1.4 1.4 1.7 2.0
REGION3
Northeast. . . . . . . . . . . . . . . . . . . . . . . . . . . . . . . . . . . . . . 869 909 887 911 888 2,835 3.2 3.3 3.2 3.3 3.2 10.2
South. . . . . . . . . . . . . . . . . . . . . . . . . . . . . . . . . . . . . . . . . . . 2,313 2,147 2,249 2,252 2,097 4,873 4.2 3.9 4.0 4.0 3.8 8.8
Midwest. . . . . . . . . . . . . . . . . . . . . . . . . . . . . . . . . . . . . . . . 1,145 1,235 1,220 1,249 1,293 3,588 3.5 3.7 3.7 3.8 3.9 10.9
West. . . . . . . . . . . . . . . . . . . . . . . . . . . . . . . . . . . . . . . . . . . . 1,227 1,366 1,406 1,291 1,317 3,221 3.5 3.9 4.0 3.6 3.7 9.1
1 Total separations are the number of total separations during the entire month.2 The total separations rate is the number of total separations during the entire month as a percent of total employment.3 The states (including the District of Columbia) that comprise the regions are: Northeast: Connecticut, Maine, Massachusetts, New Hampshire, New
Jersey, New York, Pennsylvania, Rhode Island, and Vermont; South: Alabama, Arkansas, Delaware, District of Columbia, Florida, Georgia,Kentucky, Louisiana, Maryland, Mississippi, North Carolina, Oklahoma, South Carolina, Tennessee, Texas, Virginia, and West Virginia; Midwest:Illinois, Indiana, Iowa, Kansas, Michigan, Minnesota, Missouri, Nebraska, North Dakota, Ohio, South Dakota, and Wisconsin; West: Alaska, Arizona,California, Colorado, Hawaii, Idaho, Montana, Nevada, New Mexico, Oregon, Utah, Washington, and Wyoming.
p Preliminary
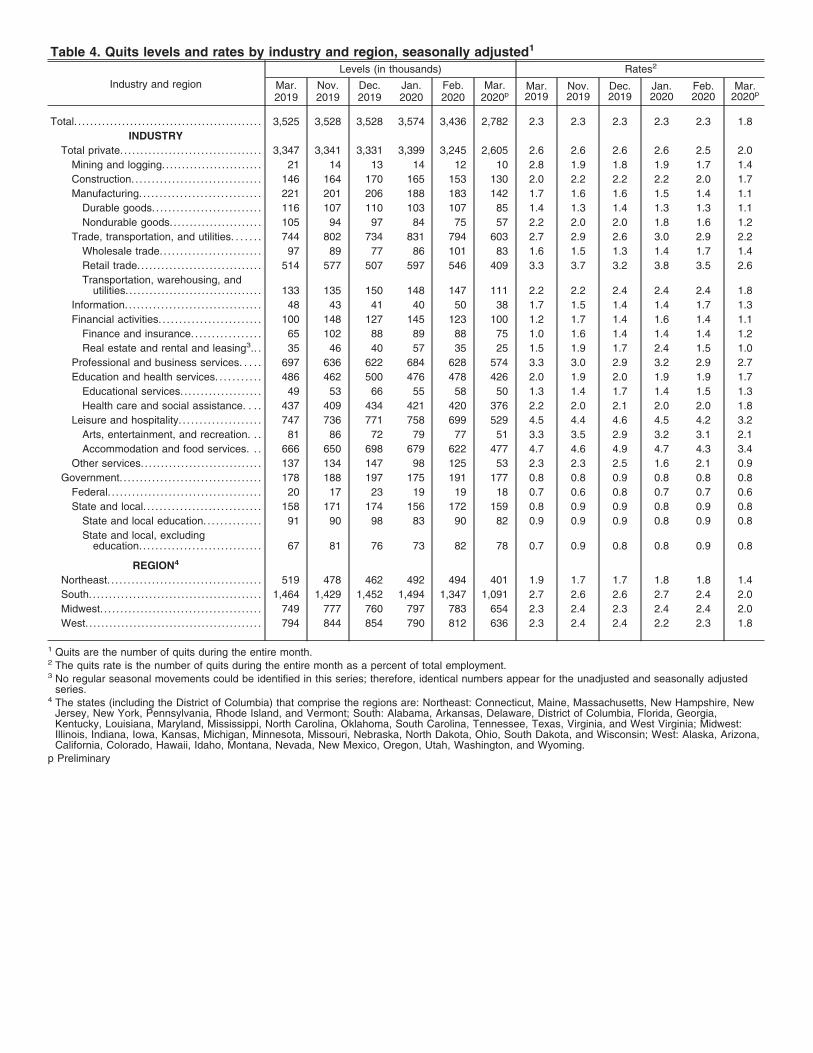
Table 4. Quits levels and rates by industry and region, seasonally adjusted1
Industry and region
Levels (in thousands) Rates2
Mar.2019
Nov.2019
Dec.2019
Jan.2020
Feb.2020
Mar.2020p
Mar.2019
Nov.2019
Dec.2019
Jan.2020
Feb.2020
Mar.2020p
Total. . . . . . . . . . . . . . . . . . . . . . . . . . . . . . . . . . . . . . . . . . . . . . . 3,525 3,528 3,528 3,574 3,436 2,782 2.3 2.3 2.3 2.3 2.3 1.8
INDUSTRY
Total private. . . . . . . . . . . . . . . . . . . . . . . . . . . . . . . . . . . 3,347 3,341 3,331 3,399 3,245 2,605 2.6 2.6 2.6 2.6 2.5 2.0
Mining and logging.. . . . . . . . . . . . . . . . . . . . . . . . 21 14 13 14 12 10 2.8 1.9 1.8 1.9 1.7 1.4
Construction. . . . . . . . . . . . . . . . . . . . . . . . . . . . . . . . 146 164 170 165 153 130 2.0 2.2 2.2 2.2 2.0 1.7
Manufacturing. . . . . . . . . . . . . . . . . . . . . . . . . . . . . . 221 201 206 188 183 142 1.7 1.6 1.6 1.5 1.4 1.1
Durable goods. . . . . . . . . . . . . . . . . . . . . . . . . . . 116 107 110 103 107 85 1.4 1.3 1.4 1.3 1.3 1.1
Nondurable goods.. . . . . . . . . . . . . . . . . . . . . . 105 94 97 84 75 57 2.2 2.0 2.0 1.8 1.6 1.2
Trade, transportation, and utilities. . . . . . . 744 802 734 831 794 603 2.7 2.9 2.6 3.0 2.9 2.2
Wholesale trade. . . . . . . . . . . . . . . . . . . . . . . . . 97 89 77 86 101 83 1.6 1.5 1.3 1.4 1.7 1.4
Retail trade.. . . . . . . . . . . . . . . . . . . . . . . . . . . . . . 514 577 507 597 546 409 3.3 3.7 3.2 3.8 3.5 2.6
Transportation, warehousing, andutilities. . . . . . . . . . . . . . . . . . . . . . . . . . . . . . . . . . 133 135 150 148 147 111 2.2 2.2 2.4 2.4 2.4 1.8
Information. . . . . . . . . . . . . . . . . . . . . . . . . . . . . . . . . . 48 43 41 40 50 38 1.7 1.5 1.4 1.4 1.7 1.3
Financial activities. . . . . . . . . . . . . . . . . . . . . . . . . 100 148 127 145 123 100 1.2 1.7 1.4 1.6 1.4 1.1
Finance and insurance. . . . . . . . . . . . . . . . . 65 102 88 89 88 75 1.0 1.6 1.4 1.4 1.4 1.2
Real estate and rental and leasing3.. . 35 46 40 57 35 25 1.5 1.9 1.7 2.4 1.5 1.0
Professional and business services. . . . . 697 636 622 684 628 574 3.3 3.0 2.9 3.2 2.9 2.7
Education and health services. . . . . . . . . . . 486 462 500 476 478 426 2.0 1.9 2.0 1.9 1.9 1.7
Educational services. . . . . . . . . . . . . . . . . . . . 49 53 66 55 58 50 1.3 1.4 1.7 1.4 1.5 1.3
Health care and social assistance. . . . 437 409 434 421 420 376 2.2 2.0 2.1 2.0 2.0 1.8
Leisure and hospitality. . . . . . . . . . . . . . . . . . . . 747 736 771 758 699 529 4.5 4.4 4.6 4.5 4.2 3.2
Arts, entertainment, and recreation. . . 81 86 72 79 77 51 3.3 3.5 2.9 3.2 3.1 2.1
Accommodation and food services. . . 666 650 698 679 622 477 4.7 4.6 4.9 4.7 4.3 3.4
Other services. . . . . . . . . . . . . . . . . . . . . . . . . . . . . . 137 134 147 98 125 53 2.3 2.3 2.5 1.6 2.1 0.9
Government. . . . . . . . . . . . . . . . . . . . . . . . . . . . . . . . . . . 178 188 197 175 191 177 0.8 0.8 0.9 0.8 0.8 0.8
Federal. . . . . . . . . . . . . . . . . . . . . . . . . . . . . . . . . . . . . . 20 17 23 19 19 18 0.7 0.6 0.8 0.7 0.7 0.6
State and local. . . . . . . . . . . . . . . . . . . . . . . . . . . . . 158 171 174 156 172 159 0.8 0.9 0.9 0.8 0.9 0.8
State and local education. . . . . . . . . . . . . . 91 90 98 83 90 82 0.9 0.9 0.9 0.8 0.9 0.8
State and local, excludingeducation. . . . . . . . . . . . . . . . . . . . . . . . . . . . . . 67 81 76 73 82 78 0.7 0.9 0.8 0.8 0.9 0.8
REGION4
Northeast. . . . . . . . . . . . . . . . . . . . . . . . . . . . . . . . . . . . . . 519 478 462 492 494 401 1.9 1.7 1.7 1.8 1.8 1.4
South. . . . . . . . . . . . . . . . . . . . . . . . . . . . . . . . . . . . . . . . . . . 1,464 1,429 1,452 1,494 1,347 1,091 2.7 2.6 2.6 2.7 2.4 2.0
Midwest. . . . . . . . . . . . . . . . . . . . . . . . . . . . . . . . . . . . . . . . 749 777 760 797 783 654 2.3 2.4 2.3 2.4 2.4 2.0
West. . . . . . . . . . . . . . . . . . . . . . . . . . . . . . . . . . . . . . . . . . . . 794 844 854 790 812 636 2.3 2.4 2.4 2.2 2.3 1.8
1 Quits are the number of quits during the entire month.2 The quits rate is the number of quits during the entire month as a percent of total employment.3 No regular seasonal movements could be identified in this series; therefore, identical numbers appear for the unadjusted and seasonally adjusted
series.4 The states (including the District of Columbia) that comprise the regions are: Northeast: Connecticut, Maine, Massachusetts, New Hampshire, New
Jersey, New York, Pennsylvania, Rhode Island, and Vermont; South: Alabama, Arkansas, Delaware, District of Columbia, Florida, Georgia,Kentucky, Louisiana, Maryland, Mississippi, North Carolina, Oklahoma, South Carolina, Tennessee, Texas, Virginia, and West Virginia; Midwest:Illinois, Indiana, Iowa, Kansas, Michigan, Minnesota, Missouri, Nebraska, North Dakota, Ohio, South Dakota, and Wisconsin; West: Alaska, Arizona,California, Colorado, Hawaii, Idaho, Montana, Nevada, New Mexico, Oregon, Utah, Washington, and Wyoming.
p Preliminary

Table 5. Layoffs and discharges levels and rates by industry and region, seasonally adjusted1
Industry and region
Levels (in thousands) Rates2
Mar.2019
Nov.2019
Dec.2019
Jan.2020
Feb.2020
Mar.2020p
Mar.2019
Nov.2019
Dec.2019
Jan.2020
Feb.2020
Mar.2020p
Total. . . . . . . . . . . . . . . . . . . . . . . . . . . . . . . . . . . . . . . . . . . . . . . 1,698 1,769 1,893 1,741 1,846 11,372 1.1 1.2 1.2 1.1 1.2 7.5
INDUSTRY
Total private. . . . . . . . . . . . . . . . . . . . . . . . . . . . . . . . . . . 1,596 1,672 1,815 1,659 1,752 11,197 1.2 1.3 1.4 1.3 1.4 8.7
Mining and logging.. . . . . . . . . . . . . . . . . . . . . . . . 13 14 17 9 6 32 1.8 1.9 2.3 1.2 0.8 4.5
Construction. . . . . . . . . . . . . . . . . . . . . . . . . . . . . . . . 179 233 243 194 202 618 2.4 3.1 3.2 2.6 2.6 8.1
Manufacturing. . . . . . . . . . . . . . . . . . . . . . . . . . . . . . 123 95 110 115 113 566 1.0 0.7 0.9 0.9 0.9 4.4
Durable goods. . . . . . . . . . . . . . . . . . . . . . . . . . . 76 62 67 64 63 371 0.9 0.8 0.8 0.8 0.8 4.6
Nondurable goods.. . . . . . . . . . . . . . . . . . . . . . 47 33 43 51 49 195 1.0 0.7 0.9 1.1 1.0 4.1
Trade, transportation, and utilities. . . . . . . 310 311 323 325 363 1,649 1.1 1.1 1.2 1.2 1.3 5.9
Wholesale trade3. . . . . . . . . . . . . . . . . . . . . . . . 33 46 35 47 47 228 0.6 0.8 0.6 0.8 0.8 3.8
Retail trade.. . . . . . . . . . . . . . . . . . . . . . . . . . . . . . 189 185 197 193 224 1,132 1.2 1.2 1.3 1.2 1.4 7.2
Transportation, warehousing, andutilities. . . . . . . . . . . . . . . . . . . . . . . . . . . . . . . . . . 88 81 90 85 91 289 1.4 1.3 1.5 1.4 1.5 4.6
Information. . . . . . . . . . . . . . . . . . . . . . . . . . . . . . . . . . 36 33 37 24 32 62 1.3 1.2 1.3 0.8 1.1 2.1
Financial activities. . . . . . . . . . . . . . . . . . . . . . . . . 35 44 48 40 67 218 0.4 0.5 0.5 0.5 0.8 2.5
Finance and insurance. . . . . . . . . . . . . . . . . 22 20 24 31 42 74 0.3 0.3 0.4 0.5 0.7 1.1
Real estate and rental and leasing. . . 13 23 24 9 25 144 0.6 1.0 1.0 0.4 1.0 6.1
Professional and business services. . . . . 399 434 454 413 392 945 1.9 2.0 2.1 1.9 1.8 4.4
Education and health services. . . . . . . . . . . 167 165 150 160 167 1,223 0.7 0.7 0.6 0.7 0.7 5.0
Educational services. . . . . . . . . . . . . . . . . . . . 36 31 26 22 30 268 1.0 0.8 0.7 0.6 0.8 7.0
Health care and social assistance. . . . 131 134 124 139 136 955 0.6 0.6 0.6 0.7 0.7 4.6
Leisure and hospitality. . . . . . . . . . . . . . . . . . . . 275 298 342 295 318 4,897 1.7 1.8 2.0 1.8 1.9 29.9
Arts, entertainment, and recreation. . . 56 84 108 90 77 521 2.3 3.4 4.3 3.6 3.1 21.2
Accommodation and food services. . . 220 214 234 205 240 4,376 1.6 1.5 1.6 1.4 1.7 31.4
Other services. . . . . . . . . . . . . . . . . . . . . . . . . . . . . . 58 44 91 84 93 987 1.0 0.7 1.5 1.4 1.6 16.7
Government. . . . . . . . . . . . . . . . . . . . . . . . . . . . . . . . . . . 102 98 78 82 95 175 0.5 0.4 0.3 0.4 0.4 0.8
Federal. . . . . . . . . . . . . . . . . . . . . . . . . . . . . . . . . . . . . . 6 12 9 8 8 9 0.2 0.4 0.3 0.3 0.3 0.3
State and local. . . . . . . . . . . . . . . . . . . . . . . . . . . . . 96 86 69 74 86 166 0.5 0.4 0.3 0.4 0.4 0.8
State and local education. . . . . . . . . . . . . . 44 41 40 41 42 78 0.4 0.4 0.4 0.4 0.4 0.7
State and local, excludingeducation. . . . . . . . . . . . . . . . . . . . . . . . . . . . . . 51 44 29 33 44 88 0.6 0.5 0.3 0.4 0.5 0.9
REGION4
Northeast. . . . . . . . . . . . . . . . . . . . . . . . . . . . . . . . . . . . . . 301 362 347 354 348 2,375 1.1 1.3 1.2 1.3 1.2 8.5
South. . . . . . . . . . . . . . . . . . . . . . . . . . . . . . . . . . . . . . . . . . . 716 587 692 601 624 3,655 1.3 1.1 1.2 1.1 1.1 6.6
Midwest. . . . . . . . . . . . . . . . . . . . . . . . . . . . . . . . . . . . . . . . 329 390 389 382 440 2,851 1.0 1.2 1.2 1.2 1.3 8.6
West. . . . . . . . . . . . . . . . . . . . . . . . . . . . . . . . . . . . . . . . . . . . 352 430 464 404 435 2,491 1.0 1.2 1.3 1.1 1.2 7.1
1 Layoffs and discharges are the number of layoffs and discharges during the entire month.2 The layoffs and discharges rate is the number of layoffs and discharges during the entire month as a percent of total employment.3 No regular seasonal movements could be identified in this series; therefore, identical numbers appear for the unadjusted and seasonally adjusted
series.4 The states (including the District of Columbia) that comprise the regions are: Northeast: Connecticut, Maine, Massachusetts, New Hampshire, New
Jersey, New York, Pennsylvania, Rhode Island, and Vermont; South: Alabama, Arkansas, Delaware, District of Columbia, Florida, Georgia,Kentucky, Louisiana, Maryland, Mississippi, North Carolina, Oklahoma, South Carolina, Tennessee, Texas, Virginia, and West Virginia; Midwest:Illinois, Indiana, Iowa, Kansas, Michigan, Minnesota, Missouri, Nebraska, North Dakota, Ohio, South Dakota, and Wisconsin; West: Alaska, Arizona,California, Colorado, Hawaii, Idaho, Montana, Nevada, New Mexico, Oregon, Utah, Washington, and Wyoming.
p Preliminary

Table 6. Other separations levels and rates by industry and region, seasonally adjusted1
Industry and region
Levels (in thousands) Rates2
Mar.2019
Nov.2019
Dec.2019
Jan.2020
Feb.2020
Mar.2020p
Mar.2019
Nov.2019
Dec.2019
Jan.2020
Feb.2020
Mar.2020p
Total. . . . . . . . . . . . . . . . . . . . . . . . . . . . . . . . . . . . . . . . . . . . . . . 330 359 341 388 313 363 0.2 0.2 0.2 0.3 0.2 0.2
INDUSTRY
Total private. . . . . . . . . . . . . . . . . . . . . . . . . . . . . . . . . . . 269 294 272 323 247 304 0.2 0.2 0.2 0.2 0.2 0.2
Mining and logging.. . . . . . . . . . . . . . . . . . . . . . . . 1 1 1 2 2 1 0.2 0.2 0.2 0.2 0.3 0.2
Construction3. . . . . . . . . . . . . . . . . . . . . . . . . . . . . . . 20 18 19 27 5 14 0.3 0.2 0.3 0.4 0.1 0.2
Manufacturing. . . . . . . . . . . . . . . . . . . . . . . . . . . . . . 20 21 26 28 23 24 0.2 0.2 0.2 0.2 0.2 0.2
Durable goods. . . . . . . . . . . . . . . . . . . . . . . . . . . 10 14 16 16 13 14 0.1 0.2 0.2 0.2 0.2 0.2
Nondurable goods3. . . . . . . . . . . . . . . . . . . . . . 10 7 9 12 10 10 0.2 0.1 0.2 0.2 0.2 0.2
Trade, transportation, and utilities. . . . . . . 53 85 58 64 64 75 0.2 0.3 0.2 0.2 0.2 0.3
Wholesale trade. . . . . . . . . . . . . . . . . . . . . . . . . 6 12 10 5 6 9 0.1 0.2 0.2 0.1 0.1 0.2
Retail trade.. . . . . . . . . . . . . . . . . . . . . . . . . . . . . . 31 54 38 40 42 51 0.2 0.3 0.2 0.3 0.3 0.3
Transportation, warehousing, andutilities3. . . . . . . . . . . . . . . . . . . . . . . . . . . . . . . . . 15 20 10 19 16 15 0.2 0.3 0.2 0.3 0.3 0.2
Information3. . . . . . . . . . . . . . . . . . . . . . . . . . . . . . . . . 10 3 6 11 5 13 0.3 0.1 0.2 0.4 0.2 0.4
Financial activities. . . . . . . . . . . . . . . . . . . . . . . . . 35 22 27 31 19 29 0.4 0.2 0.3 0.3 0.2 0.3
Finance and insurance. . . . . . . . . . . . . . . . . 31 21 22 22 19 23 0.5 0.3 0.3 0.3 0.3 0.4
Real estate and rental and leasing3.. . 5 1 5 9 1 6 0.2 0.0 0.2 0.4 0.0 0.2
Professional and business services. . . . . 57 60 58 54 53 54 0.3 0.3 0.3 0.2 0.2 0.3
Education and health services. . . . . . . . . . . 49 36 39 65 55 46 0.2 0.1 0.2 0.3 0.2 0.2
Educational services. . . . . . . . . . . . . . . . . . . . 5 4 4 7 4 4 0.1 0.1 0.1 0.2 0.1 0.1
Health care and social assistance3. . . 44 31 35 58 51 42 0.2 0.2 0.2 0.3 0.2 0.2
Leisure and hospitality. . . . . . . . . . . . . . . . . . . . 17 29 34 37 19 28 0.1 0.2 0.2 0.2 0.1 0.2
Arts, entertainment, and recreation3.. . 3 5 3 3 2 2 0.1 0.2 0.1 0.1 0.1 0.1
Accommodation and food services3.. . 14 24 30 34 17 26 0.1 0.2 0.2 0.2 0.1 0.2
Other services3. . . . . . . . . . . . . . . . . . . . . . . . . . . . . 7 19 4 5 2 19 0.1 0.3 0.1 0.1 0.0 0.3
Government. . . . . . . . . . . . . . . . . . . . . . . . . . . . . . . . . . . 61 65 68 64 66 59 0.3 0.3 0.3 0.3 0.3 0.3
Federal. . . . . . . . . . . . . . . . . . . . . . . . . . . . . . . . . . . . . . 12 12 13 12 14 13 0.4 0.4 0.5 0.4 0.5 0.5
State and local. . . . . . . . . . . . . . . . . . . . . . . . . . . . . 49 52 56 53 52 46 0.3 0.3 0.3 0.3 0.3 0.2
State and local education. . . . . . . . . . . . . . 25 25 27 25 23 22 0.2 0.2 0.3 0.2 0.2 0.2
State and local, excludingeducation. . . . . . . . . . . . . . . . . . . . . . . . . . . . . . 25 27 29 28 29 24 0.3 0.3 0.3 0.3 0.3 0.3
REGION4
Northeast. . . . . . . . . . . . . . . . . . . . . . . . . . . . . . . . . . . . . . 49 69 77 65 46 59 0.2 0.2 0.3 0.2 0.2 0.2
South. . . . . . . . . . . . . . . . . . . . . . . . . . . . . . . . . . . . . . . . . . . 133 132 104 156 126 127 0.2 0.2 0.2 0.3 0.2 0.2
Midwest. . . . . . . . . . . . . . . . . . . . . . . . . . . . . . . . . . . . . . . . 67 67 71 70 70 82 0.2 0.2 0.2 0.2 0.2 0.2
West. . . . . . . . . . . . . . . . . . . . . . . . . . . . . . . . . . . . . . . . . . . . 81 91 88 97 71 94 0.2 0.3 0.2 0.3 0.2 0.3
1 Other separations are the number of other separations during the entire month.2 The other separations rate is the number of other separations during the entire month as a percent of total employment.3 No regular seasonal movements could be identified in this series; therefore, identical numbers appear for the unadjusted and seasonally adjusted
series.4 The states (including the District of Columbia) that comprise the regions are: Northeast: Connecticut, Maine, Massachusetts, New Hampshire, New
Jersey, New York, Pennsylvania, Rhode Island, and Vermont; South: Alabama, Arkansas, Delaware, District of Columbia, Florida, Georgia,Kentucky, Louisiana, Maryland, Mississippi, North Carolina, Oklahoma, South Carolina, Tennessee, Texas, Virginia, and West Virginia; Midwest:Illinois, Indiana, Iowa, Kansas, Michigan, Minnesota, Missouri, Nebraska, North Dakota, Ohio, South Dakota, and Wisconsin; West: Alaska, Arizona,California, Colorado, Hawaii, Idaho, Montana, Nevada, New Mexico, Oregon, Utah, Washington, and Wyoming.
p Preliminary
NOTE: Levels are rounded to the nearest thousand and rates are rounded to the nearest tenth. Levels and rates may round down to zero.

Table 7. Job openings levels and rates by industry and region, not seasonally adjusted1
Industry and region
Levels (in thousands) Rates2
Mar.2019
Feb.2020
Mar.2020p
Mar.2019
Feb.2020
Mar.2020p
Total. . . . . . . . . . . . . . . . . . . . . . . . . . . . . . . . . . . . . . . . . . . . . . . . . . . . . . . . . . . . . . . . . . . . . 7,302 6,761 6,060 4.7 4.3 3.9
INDUSTRY
Total private. . . . . . . . . . . . . . . . . . . . . . . . . . . . . . . . . . . . . . . . . . . . . . . . . . . . . . . . . . 6,578 6,009 5,343 4.9 4.5 4.0
Mining and logging. . . . . . . . . . . . . . . . . . . . . . . . . . . . . . . . . . . . . . . . . . . . . . . 30 26 14 3.9 3.5 2.0
Construction.. . . . . . . . . . . . . . . . . . . . . . . . . . . . . . . . . . . . . . . . . . . . . . . . . . . . . . 354 296 243 4.7 3.9 3.2
Manufacturing. . . . . . . . . . . . . . . . . . . . . . . . . . . . . . . . . . . . . . . . . . . . . . . . . . . . . 441 422 320 3.3 3.2 2.4
Durable goods.. . . . . . . . . . . . . . . . . . . . . . . . . . . . . . . . . . . . . . . . . . . . . . . . . 286 269 187 3.4 3.2 2.3
Nondurable goods. . . . . . . . . . . . . . . . . . . . . . . . . . . . . . . . . . . . . . . . . . . . . 155 153 132 3.2 3.1 2.7
Trade, transportation, and utilities. . . . . . . . . . . . . . . . . . . . . . . . . . . . . . 1,235 1,046 990 4.3 3.7 3.5
Wholesale trade.. . . . . . . . . . . . . . . . . . . . . . . . . . . . . . . . . . . . . . . . . . . . . . . 215 176 156 3.5 2.9 2.6
Retail trade. . . . . . . . . . . . . . . . . . . . . . . . . . . . . . . . . . . . . . . . . . . . . . . . . . . . . 688 600 613 4.3 3.7 3.8
Transportation, warehousing, and utilities. . . . . . . . . . . . . . . . . . 332 270 222 5.2 4.2 3.5
Information. . . . . . . . . . . . . . . . . . . . . . . . . . . . . . . . . . . . . . . . . . . . . . . . . . . . . . . . 146 132 126 4.9 4.4 4.2
Financial activities. . . . . . . . . . . . . . . . . . . . . . . . . . . . . . . . . . . . . . . . . . . . . . . . 345 383 316 3.8 4.2 3.5
Finance and insurance.. . . . . . . . . . . . . . . . . . . . . . . . . . . . . . . . . . . . . . . 227 289 244 3.4 4.3 3.6
Real estate and rental and leasing. . . . . . . . . . . . . . . . . . . . . . . . . . 118 94 72 4.9 3.9 3.0
Professional and business services. . . . . . . . . . . . . . . . . . . . . . . . . . . . 1,334 1,314 1,198 6.0 5.8 5.3
Education and health services. . . . . . . . . . . . . . . . . . . . . . . . . . . . . . . . . . 1,366 1,224 1,205 5.4 4.7 4.7
Educational services. . . . . . . . . . . . . . . . . . . . . . . . . . . . . . . . . . . . . . . . . . 108 121 111 2.7 2.9 2.7
Health care and social assistance.. . . . . . . . . . . . . . . . . . . . . . . . . . 1,257 1,103 1,094 5.9 5.1 5.0
Leisure and hospitality. . . . . . . . . . . . . . . . . . . . . . . . . . . . . . . . . . . . . . . . . . . 1,068 948 742 6.2 5.5 4.4
Arts, entertainment, and recreation.. . . . . . . . . . . . . . . . . . . . . . . . . 119 146 156 5.0 6.1 6.4
Accommodation and food services. . . . . . . . . . . . . . . . . . . . . . . . . . 948 802 585 6.4 5.4 4.1
Other services. . . . . . . . . . . . . . . . . . . . . . . . . . . . . . . . . . . . . . . . . . . . . . . . . . . . 261 218 188 4.3 3.6 3.1
Government. . . . . . . . . . . . . . . . . . . . . . . . . . . . . . . . . . . . . . . . . . . . . . . . . . . . . . . . . . 724 752 717 3.1 3.2 3.0
Federal. . . . . . . . . . . . . . . . . . . . . . . . . . . . . . . . . . . . . . . . . . . . . . . . . . . . . . . . . . . . . 136 119 125 4.6 4.0 4.2
State and local. . . . . . . . . . . . . . . . . . . . . . . . . . . . . . . . . . . . . . . . . . . . . . . . . . . . 589 633 592 2.8 3.0 2.8
State and local education.. . . . . . . . . . . . . . . . . . . . . . . . . . . . . . . . . . . . 211 236 204 1.9 2.1 1.8
State and local, excluding education. . . . . . . . . . . . . . . . . . . . . . . . 378 397 389 4.0 4.1 4.0
REGION3
Northeast. . . . . . . . . . . . . . . . . . . . . . . . . . . . . . . . . . . . . . . . . . . . . . . . . . . . . . . . . . . . . 1,191 1,175 1,126 4.2 4.1 3.9
South. . . . . . . . . . . . . . . . . . . . . . . . . . . . . . . . . . . . . . . . . . . . . . . . . . . . . . . . . . . . . . . . . 2,776 2,527 2,334 4.8 4.4 4.1
Midwest. . . . . . . . . . . . . . . . . . . . . . . . . . . . . . . . . . . . . . . . . . . . . . . . . . . . . . . . . . . . . . . 1,679 1,519 1,302 4.9 4.4 3.8
West. . . . . . . . . . . . . . . . . . . . . . . . . . . . . . . . . . . . . . . . . . . . . . . . . . . . . . . . . . . . . . . . . . 1,657 1,540 1,299 4.6 4.2 3.6
1 Job openings are the number of job openings on the last business day of the month.2 The job openings rate is the number of job openings on the last business day of the month as a percent of total employment plus job openings.3 The states (including the District of Columbia) that comprise the regions are: Northeast: Connecticut, Maine, Massachusetts, New Hampshire, New
Jersey, New York, Pennsylvania, Rhode Island, and Vermont; South: Alabama, Arkansas, Delaware, District of Columbia, Florida, Georgia,Kentucky, Louisiana, Maryland, Mississippi, North Carolina, Oklahoma, South Carolina, Tennessee, Texas, Virginia, and West Virginia; Midwest:Illinois, Indiana, Iowa, Kansas, Michigan, Minnesota, Missouri, Nebraska, North Dakota, Ohio, South Dakota, and Wisconsin; West: Alaska, Arizona,California, Colorado, Hawaii, Idaho, Montana, Nevada, New Mexico, Oregon, Utah, Washington, and Wyoming.
p Preliminary

Table 8. Hires levels and rates by industry and region, not seasonally adjusted1
Industry and region
Levels (in thousands) Rates2
Mar.2019
Feb.2020
Mar.2020p
Mar.2019
Feb.2020
Mar.2020p
Total. . . . . . . . . . . . . . . . . . . . . . . . . . . . . . . . . . . . . . . . . . . . . . . . . . . . . . . . . . . . . . . . . . . . . 5,330 4,901 4,750 3.6 3.2 3.1
INDUSTRY
Total private. . . . . . . . . . . . . . . . . . . . . . . . . . . . . . . . . . . . . . . . . . . . . . . . . . . . . . . . . . 5,071 4,612 4,474 4.0 3.6 3.5
Mining and logging. . . . . . . . . . . . . . . . . . . . . . . . . . . . . . . . . . . . . . . . . . . . . . . 34 21 18 4.7 3.0 2.6
Construction.. . . . . . . . . . . . . . . . . . . . . . . . . . . . . . . . . . . . . . . . . . . . . . . . . . . . . . 350 324 380 4.9 4.5 5.2
Manufacturing. . . . . . . . . . . . . . . . . . . . . . . . . . . . . . . . . . . . . . . . . . . . . . . . . . . . . 335 304 282 2.6 2.4 2.2
Durable goods.. . . . . . . . . . . . . . . . . . . . . . . . . . . . . . . . . . . . . . . . . . . . . . . . . 180 179 155 2.2 2.2 1.9
Nondurable goods. . . . . . . . . . . . . . . . . . . . . . . . . . . . . . . . . . . . . . . . . . . . . 154 125 127 3.3 2.6 2.7
Trade, transportation, and utilities. . . . . . . . . . . . . . . . . . . . . . . . . . . . . . 1,013 984 1,083 3.7 3.6 3.9
Wholesale trade.. . . . . . . . . . . . . . . . . . . . . . . . . . . . . . . . . . . . . . . . . . . . . . . 132 135 122 2.2 2.3 2.1
Retail trade. . . . . . . . . . . . . . . . . . . . . . . . . . . . . . . . . . . . . . . . . . . . . . . . . . . . . 694 656 784 4.5 4.2 5.1
Transportation, warehousing, and utilities. . . . . . . . . . . . . . . . . . 187 194 178 3.1 3.1 2.9
Information. . . . . . . . . . . . . . . . . . . . . . . . . . . . . . . . . . . . . . . . . . . . . . . . . . . . . . . . 92 83 71 3.2 2.9 2.5
Financial activities. . . . . . . . . . . . . . . . . . . . . . . . . . . . . . . . . . . . . . . . . . . . . . . . 177 212 203 2.0 2.4 2.3
Finance and insurance.. . . . . . . . . . . . . . . . . . . . . . . . . . . . . . . . . . . . . . . 121 148 145 1.9 2.3 2.2
Real estate and rental and leasing. . . . . . . . . . . . . . . . . . . . . . . . . . 56 65 58 2.5 2.8 2.5
Professional and business services. . . . . . . . . . . . . . . . . . . . . . . . . . . . 1,115 974 1,013 5.3 4.6 4.8
Education and health services. . . . . . . . . . . . . . . . . . . . . . . . . . . . . . . . . . 691 663 611 2.9 2.7 2.5
Educational services. . . . . . . . . . . . . . . . . . . . . . . . . . . . . . . . . . . . . . . . . . 58 73 64 1.5 1.8 1.6
Health care and social assistance.. . . . . . . . . . . . . . . . . . . . . . . . . . 633 591 548 3.1 2.9 2.6
Leisure and hospitality. . . . . . . . . . . . . . . . . . . . . . . . . . . . . . . . . . . . . . . . . . . 1,087 870 697 6.8 5.4 4.4
Arts, entertainment, and recreation.. . . . . . . . . . . . . . . . . . . . . . . . . 167 117 134 7.4 5.2 5.9
Accommodation and food services. . . . . . . . . . . . . . . . . . . . . . . . . . 920 754 562 6.7 5.4 4.1
Other services. . . . . . . . . . . . . . . . . . . . . . . . . . . . . . . . . . . . . . . . . . . . . . . . . . . . 178 176 116 3.1 3.0 2.0
Government. . . . . . . . . . . . . . . . . . . . . . . . . . . . . . . . . . . . . . . . . . . . . . . . . . . . . . . . . . 259 290 276 1.1 1.3 1.2
Federal. . . . . . . . . . . . . . . . . . . . . . . . . . . . . . . . . . . . . . . . . . . . . . . . . . . . . . . . . . . . . 38 46 58 1.4 1.6 2.0
State and local. . . . . . . . . . . . . . . . . . . . . . . . . . . . . . . . . . . . . . . . . . . . . . . . . . . . 221 244 218 1.1 1.2 1.1
State and local education.. . . . . . . . . . . . . . . . . . . . . . . . . . . . . . . . . . . . 96 117 85 0.9 1.1 0.8
State and local, excluding education. . . . . . . . . . . . . . . . . . . . . . . . 125 127 133 1.4 1.4 1.4
REGION3
Northeast. . . . . . . . . . . . . . . . . . . . . . . . . . . . . . . . . . . . . . . . . . . . . . . . . . . . . . . . . . . . . 811 734 748 3.0 2.6 2.7
South. . . . . . . . . . . . . . . . . . . . . . . . . . . . . . . . . . . . . . . . . . . . . . . . . . . . . . . . . . . . . . . . . 2,226 2,027 1,890 4.1 3.7 3.4
Midwest. . . . . . . . . . . . . . . . . . . . . . . . . . . . . . . . . . . . . . . . . . . . . . . . . . . . . . . . . . . . . . . 1,120 985 1,029 3.4 3.0 3.1
West. . . . . . . . . . . . . . . . . . . . . . . . . . . . . . . . . . . . . . . . . . . . . . . . . . . . . . . . . . . . . . . . . . 1,173 1,156 1,082 3.4 3.3 3.1
1 Hires are the number of hires during the entire month.2 The hires rate is the number of hires during the entire month as a percent of total employment.3 The states (including the District of Columbia) that comprise the regions are: Northeast: Connecticut, Maine, Massachusetts, New Hampshire, New
Jersey, New York, Pennsylvania, Rhode Island, and Vermont; South: Alabama, Arkansas, Delaware, District of Columbia, Florida, Georgia,Kentucky, Louisiana, Maryland, Mississippi, North Carolina, Oklahoma, South Carolina, Tennessee, Texas, Virginia, and West Virginia; Midwest:Illinois, Indiana, Iowa, Kansas, Michigan, Minnesota, Missouri, Nebraska, North Dakota, Ohio, South Dakota, and Wisconsin; West: Alaska, Arizona,California, Colorado, Hawaii, Idaho, Montana, Nevada, New Mexico, Oregon, Utah, Washington, and Wyoming.
p Preliminary

Table 9. Total separations levels and rates by industry and region, not seasonally adjusted1
Industry and region
Levels (in thousands) Rates2
Mar.2019
Feb.2020
Mar.2020p
Mar.2019
Feb.2020
Mar.2020p
Total. . . . . . . . . . . . . . . . . . . . . . . . . . . . . . . . . . . . . . . . . . . . . . . . . . . . . . . . . . . . . . . . . . . . . 4,909 4,531 13,808 3.3 3.0 9.2
INDUSTRY
Total private. . . . . . . . . . . . . . . . . . . . . . . . . . . . . . . . . . . . . . . . . . . . . . . . . . . . . . . . . . 4,678 4,300 13,517 3.7 3.4 10.6
Mining and logging. . . . . . . . . . . . . . . . . . . . . . . . . . . . . . . . . . . . . . . . . . . . . . . 35 22 43 4.8 3.1 6.1
Construction.. . . . . . . . . . . . . . . . . . . . . . . . . . . . . . . . . . . . . . . . . . . . . . . . . . . . . . 309 277 708 4.3 3.8 9.7
Manufacturing. . . . . . . . . . . . . . . . . . . . . . . . . . . . . . . . . . . . . . . . . . . . . . . . . . . . . 344 279 710 2.7 2.2 5.6
Durable goods.. . . . . . . . . . . . . . . . . . . . . . . . . . . . . . . . . . . . . . . . . . . . . . . . . 190 160 458 2.4 2.0 5.7
Nondurable goods. . . . . . . . . . . . . . . . . . . . . . . . . . . . . . . . . . . . . . . . . . . . . 154 118 252 3.2 2.5 5.3
Trade, transportation, and utilities. . . . . . . . . . . . . . . . . . . . . . . . . . . . . . 986 1,029 2,202 3.6 3.7 8.0
Wholesale trade.. . . . . . . . . . . . . . . . . . . . . . . . . . . . . . . . . . . . . . . . . . . . . . . 136 134 319 2.3 2.3 5.4
Retail trade. . . . . . . . . . . . . . . . . . . . . . . . . . . . . . . . . . . . . . . . . . . . . . . . . . . . . 648 683 1,499 4.2 4.4 9.7
Transportation, warehousing, and utilities. . . . . . . . . . . . . . . . . . 202 212 385 3.3 3.4 6.3
Information. . . . . . . . . . . . . . . . . . . . . . . . . . . . . . . . . . . . . . . . . . . . . . . . . . . . . . . . 84 76 102 3.0 2.6 3.5
Financial activities. . . . . . . . . . . . . . . . . . . . . . . . . . . . . . . . . . . . . . . . . . . . . . . . 155 184 328 1.8 2.1 3.7
Finance and insurance.. . . . . . . . . . . . . . . . . . . . . . . . . . . . . . . . . . . . . . . 108 130 159 1.7 2.0 2.5
Real estate and rental and leasing. . . . . . . . . . . . . . . . . . . . . . . . . . 48 54 169 2.1 2.3 7.3
Professional and business services. . . . . . . . . . . . . . . . . . . . . . . . . . . . 1,077 918 1,487 5.2 4.3 7.0
Education and health services. . . . . . . . . . . . . . . . . . . . . . . . . . . . . . . . . . 646 585 1,642 2.7 2.4 6.7
Educational services. . . . . . . . . . . . . . . . . . . . . . . . . . . . . . . . . . . . . . . . . . 54 56 283 1.4 1.4 7.1
Health care and social assistance.. . . . . . . . . . . . . . . . . . . . . . . . . . 592 529 1,359 2.9 2.6 6.6
Leisure and hospitality. . . . . . . . . . . . . . . . . . . . . . . . . . . . . . . . . . . . . . . . . . . 869 769 5,262 5.4 4.7 32.9
Arts, entertainment, and recreation.. . . . . . . . . . . . . . . . . . . . . . . . . 100 77 522 4.4 3.4 22.8
Accommodation and food services. . . . . . . . . . . . . . . . . . . . . . . . . . 769 692 4,740 5.6 4.9 34.6
Other services. . . . . . . . . . . . . . . . . . . . . . . . . . . . . . . . . . . . . . . . . . . . . . . . . . . . 172 162 1,034 3.0 2.7 17.6
Government. . . . . . . . . . . . . . . . . . . . . . . . . . . . . . . . . . . . . . . . . . . . . . . . . . . . . . . . . . 232 230 291 1.0 1.0 1.3
Federal. . . . . . . . . . . . . . . . . . . . . . . . . . . . . . . . . . . . . . . . . . . . . . . . . . . . . . . . . . . . . 35 36 36 1.3 1.3 1.3
State and local. . . . . . . . . . . . . . . . . . . . . . . . . . . . . . . . . . . . . . . . . . . . . . . . . . . . 196 194 254 1.0 1.0 1.3
State and local education.. . . . . . . . . . . . . . . . . . . . . . . . . . . . . . . . . . . . 87 83 101 0.8 0.8 0.9
State and local, excluding education. . . . . . . . . . . . . . . . . . . . . . . . 109 111 154 1.2 1.2 1.7
REGION3
Northeast. . . . . . . . . . . . . . . . . . . . . . . . . . . . . . . . . . . . . . . . . . . . . . . . . . . . . . . . . . . . . 711 641 2,669 2.6 2.3 9.6
South. . . . . . . . . . . . . . . . . . . . . . . . . . . . . . . . . . . . . . . . . . . . . . . . . . . . . . . . . . . . . . . . . 2,096 1,776 4,649 3.8 3.2 8.4
Midwest. . . . . . . . . . . . . . . . . . . . . . . . . . . . . . . . . . . . . . . . . . . . . . . . . . . . . . . . . . . . . . . 999 1,051 3,419 3.1 3.2 10.4
West. . . . . . . . . . . . . . . . . . . . . . . . . . . . . . . . . . . . . . . . . . . . . . . . . . . . . . . . . . . . . . . . . . 1,103 1,063 3,071 3.2 3.0 8.8
1 Total separations are the number of total separations during the entire month.2 The total separations rate is the number of total separations during the entire month as a percent of total employment.3 The states (including the District of Columbia) that comprise the regions are: Northeast: Connecticut, Maine, Massachusetts, New Hampshire, New
Jersey, New York, Pennsylvania, Rhode Island, and Vermont; South: Alabama, Arkansas, Delaware, District of Columbia, Florida, Georgia,Kentucky, Louisiana, Maryland, Mississippi, North Carolina, Oklahoma, South Carolina, Tennessee, Texas, Virginia, and West Virginia; Midwest:Illinois, Indiana, Iowa, Kansas, Michigan, Minnesota, Missouri, Nebraska, North Dakota, Ohio, South Dakota, and Wisconsin; West: Alaska, Arizona,California, Colorado, Hawaii, Idaho, Montana, Nevada, New Mexico, Oregon, Utah, Washington, and Wyoming.
p Preliminary

Table 10. Quits levels and rates by industry and region, not seasonally adjusted1
Industry and region
Levels (in thousands) Rates2
Mar.2019
Feb.2020
Mar.2020p
Mar.2019
Feb.2020
Mar.2020p
Total. . . . . . . . . . . . . . . . . . . . . . . . . . . . . . . . . . . . . . . . . . . . . . . . . . . . . . . . . . . . . . . . . . . . . 3,228 2,822 2,447 2.2 1.9 1.6
INDUSTRY
Total private. . . . . . . . . . . . . . . . . . . . . . . . . . . . . . . . . . . . . . . . . . . . . . . . . . . . . . . . . . 3,091 2,685 2,319 2.4 2.1 1.8
Mining and logging. . . . . . . . . . . . . . . . . . . . . . . . . . . . . . . . . . . . . . . . . . . . . . . 20 11 8 2.7 1.6 1.2
Construction.. . . . . . . . . . . . . . . . . . . . . . . . . . . . . . . . . . . . . . . . . . . . . . . . . . . . . . 133 116 105 1.9 1.6 1.4
Manufacturing. . . . . . . . . . . . . . . . . . . . . . . . . . . . . . . . . . . . . . . . . . . . . . . . . . . . . 215 159 132 1.7 1.2 1.0
Durable goods.. . . . . . . . . . . . . . . . . . . . . . . . . . . . . . . . . . . . . . . . . . . . . . . . . 111 94 78 1.4 1.2 1.0
Nondurable goods. . . . . . . . . . . . . . . . . . . . . . . . . . . . . . . . . . . . . . . . . . . . . 103 65 54 2.2 1.4 1.1
Trade, transportation, and utilities. . . . . . . . . . . . . . . . . . . . . . . . . . . . . . 700 666 557 2.6 2.4 2.0
Wholesale trade.. . . . . . . . . . . . . . . . . . . . . . . . . . . . . . . . . . . . . . . . . . . . . . . 96 84 81 1.6 1.4 1.4
Retail trade. . . . . . . . . . . . . . . . . . . . . . . . . . . . . . . . . . . . . . . . . . . . . . . . . . . . . 475 449 368 3.1 2.9 2.4
Transportation, warehousing, and utilities. . . . . . . . . . . . . . . . . . 129 132 108 2.1 2.2 1.8
Information. . . . . . . . . . . . . . . . . . . . . . . . . . . . . . . . . . . . . . . . . . . . . . . . . . . . . . . . 41 45 30 1.4 1.5 1.0
Financial activities. . . . . . . . . . . . . . . . . . . . . . . . . . . . . . . . . . . . . . . . . . . . . . . . 94 109 86 1.1 1.2 1.0
Finance and insurance.. . . . . . . . . . . . . . . . . . . . . . . . . . . . . . . . . . . . . . . 58 74 62 0.9 1.1 1.0
Real estate and rental and leasing. . . . . . . . . . . . . . . . . . . . . . . . . . 35 35 25 1.6 1.5 1.1
Professional and business services. . . . . . . . . . . . . . . . . . . . . . . . . . . . 660 532 533 3.2 2.5 2.5
Education and health services. . . . . . . . . . . . . . . . . . . . . . . . . . . . . . . . . . 457 413 397 1.9 1.7 1.6
Educational services. . . . . . . . . . . . . . . . . . . . . . . . . . . . . . . . . . . . . . . . . . 34 43 32 0.9 1.1 0.8
Health care and social assistance.. . . . . . . . . . . . . . . . . . . . . . . . . . 423 370 365 2.1 1.8 1.8
Leisure and hospitality. . . . . . . . . . . . . . . . . . . . . . . . . . . . . . . . . . . . . . . . . . . 647 550 423 4.0 3.4 2.6
Arts, entertainment, and recreation.. . . . . . . . . . . . . . . . . . . . . . . . . 64 57 34 2.8 2.5 1.5
Accommodation and food services. . . . . . . . . . . . . . . . . . . . . . . . . . 583 494 389 4.2 3.5 2.8
Other services. . . . . . . . . . . . . . . . . . . . . . . . . . . . . . . . . . . . . . . . . . . . . . . . . . . . 124 83 46 2.1 1.4 0.8
Government. . . . . . . . . . . . . . . . . . . . . . . . . . . . . . . . . . . . . . . . . . . . . . . . . . . . . . . . . . 137 137 128 0.6 0.6 0.6
Federal. . . . . . . . . . . . . . . . . . . . . . . . . . . . . . . . . . . . . . . . . . . . . . . . . . . . . . . . . . . . . 19 17 17 0.7 0.6 0.6
State and local. . . . . . . . . . . . . . . . . . . . . . . . . . . . . . . . . . . . . . . . . . . . . . . . . . . . 118 120 111 0.6 0.6 0.5
State and local education.. . . . . . . . . . . . . . . . . . . . . . . . . . . . . . . . . . . . 57 55 43 0.5 0.5 0.4
State and local, excluding education. . . . . . . . . . . . . . . . . . . . . . . . 61 66 68 0.7 0.7 0.7
REGION3
Northeast. . . . . . . . . . . . . . . . . . . . . . . . . . . . . . . . . . . . . . . . . . . . . . . . . . . . . . . . . . . . . 453 386 334 1.7 1.4 1.2
South. . . . . . . . . . . . . . . . . . . . . . . . . . . . . . . . . . . . . . . . . . . . . . . . . . . . . . . . . . . . . . . . . 1,368 1,156 983 2.5 2.1 1.8
Midwest. . . . . . . . . . . . . . . . . . . . . . . . . . . . . . . . . . . . . . . . . . . . . . . . . . . . . . . . . . . . . . . 680 633 576 2.1 1.9 1.8
West. . . . . . . . . . . . . . . . . . . . . . . . . . . . . . . . . . . . . . . . . . . . . . . . . . . . . . . . . . . . . . . . . . 727 646 555 2.1 1.8 1.6
1 Quits are the number of quits during the entire month.2 The quits rate is the number of quits during the entire month as a percent of total employment.3 The states (including the District of Columbia) that comprise the regions are: Northeast: Connecticut, Maine, Massachusetts, New Hampshire, New
Jersey, New York, Pennsylvania, Rhode Island, and Vermont; South: Alabama, Arkansas, Delaware, District of Columbia, Florida, Georgia,Kentucky, Louisiana, Maryland, Mississippi, North Carolina, Oklahoma, South Carolina, Tennessee, Texas, Virginia, and West Virginia; Midwest:Illinois, Indiana, Iowa, Kansas, Michigan, Minnesota, Missouri, Nebraska, North Dakota, Ohio, South Dakota, and Wisconsin; West: Alaska, Arizona,California, Colorado, Hawaii, Idaho, Montana, Nevada, New Mexico, Oregon, Utah, Washington, and Wyoming.
p Preliminary

Table 11. Layoffs and discharges levels and rates by industry and region, not seasonally adjusted1
Industry and region
Levels (in thousands) Rates2
Mar.2019
Feb.2020
Mar.2020p
Mar.2019
Feb.2020
Mar.2020p
Total. . . . . . . . . . . . . . . . . . . . . . . . . . . . . . . . . . . . . . . . . . . . . . . . . . . . . . . . . . . . . . . . . . . . . 1,378 1,433 11,025 0.9 0.9 7.3
INDUSTRY
Total private. . . . . . . . . . . . . . . . . . . . . . . . . . . . . . . . . . . . . . . . . . . . . . . . . . . . . . . . . . 1,331 1,388 10,906 1.1 1.1 8.5
Mining and logging. . . . . . . . . . . . . . . . . . . . . . . . . . . . . . . . . . . . . . . . . . . . . . . 14 9 33 1.9 1.3 4.7
Construction.. . . . . . . . . . . . . . . . . . . . . . . . . . . . . . . . . . . . . . . . . . . . . . . . . . . . . . 156 156 589 2.2 2.1 8.0
Manufacturing. . . . . . . . . . . . . . . . . . . . . . . . . . . . . . . . . . . . . . . . . . . . . . . . . . . . . 110 99 554 0.9 0.8 4.3
Durable goods.. . . . . . . . . . . . . . . . . . . . . . . . . . . . . . . . . . . . . . . . . . . . . . . . . 69 56 366 0.9 0.7 4.5
Nondurable goods. . . . . . . . . . . . . . . . . . . . . . . . . . . . . . . . . . . . . . . . . . . . . 41 44 188 0.9 0.9 4.0
Trade, transportation, and utilities. . . . . . . . . . . . . . . . . . . . . . . . . . . . . . 240 305 1,579 0.9 1.1 5.8
Wholesale trade.. . . . . . . . . . . . . . . . . . . . . . . . . . . . . . . . . . . . . . . . . . . . . . . 33 47 228 0.6 0.8 3.9
Retail trade. . . . . . . . . . . . . . . . . . . . . . . . . . . . . . . . . . . . . . . . . . . . . . . . . . . . . 150 195 1,089 1.0 1.3 7.1
Transportation, warehousing, and utilities. . . . . . . . . . . . . . . . . . 58 63 262 0.9 1.0 4.3
Information. . . . . . . . . . . . . . . . . . . . . . . . . . . . . . . . . . . . . . . . . . . . . . . . . . . . . . . . 33 27 59 1.2 0.9 2.0
Financial activities. . . . . . . . . . . . . . . . . . . . . . . . . . . . . . . . . . . . . . . . . . . . . . . . 30 58 212 0.3 0.7 2.4
Finance and insurance.. . . . . . . . . . . . . . . . . . . . . . . . . . . . . . . . . . . . . . . 22 39 73 0.4 0.6 1.1
Real estate and rental and leasing. . . . . . . . . . . . . . . . . . . . . . . . . . 7 19 139 0.3 0.8 6.0
Professional and business services. . . . . . . . . . . . . . . . . . . . . . . . . . . . 359 340 900 1.7 1.6 4.2
Education and health services. . . . . . . . . . . . . . . . . . . . . . . . . . . . . . . . . . 143 119 1,201 0.6 0.5 4.9
Educational services. . . . . . . . . . . . . . . . . . . . . . . . . . . . . . . . . . . . . . . . . . 18 11 249 0.5 0.3 6.3
Health care and social assistance.. . . . . . . . . . . . . . . . . . . . . . . . . . 126 108 952 0.6 0.5 4.6
Leisure and hospitality. . . . . . . . . . . . . . . . . . . . . . . . . . . . . . . . . . . . . . . . . . . 204 200 4,811 1.3 1.2 30.1
Arts, entertainment, and recreation.. . . . . . . . . . . . . . . . . . . . . . . . . 33 19 486 1.5 0.8 21.2
Accommodation and food services. . . . . . . . . . . . . . . . . . . . . . . . . . 171 181 4,326 1.2 1.3 31.6
Other services. . . . . . . . . . . . . . . . . . . . . . . . . . . . . . . . . . . . . . . . . . . . . . . . . . . . 41 76 968 0.7 1.3 16.5
Government. . . . . . . . . . . . . . . . . . . . . . . . . . . . . . . . . . . . . . . . . . . . . . . . . . . . . . . . . . 48 45 120 0.2 0.2 0.5
Federal. . . . . . . . . . . . . . . . . . . . . . . . . . . . . . . . . . . . . . . . . . . . . . . . . . . . . . . . . . . . . 5 6 7 0.2 0.2 0.3
State and local. . . . . . . . . . . . . . . . . . . . . . . . . . . . . . . . . . . . . . . . . . . . . . . . . . . . 42 39 112 0.2 0.2 0.6
State and local education.. . . . . . . . . . . . . . . . . . . . . . . . . . . . . . . . . . . . 18 19 49 0.2 0.2 0.4
State and local, excluding education. . . . . . . . . . . . . . . . . . . . . . . . 25 20 63 0.3 0.2 0.7
REGION3
Northeast. . . . . . . . . . . . . . . . . . . . . . . . . . . . . . . . . . . . . . . . . . . . . . . . . . . . . . . . . . . . . 214 218 2,283 0.8 0.8 8.2
South. . . . . . . . . . . . . . . . . . . . . . . . . . . . . . . . . . . . . . . . . . . . . . . . . . . . . . . . . . . . . . . . . 608 503 3,553 1.1 0.9 6.4
Midwest. . . . . . . . . . . . . . . . . . . . . . . . . . . . . . . . . . . . . . . . . . . . . . . . . . . . . . . . . . . . . . . 262 361 2,768 0.8 1.1 8.4
West. . . . . . . . . . . . . . . . . . . . . . . . . . . . . . . . . . . . . . . . . . . . . . . . . . . . . . . . . . . . . . . . . . 295 351 2,421 0.8 1.0 6.9
1 Layoffs and discharges are the number of layoffs and discharges during the entire month.2 The layoffs and discharges rate is the number of layoffs and discharges during the entire month as a percent of total employment.3 The states (including the District of Columbia) that comprise the regions are: Northeast: Connecticut, Maine, Massachusetts, New Hampshire, New
Jersey, New York, Pennsylvania, Rhode Island, and Vermont; South: Alabama, Arkansas, Delaware, District of Columbia, Florida, Georgia,Kentucky, Louisiana, Maryland, Mississippi, North Carolina, Oklahoma, South Carolina, Tennessee, Texas, Virginia, and West Virginia; Midwest:Illinois, Indiana, Iowa, Kansas, Michigan, Minnesota, Missouri, Nebraska, North Dakota, Ohio, South Dakota, and Wisconsin; West: Alaska, Arizona,California, Colorado, Hawaii, Idaho, Montana, Nevada, New Mexico, Oregon, Utah, Washington, and Wyoming.
p Preliminary

Table 12. Other separations levels and rates by industry and region, not seasonally adjusted1
Industry and region
Levels (in thousands) Rates2
Mar.2019
Feb.2020
Mar.2020p
Mar.2019
Feb.2020
Mar.2020p
Total. . . . . . . . . . . . . . . . . . . . . . . . . . . . . . . . . . . . . . . . . . . . . . . . . . . . . . . . . . . . . . . . . . . . . 303 275 336 0.2 0.2 0.2
INDUSTRY
Total private. . . . . . . . . . . . . . . . . . . . . . . . . . . . . . . . . . . . . . . . . . . . . . . . . . . . . . . . . . 257 227 292 0.2 0.2 0.2
Mining and logging. . . . . . . . . . . . . . . . . . . . . . . . . . . . . . . . . . . . . . . . . . . . . . . 1 1 1 0.2 0.2 0.2
Construction.. . . . . . . . . . . . . . . . . . . . . . . . . . . . . . . . . . . . . . . . . . . . . . . . . . . . . . 20 5 14 0.3 0.1 0.2
Manufacturing. . . . . . . . . . . . . . . . . . . . . . . . . . . . . . . . . . . . . . . . . . . . . . . . . . . . . 19 21 24 0.2 0.2 0.2
Durable goods.. . . . . . . . . . . . . . . . . . . . . . . . . . . . . . . . . . . . . . . . . . . . . . . . . 10 10 14 0.1 0.1 0.2
Nondurable goods. . . . . . . . . . . . . . . . . . . . . . . . . . . . . . . . . . . . . . . . . . . . . 10 10 10 0.2 0.2 0.2
Trade, transportation, and utilities. . . . . . . . . . . . . . . . . . . . . . . . . . . . . . 46 58 66 0.2 0.2 0.2
Wholesale trade.. . . . . . . . . . . . . . . . . . . . . . . . . . . . . . . . . . . . . . . . . . . . . . . 7 3 10 0.1 0.0 0.2
Retail trade. . . . . . . . . . . . . . . . . . . . . . . . . . . . . . . . . . . . . . . . . . . . . . . . . . . . . 24 40 41 0.2 0.3 0.3
Transportation, warehousing, and utilities. . . . . . . . . . . . . . . . . . 15 16 15 0.2 0.3 0.2
Information. . . . . . . . . . . . . . . . . . . . . . . . . . . . . . . . . . . . . . . . . . . . . . . . . . . . . . . . 10 5 13 0.3 0.2 0.4
Financial activities. . . . . . . . . . . . . . . . . . . . . . . . . . . . . . . . . . . . . . . . . . . . . . . . 32 17 30 0.4 0.2 0.3
Finance and insurance.. . . . . . . . . . . . . . . . . . . . . . . . . . . . . . . . . . . . . . . 27 16 24 0.4 0.3 0.4
Real estate and rental and leasing. . . . . . . . . . . . . . . . . . . . . . . . . . 5 1 6 0.2 0.0 0.2
Professional and business services. . . . . . . . . . . . . . . . . . . . . . . . . . . . 58 46 54 0.3 0.2 0.3
Education and health services. . . . . . . . . . . . . . . . . . . . . . . . . . . . . . . . . . 47 53 44 0.2 0.2 0.2
Educational services. . . . . . . . . . . . . . . . . . . . . . . . . . . . . . . . . . . . . . . . . . 3 2 1 0.1 0.1 0.0
Health care and social assistance.. . . . . . . . . . . . . . . . . . . . . . . . . . 44 51 42 0.2 0.2 0.2
Leisure and hospitality. . . . . . . . . . . . . . . . . . . . . . . . . . . . . . . . . . . . . . . . . . . 17 19 28 0.1 0.1 0.2
Arts, entertainment, and recreation.. . . . . . . . . . . . . . . . . . . . . . . . . 3 2 2 0.1 0.1 0.1
Accommodation and food services. . . . . . . . . . . . . . . . . . . . . . . . . . 14 17 26 0.1 0.1 0.2
Other services. . . . . . . . . . . . . . . . . . . . . . . . . . . . . . . . . . . . . . . . . . . . . . . . . . . . 7 2 19 0.1 0.0 0.3
Government. . . . . . . . . . . . . . . . . . . . . . . . . . . . . . . . . . . . . . . . . . . . . . . . . . . . . . . . . . 47 48 43 0.2 0.2 0.2
Federal. . . . . . . . . . . . . . . . . . . . . . . . . . . . . . . . . . . . . . . . . . . . . . . . . . . . . . . . . . . . . 11 13 12 0.4 0.5 0.4
State and local. . . . . . . . . . . . . . . . . . . . . . . . . . . . . . . . . . . . . . . . . . . . . . . . . . . . 36 35 31 0.2 0.2 0.2
State and local education.. . . . . . . . . . . . . . . . . . . . . . . . . . . . . . . . . . . . 13 10 9 0.1 0.1 0.1
State and local, excluding education. . . . . . . . . . . . . . . . . . . . . . . . 24 25 23 0.3 0.3 0.2
REGION3
Northeast. . . . . . . . . . . . . . . . . . . . . . . . . . . . . . . . . . . . . . . . . . . . . . . . . . . . . . . . . . . . . 44 36 52 0.2 0.1 0.2
South. . . . . . . . . . . . . . . . . . . . . . . . . . . . . . . . . . . . . . . . . . . . . . . . . . . . . . . . . . . . . . . . . 121 117 114 0.2 0.2 0.2
Midwest. . . . . . . . . . . . . . . . . . . . . . . . . . . . . . . . . . . . . . . . . . . . . . . . . . . . . . . . . . . . . . . 57 57 75 0.2 0.2 0.2
West. . . . . . . . . . . . . . . . . . . . . . . . . . . . . . . . . . . . . . . . . . . . . . . . . . . . . . . . . . . . . . . . . . 81 65 95 0.2 0.2 0.3
1 Other separations are the number of other separations during the entire month.2 The other separations rate is the number of other separations during the entire month as a percent of total employment.3 The states (including the District of Columbia) that comprise the regions are: Northeast: Connecticut, Maine, Massachusetts, New Hampshire, New
Jersey, New York, Pennsylvania, Rhode Island, and Vermont; South: Alabama, Arkansas, Delaware, District of Columbia, Florida, Georgia,Kentucky, Louisiana, Maryland, Mississippi, North Carolina, Oklahoma, South Carolina, Tennessee, Texas, Virginia, and West Virginia; Midwest:Illinois, Indiana, Iowa, Kansas, Michigan, Minnesota, Missouri, Nebraska, North Dakota, Ohio, South Dakota, and Wisconsin; West: Alaska, Arizona,California, Colorado, Hawaii, Idaho, Montana, Nevada, New Mexico, Oregon, Utah, Washington, and Wyoming.
p Preliminary
NOTE: Levels are rounded to the nearest thousand and rates are rounded to the nearest tenth. Levels and rates may round down to zero.