jjeeaass applied sciences journal of engineering
TRANSCRIPT
110 Ekpo et. al. / Journal of Engineering and Applied Sciences 13 (2018), 110-122
JEAS ISSN: 1119-8109
Journal of Engineering and Applied Sciences13 (2018),110-122
GEOPHYSICAL MAPPING AND ASSESSMENT OF GROUNDWATER POTENTIALS
FOR SUSTAINABLE DEVELOPMENT IN UYO, AKWA IBOM STATE
Ekpo, A.E.1*
, Orakwe, L.C.1 and Abarikwu, O. I.
2
1Department of Agricultural & Bioresources Engineering,
Faculty of Engineering,
Nnamdi Azikiwe University,
Awka, Anambra State, Nigeria. 2Department of Civil Engineering,
College of Engineering,
Gregory University,
Uturu, Abia State, Nigeria. *Corresponding Author’s Email: [email protected]: (+2348067461419)
Abstract
Spatial variation of surface water has made groundwater the sustainable means of potable water
supply, hence the need to delineate them into their bearing capacity. In this study geophysical
evaluation of the groundwater is aimed at delineating the aquiferous units within the study area
into their groundwater potentials zones. The Schlumberger Automatic Analysis (SAA) version
0.92 was used to analyze the data in order to determine their depths, thickness, resistivity and the
potential depths of boreholes at various locations chosen arbitrarily within the study area.
Seventeen (17) locations were probed. The VES curve types found within the study area include
H, K and A, but it is predominantly made up of K type of curve. Results obtained showed three
to six geoelectric layers of the soundings. The aquifer depths vary from 42 to 160m; the aquifer
thickness varies from 33 to 153m. The hydraulic conductivities range from 0.0556cm/s to
0.4545cm/s while the transmissivity range from 2.5754cm2/s to 38.6325cm
2/s. The final
groundwater potential map shows that the study area has reasonable amount of groundwater
reserve for sustainable groundwater infrastructural development ranging from low to high
potentials
Keywords: Aquifer Thickness, Aquifer Resistivity, Anisotropy, Hydraulic Conductivity,
Vertical Electrical Sounding (VES) and Transmissivity.
JOURNAL OF ENGINEERING AND
APPLIED SCIENCES JJEEAASS
111 Ekpo et. al. / Journal of Engineering and Applied Sciences 13 (2018), 110-122
JEAS ISSN: 1119-8109
1. Introduction
The unequal distribution of rainfall has made the availability of water to be a subject of interest,
since the ill-effect of water scarcity has caused tremendous havoc which has resulted to global
concern. Water is life; the development of a particular area is determined by the quality and
quantity of water available to the population of the area. Several millions of people do not have
access to potable water and this has resulted to the prevalence of water borne diseases in some
regions of the world, especially in developing countries. In the planning and management of
water resources development, the first step is to estimate the future population of the area and
their water consumption per capita per day so as to determine the quantity of water which must
be provided. Secondly, the most important step is to determine a source of water supply of high
quality with less treatment for potable water supply. In Uyo, the major source of water for
domestic, industrial and agricultural uses is groundwater with litt le surface water available
within the rural areas of Uyo which is of low and degradable quality. As such, for good supplies
of groundwater, geophysical survey must be carried out carefully to make optimal use of the
available groundwater through boreholes and wells.
Geophysical method is aimed at measuring the properties of the formation materials, which
determine whether such formation may be sufficiently porous and permeable to serve as an
aquifer. Conducting geophysical investigations include survey design, data acquisition and data
analysis. These three aspects of an experiment are commonly treated independently and the
applicability of the method under the geological conditions must be taken into account (Akpabio
et al., 2003).
A number of geophysical exploration techniques are available which gives an insight of the
nature of the water bearing layers and these include geoelectric, electromagnetic, seismic and
geophysical borehole logging (Alile, et al., 2008). The electrical resistivity method and seismic
refraction methods are the surface geophysical methods commonly used for groundwater
exploration (Asawa, 2009; Ozegin and Oseghale, 2012). Geophysical techniques are powerful
tools used to identify aquifer systems for sustainable development of groundwater resources in a
basin and play important role in the delineation of aquifer configuration under varying hydro
geologic condition (Alile et al., 2008). The use of electrical resistivity measurements of
geophysics for groundwater resource mapping, mining, geotechnical investigation, water quality
evaluation and the vulnerability assessment of aquifers has been a favorite tool of geophysics for
many decades and now tremendously increased over the last few years due to rapid advances in
computer technology and associated numerical modeling techniques (Jha, et al., 2008; Ekpo et
al., 2016).
2. Materials and Methods
2.1 Location and Geology of the Study Area
The study area is Uyo, Akwa Ibom State, Nigeria located in the Niger Delta region, lies between
latitude 5o
05’ North to 4o
55’ N and Longitude 8o
00’ East to 7o
50’ East. The city has a hilly or
undulating nature and semi equatorial type of climate. The major vegetation belt within the area

112 Ekpo et. al. / Journal of Engineering and Applied Sciences 13 (2018), 110-122
JEAS ISSN: 1119-8109
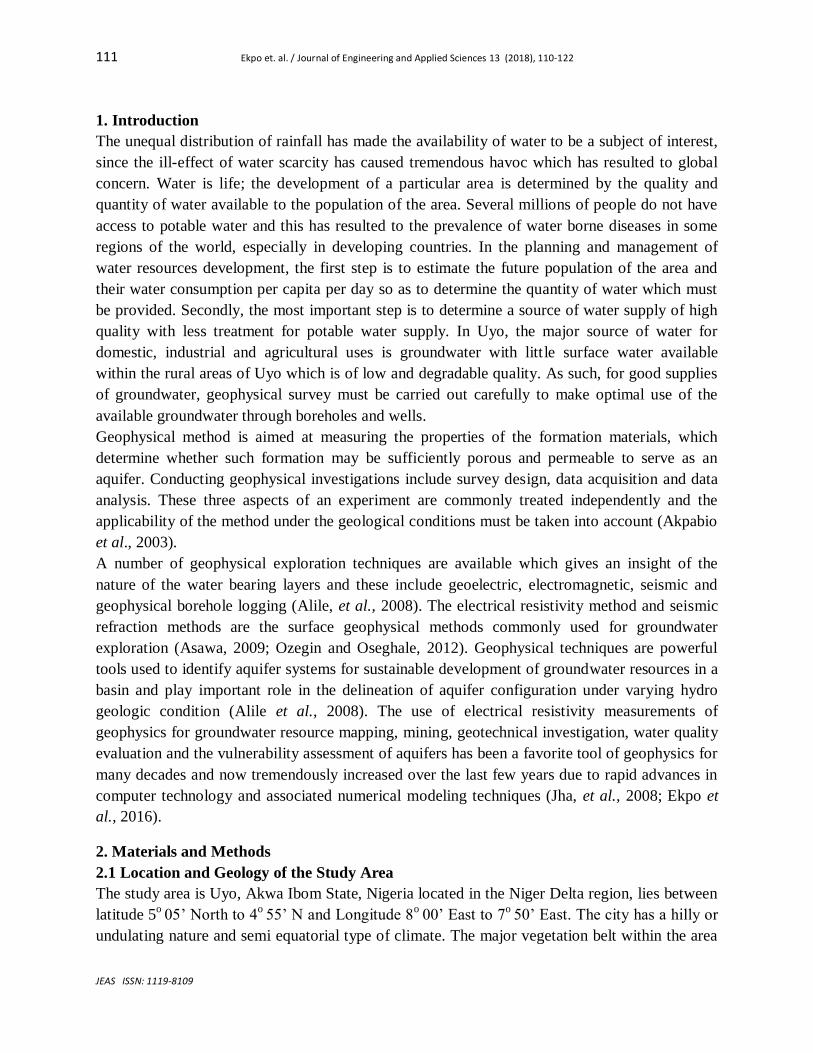
is fresh water swamp and rainforest (Ekwere et al., 1994). Geologically, the study area belongs
to the area classified as coastal plain sands known as the Benin Formation (Mbipom et al., 1996).
The Benin Formation is the uppermost unit of the Niger Delta Complex and overlies the Agbada
Formation.
The Benin Formation is Oligocene and the youngest formation of the Niger Delta sedimentary
basin. It is composed of continental flood plain sands and fluvial deposits. The essential features
of the Benin formation have been reviewed by various authors: (Akpabio et al., 2003; Short and
Stauble, 1967).
Fig.2.1 Map of the study area showing VES points.
Ekpo et. al. /Journal of Engineering and Applied Sciences 13 (2018), 110-122 113
JEAS ISSN: 1119-8109
Fig.2.2 Geological map of the study area
2.2 Experimental Field Procedure and Data Acquisition
The ground resistivity is related to various geological parameters such as the mineral and fluid
content, porosity, nature and degree of water saturation in the rock. Surface Electrical Resistivity
surveying is a geophysical operation in which measurements of earth resistivity are made from
the ground surface (Michael, 1978). Geophysical methods provide indirect evidence of the
subsurface formation that may indicate whether the formations are possible aquifers (Michael,
1978). These methods, especially the resistivity method, measure properties of formation
materials, which determine whether such formation may be sufficiently porous and permeable to
serve as an aquifer. Anizoba et al., (2015) used areas of thick overburden (materials above the
bedrock) and the iso-resistivity maps showing the resistivity distribution of the aquifer layers in
mapping promising areas for groundwater abstraction.
The vertical electrical sounding (VES) is a field technique used to measure the variations of
resistivity with depth. The field procedure involves measuring the apparent resistivity as the mid-
point is kept fixed while the distance between the current is progressively increased. The

114 Ekpo et. al. / Journal of Engineering and Applied Sciences 13 (2018), 110-122
JEAS ISSN: 1119-8109
Schlumberger array was used during the sounding test. After data acquisition, the apparent
resistivity values were plotted against half the current electrode spacing on bi-logarithmic graph
paper. The curves obtained on the bi-logarithmic paper will be matched with the standard curves
to produce the H, A, K or Q curves. Terrameter SAS 300B was used for this study; it transmits a
well-defined and regulated square wave, which minimizes induction effects and attenuation. The
depth of probe was between 300m to 800m, current was introduced into the ground by a pair of
steel stakes driven into the ground and the corresponding potential difference (V) was measured
by a pair of electrodes. The electrode separation allows for the calculation of apparent resistivity
of the earth. The sounding data were interpreted using computer software (Schlumberger
Automatic Analysis, V0.92). Seventeen (17) vertical electrical sounding (VES) points were
conducted at various locations within the study area in order to study the variations in the
resistivity distribution of the soil with depth. The spatial location of the VES points in the study
was recorded using the GPS as shown in table 3.1 which is useful in producing the different
maps of the study area. After the interpretation of the graph results obtained other parameters can
be estimated which will be useful in the delineation of groundwater potentials such as
transmissivity and the hydraulic conductivity of the aquifers for proper understanding.
Transmissivity is a measure of how much water can be transmitted horizontally. It is directly
related to the horizontal hydraulic conductivity (K) and the thickness (b) of the aquifer.
Expressing K in m/day or cm/s and b in m, the transmissivity (T) is found in unit m2/day or
cm2/s.
T = Kb (2.1)
The transmissivity of the aquifer is related to the field hydraulic conductivity (K) by the equation
above. According to Niwas and Singhal (1981) in a porous medium is given by;
Tc = Kcb (2.2)
Where;
Tc = Calculated transmissivity (m2/day)
Kc = Calculated hydraulic conductivity (m/day) from VES data.
b = Thickness of saturated layer (m).
Hydraulic conductivity is symbolically represented as K, which is a property of rock that
describes the ease with which water can move through pore spaces or fractures. It depends on the
intrinsic permeability of the material and on the degree of saturation. Saturated hydraulic
conductivity, Ksat, describes water movement through saturated media.
Kc = 1/ρ (2.3)
where;
Kc is the calculated hydraulic conductivity
ρ is the resistivity of the saturated layer

Ekpo et. al. /Journal of Engineering and Applied Sciences 13 (2018), 110-122 115
JEAS ISSN: 1119-8109
Table 2.1: GPS locations of the Sounding points
VES No. East (M) North (M) Elevation (M)
1 381885.354 555911.042 30
2 383541.63 552021.019 20
3 385665.008 553389.654 10
4 387845.539 554701.083 29
5 384754.289 557507.81 30
6 388127.085 551385.017 24
7 386577.38 550244.081 25
8 381193.118 553282.482 20
9 377005.205 551631.567 10
10 376781.87 555176.358 15
11 374258.885 554894.844 15
12 373164.931 552209.822 20
13 369960.649 555759.956 20
14 370982.46 550041.229 15
15 369597.117 544784.118 20
16 368844.541 540726.43 18
17 368536.248 560621.937 23
3.0 Results and Discussions
3.1 Graphical Representation of Sounding Results
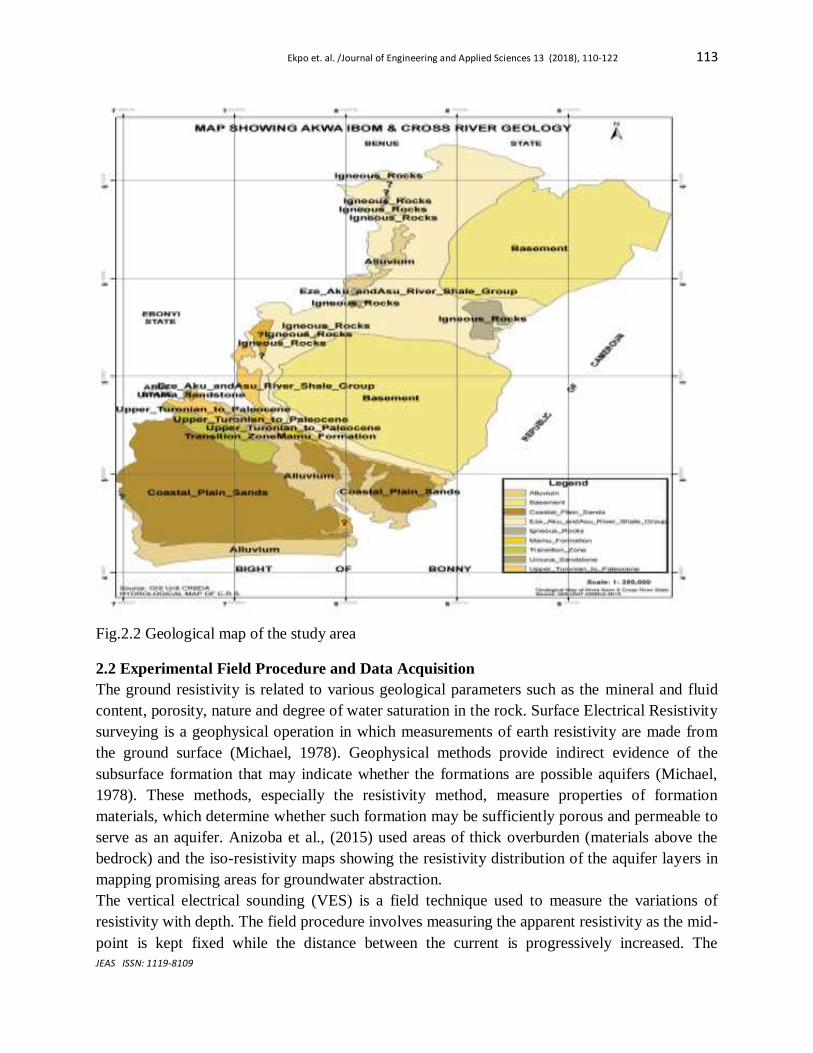
In this section, Fig 3.1 to Fig 3.3 shows the graphical representation of the field data as computed
by the computer software (Schlumberger Automatic Analysis, V 0.92). The vertical axis
represents the resistivity of the earth while the horizontal axis represents half spacing of the
electrode.
Fig.3.1: Resistivity graph of VES 1
116 Ekpo et. al. / Journal of Engineering and Applied Sciences 13 (2018), 110-122
JEAS ISSN: 1119-8109
Fig.3.2: Resistivity graph of VES 2
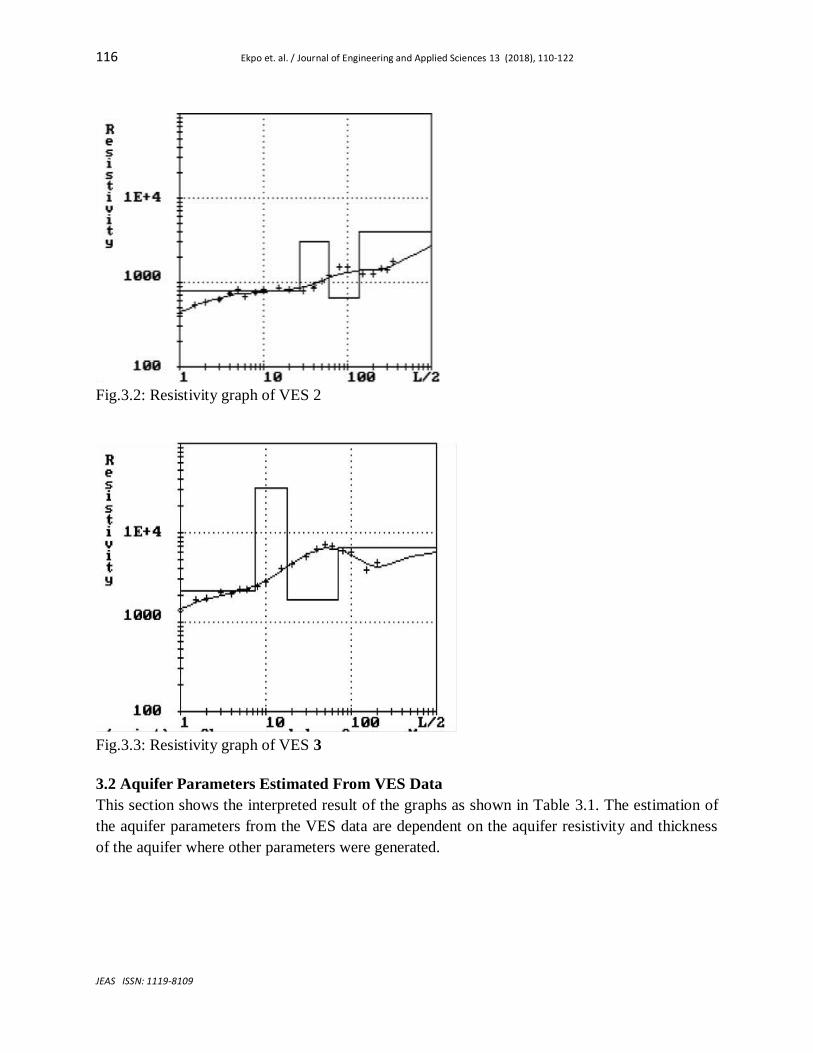
Fig.3.3: Resistivity graph of VES 3
3.2 Aquifer Parameters Estimated From VES Data
This section shows the interpreted result of the graphs as shown in Table 3.1. The estimation of
the aquifer parameters from the VES data are dependent on the aquifer resistivity and thickness
of the aquifer where other parameters were generated.

Ekpo et. al. /Journal of Engineering and Applied Sciences 13 (2018), 110-122 117
JEAS ISSN: 1119-8109
Table 3.1 Aquifer parameters estimated from VES data VES
No
Location No
of
Layers
ρ(ohm- m)
b(m)
1
ρ(ohm-m)
b(m)
2
ρ(ohm-m)
b(m)
3
ρ(ohm-m)
b(m)
4
ρ(ohm-m)
b(m)
5
ρ(ohm-m)
b(m)
6
Curve Type
1 Itam Etoi 6 695
0.48
4900
4.52
290
12.48
2500
37.52
1700
43.80
1900
76.20
H
2 Afaha Oku 4 800
29.00
3000
31.00
700
119.00
3900
-
K
3 Iba Oku 4 2200
7.80
32000
10.20
1800
59.80
6600
-
A
4 Afaha Effiat
3 1900
2.90
900
35.10
320
-
K
5 Ifa Atai 4 2900
2.80
220
6.20
1600
153.80
4500
-
K
6 Ifa Ikot Okpon
7 5000
2.80
1800
6.20
6500
14.80
500
27.20
1100
32.80
25000
87.20
H
7 Nsukara 6 1500
1.55
4900
2.25
998
4.75
3500
35.25
600
64.75
7000
-
K
8 Ikot Anyang
5 500
1.30
750
3.60
8500
46.40
310
101.60
A
9 Uniuyo 6 2500
2.00
1000
3.00
4000
22.00
600
55.00
11000
67.00
180000
-
H
10 Use Offot 4 800
28.00
3000
32.00
650
118.00
4900
-
K
11 Aka 5 2800
1.60
190
1.20
19000
13.80
2900
42.00
500
-
K
12 Ikot Ntuen 4 3900
4.90
1300
9.10
8000
45.90
220
-
A
13 Obot Ubom
5 2000
1.95
700
6.55
5200
33.45
1500
76.55
85000
-
K
14 Nduetong 4 900 3900 590 10200 A

118 Ekpo et. al. / Journal of Engineering and Applied Sciences 13 (2018), 110-122
JEAS ISSN: 1119-8109
Oku 9.00 23.00 77.00 -
15 Nung Uyo Idoro
5 790
3.00
4900
27.00
670
33.00
1900
58.00
10600
-
K
16 Mbak Etoi 4 800
29.00
3000
32.00
630
118.00
4100
-
A
17 Itam Itu 5 2800
1.60
390
2.30
5000
7.70
920
64.30
120
-
K
b represents thickness of the targeted aquifer
ρ represents the resistivity of the targeted aquifer
3.3 Aquifer Resistivity
The resistivity map as shown in (Fig3.4) depicts the resistivity distribution of the aquiferous
layers measured in (ohm-m). This shows the resistivity of different layers of the earth and has
proven useful in mapping promising areas for groundwater abstraction. The part of the resistivity
map representing a low resistivity region (i.e. the blue region) could be potential ground water
zones due to low resistivity value ranging from 500 ohm-m to 700 ohm-m except in cases where
the anomalies are very high and increase in the thickness of the aquifer.
Fig.3.4. Resistivity Map of the study area.
3.4 Aquifer Thickness
The map of the aquifer thickness as shown in Fig3.5 shows that the thickness of the aquifer
computed from the resistivity soundings ranges from 27.20m at VES 6 to 153.80m at VES 5.
Other high aquifer thickness values are observed in VES 1, 4, 5, 8, 10, 12, and 16 with values
exceeding 80meters. The thickness tends to spread throughout the map, this indicating that the
aquifer of the study area is thick and prolific and can be tapped by many productive boreholes
and wells.
370000 372000 374000 376000 378000 380000 382000 384000 386000 388000
542000
544000
546000
548000
550000
552000
554000
556000
558000
560000
200
300
400
500
600
700
800
900
1000
1100
1200
1300
1400
1500
1600
1700
1800
Ekpo et. al. /Journal of Engineering and Applied Sciences 13 (2018), 110-122 119
JEAS ISSN: 1119-8109
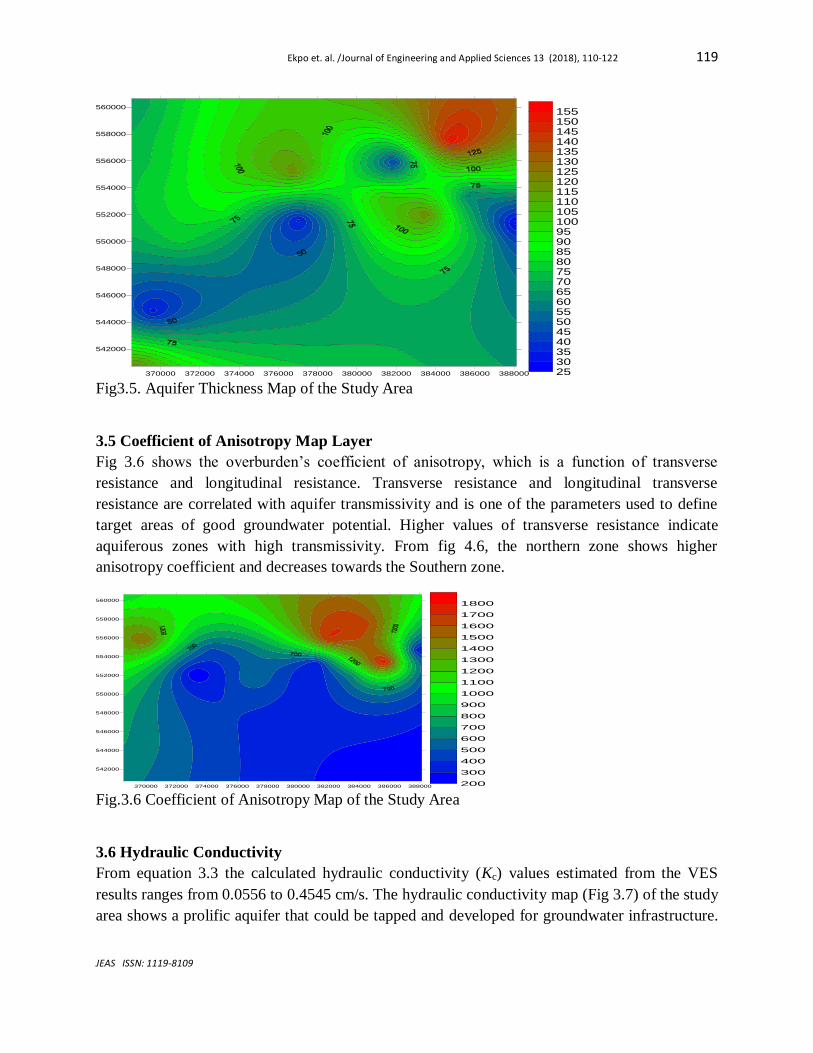
Fig3.5. Aquifer Thickness Map of the Study Area
3.5 Coefficient of Anisotropy Map Layer
Fig 3.6 shows the overburden’s coefficient of anisotropy, which is a function of transverse
resistance and longitudinal resistance. Transverse resistance and longitudinal transverse
resistance are correlated with aquifer transmissivity and is one of the parameters used to define
target areas of good groundwater potential. Higher values of transverse resistance indicate
aquiferous zones with high transmissivity. From fig 4.6, the northern zone shows higher
anisotropy coefficient and decreases towards the Southern zone.
Fig.3.6 Coefficient of Anisotropy Map of the Study Area
3.6 Hydraulic Conductivity
From equation 3.3 the calculated hydraulic conductivity (Kc) values estimated from the VES
results ranges from 0.0556 to 0.4545 cm/s. The hydraulic conductivity map (Fig 3.7) of the study
area shows a prolific aquifer that could be tapped and developed for groundwater infrastructure.
370000 372000 374000 376000 378000 380000 382000 384000 386000 388000
542000
544000
546000
548000
550000
552000
554000
556000
558000
560000
253035404550556065707580859095100105110115120125130135140145150155
370000 372000 374000 376000 378000 380000 382000 384000 386000 388000
542000
544000
546000
548000
550000
552000
554000
556000
558000
560000
200
300
400
500
600
700
800
900
1000
1100
1200
1300
1400
1500
1600
1700
1800

120 Ekpo et. al. / Journal of Engineering and Applied Sciences 13 (2018), 110-122
JEAS ISSN: 1119-8109
The blue colour shows a low hydraulic conductivity while the green colour shows a medium
hydraulic conductivity and the red shows a high level of hydraulic conductivity within the study.
Fig.3.7 Hydraulic Conductivity Map of the Study Area
3.7 Transmissivity
Fig 3.8 shows the transmissivity map of the study area. From equation 2.1 &2.2 the calculated
transmissivity (Tc) values of the study area range from 2.5754 to 38.6325cm2/s. Thus, suggesting
a reasonable quality of reservoir as an aquifer. The fundamental knowledge of transmissivity is a
fundamental source of information for establishing a hydrogeological model for the delineation
of potential groundwater zones. From the map the blue regions tend to have lower transmissivity
value while the green and red region tend to have a higher transmissivity value which shows a
prolific zone for groundwater development.
Fig.3.8 Transmissivity Map of the Study Area
3.8. Final Groundwater Potential Map of the Study Area
Final groundwater potential map of the study area was produced by overlaying the concerned
maps in order to draw the final conclusion from the individual maps. The map (Fig. 3.9) presents
370000 372000 374000 376000 378000 380000 382000 384000 386000 388000
542000
544000
546000
548000
550000
552000
554000
556000
558000
560000
0.04
0.06
0.08
0.1
0.12
0.14
0.16
0.18
0.2
0.22
0.24
0.26
0.28
0.3
0.32
0.34
0.36
0.38
0.4
0.42
0.44
0.46
370000 372000 374000 376000 378000 380000 382000 384000 386000 388000
542000
544000
546000
548000
550000
552000
554000
556000
558000
560000
2
4
6
8
10
12
14
16
18
20
22
24
26
28
30
32
34
36
38
40
Ekpo et. al. /Journal of Engineering and Applied Sciences 13 (2018), 110-122 121
JEAS ISSN: 1119-8109
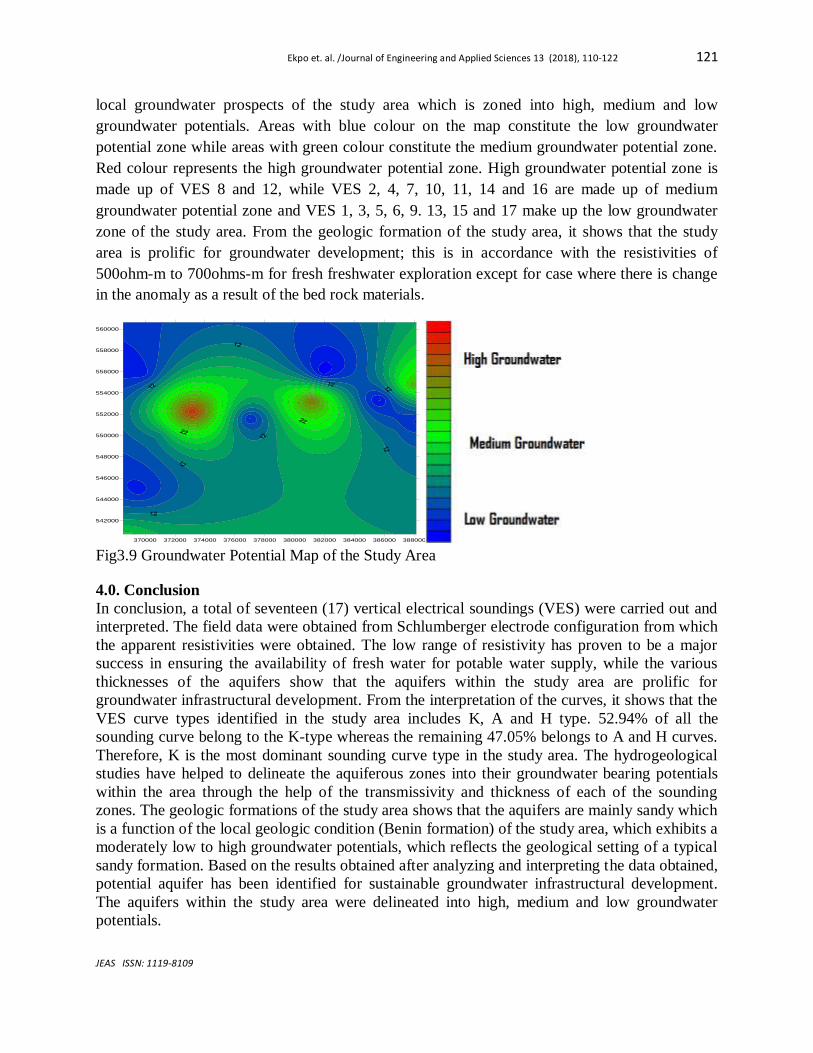
local groundwater prospects of the study area which is zoned into high, medium and low
groundwater potentials. Areas with blue colour on the map constitute the low groundwater
potential zone while areas with green colour constitute the medium groundwater potential zone.
Red colour represents the high groundwater potential zone. High groundwater potential zone is
made up of VES 8 and 12, while VES 2, 4, 7, 10, 11, 14 and 16 are made up of medium
groundwater potential zone and VES 1, 3, 5, 6, 9. 13, 15 and 17 make up the low groundwater
zone of the study area. From the geologic formation of the study area, it shows that the study
area is prolific for groundwater development; this is in accordance with the resistivities of
500ohm-m to 700ohms-m for fresh freshwater exploration except for case where there is change
in the anomaly as a result of the bed rock materials.
Fig3.9 Groundwater Potential Map of the Study Area
4.0. Conclusion
In conclusion, a total of seventeen (17) vertical electrical soundings (VES) were carried out and
interpreted. The field data were obtained from Schlumberger electrode configuration from which
the apparent resistivities were obtained. The low range of resistivity has proven to be a major
success in ensuring the availability of fresh water for potable water supply, while the various
thicknesses of the aquifers show that the aquifers within the study area are prolific for
groundwater infrastructural development. From the interpretation of the curves, it shows that the
VES curve types identified in the study area includes K, A and H type. 52.94% of all the
sounding curve belong to the K-type whereas the remaining 47.05% belongs to A and H curves.
Therefore, K is the most dominant sounding curve type in the study area. The hydrogeological
studies have helped to delineate the aquiferous zones into their groundwater bearing potentials
within the area through the help of the transmissivity and thickness of each of the sounding
zones. The geologic formations of the study area shows that the aquifers are mainly sandy which
is a function of the local geologic condition (Benin formation) of the study area, which exhibits a
moderately low to high groundwater potentials, which reflects the geological setting of a typical
sandy formation. Based on the results obtained after analyzing and interpreting the data obtained,
potential aquifer has been identified for sustainable groundwater infrastructural development.
The aquifers within the study area were delineated into high, medium and low groundwater
potentials.
370000 372000 374000 376000 378000 380000 382000 384000 386000 388000
542000
544000
546000
548000
550000
552000
554000
556000
558000
560000

122 Ekpo et. al. / Journal of Engineering and Applied Sciences 13 (2018), 110-122
JEAS ISSN: 1119-8109
5.0 Recommendation
This research presents the hydro-geological knowledge of Uyo in order to create awareness on
the productive aquifer for sustainable groundwater development within the study area. The depth
to top of aquifer in the study area varies between 42m and 160m with an average depth of
103.4m for groundwater abstraction. Therefore, to avoid excessive drilling, wastage of resources
and reduce pumping cost, the above depths should be targeted for groundwater infrastructural
development.
References
1. Alile, M.O., Jegede, S. I. and Ehigiato, O. M. (2008). Underground water Exploration Using
Electrical Method in Edo State. Asian Journal of Earth Sciences, 1(1): 38-42.
2. Akpabio, I. O., Ejedawe, J. E., Ebeniro, J. O. and Uko, E. D. (2003). Geothermal gradient in
the Niger Delta from continuous temperature logs. Global Journal of Pure and Applied Sciences;
Vol. 9 (No. 2): 265-271.
3. Anizoba, D., Orakwe, L., Chukwuma, E. and Nwoke O. (2015). Delineation of potential
groundwater zones using geo- electrical sounding data at Awka in Anambra State, South-eastern
Nigeria. European Journal of Biotechnology and Bioscience, 3(1):01-05.
4. Asawa, G. L. (2009). Irrigation and Water Resources Engineering. New Delhi, New Age
International Limited Publishers.
5. Jha, M. K., Kumar, S. and Chowdhury, A. (2008). Vertical electrical sounding survey and
resistivity inversion using genetic algorithm optimization technique. Journal of Hydrology, 359,
71– 87.
6. Ekpo, A. E., Orakwe, L. C., Ekpo, F.E. and Eyeneka, F. D. (2016). Evaluating the Protective
Capacity of Aquifers at Uyo in Akwa Ibom State, Southern Nigeria, using the Vertical Electrical
Sounding (VES) Technique.International Advanced Research Journal in Science, Engineering
and Technology, Vol. 3(1): 34-39.
7. Ekwere, S. J., Esu, E. O., Okereke, C. S. and Akpan, E. B. (1994). Evaluation of Limestone in
Obotme Area, Southeastern Nigeria. for Potland Cement Manufacture. Journal of Mining and
Geology. 30(2):145-150
8. Ishola K, Ogunsanya S, Adiat K, Abdulrahman A. (2013). Assessing Groundwater Potential
Zones in Basement Complex Terrain Using Resistivity Depth Soundings: A Case of Challenge
and Oluyole in Ibadan, Southwestern. Nigeria Journal of Science; 1(1)11-32
9. Mbipom, E. N., Okwueze, E. E. and Onwegbuche, A. A. (1996). Estimation of transmissivity
using VES data from the Mbaise area of Nigeria. Nigeria Journal of Physics, V. 85, pp 28-32
10. Michael A.M. (1978). Irrigation Theory and Practice. New Delhi; Vikas Publishing House.
11. Niwas, S. and Singhal, D. C. (1981). Estimation of Aquifer Transmissivity from Dar Zarrouk
Parameters in Porous Media. Hydrology 50: 393-399
12. Ozegin, K. O. and Oseghale, A. O. (2012).Geophysical Characterization of Shallow Aquifers
in a Sedimentary Area: A Case Study. Advances in Applied Science Research, 3 (1):469-474.
13. Short, K. C. and Stauble, A. J. (1967). Outline Geology of Niger-Delta. 51(5): 761-779.