jejunal luminal microdialysate lactate in cardiac tamponade - effect of low systemic blood flow on...
TRANSCRIPT
Received: 16 May 2001Accepted: 29 March 2002Published online: 17 May 2002© Springer-Verlag 2002
This study was supported in part by a grantfrom Kuopio University Hospital.
Abstract Objective: To assess gutmucosal metabolic response and susceptibility to dysoxia during lowsystemic blood flow induced by car-diac tamponade. Design: A random-ized, controlled animal experiment.Setting: National laboratory animalcenter. Interventions: Cardiac tam-ponade was induced in six pigs,while six additional pigs served ascontrols. In the tamponade group,fluid was injected into the pericardialspace to reduce aortic flow, aimingfirst at a flow of 50 ml/kg per minand then at 30 ml/kg per min. Eachstep lasted for 60 min. Measurementsand results: We measured luminallactate by microdialysis and mucosalPCO2 by tonometry in the mid-jeju-num. Aortic and superior mesentericartery blood flow, arterial and me-senteric venous lactate, pyruvate andketone bodies and regional lactateexchange were measured. The distri-bution of aortic blood flow to superi-or mesenteric artery remained un-changed (baseline 14 (12–16)%; median (interquartile range), step-wise flow reduction 11 (10–17)%
and 13 (12–19)%, NS) during re-duction of aortic blood flow from 81 (61–95) ml/kg per min to 49(47–49) ml/kg per min and 23(21–27) ml/kg per min. Systemic hyperlactatemia developed early,whereas gut luminal lactate in-creased only after 60 min of hypo-perfusion and could be largely ex-plained by arterial hyperlactatemia.Mesenteric venous lactate-to-pyru-vate (L/P) ratio increased after30 min of tamponade, but both ve-nous-arterial lactate and pyruvategradients turned negative (gut lactateand pyruvate uptake). Mesenteric ve-nous ß-hydroxybutyrate to acetoace-tate ratio increased after 60 min. Nochanges were observed in the con-trols. Conclusions: Jejunal mucosaldysoxia and anaerobic metabolismoccurs late during low systemicblood flow induced by experimentalcardiac tamponade.
Keywords Microdialysis · Tonometry · Lactate · lactic acid ·Splanchnic circulation · Intestinal ·Hypoperfusion
Intensive Care Med (2002) 28:953–962DOI 10.1007/s00134-002-1314-6 E X P E R I M E N TA L
Jyrki Juhani TenhunenStephan JakobEsko RuokonenJukka Takala
Jejunal luminal microdialysate lactate in cardiac tamponade – effect of low systemicblood flow on gut mucosa
Introduction
Inadequate visceral perfusion may interfere with the in-tegrity of the intestinal mucosal barrier and contribute tothe development of multiple organ dysfunction [1]. Ear-lier studies have shown that low systemic blood flow dueto cardiogenic [2, 3] or hemorrhagic shock [4, 5] leads todisproportionately low splanchnic blood flow. Others
have reported controversial results with sustainedsplanchnic perfusion despite low systemic blood flow [6, 7, 8]. Due to anatomical and physiologic characteris-tics [9, 10, 11, 12], the mucosa may be particularly sus-ceptible to low blood flow and, thereby, to anaerobic me-tabolism, dysoxia (inadequate oxygen supply to meet thedemand) and, consequently, to ischemic tissue damage.Early ischemia of the gut mucosa, as compared to serosa,
J.J. Tenhunen (✉ ) · S. Jakob · E. Ruokonen J. TakalaDivision of Intensive Care, Department of Anesthesiology and Intensive Care, University Hospital of Kuopio, P.O.B 1777, 70211 Kuopio, Finlande-mail: [email protected].: +358-17-173430Fax: +358-17-173443
Present address:J. Takala, Department of Intensive Care Medicine,University Hospital of Bern (Inselspital),Bern, Switzerland
occurs during low perfusion in regional, selective intes-tinal ischemia [13]. Less is known about systemic lowflow states, where neurohumoral compensatory mecha-nisms may alter the distribution of capillary blood flowbetween different layers of intestinal wall [3, 14, 15, 16,17]. The mucosal metabolic changes during systemiclow flow and the threshold of flow that leads to anaero-bic metabolism have not been well established.
The aim of this study was to test the hypothesis thatgut mucosal metabolism is disturbed early during pro-gressive low systemic blood flow. Specifically, we wanted to determine the threshold systemic hypoperfu-sion which leads to mucosal dysoxia and gut luminal lac-tate release. We assessed gut metabolism by luminal mi-crodialysis, tonometry and regional markers of cellularredox state.
Materials and methods
This study was approved by the Institutional Animal Care and UseCommittee of the University of Kuopio. The 12 animals in thepresent experiment were included in a larger study (n=24), whichfocused on hepatic arterial buffer response [18]. Gut luminal mi-crodialysis was performed only in these 12 animals, which repres-ent one of the two blocks in the block randomization protocol ofthe larger series. In this earlier report, part of the data: the meanvalues for central hemodynamics, gut mucosal PCO2 gradients andluminal lactate concentrations, were reported to characterize themodel of cardiac tamponade. The relationships and individual re-sponses between local and regional perfusion and metabolic vari-ables were not evaluated. In the present investigation we focusedon metabolism over the jejunal wall and mucosa. In our detailedanalysis we present new data of the associations between luminalmicrodialysate lactate versus arterial lactate, systemic and regionallactate/pyruvate (L/P) ratios, regional pyruvate gradients and sys-temic and regional ketone body ratios.
Anesthesia
Twelve female pigs (range 27–40 kg) were deprived of food withfree access to water 12 h before the experiments. The animalswere premedicated with atropine 0.05 mg/kg and azaperone8 mg/kg intramuscularly, followed by cannulation of an ear veinand intravenous administration of 5–15 mg/kg thiopentone for en-dotracheal intubation 10 min later. Anesthesia was maintainedwith thiopental 5 mg/kg per h and fentanyl (30 µg/kg per h untilthe end of the operation and 5 µg/kg per h thereafter). The animalswere ventilated with a volume-controlled mode without a positiveend-expiratory pressure. FIO2 was adjusted to keep PaO2 levelsabove 13.3 kPa (100 mmHg). Tidal volume was kept at 10 ml/kgand the minute ventilation adjusted to maintain PaCO2 levels be-tween 4.5 and 5.5 kPa (33–45 mmHg).
Animal preparation
We inserted a pulmonary artery catheter via the left, and a livervein catheter via the right, internal jugular vein. A catheter was in-serted into the right femoral artery. The abdominal cavity was ex-posed by a midline abdominal incision. The descending aorta andsuperior mesenteric artery were exposed and flow probes placedaround the vessels. The hepatic artery and portal veins were ex-
posed and ultrasonic flow probes placed around each of them.Two fluid-filled catheters were inserted, respectively, proximallyand distally into a mesenteric vein. The tip of the first one was leftin the mesenteric vein, while the tip of the second one was posi-tioned within the portal vein. An incision was made in the centraldiaphragm and a fluid-filled catheter inserted into the pericardialspace. The catheter was tightly fixed to the pericardium and thepericardium carefully closed. A tonometer (Tonomitor, Tonomet-rics, Worcester, Me., USA) was inserted into the jejunum througha small ante-mesenteric incision 80 cm distal from the duodenum.When all surgical procedures were completed, the abdominal wallwas re-approximated and towels were placed on the surface tominimize heat loss. After surgical preparation, 90 min was al-lowed for hemodynamic stabilization and thereafter the animalswere randomly allocated to the cardiac tamponade group (n=6) orcontrols (n=6).
Hemodynamic monitoring and fluid management
Systemic and pulmonary arterial, as well as central venous andpulmonary capillary wedge pressures were recorded with quartzpressure transducers and the first three pressures displayed contin-uously on a multimodular monitor (AS3, Datex-Engström, Espoo,Finland) and recorder. All pressure transducers were calibrated si-multaneously and zeroed to the level of the heart. Heart rate wasmeasured from the ECG, which was also continuously monitored.Cardiac output was measured by a thermodilution technique as themean value of three measurements using a cardiac output moduleof a patient monitor (AS/3, Datex, Division of Instrumentarium,Helsinki, Finland). Central venous blood temperature was record-ed from the thermistor in the pulmonary artery catheter. Bloodsamples for hemoglobin concentrations were drawn from the fem-oral artery catheter.
During the experiment the animals received saline (0.9%) of5 ml/kg per h. Additional Ringer’s acetate (Ringersteril, Orion-Medipolar, Oulu, Finland) and hydroxyethyl starch (Plasmafusin,Kabi-Pharmacia, Uppsala, Sweden) in the ratio of 1:1 were admin-istered if necessary to keep the pulmonary capillary wedge pres-sure between 7–11 mmHg. The body temperature of the animalswas kept at 38±1°C using an operating table heater and warmedfluids.
Respiratory monitoring
Expired minute volume ventilation, tidal volume, respiratory rate,PEEP, peak and end-inspiratory pressures and end tidal carbon dioxide concentration (ETCO2) were monitored continuouslythroughout the study. Blood samples for arterial blood gas analy-sis were drawn from the femoral artery and analyzed immedia-tely (temperature corrected) in a blood gas analyzer (ABL 500,Radiometer, Copenhagen, Denmark).
Blood flow measurements
Regional blood flows were measured with ultrasound transit timeflow probes (Transonic Systems, Ithaca, NY, USA) around theaorta, superior mesenteric artery, portal vein and hepatic artery.The transit time ultrasound volume flowmeter has been demon-strated to provide adequate measurements of arterial and venousflows in experimental animals if carefully positioned and alignedwith respect to the vessel [19, 20]. The perivascular ultrasoundflow probes were calibrated with an in vitro calibration systemand in vivo calibration was performed before each experiment.Signals from the flowmeters (T206 and T106, Transonic) were re-corded on a computer program for further analysis (Dataq instru-ments Windaq 1.60, Dataq instruments, Akron, Ohio, USA).
954
Gut luminal microdialysis
We [21, 22] and others [23] have used intestinal luminal microdi-alysis to reflect low intestinal perfusion and mucosal ischemia inexperimental intestinal ischemia. The microdialysis capillary wasdesigned and manufactured in our laboratory. It has previouslybeen validated for lactate sampling both in vitro and in vivo [21].A capillary membrane of polysulfone with 60000 daltons pore sizewas used (Fresenius, Fresenius, Bad Homburg, Germany). The in-ner diameter of the capillary was 200 µm. The length of the semi-permeable part of the capillary was 2 cm. The outflow tubing wasof 0.134mm inner diameter (PTFE transparent, BOC Ohmeda,Espoo, Finland) with a total length of 100 cm from the capillary tothe sample tube. The inflow and outflow tubing was inserted in-side the tonometer catheter and the microdialysis capillaries werefixed on the surface of the tonometer balloon. The time delay fromthe capillary to the sample tube was 7 min. The sampling was ad-justed according to this time delay. The microdialysate (Ringer’sacetate, Ringersteril, Orion-Medipolar, Oulu, Finland) flow ratewas adjusted to 2 µl/min with microdialysis pumps (CarnagieMedicine, Stockholm, Sweden).
Each sample was collected over 30 min into ice-cooled poly-propylene tubes. Microdialysate lactate concentration was mea-sured within 5 min (YSI 2300 Stat Plus, Yellow Springs Instru-ments, Yellow Springs, Ohio). Time resolution: gut luminal micro-dialysate lactate increases during the first 30 min of selective totalocclusion of superior mesenteric artery [21]. Regional thresholdblood flow (which induces gut luminal lactate release): selectivegradual decrease of superior mesenteric arterial blood flow induc-es gut luminal lactate release when the median blood flow is lowerthan 10 ml/kg per min [22]. Selective superior mesenteric arteryblood flow reduction to a median level of 4 ml/kg per min for60 min induces luminal lactate release to a median of 3.4 mmol/l.In vivo recovery in the blood stream approximates 100% [21]. Invitro recovery, as evaluated here in Ringer’s acetate at 38°C, is78% at a mean concentration of 0.74 mmol/l (n=6) with coeffi-cient of variation (CV) of 1.9% between the capillaries and 82% at4.2 mmol/l (n=5) with CV of 2.6%.
Tonometry and partial pressure of carbon dioxide gradients
We measured jejunal mucosal PCO2 with a semi-automatic gas an-alyzer [24] (Tonocap, Datex-Ohmeda, Helsinki, Finland) every10 min throughout the experiment. The device was calibrated ev-ery 2 months according to the guidelines of the manufacturer. Thetonometric-arterial PCO2 gradient (D(muc-art)PCO2) was calculatedat baseline, immediately after the tamponade was induced and ev-ery 30 min thereafter. We did not use H2-blockers. The mesentericvenous-arterial PCO2 gradient (D(v-a)PCO2) was calculated fromcorresponding blood samples for blood gas analysis (ABL 520 ra-diometer, Copenhagen, Denmark). We estimated regional CO2production by using an iterative procedure for regional arteriove-nous CO2 content difference [25] multiplied by superior mesenter-ic artery blood flow.
Lactate, pyruvate, ß-hydroxybutyrate and acetoacetate measurements
We used the enzymatic lactate oxidase method with polarographicdetection for both microdialysate and plasma lactate measure-ments (YSI 2300 Stat Plus, Yellow Springs Instruments, YellowSprings, Ohio). In our laboratory, the inter-assay CVs for meanconcentrations of 5.2 mmol/l and 15.1 mmol/l were 2.7% (n=27)and 2.0% (n=27), respectively. The intra-assay CVs for mean lac-tate concentrations of 0.8 mmol/l (n=10), 3.3 mmol/l (n=10) and7.9 mmol/l (n=19) were 1.3%, 0.9% and 0.6%, respectively. Wemeasured whole blood pyruvate enzymatically (Sigma’s UV-706kit, Sigma Diagnostics, St. Louis, Mo., USA) with spectrophoto-
metric detection (Shimadzu CL-750, Shimadzu, Kyoto, Japan).The pyruvate measurements were performed the next day. Intra-assay CV at a mean concentration of 101 µmol/l was 4.4%. Inter-assay CV for mean pyruvate concentrations of 100 µmol/l and200 µmol/l were 4.3% and 2.6%, respectively (n=31).
Plasma acetoacetate and ß-hydroxybutyrate was determinedwith enzymatic method (hydroxybutyrate-dehydrogenase, Boeh-ringer Mannheim, Germany). Briefly, in acetoacetate detectionOHBUT-dehydrogenase catalyzes the reaction: acetoacetate+NADH+H+ → OHBUT + NAD. The acetoacetate concentration is determined kinetically by detecting the reduction of NADH ab-sorbance at 340 nM wavelength. ß-OHBUT is determined with re-versed reaction. The intra-assay CVs at mean concentrations of0.24 mmol/l and 1.0 mmol/l of acetoacetate were 10.9% and 2.9%,respectively (n=10). The inter-assay CVs at the same concentra-tions were 8.9% and 4.5% (n=31). CVs for ß-hydroxybutyrate at0.22 mmol/l and 3.88 mmol/l were 6.9% and 1.4%, respectively(n=10). Inter-assay CVs were 6.5% and 2.0% (n=31).
Experimental protocol
Following baseline measurements and samples, cardiac output wasreduced in two steps lasting 60 min each by injecting warm hy-droxyethyl starch into the pericardial space. In order to achievehigh repeatability of the intervention among the animals, we ad-justed the volume of fluid according to target aortic blood flows(measured online) of 50 and 30 ml/kg per min. During the studyperiod jejunal luminal microdialysate lactate was collected every30 min. Blood samples from the femoral artery, pulmonary artery,portal, mesenteric and liver veins were drawn at the end of the sta-bilization period and every 30 min thereafter until the end of theexperiment for the measurement of blood gases, lactate, pyruvate,ß-hydroxybutyrate, acetoacetate and hemoglobin concentrations.In the control animals, the corresponding measurements were car-ried out in exactly the same way. Hepatic arterial buffer response(HABR) was tested in both tamponade and control animals every30 min by occluding the portal vein for 20–30 s. The HABR re-sults are reported elsewhere [18].
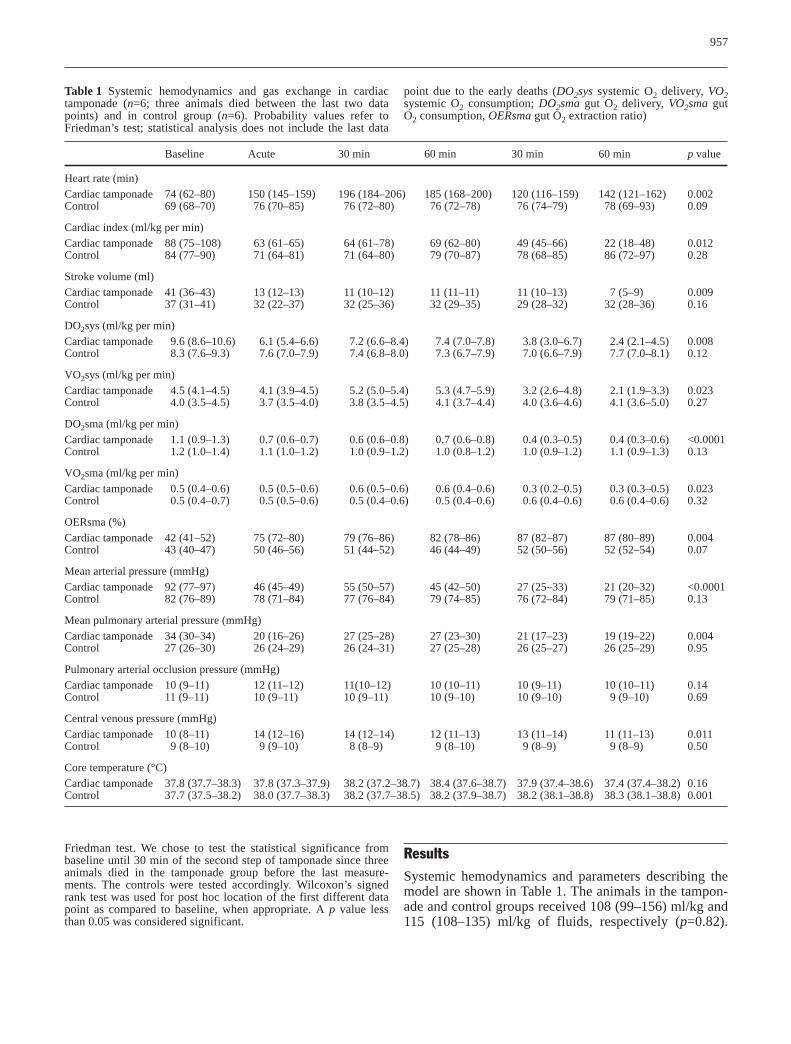
Upper normal limit of gut luminal lactate
Systemic hyperlactatemia develops during systemic hypoperfusionand severe hyperlactatemia also has an effect on gut luminal lac-
955
Fig. 1 Upper normal limit of gut luminal lactate defined by threelevels of mean + 2SD during non-ischemic hyperlactatemia (re-calculated from [21]). Individual arterial lactate concentrationsagainst corresponding gut luminal lactate at baseline (open triangles), first step of lactate infusion (open quadrangle) and second step of lactate infusion (open circle)
956
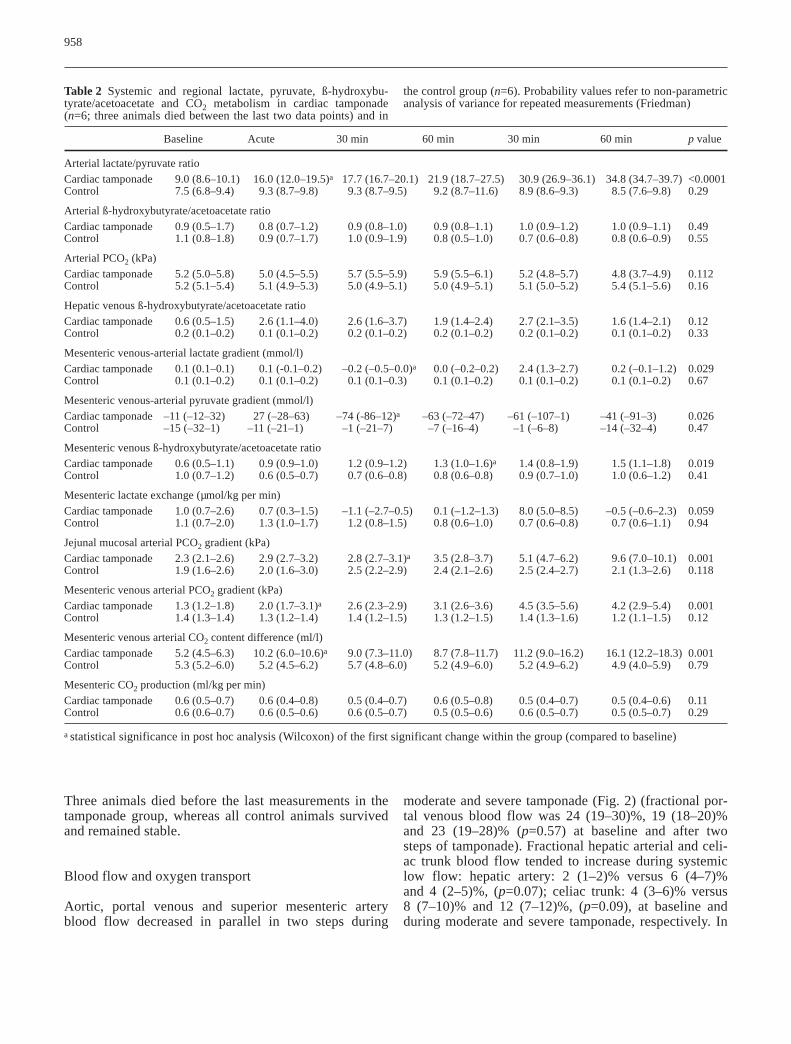
Fig. 2 Aortic blood flow (left upper panel), superior mesentericartery flow (left middle panel) and % fraction of superior mesen-teric artery from aortic flow (lower left panel) during progressivecardiac tamponade (grey columns) and control conditions (whitecolumns). Corresponding arterial lactate (right upper panel), jeju-nal luminal microdialysate lactate (right middle panel) and mesen-teric venous-arterial lactate concentration gradient (lower rightpanel) during progressive tamponade (grey columns) and controlconditions (white columns). Data is presented as median (inter-quartile range). Numeric p values refer to analysis of variance forrepeated measurements (Friedman). *p<0.05, Wilcoxon
tate. We therefore defined the upper normal limit of gut luminallactate under normal and hyperlactatemic conditions by re-analyz-ing the data from our previous study [21]. Briefly, the effect ofnon-ischemic hyperlactatemia on jejunal luminal lactate was de-fined by lactate clamp (arterial lactate was increased stepwise bysystemic lactate infusion to 5 and 10 mmol/l). After the surgicalprocedures the animals (n=6) were allowed to stabilize for 90 min.One 30min baseline microdialysate lactate sample was collectedfrom a capillary in the mesenteric artery and the corresponding ar-terial whole blood lactate was measured. A continuous intravenous
infusion of sodium lactate at 4 mmol/kg per h was started after apriming dose of 6 mmol/kg. The infusion rate was adjusted accord-ing to whole blood lactate measurements taken every 5 min. Weaimed at steady state condition in two steps each lasting 90 minwith target concentrations of 5 mmol/l and 10 mmol/l. The wholeblood lactate was measured within 5 min from sampling (YSI 2300Stat Plus, Yellow Springs Instruments, Yellow Springs, Ohio). Asecond bolus of sodium lactate was given after the first 90 min(12 mmol/kg) and the infusion rate increased to obtain the higherarterial whole blood lactate concentration. [Details in ref. 21].
The mean + 2 SD for arterial lactate and corresponding lumi-nal lactate was calculated at baseline and during each step. A lin-ear trend line was drawn through three 2 SD points giving the upper normal limit of jejunal luminal lactate in relation to arterialhyperlactatemia without intestinal ischemia (Fig. 1).
Statistics
The results are expressed as medians and interquartile ranges un-less otherwise indicated. The statistical analysis was performedwith a software package (SPSS 9.0, SPSS, Chicago, Ill.). The sig-nificance of the changes within groups were tested by using the
Friedman test. We chose to test the statistical significance frombaseline until 30 min of the second step of tamponade since threeanimals died in the tamponade group before the last measure-ments. The controls were tested accordingly. Wilcoxon’s signedrank test was used for post hoc location of the first different datapoint as compared to baseline, when appropriate. A p value lessthan 0.05 was considered significant.
ResultsSystemic hemodynamics and parameters describing themodel are shown in Table 1. The animals in the tampon-ade and control groups received 108 (99–156) ml/kg and115 (108–135) ml/kg of fluids, respectively (p=0.82).
957
Table 1 Systemic hemodynamics and gas exchange in cardiactamponade (n=6; three animals died between the last two datapoints) and in control group (n=6). Probability values refer toFriedman’s test; statistical analysis does not include the last data
point due to the early deaths (DO2sys systemic O2 delivery, VO2systemic O2 consumption; DO2sma gut O2 delivery, VO2sma gutO2 consumption, OERsma gut O2 extraction ratio)
Baseline Acute 30 min 60 min 30 min 60 min p value
Heart rate (min)Cardiac tamponade 74 (62–80) 150 (145–159) 196 (184–206) 185 (168–200) 120 (116–159) 142 (121–162) 0.002Control 69 (68–70) 76 (70–85) 76 (72–80) 76 (72–78) 76 (74–79) 78 (69–93) 0.09
Cardiac index (ml/kg per min)Cardiac tamponade 88 (75–108) 63 (61–65) 64 (61–78) 69 (62–80) 49 (45–66) 22 (18–48) 0.012Control 84 (77–90) 71 (64–81) 71 (64–80) 79 (70–87) 78 (68–85) 86 (72–97) 0.28
Stroke volume (ml)Cardiac tamponade 41 (36–43) 13 (12–13) 11 (10–12) 11 (11–11) 11 (10–13) 7 (5–9) 0.009Control 37 (31–41) 32 (22–37) 32 (25–36) 32 (29–35) 29 (28–32) 32 (28–36) 0.16
DO2sys (ml/kg per min)Cardiac tamponade 9.6 (8.6–10.6) 6.1 (5.4–6.6) 7.2 (6.6–8.4) 7.4 (7.0–7.8) 3.8 (3.0–6.7) 2.4 (2.1–4.5) 0.008Control 8.3 (7.6–9.3) 7.6 (7.0–7.9) 7.4 (6.8–8.0) 7.3 (6.7–7.9) 7.0 (6.6–7.9) 7.7 (7.0–8.1) 0.12
VO2sys (ml/kg per min)Cardiac tamponade 4.5 (4.1–4.5) 4.1 (3.9–4.5) 5.2 (5.0–5.4) 5.3 (4.7–5.9) 3.2 (2.6–4.8) 2.1 (1.9–3.3) 0.023Control 4.0 (3.5–4.5) 3.7 (3.5–4.0) 3.8 (3.5–4.5) 4.1 (3.7–4.4) 4.0 (3.6–4.6) 4.1 (3.6–5.0) 0.27
DO2sma (ml/kg per min)Cardiac tamponade 1.1 (0.9–1.3) 0.7 (0.6–0.7) 0.6 (0.6–0.8) 0.7 (0.6–0.8) 0.4 (0.3–0.5) 0.4 (0.3–0.6) <0.0001Control 1.2 (1.0–1.4) 1.1 (1.0–1.2) 1.0 (0.9–1.2) 1.0 (0.8–1.2) 1.0 (0.9–1.2) 1.1 (0.9–1.3) 0.13
VO2sma (ml/kg per min)Cardiac tamponade 0.5 (0.4–0.6) 0.5 (0.5–0.6) 0.6 (0.5–0.6) 0.6 (0.4–0.6) 0.3 (0.2–0.5) 0.3 (0.3–0.5) 0.023Control 0.5 (0.4–0.7) 0.5 (0.5–0.6) 0.5 (0.4–0.6) 0.5 (0.4–0.6) 0.6 (0.4–0.6) 0.6 (0.4–0.6) 0.32
OERsma (%)Cardiac tamponade 42 (41–52) 75 (72–80) 79 (76–86) 82 (78–86) 87 (82–87) 87 (80–89) 0.004Control 43 (40–47) 50 (46–56) 51 (44–52) 46 (44–49) 52 (50–56) 52 (52–54) 0.07
Mean arterial pressure (mmHg)Cardiac tamponade 92 (77–97) 46 (45–49) 55 (50–57) 45 (42–50) 27 (25–33) 21 (20–32) <0.0001Control 82 (76–89) 78 (71–84) 77 (76–84) 79 (74–85) 76 (72–84) 79 (71–85) 0.13
Mean pulmonary arterial pressure (mmHg)Cardiac tamponade 34 (30–34) 20 (16–26) 27 (25–28) 27 (23–30) 21 (17–23) 19 (19–22) 0.004Control 27 (26–30) 26 (24–29) 26 (24–31) 27 (25–28) 26 (25–27) 26 (25–29) 0.95
Pulmonary arterial occlusion pressure (mmHg)Cardiac tamponade 10 (9–11) 12 (11–12) 11(10–12) 10 (10–11) 10 (9–11) 10 (10–11) 0.14Control 11 (9–11) 10 (9–11) 10 (9–11) 10 (9–10) 10 (9–10) 9 (9–10) 0.69
Central venous pressure (mmHg)Cardiac tamponade 10 (8–11) 14 (12–16) 14 (12–14) 12 (11–13) 13 (11–14) 11 (11–13) 0.011Control 9 (8–10) 9 (9–10) 8 (8–9) 9 (8–10) 9 (8–9) 9 (8–9) 0.50
Core temperature (°C)Cardiac tamponade 37.8 (37.7–38.3) 37.8 (37.3–37.9) 38.2 (37.2–38.7) 38.4 (37.6–38.7) 37.9 (37.4–38.6) 37.4 (37.4–38.2) 0.16Control 37.7 (37.5–38.2) 38.0 (37.7–38.3) 38.2 (37.7–38.5) 38.2 (37.9–38.7) 38.2 (38.1–38.8) 38.3 (38.1–38.8) 0.001
Three animals died before the last measurements in thetamponade group, whereas all control animals survivedand remained stable.
Blood flow and oxygen transport
Aortic, portal venous and superior mesenteric arteryblood flow decreased in parallel in two steps during
moderate and severe tamponade (Fig. 2) (fractional por-tal venous blood flow was 24 (19–30)%, 19 (18–20)%and 23 (19–28)% (p=0.57) at baseline and after twosteps of tamponade). Fractional hepatic arterial and celi-ac trunk blood flow tended to increase during systemiclow flow: hepatic artery: 2 (1–2)% versus 6 (4–7)% and 4 (2–5)%, (p=0.07); celiac trunk: 4 (3–6)% versus8 (7–10)% and 12 (7–12)%, (p=0.09), at baseline andduring moderate and severe tamponade, respectively. In
958
Table 2 Systemic and regional lactate, pyruvate, ß-hydroxybu-tyrate/acetoacetate and CO2 metabolism in cardiac tamponade(n=6; three animals died between the last two data points) and in
the control group (n=6). Probability values refer to non-parametricanalysis of variance for repeated measurements (Friedman)
Baseline Acute 30 min 60 min 30 min 60 min p value
Arterial lactate/pyruvate ratioCardiac tamponade 9.0 (8.6–10.1) 16.0 (12.0–19.5)a 17.7 (16.7–20.1) 21.9 (18.7–27.5) 30.9 (26.9–36.1) 34.8 (34.7–39.7) <0.0001Control 7.5 (6.8–9.4) 9.3 (8.7–9.8) 9.3 (8.7–9.5) 9.2 (8.7–11.6) 8.9 (8.6–9.3) 8.5 (7.6–9.8) 0.29
Arterial ß-hydroxybutyrate/acetoacetate ratioCardiac tamponade 0.9 (0.5–1.7) 0.8 (0.7–1.2) 0.9 (0.8–1.0) 0.9 (0.8–1.1) 1.0 (0.9–1.2) 1.0 (0.9–1.1) 0.49Control 1.1 (0.8–1.8) 0.9 (0.7–1.7) 1.0 (0.9–1.9) 0.8 (0.5–1.0) 0.7 (0.6–0.8) 0.8 (0.6–0.9) 0.55
Arterial PCO2 (kPa)Cardiac tamponade 5.2 (5.0–5.8) 5.0 (4.5–5.5) 5.7 (5.5–5.9) 5.9 (5.5–6.1) 5.2 (4.8–5.7) 4.8 (3.7–4.9) 0.112Control 5.2 (5.1–5.4) 5.1 (4.9–5.3) 5.0 (4.9–5.1) 5.0 (4.9–5.1) 5.1 (5.0–5.2) 5.4 (5.1–5.6) 0.16
Hepatic venous ß-hydroxybutyrate/acetoacetate ratioCardiac tamponade 0.6 (0.5–1.5) 2.6 (1.1–4.0) 2.6 (1.6–3.7) 1.9 (1.4–2.4) 2.7 (2.1–3.5) 1.6 (1.4–2.1) 0.12Control 0.2 (0.1–0.2) 0.1 (0.1–0.2) 0.2 (0.1–0.2) 0.2 (0.1–0.2) 0.2 (0.1–0.2) 0.1 (0.1–0.2) 0.33
Mesenteric venous-arterial lactate gradient (mmol/l)Cardiac tamponade 0.1 (0.1–0.1) 0.1 (-0.1–0.2) –0.2 (–0.5–0.0)a 0.0 (–0.2–0.2) 2.4 (1.3–2.7) 0.2 (–0.1–1.2) 0.029Control 0.1 (0.1–0.2) 0.1 (0.1–0.2) 0.1 (0.1–0.3) 0.1 (0.1–0.2) 0.1 (0.1–0.2) 0.1 (0.1–0.2) 0.67
Mesenteric venous-arterial pyruvate gradient (mmol/l)Cardiac tamponade –11 (–12–32) 27 (–28–63) –74 (-86–12)a –63 (–72–47) –61 (–107–1) –41 (–91–3) 0.026Control –15 (–32–1) –11 (–21–1) –1 (–21–7) –7 (–16–4) –1 (–6–8) –14 (–32–4) 0.47
Mesenteric venous ß-hydroxybutyrate/acetoacetate ratioCardiac tamponade 0.6 (0.5–1.1) 0.9 (0.9–1.0) 1.2 (0.9–1.2) 1.3 (1.0–1.6)a 1.4 (0.8–1.9) 1.5 (1.1–1.8) 0.019Control 1.0 (0.7–1.2) 0.6 (0.5–0.7) 0.7 (0.6–0.8) 0.8 (0.6–0.8) 0.9 (0.7–1.0) 1.0 (0.6–1.2) 0.41
Mesenteric lactate exchange (µmol/kg per min)Cardiac tamponade 1.0 (0.7–2.6) 0.7 (0.3–1.5) –1.1 (–2.7–0.5) 0.1 (–1.2–1.3) 8.0 (5.0–8.5) –0.5 (–0.6–2.3) 0.059Control 1.1 (0.7–2.0) 1.3 (1.0–1.7) 1.2 (0.8–1.5) 0.8 (0.6–1.0) 0.7 (0.6–0.8) 0.7 (0.6–1.1) 0.94
Jejunal mucosal arterial PCO2 gradient (kPa)Cardiac tamponade 2.3 (2.1–2.6) 2.9 (2.7–3.2) 2.8 (2.7–3.1)a 3.5 (2.8–3.7) 5.1 (4.7–6.2) 9.6 (7.0–10.1) 0.001Control 1.9 (1.6–2.6) 2.0 (1.6–3.0) 2.5 (2.2–2.9) 2.4 (2.1–2.6) 2.5 (2.4–2.7) 2.1 (1.3–2.6) 0.118
Mesenteric venous arterial PCO2 gradient (kPa)Cardiac tamponade 1.3 (1.2–1.8) 2.0 (1.7–3.1)a 2.6 (2.3–2.9) 3.1 (2.6–3.6) 4.5 (3.5–5.6) 4.2 (2.9–5.4) 0.001Control 1.4 (1.3–1.4) 1.3 (1.2–1.4) 1.4 (1.2–1.5) 1.3 (1.2–1.5) 1.4 (1.3–1.6) 1.2 (1.1–1.5) 0.12
Mesenteric venous arterial CO2 content difference (ml/l)Cardiac tamponade 5.2 (4.5–6.3) 10.2 (6.0–10.6)a 9.0 (7.3–11.0) 8.7 (7.8–11.7) 11.2 (9.0–16.2) 16.1 (12.2–18.3) 0.001Control 5.3 (5.2–6.0) 5.2 (4.5–6.2) 5.7 (4.8–6.0) 5.2 (4.9–6.0) 5.2 (4.9–6.2) 4.9 (4.0–5.9) 0.79
Mesenteric CO2 production (ml/kg per min)Cardiac tamponade 0.6 (0.5–0.7) 0.6 (0.4–0.8) 0.5 (0.4–0.7) 0.6 (0.5–0.8) 0.5 (0.4–0.7) 0.5 (0.4–0.6) 0.11Control 0.6 (0.6–0.7) 0.6 (0.5–0.6) 0.6 (0.5–0.7) 0.5 (0.5–0.6) 0.6 (0.5–0.7) 0.5 (0.5–0.7) 0.29
a statistical significance in post hoc analysis (Wilcoxon) of the first significant change within the group (compared to baseline)
the control animals both aortic and superior mesentericarterial flows were stable (Fig. 2). Fractional portalblood flow in the control animals remained constant:27 (24–30)% versus 28 (27–35)% and 28 (25–32)%(p=0.37), while fractional flow of hepatic artery in-creased: 2 (2–4)% versus 4 (4–7)% and 5 (5–9)%(p=0.0001). Fractional celiac trunk flow increased simi-larly: 3 (3–5)% versus 6 (5–10)% and 10 (6–11)%(p=0.006). Regional oxygen delivery and oxygen con-sumption decreased, but oxygen extraction ratio in thegut increased (Table 1).
Metabolic changes
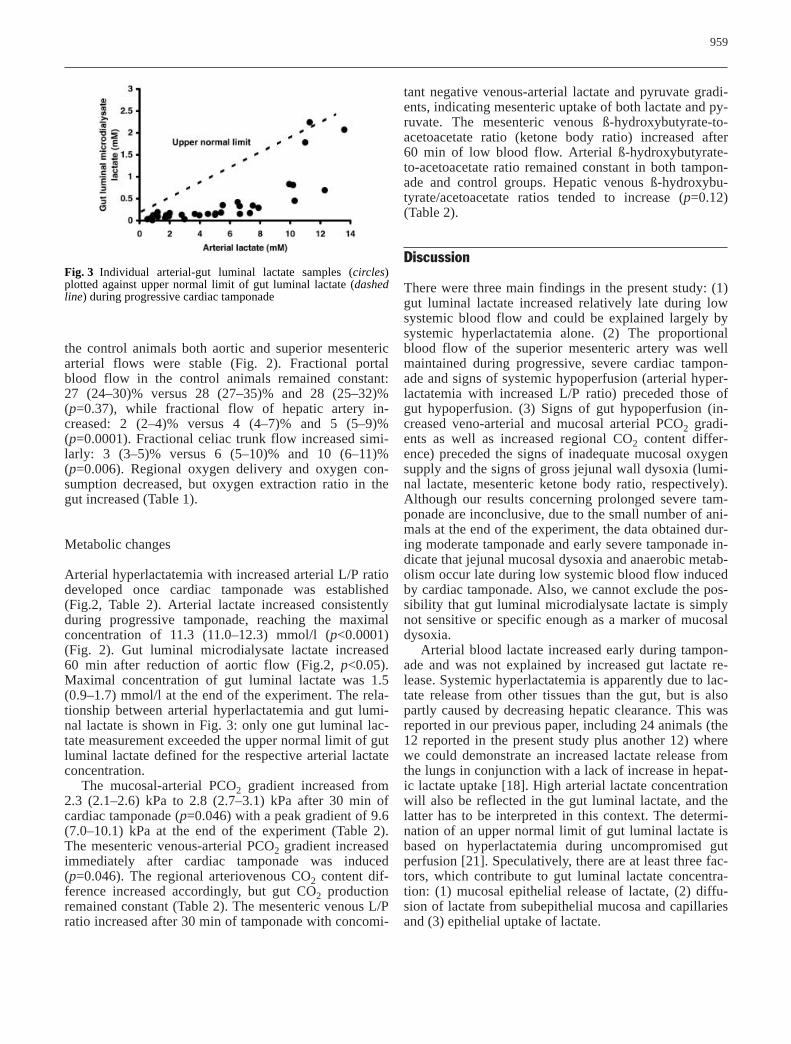
Arterial hyperlactatemia with increased arterial L/P ratiodeveloped once cardiac tamponade was established(Fig.2, Table 2). Arterial lactate increased consistentlyduring progressive tamponade, reaching the maximalconcentration of 11.3 (11.0–12.3) mmol/l (p<0.0001)(Fig. 2). Gut luminal microdialysate lactate increased60 min after reduction of aortic flow (Fig.2, p<0.05).Maximal concentration of gut luminal lactate was 1.5(0.9–1.7) mmol/l at the end of the experiment. The rela-tionship between arterial hyperlactatemia and gut lumi-nal lactate is shown in Fig. 3: only one gut luminal lac-tate measurement exceeded the upper normal limit of gutluminal lactate defined for the respective arterial lactateconcentration.
The mucosal-arterial PCO2 gradient increased from2.3 (2.1–2.6) kPa to 2.8 (2.7–3.1) kPa after 30 min ofcardiac tamponade (p=0.046) with a peak gradient of 9.6(7.0–10.1) kPa at the end of the experiment (Table 2).The mesenteric venous-arterial PCO2 gradient increasedimmediately after cardiac tamponade was induced(p=0.046). The regional arteriovenous CO2 content dif-ference increased accordingly, but gut CO2 productionremained constant (Table 2). The mesenteric venous L/Pratio increased after 30 min of tamponade with concomi-
tant negative venous-arterial lactate and pyruvate gradi-ents, indicating mesenteric uptake of both lactate and py-ruvate. The mesenteric venous ß-hydroxybutyrate-to-acetoacetate ratio (ketone body ratio) increased after60 min of low blood flow. Arterial ß-hydroxybutyrate-to-acetoacetate ratio remained constant in both tampon-ade and control groups. Hepatic venous ß-hydroxybu-tyrate/acetoacetate ratios tended to increase (p=0.12)(Table 2).
Discussion
There were three main findings in the present study: (1)gut luminal lactate increased relatively late during lowsystemic blood flow and could be explained largely bysystemic hyperlactatemia alone. (2) The proportionalblood flow of the superior mesenteric artery was wellmaintained during progressive, severe cardiac tampon-ade and signs of systemic hypoperfusion (arterial hyper-lactatemia with increased L/P ratio) preceded those ofgut hypoperfusion. (3) Signs of gut hypoperfusion (in-creased veno-arterial and mucosal arterial PCO2 gradi-ents as well as increased regional CO2 content differ-ence) preceded the signs of inadequate mucosal oxygensupply and the signs of gross jejunal wall dysoxia (lumi-nal lactate, mesenteric ketone body ratio, respectively).Although our results concerning prolonged severe tam-ponade are inconclusive, due to the small number of ani-mals at the end of the experiment, the data obtained dur-ing moderate tamponade and early severe tamponade in-dicate that jejunal mucosal dysoxia and anaerobic metab-olism occur late during low systemic blood flow inducedby cardiac tamponade. Also, we cannot exclude the pos-sibility that gut luminal microdialysate lactate is simplynot sensitive or specific enough as a marker of mucosaldysoxia.
Arterial blood lactate increased early during tampon-ade and was not explained by increased gut lactate re-lease. Systemic hyperlactatemia is apparently due to lac-tate release from other tissues than the gut, but is alsopartly caused by decreasing hepatic clearance. This wasreported in our previous paper, including 24 animals (the12 reported in the present study plus another 12) wherewe could demonstrate an increased lactate release fromthe lungs in conjunction with a lack of increase in hepat-ic lactate uptake [18]. High arterial lactate concentrationwill also be reflected in the gut luminal lactate, and thelatter has to be interpreted in this context. The determi-nation of an upper normal limit of gut luminal lactate isbased on hyperlactatemia during uncompromised gutperfusion [21]. Speculatively, there are at least three fac-tors, which contribute to gut luminal lactate concentra-tion: (1) mucosal epithelial release of lactate, (2) diffu-sion of lactate from subepithelial mucosa and capillariesand (3) epithelial uptake of lactate.
959
Fig. 3 Individual arterial-gut luminal lactate samples (circles)plotted against upper normal limit of gut luminal lactate (dashedline) during progressive cardiac tamponade
It is possible that the impact of diffusion is dependenton the state of capillary perfusion. During high arterialconcentration and normal perfusion the diffusion may behigh, giving a higher upper normal limit. In the presentexperiment, therefore, we may have underestimated theoccurrence of abnormal luminal lactate release and gutmucosal dysoxia. On the other hand, the gut luminal mi-crodialysate lactate concentration exceeded the uppernormal limit in only one animal. The limit was reachedlate during the second step of low systemic blood flowand could be explained by arterial hyperlactatemia alone.The increased mesenteric L/P ratio caused by increasedpyruvate uptake, rather than increased lactate release, isdifficult to interpret. We suggest that an increased re-gional L/P ratio is not related to the degree of gut walldysoxia in the present setting. The increase in mesentericvenous ketone body ratio suggests that the cellular redoxstatus in the gut as a whole was impaired during low sys-temic blood flow, even when luminal lactate suggests theabsence of mucosal epithelial dysoxia. However, the ke-tone body ratio increased only moderately if comparisonis made to hepatic dysoxia, which occurs at hepatic ve-nous ketone body ratio of 2.5 [26].
Preferential reduction of the visceral blood flow in lowoxygen supply states is proposed to be one of the keymechanisms of inadequate gut perfusion [2, 27, 28, 29,30]. This was not observed in the present study. Instead,the fraction of superior mesenteric artery flow was un-changed, which is in accordance with several recent stud-ies [6, 7, 8]. We assume that prevention of hypovolemiaby controlled fluid therapy is one likely factor contribut-ing to the well preserved fractional mesenteric blood flowin the present study. The surgical technique we used,leaving the spleen intact, may also have helped to main-tain superior mesenteric artery flow by preserving thephysiologic defense of intravascular volume [31, 32]. Inthis experimental model, superior mesenteric arterial andportal venous blood flows decreased in parallel with lowsystemic blood flow whereas celiac trunk and hepatic ar-terial blood flow increased during the tamponade.
Increased gut mucosal arterial PCO2 gradient and arteriovenous PCO2 and CO2 content differences indi-cate mucosal hypoperfusion, but we suggest that highCO2 gradients can be explained by CO2 stagnation ratherthan anaerobic metabolism until the second step of thetamponade, when luminal lactate increased close to theupper normal limit. The oxygen supply to the gut de-creased by approximately 75%, but the oxygen extrac-tion ratio increased from 41% to 87% and the regionalmetabolic rate remained constant, as indicated by con-stant jejunal CO2 production. Increasing oxygen extrac-tion may explain the apparent aerobic metabolism untilthe late phase of the experiment. A late occurring in-crease of ketone body ratio and no lactate productionover the jejunum support the idea that aerobic metabo-lism was maintained.
The apparent lack of jejunal mucosal epithelial dys-oxia, as judged by relatively low and late lactate releaseto the lumen, may be related to the neurohumoral com-pensatory mechanisms. This assumption is supported by earlier studies, where altered distribution of capillaryblood flow between different layers of intestinal wall [5,14, 15, 16, 17] and/or redirecting blood flow/oxygen de-livery in proportion to metabolic demand within the mu-cosa [33] occurs. Mucosal perfusion, as compared tomuscularis, is preserved after increased reflex vasocon-striction by hypovolemia during supply-dependent oxy-gen delivery in a model of isolated small bowel loopwith high and low regional flow [17]. High sympathetictone increases the oxygen extraction ability in the smallintestine during hemorrhage, presumably by divertingblood flow towards the areas of higher oxygen demand[33]. Cardiac tamponade per se increases sympathetictone [34]. In addition, jejunal mucosal blood flow, whenestimated by laser Doppler flowmetry, is preserved whilesystemic and regional blood flow decreases in an experi-mental hemorrhagic shock [35]. Furthermore, arterial hy-potension during regional flow reduction redistributesblood flow towards the mucosa [14]. This may, at leastin part, explain why the jejunal mucosa does not appearto be dysoxic early during cardiac tamponade-inducedlow systemic blood flow as estimated by luminal lactaterelease.
In contrast, in a previous study of ours, selective re-duction of the superior mesenteric arterial blood flow in-duces gut luminal lactate release as early as at 10 ml/kgper min of superior mesenteric artery blood flow as a signof dysoxia [22]. In that experiment blood flow was re-duced stepwise during 60 min and kept low at 3–4 ml/kgper min for 60 min. Luminal microdialysate lactate in-creased up to 3.4 mmol/l [22]. This suggests that thesmall intestine is better adapted to low blood flow duringlow systemic blood flow than to isolated selectively re-duced regional blood flow. In the present cardiac tampon-ade model portal venous blood flow decreased to6±3 ml/kg per min as we reported earlier [18]. The resultsare thereby in accordance with the report by Schlichtigand Bowles [36]. These authors showed an abrupt in-crease in mucosal PCO2, dissociation of Dill-predictedvenous %HbO2 and, thereby, intestinal dysoxia at portalvenous blood flow from 200 to 180 ml/min or lower,which is the same as our results. In addition, they estimat-ed that the maximal aerobic mucosal-to-arterial PCO2gradient may be as high as 3.3–4.7 kPa (25–35 Torr). Inthe present experiment the mucosal-to-arterial PCO2 gra-dient exceeded the higher estimated threshold at 30 minduring the second stage of tamponade. In contrast, in anexperimental model by Vallet et al. dysoxia/anaerobicmetabolism in an isolated hind limb occurred at an arte-riovenous PCO2 gradient of 2.1 kPa (16 Torr) [37]. Theseemingly controversial results of our experiment are dueto either the different tissues/species investigated, differ-
960
ent systemic neurohumoral/metabolic response duringsystemic low flow as compared to isolated low flow/hyp-oxic hypoxia in the report by Vallet et al. or methodologi-cal limitations of the present experiment.
We tested hepatic arterial buffer response repeatedlyin the present experiment. The results are reported else-where [18]. In terms of limitations of the study, the effectof serial short-lasting occlusions of the portal vein mayhave affected visceral tissue metabolism. However, sincethe occlusion was carried out at the level of the portalvein, it certainly did not cause gut ischemia, but bloodstasis. We cannot fully exclude the possibility that thiscaused damage of the cellular integrity, but we believethat this is not probable since (1) the maneuver wasshort-lasting and (2) we did not measure an increase inluminal lactate or in jejunal mucosal PCO2 gradients inthe control animals.
Even though we aimed at a standardized, randomized,controlled experimental setting, the major limitation inour study was the small number of animals and large inter-individual variation and, therefore, the results have
to be interpreted accordingly. Furthermore, the last mea-surements in the tamponade group are difficult to inter-pret because three animals died soon after the data at30 min during the second step of tamponade were col-lected. The remaining three animals did behave similar-ly, thus giving some evidence for a late occurring mucos-al epithelial dysoxia. Also, the statistical analysis wasperformed until 30 min of the second step of tamponade,when all experimental animals were still alive.
The late and moderate increase in gut luminal lactatemay simply be due to the lack of sensitivity and/or speci-ficity of luminal microdialysis to detect mucosal dys-oxia. The interpretation of the results has to be limited tocovering the metabolism of the small bowel during lowsystemic blood flow. Changes in stomach, colon or othervisceral organs may occur earlier. Also, species differ-ences may exist and therefore extrapolation of the resultsto humans has to be made cautiously.
In conclusion, with the limitations discussed above,jejunal mucosal dysoxia occurs late during low systemicblood flow induced by experimental cardiac tamponade.
961
References
1. Swank GM, Deitch EA (1996) Role ofthe gut in multiple organ failure: bacte-rial translocation and permeabilitychanges. World J Surg 20:411–417
2. Bernath GA, Cogswell TL, Hoff-man RG, Klopfenstein HS (1987) In-fluences on the distribution of bloodflow during cardiac tamponade in theconscious dog. Circ Res 60:72–81
3. Reilly PM, MacGowan S, Miyachi M,Schiller HJ, Vickers S, Bulkley GB(1992) Mesenteric vasoconstriction incardiogenic shock in pigs. Gastroenter-ology 102:1968–1979
4. Ba ZF, Wang P, Koo DJ, Cioffi WG,Bland KI, Chaudry IH (2000) Altera-tions in tissue oxygen consumption andextraction after trauma and hemorrhagicshock. Crit Care Med 28:2837–2842
5. Toung T, Reilly PM, Fuh KC, Ferris R,Bulkley GB (2000) Mesenteric vaso-constriction in response to hemorrhagicshock. Shock 13:267–273
6. Schlichtig R, Kramer DJ, Pinsky MR(1991) Flow redistribution during pro-gressive hemorrhage is a determinantof critical O2 delivery. J Appl Physiol70:169–178
7. Åneman A, Snygg J, Pettersson A, Johansson B, Holm M, Fandriks L(1998) Detecting gastrointestinal hypo-perfusion during cardiac tamponade inpigs: a role for nitric oxide tonometry?Crit Care Med 26:1251–1257
8. Zhang H, Smail N, Cabral A, CherkaouiS, Peny MO, Vincent JL (1999) He-pato-splanchnic blood flow and oxygenextraction capabilities during experi-mental tamponade: effects of endo-toxin. J Surg Res 81:129–138
9. Kampp M, Lundgren O, Nilsson NJ(1967) Extravascular short-circuitingof oxygen indicating countercurrentexchange in the intestinal villi of thecat. Experientia 23:197–198
10. Kampp M, Lundgren O, Nilsson NJ(1968) Extravascular shunting of oxy-gen in the small intestine of the cat.Acta Physiol Scand 72:396–403
11. Jodal M, Lundgren O (1970) Plasmaskimming in the intestinal tract. ActaPhysiol Scand 80:50–60
12. Bohlen HG (1980) Intestinal tissue PO2 and microvascular responses dur-ing glucose exposure. Am J Physiol238:H164–171
13. Pargger H, Staender S, Studer W,Schellscheidt O, Mihatsch MJ, Scheidegger D, Skarvan K (1997) Occlusive mesenteric ischemia and itseffects on jejunal intramucosal pH, mesenteric oxygen consumption andoxygen tensions from surfaces of thejejunum in anesthetized pigs. IntensiveCare Med 23:91–99
14. Cassuto J, Cedgard S, Haglund U, Redfors S, Lundgren O (1979) Intra-mural blood flows and flow distribu-tion in the feline small intestine duringarterial hypotension. Acta PhysiolScand 106:335–342
15. Cogswell TL, Bernath GA, Raff H,Hoffmann RG, Klopfenstein HS (1986)Total peripheral resistance during car-diac tamponade: adrenergic and angio-tensin roles. Am J Physiol 251:R916–922
16. Revelly JP, Ayuse T, Brienza N, Fessler HE, Robotham JL (1996) En-dotoxin shock alters distribution ofblood flow within the intestinal wall.Crit Care Med 24:1345–1351
17. Connolly HV, Maginniss LA,Schumacker PT (1997) Transit timeheterogeneity in canine small intestine:significance for oxygen transport.J Clin Invest 99: 228–238
18. Jakob SM, Tenhunen JJ, Laitinen S,Heino A, Alhava E, Takala J (2001)Effects of systemic arterial hypoperfu-sion on splanchnic hemodynamics andhepatic arterial buffer response in pigs.Am J Physiol 280:G819–827
19. Lundell A, Bergqvist D, Mattsson E et al. (1993) Volume blood flow mea-surements with a transit time flowme-ter: an in vivo and in vitro variabilityand validation study. Clin Physiol13:547–557
20. Hartman JC, Olszanski DA, HullingerTG et al. (1994) In vivo validation of atransit-time ultrasonic volume flowmeter. J Pharmacol Toxicol Methods31:153–160
21. Tenhunen JJ, Kosunen H, Heino A etal. (1999) Intestinal luminal microdial-ysis – a new approach to assess mucos-al dysoxia. Anesthesiology 91:1807–1815
22. Tenhunen JJ, Jakob SM, Takala JA(2001) Gut luminal lactate release dur-ing gradual intestinal ischemia. Inten-sive Care Med 27:1916–1922
23. Solligard E, Juel IS, Stromholm T,Tvedt K, Johnsen H, Jynge P,Saether OD, Gronbech JE, Aadahl P(2001) Intraluminal microdialysis oflactate reflects permeability changes inischaemic intestinal injury (abstract).Intensive Care Med 27:S260
24. Heinonen PO, Jousela IT, BlomqvistKA, Olkkola KT, Takkunen OS (1997)Validation of air tonometric measure-ment of gastric regional concentrationsof CO2 in critically ill septic patients.Intensive Care Med 23:524–529
25. Giovannini I, Chiarla C, Boldrini G,Castagneto M (1993) Calculation ofvenoarterial CO2 concentration differ-ence. J Appl Physiol 74:959–964
26. Dishart MK, Schlichtig R, TonnessenTI, Rozenfeld RA, Simplaceanu E,Williams D, Gayowski TJ (1998) Mito-chondrial redox state as a potential de-tector of liver dysoxia in vivo. J ApplPhysiol 84:791–797
27. Vatner SF (1974) Effects of hemor-rhage on regional blood flow distribu-tion in dogs and primates. J Clin Invest54:225–235
28. Adachi H, Strauss W, Ochi H, WagnerHN Jr (1976) The effect of hypoxia onthe regional distribution of cardiac out-put in the dog. Circ Res 39:314–319
29. Kaihara S, Rutherford RB,Schwentker EP, Wagner HN Jr (1969)Distribution of cardiac output in exper-imental hemorrhagic shock in dogs.J Appl Physiol 27:218–222
30. Bulkley GB, Kvietys PR, Perry MA,Granger DN (1983) Effects of cardiactamponade on colonic hemodynamicsand oxygen uptake. Am J Physiol244:G604–612
31. Hoit BD, Gabel M, Fowler NO (1991)Influence of splenectomy on hemody-namics during cardiac tamponade. Am J Physiol 261:R907–911
32. Horton JW, Longhurst JC, Coln D,Mitchell JH (1984) Cardiovascular ef-fects of haemorrhagic shock in spleenintact and in splenectomized dogs. Clin Physiol 4:533–548
33. Samsel RW, Schumacker PT (1994)Systemic hemorrhage augments localO2 extraction in canine intestine.J Appl Physiol 77:2291–2298
34. Shibamoto T, Hayashi T Jr, Saeki Y,Matsuda Y, Kawamoto M, Koyama S(1993) Differential control of sympa-thetic outflow to kidney, heart, adrenalgland and liver during systemic hypo-tension induced by cardiac tamponadein anesthetized dogs. Circ Shock39:114–120
35. Krejci V, Hiltebrand L, Banic A, Erni D, Wheatley AM, Sigurdsson GH(2000) Continuous measurements ofmicrocirculatory blood flow in gastro-intestinal organs during acute haemor-rhage. Br J Anaesth 84:468–475
36. Schlichtig R, Bowles SA (1994) Dis-tinguishing between aerobic and an-aerobic appearance of dissolved CO2in intestine during low flow. J ApplPhysiol 76:2443–2451
37. Vallet B, Teboul JL, Cain S, Curtis S(2000) Venoarterial CO(2) differenceduring regional ischemic or hypoxichypoxia. J Appl Physiol 89:1317–1321
962