jeffries & porterfield meeting - federal reserve system · cmbs market through the financia...
TRANSCRIPT

Meeting Between Federal Reserve Board Staff and Representatives of Jeffries & Company, Inc. (Jeffries)
and Porterfield, Lowenthal & Fettig LLC (Porterfield) September 27, 2010
Participants: Matthew Eichner, Lawrence Rufrano, Karen Pence, William Treacy, April Snyder, Sebastian Astrada, and Flora Ahn (Federal Reserve Board)
Lisa Pendergast and Michael Sharp (Jeffries); and Andrew Lowenthal and Brendon Weiss (Porterfield)
Summary: Staff of the Federal Reserve Board met with representatives of Jeffries and Porterfield about commercial mortgage-backed securities (CMBS) and the Federal Reserve Board's responsibilities under section 941 of the Dodd-Frank Wall Street Reform and Consumer Protection Act. Jeffries' representatives provided Federal Reserve Board Staff with a presentation on the performance of the CMBS market through the financial crisis and their overall views on risk retention. A copy of the handout provided by Jeffries at the meeting is attached below. The handout formed the basis for discussions at the meeting and summarizes the issues discussed.

Commercial Real Estate and Commercial Mortgage-Backed Securities
2010 CMBS: A Volatile Road to Recovery
Lisa Pendergast Managing Director, CMBS Strategy & Risk Jefferies & Company, Inc. 203-363-8232 [email protected]

Table of Contents
I: Key Themes in the Commercial Real Estate Debt and Property Markets Page 3
II: Have U.S. Government Programs Helped Commercial Real Estate/CMBS? Page 6
III: Drivers of CMBS Loan Performance Page 18
IV: Detailed Analysis of Current Loan Performance and Trends Page 25
V: The Refinance Conundrum: CMBS Fixed- and Floating-Rate Loan Maturities Page 38
VI: CRE Loan Historical and Projected Default and Loss Seasoning Curves Page 44
VII: Rating Agency CMBS Actions Page 52
VIII: The Commercial Real Estate Space Markets Page 68
IX: Relative Value in Cash and Synthetic CMBS Page 69

Key Themes in the Commercial Real Estate Debt and
Property Markets

Key Themes
CMBS Lending Markets Beginning to Defrost
Ten new-issue CMBS since June 2008
Healthier regional banks and life companies cautiously lend:
Lending bifurcated by loan size and acquisitions vs. refinancings
Banks still holding underwater assets
The Role of the U.S. Government and Changing Regulation
TALF for New-Issue and Legacy CMBS set to expire
RTC-2: Loan Sales + Securitization
FAS 166/167
Regulatory Reform: Skin in the game for CMBS issuers, rating agency reform + Scarlett Letters
CRE Property Values Decline 25% to 60%+ Peak to Trough
Capitalization rates rise on deteriorating fundamentals and sharply higher financing costs, but will bifurcate by
distressed and non-distressed assets
Net cash flow falls as recession takes holds on

Key Themes
CMBS Delinquency Rate Poised to Rise to 10%; Surpass Highs of Previous Cycle
Aggressive pro-forma underwriting assumptions fail to materialize
Borrowers of 'seriously' underwater assets with negative cash flow capitulate (imminent defaults)
Projected 14% Average Cumulative Loss in CMBS Pools Exceeds <10% Average of Previous Cycle
Cumulative losses highest on 2006 to 2008 vintages at 8% to 20%
Rating Agency Considerations
Rating agencies render themselves obsolete as arbiters of credit risk, but will play a role going forward
Does the rating agency model change and do securitized bonds get the "Scarlet" letter
Silver lining is 'squeaky clean' new-issue CMBS on sharply lower property values
Not just CMBS downgrade concerns.. .master servicers and special servicers face serious operational risks
Going "TALF-less": Secondary CMBS Spreads Sharply Tighter from November 2008 Widest Levels
CRE fundamentals provide redemption for super-senior AAA bonds, but bode poorly for non-AAAs
CMBS extension risk/loan modifications and rising cumulative losses weigh heavy on investor psyches
2010: The year of the credit bond — not for amateurs
CMBS IOs that benefit from extension risk

Have the U.S. Government Programs Helped
Commercial Real Estate / CMBS?

Is There an Afterlife for Securitization, the U.S. Treasury Says 'Yes'
" . 4 0 % of consumer lending has historically been available because people buy loans, put them together and sell them." Secretary Timothy Geithner, U.S. Department of the Treasury
"Because this vital source of lending
has frozen up, no financial recovery plan
will be successful unless it helps restart securitization
markets for sound loans made to consumers
and businesses - large and small.'
This lending program will be built on the Federal Reserve's Term Asset Backed Securities Loan (TALF) Faci l i ty. with capital from the Treasury and financing from the Federal Reserve.
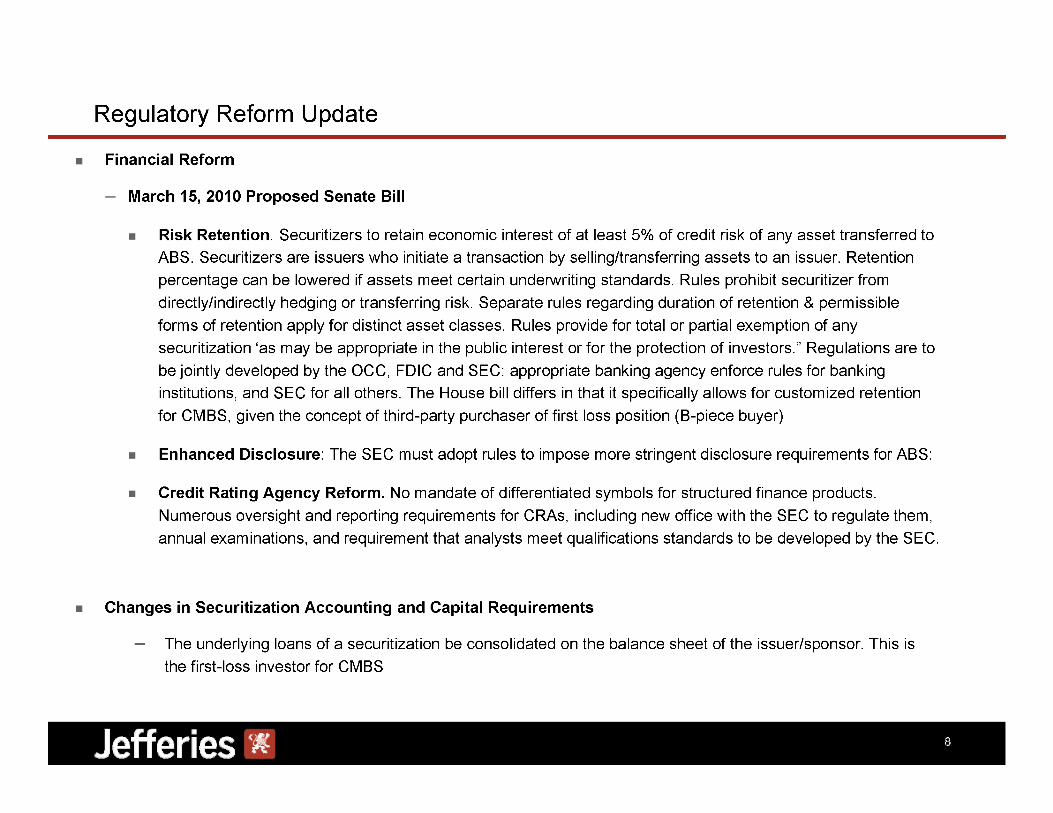
Regulatory Reform Update
Financial Reform
March 15, 2010 Proposed Senate Bill
Risk Retention. Securitizers to retain economic interest of at least 5% of credit risk of any asset transferred to ABS. Securitizers are issuers who initiate a transaction by selling/transferring assets to an issuer. Retention percentage can be lowered if assets meet certain underwriting standards. Rules prohibit securitizer from directly/indirectly hedging or transferring risk. Separate rules regarding duration of retention & permissible forms of retention apply for distinct asset classes. Rules provide for total or partial exemption of any securitization 'as may be appropriate in the public interest or for the protection of investors." Regulations are to be jointly developed by the OCC, FDIC and SEC: appropriate banking agency enforce rules for banking institutions, and SEC for all others. The House bill differs in that it specifically allows for customized retention for CMBS, given the concept of third-party purchaser of first loss position (B-piece buyer)
Enhanced Disclosure: The SEC must adopt rules to impose more stringent disclosure requirements for ABS:
Credit Rating Agency Reform. No mandate of differentiated symbols for structured finance products. Numerous oversight and reporting requirements for CRAs, including new office with the SEC to regulate them, annual examinations, and requirement that analysts meet qualifications standards to be developed by the SEC.
Changes in Securitization Accounting and Capital Requirements
The underlying loans of a securitization be consolidated on the balance sheet of the issuer/sponsor. This is the first-loss investor for CMBS

O u t s t a n d i n g D e b t M a r k e t S i z e C o m p a r i s o n Figures are in the $ Trillions Source: CREFC, Federal Reserve, Flow of Funds, Intex Solution, Inc as of 09/10 Current CMBS Outstandings $0.7 All Commercial + Multi-family Mortgages $3.4 Corporate Bonds $4.0 US Government Securities $7.5 Single Family Securities $7.2 Single Family Mortgages $10.9

U.S. Government Plays Integral Role in Thawing Frozen Capital Sources
Federal Reserve and U.S. Treasury introduced Term Asset-Backed Securities Loan Facility (TALF) in 3/09 to:
Stabilize the CMBS marketplace and drive distressed prices higher over time
Drive down lending costs and encourage new lending as CMBS spreads tighten
Program Objectives:
Restore liquidity to the CMBS market
Stem CRE property value declines
Lower commercial-mortgage defaults
Legacy CRE Loan &CMBS Program
New-Issue CMBS Program FDIC/RTC2

L e g a c y C M B S T A L F S u c c e s s f u l B u t Q u i r k y header row col1:CMBS TALF Subscription Volume:Subscription Col2:Legacy CMBS TALF Requested col3:Legacy CMBS TALF Settledcol4:New -Issue CMBS TALF Settled end header row Source New York Federal Reserve CMBS TALF Subscription Volume:Subscription:Jun-09 Legacy CMBS TALF Requested:$0Legacy CMBS TALF Settled:$0 New -Issue CMBS TALF Settled:$0 CMBS TALF Subscription Volume:Subscription:Jul-09 Legacy CMBS TALF Requested:$668,940,185 Legacy CMBS TALF Settled:$668,940,185 New -Issue CMBS TALF Settled:$0 CMBS TALF Subscription Volume:Subscription:Aug-09 Legacy CMBS TALF Requested:$2,283,323,490 Legacy CMBS TALF Settled:$2,148,314,045 New -Issue CMBS TALF Settled:$0 CMBS TALF Subscription Volume:Subscription:Sep-09 Legacy CMBS TALF Requested:$1,401,924,696 Legacy CMBS TALF Settled:$1,351,097,649 New -Issue CMBS TALF Settled:$0 CMBS TALF Subscription Volume:Subscription:Oct-09 Legacy CMBS TALF Requested:$2,124,921,093 Legacy CMBS TALF Settled:$1,930,574,358 New -Issue CMBS TALF Settled:$0 CMBS TALF Subscription Volume:Subscription:Nov-09 Legacy CMBS TALF Requested:$1,417,579,146 Legacy CMBS TALF Settled:$1,329,532,153 New -Issue CMBS TALF Settled:$72,248,483 CMBS TALF Subscription Volume:Subscription:Dec-09 Legacy CMBS TALF Requested:$1,324,853,713 Legacy CMBS TALF Settled:$1,282,444,544 New -Issue CMBS TALF Settled:$0 CMBS TALF Subscription Volume:Subscription:Jan-10 Legacy CMBS TALF Requested:$1,453,433,253 Legacy CMBS TALF Settled:$1,325,983,320 New -Issue CMBS TALF Settled:$0 CMBS TALF Subscription Volume:Subscription:Feb-10 Legacy CMBS TALF Requested:$1,255,719,991 Legacy CMBS TALF Settled:$1,133,023,281 New -Issue CMBS TALF Settled:$0 CMBS TALF Subscription Volume:Subscription:Mar-10 Legacy CMBS TALF Requested:$1,259,670,126 Legacy CMBS TALF Settled:$857,002,698 New -Issue CMBS TALF Settled:$0 CMBS TALF Subscription Volume:Subscription:Total Legacy CMBS TALF Requested:$13,190,365,693 Legacy CMBS TALF Settled:$12,026,912,233 New -Issue CMBS TALF Settled:$72,248,483 CMBS TALF Subscription Volume:Subscription: Legacy CMBS TALF Requested: Legacy CMBS TALF Settled: New -Issue CMBS TALF Settled: CMBS TALF Subscription Volume:Subscription: Legacy CMBS TALF Requested: Legacy CMBS TALF Settled: New -Issue CMBS TALF Settled:

Legacy CMBS TALF Pushes CMBS Prices Higher
C M B S S S A 4 A A A H i s t o r i c a l S p r e a d s (Information is in Spreads to Swaps (BPs). Source Jefferies & Co as of 9/24/10. The trends indicate from 5/14/2008 and ending in 9/22/10 that in the time period of 9/14/08 there was a huge spike from 200 to 1400 and then a downward trend with another spike from 1100 around 1/15/09 with a consistent downward trend that leveled off with a downward turn in 9/22/10 with figures near 350.

Public-Private Investment Funds (PPIFs) for Legacy CMBS Securities: Underwhelming
PPIP finally underway in October 2009
Allows Treasury to partner with leading investment management firms to:
Increase the flow of private capital to the CMBS marketplace
Provide upside potential for U.S. taxpayers as Treasury equity capital is invested side-by-side with private funds
Approved Fund Managers raise private capital and receive matching equity capital from Treasury
Treasury will invest up to $30 billion of equity and debt in PPIFs
Partnerships dissolve 8 years from closing date with option by Treasury to extend
Fun Managers must invest a minimum of $20 million of firm capital into the PPIF
Full-turn election: Treasury debt financing up to 100% of the total equity of the PPIF
Warrants equal to 2.5%, no additional debt other than UST leverage is permitted
Half-turn election: Treasury provides up to 50% of the capital commitment
Warrants equal 1.5% and additional third-party debt permitted via TALF
Eligible CMBS
Issued prior to 2009 and secured directly by mortgage loans, leases, or other assets; Originally rated AAA

Public-Private Investment Funds for Legacy CMBS Securities
Approved fund managers and initial closings
AllianceBernstein, LP and its sub-advisors Greenfield Partners, LLC and Rialto Capital Management, LLC — (CLOSED)
Angelo, Gordon & Co., L P. and GE Capital Real Estate (CLOSED)
BlackRock, Inc. (CLOSED)
Invesco Ltd. (CLOSED)
Marathon Asset Management, L P. (CLOSED)
Oaktree Capital Management, L P. (CLOSED)
RLJ Western Asset Management, LP. (CLOSED)
The TCW Group, Inc. (CLOSED, FROZEN)
Wellington Management Company, LLP (CLOSED)
PPIFs have completed initial and subsequent closings on approximately $6.2B of private sector equity capital and matched 100% by Treasury for $12.4 billion of total equity capital. (as of December 01, 2009)
Treasury also provided $12.4 billion of debt capital, representing $24.8B of total purchasing power.
PPIFs have drawn-down approximately $4.3B of total capital (as of 12/31/2009)
Following an initial closing, each PPIF may execute for two more closings over the following six months to receive matching Treasury equity and debt financing, with a total Treasury equity and debt investment in all PPIFs equal to $30B ($40B including private investor capital).

P u b l i c - P r i v a t e I n v e s t m e n t F u n d s f o r L e g a c y C M B S S e c u r i t i e s header row col1:PPIF Progress Report: Fund Col2:Closing Date col3:Closed Equity and Debt Capital:Private Equity col4:Closed Equity and Debt Capital:Treasury Equity col5:Closed Equity and Debt Capital:Treasury Debt col6:Closed Equity and Debt Capital:Purchasing Power col7:Performance: Inception Date: col8: Performance: Net Perf: end header row PPIF Progress Report:Fund:AG GECC PPIF Master Fund,L.P. Closing Date:10/30/2009 Closed Equity and Debt Capital:Private Equity:653Closed Equity and Debt Capital:Treasury Equity:653 Closed Equity and Debt Capital:Treasury Debt:1307Closed Equity and Debt Capital:Purchasing Power:2614 Performance: Inception Date:11/12/2009 Performance: Net Perf:3.9% PPIF Progress Report:Fund:AllianceBernstein Legacy Securities Master Fund, L.P. Closing Date:10/2/2009Closed Equity and Debt Capital:Private Equity:1,060 Closed Equity and Debt Capital:Treasury Equity:1,060 Closed Equity and Debt Capital:Treasury Debt:2,121 Closed Equity and Debt Capital:Purchasing Power:4,241 Performance: Inception Date:10/23/2009 Performance: Net Perf:-0.6% PPIF Progress Report:Fund:Blackrock PPIF,L.P. Closing Date:10/2/2009 Closed Equity and Debt Capital:Private Equity:582Closed Equity and Debt Capital:Treasury Equity:582 Closed Equity and Debt Capital:Treasury Debt:1,164 Closed Equity and Debt Capital:Purchasing Power:2,329 Performance: Inception Date:10/16/2009 Performance: Net Perf:1.0% PPIF Progress Report: Fund:Invesco Legacy Securities Master Fund L.P. Closing Date:9/30/2009Closed Equity and Debt Capital:Private Equity:506 Closed Equity and Debt Capital:Treasury Equity:506 Closed Equity and Debt Capital:Treasury Debt:1,012 Closed Equity and Debt Capital:Purchasing Power:2,024 Performance: Inception Date:10/13/2009 Performance: Net Perf:2.8% PPIF Progress Report:Fund:Marathon Legacy Securities Public-Private Investment Partnership,L.P. Closing Date:11/25/2009 Closed Equity and Debt Capital:Private Equity:400Closed Equity and Debt Capital:Treasury Equity:400 Closed Equity and Debt Capital:Treasury Debt:800 Closed Equity and Debt Capital: Purchasing Power:1,600 Performance: Inception Date:12/15/2009 Performance: Net Perf:-1.4% PPIF Progress Report:Fund:Oaktree PPIP Fund,L.P. Closing Date:12/18/2009 Closed Equity and Debt Capital:Private Equity:456 Closed Equity and Debt Capital:Treasury Equity:456 Closed Equity and Debt Capital:Treasury Debt:912 Closed Equity and Debt Capital:Purchasing Power:1,823 Performance: Inception Date:N/A Performance: Net Perf:N/A PPIF Progress Report:Fund:RLJ Western Asset Public/Private Master Fund, L.P. Closing Date:11/5/2009 Closed Equity and Debt Capital:Private Equity:505 Closed Equity and Debt Capital:Treasury Equity:505 Closed Equity and Debt Capital:Treasury Debt:1,010 Closed Equity and Debt Capital:Purchasing Power:2,021 Performance: Inception Date:11/23/2009 Performance: Net Perf:3.3% PPIF Progress Report:Fund:UST/TCW Senior Mortgage Securities Fund,L.P.* (See note below) Closing Date:9/30/2009 Closed Equity and Debt Capital:Private Equity:1,014 Closed Equity and Debt Capital:Treasury Equity:1,014 Closed Equity and Debt Capital:Treasury Debt:2,028 Closed Equity and Debt Capital:Purchasing Power:4,056 Performance: Inception Date:10/19/2009 Performance: Net Perf:70.0% PPIF Progress Report:Fund:Wellington Management Legacy Securities PPIF Master Fund, L.P. Closing Date:10/1/2009 Closed Equity and Debt Capital:Private Equity:1,017Closed Equity and Debt Capital:Treasury Equity:1,017 Closed Equity and Debt Capital: Treasury Debt:2,033Closed Equity and Debt Capital:Purchasing Power:4,066 Performance: Inception Date:10/19/2009 Performance: Net Perf:1.2% PPIF Progress Report: Fund Closing Date: Closed Equity and Debt Capital:Private Equity: Closed Equity and Debt Capital:Treasury Equity: Closed Equity and Debt Capital:Treasury Debt: Closed Equity and Debt Capital:Purchasing Power: Performance: Inception Date: Performance: Net Perf: PPIF Progress Report:Total Closed Closed Equity and Debt Capital:Private Equity:6194 Closed Equity and Debt Capital:Treasury Equity:6194 Closed Equity and Debt Capital:Treasury Debt:12387 Closed Equity and Debt Capital:Purchasing Power:24774 PPIF Progress Report:Total Allowable Closed Equity and Debt Capital: Private Equity:10,000 Closed Equity and Debt Capital:Treasury Equity:10,000 Closed Equity and Debt Capital:Treasury Debt:20,000Closed Equity and Debt Capital:Purchasing Power:40,000 Source: US Treasury Note: On January 4, 2010, Treasury and TCW entered into an agreement to terminate this fund when key investment professionals left the firm. Pursuant to the agreement, all limited partners were released from capital commitments and the PPIF's holdings were liquidated. Treasury did not incur any loss as a result of the termination and currently expects, based on preliminary reports it received from the fund manager, that the TCW PPIF Limited partners (private investors and Treasury)will realize a profit. TCW limited partners will have the ability to re-allocate capital to other PPIFs. ** Performance is net of management fees and expenses attributable to Treasury. NA=Not Applicable as the fund has not drawn capital as of 12/31/2009.

Super-Senior, Mezzanine, Junior AAA Spreads Tighter, Not So Much from PPIP
CMBS AAA Historical Spreads Spreads to Swaps (BPS) PPIP Inception 10/09 Line chart titled CMBS AAA Historical Spreads There are three series which all follow the same general downward trend over time. The CMBS AAA AJ starts on 1/2/09 on 2,800 and ends at 1200 on 10/2/10. The CMBS AAA AM on 1/2/09 starts at 1700 and ends at 600 on 10/2/10, and the final CMBS AAA A4 starts on 1/2/09 at 800 and ends at 200 on 10/2/10. Source: Jefferies and Co.

New-Issue CMBS TALF: Also Underwhelming
Program Parameters
May 1, 2009. Fed expands eligible collateral to include new-issue CMBS under TALF
Issuer. Must not be an agency or instrumentality of the U.S. or a GSE
Eligible Collateral. Cash fixed-rate P+I CMBS issued on or after 1/1/09. Highest long-term IG rating from 2 or more agencies; not junior to other securities w/ claims on same pool of loans
Asset Types
Fully-funded, 1st-priority, fixed-rate commercial mortgage loans; fee or leasehold interests in one or more income-generating commercial properties in U.S./territories
CMBS, other securities or interest-rate swap/cap instruments or other hedging instruments or IO loans not eligible
Origination Dates. All mortgage loans must be originated on or after July 1, 2008
Underwriting. Then-current in-place, stabilized/recurring NOI and then-current property appraisals
Available Loans. Three- and five-year TALF loans - same rates and haircuts apply as in legacy CMBS TALF
TALF Loan Principal Repayment. All CMBS principal cash flows applied to TALF loan in proportion to advance rate
Capping of interest on 5-year TALF loan
Excess interest on the CMBS bond over interest on TALF loan remitted to the TALF borrower, until:
Excess interest equals 25% of haircut amount within one full year; or excess interest equals 10% and 5% of the haircut in years four and five, respectively
Drivers of CMBS Loan Performance

C M B S L o a n P e r f o r m a n c e v e r s u s R e s i d e n t i a l Sub prime A R M d e l i n q u e n c i e s a t 5 4 . 6 % a s o f 2 Q 1 0 P r i m e A R M d e l i n q u e n c i e s s h a r p l y l o w e r a t 1 2 . 3 % a s o f 2 Q 1 0 F i x e d - r a t e C M B S d e l i n q u e n c i e s a t 8 . 2 9 % a s o f 2 Q 1 0 Residential versus Commercial Delinquencies (60+Delinq) Source: Jefferies and Co. Delinquency Rate (%) M-06:ARMs
Subprime:7 M-06:ARMs Prime:0 M-06:Fixed-Rate CMBS:0 J-06:ARMs Subprime:8 J-06:ARMs Prime:1 J-06:Fixed-Rate CMBS:0 S-06:ARMs Subprime:8 S-06:ARMs Prime:1 S-06:Fixed-Rate CMBS:0 D-06:ARMs Subprime:8 D-06:ARMs Prime:1 D-06: Fixed-Rate CMBS:0 M-07:ARMs Subprime:11 M-07:ARMs Prime:1 M-07:Fixed-Rate CMBS:0 J-07:ARMs Subprime:11 J-07:ARMs
Prime:2 J-07:Fixed-Rate CMBS:0 S-07:ARMs Subprime:10 S-07:ARMs Prime:3 S-07:Fixed-Rate CMBS:0 D-07:ARMs Subprime:12
D-07:ARMs Prime:3 D-07:Fixed-Rate CMBS:0 M-08:ARMs Subprime:18 M-08:ARMs Prime:4 M-08:Fixed-Rate CMBS:0 J-08:ARMs
Subprime:21 J-08:ARMs Prime:4 J-08:Fixed-Rate CMBS:0 S-08:ARMs Subprime:25 S-08:ARMs Prime:4 S-08:Fixed-Rate CMBS:0
D-08:ARMs Subprime:34 D-08:ARMs Prime:4 D-08:Fixed-Rate CMBS:0 M-09:ARMs Subprime:42 M-09:ARMs Prime:5 M-09:Fixed-Rate
CMBS:0 J-09:ARMs Subprime:45 J-09:ARMs Prime:5 J-09:Fixed-Rate CMBS:0 S-09:ARMs Subprime:45 S-09:ARMs Prime:5 S-09:Fixed-
Rate CMBS:0 D-09:ARMs Subprime:49 D-09:ARMs Prime:5 D-09:Fixed-Rate CMBS:0 M-10:ARMs Subprime:51 M-10:ARMs Prime:10 M-10:Fixed-Rate CMBS:5 J-10:ARMs Subprime:55 J-10:ARMs Prime:12 J-10:Fixed-Rate CMBS:12

C R E P r o p e r t y V a l u a t i o n s P l u m m e t b y 4 1 %
S i n g l e - F a m i l y R e s i d e n t i a l H o m e P r i c e s ( a s o f 0 7 / 1 0 ) L o w e r b y 2 7 . 9 % f r o m 7 / 0 6 p e a k C o m m e r c i a l P r o p e r t y P r i c e s ( a s o f 0 6 / 1 0 )
L o w e r b y 4 1 . 4 % f r o m 1 0 / 0 7 p e a k D e c l i n e s w i l l v a r y b y a s s e t t y p e / q u a l i t y / l o c a t i o n B y P r o p e r t y ( p e a k t h r u 2 Q 1 0 ) R e t a i l : - 3 9 . 2 5 %
O f f i c e : - 3 0 . 8 1 % I n d u s t r i a l : - 3 5 . 2 9 % M u l t i - f a m i l y : - 3 0 . 4 6 % Residential Vs. Commercial Real Estate Values
Source: Bloomberg
Line chart titled Residential Versus Commercial
Real Estate Values. Period is from July 2001 until July 2010 with the two series being
tracked is Moody's Commercial Property Price Index and Case Shiller Home Price Index.
In July 2001 Moody's Commercial Property commenced around 101 steadily climbing until
it hit a peak around July 2007 around 175 and then fell to 112.51 in July 2010. Case
Shiller started in July 2001 at 125 rose to 225 in July 2006 and fell to 148.91 in July
2010.

C a p i t a l i z a t i o n R a t e s : A D y s f u n c t i o n a l M e a s u r e i n C u r r e n t C r i s i s
E a r l y - ' 9 0 s c r i s i s p u s h e d c a p r a t e s u p 4 0 0 b p s t o 9 . 6 2 % E x c e s s s u p p l y : T a x - c o d e c h a n g e s s p u r d e v e l o p m e n t L a c k o f d e m a n d : R e c e s s i o n 1 9 9 5 - 2 0 0 8 c a p r a t e s p l u m m e t t o h i s t o r i c a l l o w s S e v e n c o n s e c u t i v e Y O Y d e c l i n e s ; f a l l i n g 3 8 % f r o m ' 0 0 t h r u ' 0 8 ,
b e f o r e r i s i n g i n ' 0 9 C a p r a t e s n o w d y s f u n c t i o n a l a s p r o p e r t y t r a n s a c t i o n v o l u m e p l u m m e t s D e b t y i e l d s . K e y b a r o m e t e r o f r i s k L e n d e r s r e q u i r e > 1 0 % d e b t y i e l d s ( r a t i o o f N O I / N C F a n d D e b t ) Average Capitalization Rate v/s Treasury Rate as
of 4Q09. Source: NCREIF, Jefferies & Co. Line Chart Titled Average Capitalization Rate and the period is from 1977 to 2009. The rate is the Average 10 year Treasury and AverageCap Rate. The Average 10Y Treasury starts in 1977 around 9%,
climbs to 14% around 1981 and drops to 3.24% in 2009. The Average Cap Rate in 1977 starts at 7%, climbs to 10% in 1997 and falls to 6.41% in 2009.
Average Capitalization Rate to Treasury Rates Spread
Line Chart and the period is from 1977 to 2009.
The measurement is Cap rates versus Treasury Rates.
In 1977 the chart begins at below 0 dips to minus
700 in 1981 slowly climbs back up to below 0 in 1985,
climbs to 200 in 1993 and finally tapers off at 317
in 2009.

A g g r e s s i v e U n d e r w r i t i n g / I n c r e a s e d L e v e r a g e = H i g h e r L o s s e s G r o w i n g n u m b e r o f p e r f o r m i n g l o a n s w i t h D S C R s l e s s t h a n 1 . 0 x s p e l l m o r e t r o u b l e a h e a d 1 0 % t o 2 0 % d e c r e a s e i n N O I ; R e c e n t v i n t a g e l o a n s p r e s s u r e d b y o v e r l y a g g r e s s i v e pro forma u n d e r w r i t i n g ,
e x p i r i n g I O p a y m e n t p e r i o d s , p e n d i n g m a t u r i t i e s header row col1:Conduit/Fusion Fixed-Rate CMBS Deal Composition and Credit Statistics Col2:2010 col3:2009* col4:2008*, col5:2007* col6:2006*, col7:2005* col8:2004, col9:2003 col10:2002, end header row Conduit/Fusion Fixed-Rate CMBS Deal Composition and Credit Statistics:Total Issuances ($B) 2010:4.71
2009*:1.36 2008*:10.74 2007*:188.55 2006*:161.76 2005*:136.442004:74.17 2003:52.88 2002:34.36 Conduit/Fusion Fixed-Rate CMBS Deal Composition and Credit Statistics:Avg.Deal Size ($B) 2010:0.67 2009*:0.45 2008*:1.34 2007*:3.60 2006*:2.61 2005*:2.18 2004:1.24 2003:1.17 2002:1.01 Conduit/Fusion Fixed-Rate CMBS Deal Composition and CreditStatistics:Avg. Loan Size ($M) 2010:12.232009*:11.28 2008*:14.18 2007*:17.94 2006*:14.52 2005*:13.93 2004:11.63 2003:9.95 2002:8.25 Conduit/Fusion Fixed-Rate CMBS Deal Composition and CreditStatistics:Largest Loan % 2010:N/A2009*:13.10 2008*:11.64 2007*:9.97 2006*:9.48 2005*:8.69 2004:10.35 2003:9.10 2002:8.77 Conduit/Fusion Fixed-Rate CMBS Deal Composition and CreditStatistics:Avg.AAA Credit Enhancement (%) 2010:24.00 2009*:21.52 2008*:13.55 2007*:12.00 2006*:12.02 2005*:12.67 2004:13.81 2003:16.78 2002:19.56 Conduit/Fusion Fixed-Rate CMBS Deal Composition and CreditStatistics:Avg. BBB- Credit Enhancement (%) 2010:N/A2009*:N/A 2008*:4.14 2007*:3.122006*:3.06 2005*:3.33 2004:3.61 2003:4.472002:8.10 Conduit/Fusion Fixed-Rate CMBS Deal Composition and Credit Statistics:% of IO Loans (Partial)2010:N/A2009*:N/A 2008*:49.25 2007*:30.222006*:45.20 2005*:41.862004:N/A 2003:N/A 2002:N/A Conduit/Fusion Fixed-Rate CMBS Deal Composition and CreditStatistics:% of IO Loans (Term)** 2010:N/A 2009*:N/A2008*:30.05 2007*:55.822006*:29.15 2005*:21.79 2004:34.62 2003:13.32 2002:6.11 Conduit/Fusion Fixed-Rate CMBS Deal Composition and Credit Statistics:Moody's Stressed DSCR: 2010:1.54 2009*:1.52 2008*:0.91 2007*:0.912006*:1.00 2005*:1.05 2004:1.19 2003:1.28 2002:1.27 Conduit/Fusion Fixed-Rate CMBS Deal Composition and Credit Statistics:Moody's Stressed LTV (%) 2010:73.002009*:65.202008*:106.72 2007*:111.242006*:100.50 2005*:96.402004:87.67 2003:83.51 2002:85.98 Conduit/Fusion Fixed-Rate CMBS Deal Composition and Credit Statistics:Subordinate Debt***2010:47.002009*:N/A 2008*:39.80 2007*:54.632006*:43.73 2005*:39.642004:28.90 2003:27.24 2002:8.58 Conduit/Fusion Fixed-Rate CMBS Deal Composition and Credit Statistics:B-notes (%) 2010:6.40 2009*:N/A2008*:4.91 2007*:8.092006*:6.90 2005*:7.07 2004:10.19 2003:13.092002:7.88 Conduit/Fusion Fixed-Rate CMBS Deal Composition and Credit Statistics:IG Rated Loans (%)2010:N/A 2009*:N/A 2008*:6.48 2007*:7.042006*:11.83 2005*:13.902004: 22.042003:22.942002: 14.32 Sources: Jefferies & Co. Fitch, S&P, and Moody's. *2005 thru 2009 represent AJ CE. **2002-2005 IO percentages reflect initial and term IO Loans combined.*** In-place and allowable.

Recent Examples of Steep Commercial Property Valuation Declines
$3.0bn Stuyvesant Town and Peter Cooper Village (WBCMT 07-C30, WBCMT 07-C31, MLCFC 07-5, MLCFC 07-6, CWCI 07-C2)
Fitch valued the $5.4b property at $1.8b in late 2009
Interest shortfalls rise to originally-rated 'BB' class
$125.2mm Promenade Shops at Dos Lagos (JPMCC 08-C2)
$170mm original value falls to $69.6mm
Interest shortfalls rise to originally-rated 'AA' rated class
$115.6mm Boscov's Portfolio Loans (BACM 06-3)
$182.7mm original value falls to $40.5mm;
Interest shortfalls rise to originally-rated 'AA' rated class
$81.1mm West Oaks Mall Loan (GCCFC 06-GG7):
$109.8mm original value falls to $13.6mm (liquidated in 12/09 with a loss of 78.5mm)
Interest shortfalls rise to originally-rated 'BBB-' rated class
$225mm Riverton Apartment Loan (CD 07-CD4)
$260mm original value falls to $108mm
Interest shortfalls rise to originally-rated 'BBB' rated class

Weighing the Risks of Default in a Commercial-Mortgage Pool
Reasons for borrowers to hold on...
Focus on long-term returns
Property net cash flow covers debt service
Significant 'scarcity' value and attractive features of current loans
Low mortgage rates, high percentage of full-term or partial-term interest-only periods
Negative tax consequences in a default associated with debt forgiveness
And reasons not to
Sharp declines in CRE values coupled with declining net cash flow act as disincentives to carry property until conditions improve, particularly in significant cash take-out via current loan
Massive public-to-private deals in '05-'07 of property value peaks suggest little incentive to go "out of pocket" to pay debt service
Maguire Properties gives back seven large office properties; Lembi Group gives back 51 multifamily properties (1,500 units) to lender UBS

Detailed Analysis of Current Loan Performance and Trends

CMBS Issuance Plummets, REIT Surprises to the Upside Fixed Rate Conduit Fusion CMBS Yearly Issuance Bar Chart titled: Fixed Rate Conduit Fusion CMBS Yearly Issuance covering the years from 2002 until 2010 with the total issuance ($B). 2002 is 34.4, 2002 is 52.9, 2004 is 74.2, 2005 is 136.4, 2006 is 161.8, 2007 is 188.6, 2008 is 10.7, 2009 is 1.4, 2010 is 4.7. Note for 2010: This information is valid as of 8/10. Bar chart titled: REIT Unsecured Debt Issuance vs IPO covering the years from 2002 until 2010. The chart contrasts Unsecured Debt and IPO. 2002 Unsecured Debt:10.6 2002 IPO:0.6 2003 Unsecured Debt: 10.9 2003 IPO:2.6 2004 Unsecured Debt:17.3 2004 IPO:8.0 2005 Unsecured Debt:16.3 2005 IPO:3.8 2006 Unsecured Debt: 25.3 2006 IPO:2.32007 Unsecured Debt: 18.2 2007 IPO:1.8 2008 Unsecured Debt:5.2 2008 IPO:0.5 2009 Unsecured Debt:10.4 2009 IPO:3. 0 2010 Unsecured Debt:13.3 2010 IPO:1.3 Sources SNL Financial: NAREIT * As of 8/10

G N M A P r o j e c t L o a n R E M I C I s s u a n c e S o a r s
G N M A P r o j e c t L o a n R E M I C I s s u a n c e v s . C M B S GNMA Project Loan REMIC Issuance Vs. CMBS Information in this bar chart is from the years 1990 t0 2010 covering Project Loan and CMBS. The Project Loan Issuance is in the ($B). The CMBS Issuance is ($B). 1990 Project Loan:2.6 CMBS:0.0 1991 Project Loan:1.1 CMBS:0.01992 Project Loan:0.9 CMBS:0.01993 Project Loan:2.1 CMBS:0.11994 Project Loan:2.0 CMBS:0.11995 Project Loan:2.0 CMBS:0.1 1996 Project Loan:2.0 CMBS:0.2 1997 Project Loan :2.6 CMBS:1.0 1998 Project Loan:2.7 CMBS:2.0 1999 Project Loan:1.7 CMBS:2.02000 Project Loan:1.3 CMBS:1.32001 Project Loan:2.2 CMBS:2.02002 Project Loan:4.8 CMBS:1.52003 Project Loan:6.3 CMBS:2.5 2004 Project Loan:6.0 CMBS:3.0 2005 Project Loan:4.5 CMBS:5.0 2006 Project Loan:5.9 CMBS:6.02007 Project Loan:2.9 CMBS:8.0 2008 Project Loan:3.6 CMBS:0.02009 Project Loan:6.0 CMBS:0.02010 Project Loan:8.3 CMBS:0.0 GNMA Project Loan REMIC Issuance Vs. CMBS Information in this bar chart is from the years 1990 t0 2010 covering Project Loan and CMBS. The Project Loan Issuance is in the ($B). The CMBS Issuance is ($B). 1990 Project Loan:2.6 CMBS:0.0 1991 Project Loan:1.1 CMBS:0.0 1992 Project Loan:0.9 CMBS:0.0 1993 Project Loan:2.1 CMBS:0.11994 Project Loan:2.0 CMBS:0.11995 Project Loan:2.0 CMBS:0.11996 Project Loan:2.0 CMBS:0.21997 Project Loan:2.6 CMBS:1.0 1998 Project Loan:2.7 CMBS:2.0 1999 Project Loan:1.7 CMBS:2.0 2000 Project Loan:1.3 CMBS:1.3 2001 Project Loan:2.2 CMBS:2.02002 Project Loan:4.8 CMBS:1.5 2003 Project Loan:6.3 CMBS:2.5 2004 Project Loan:6.0 CMBS:3.02005 Project Loan:4.5 CMBS:5.0 2006 Project Loan:5.9 CMBS:6.0 2007 Project Loan:2.9 CMBS:8.02008 Project Loan:3.6 CMBS:0.0 2009 Project Loan:6.0 CMBS:0.0 2010 Project Loan:8.3 CMBS:0.0

2009 - 2010 YTD Agency CMBS Issuance Expands
GNMA continues to issue Project Loan multi-family/healthcare backed REMIC securities
Total $6.0 billion in 2009; $8.3 billion YTD 2010
FHLMC begins securitizing it's multi-family loans beginning on 06/09
Total $7.7 billion; $6.6 billion from 2009 to YTD 2010
FNMA begins securitizing it's 10/9.5 DUS multi-family loans in 10/09
Total $4.1 billion from 2009

Commercial Mortgage Delinquencies Plague FDIC Insured Institutions
"Problem List" expands to 15-Year High - largest amount of assets since June 30, 1994 (as of 2Q10)
57 institutions were merged into other institutions in 2009, 45 institutions failed, during the quarter
FDIC's "Problem List" rose to 829 institutions with combined assets of $403 billion
Sheila Bair, FDIC Chairman:
"Commercial real estate is a looming problem. It's going to be a bigger driver of bank failures toward the end of this year and into next year." (9/2/09)
FDIC Insured Institutions Loan Performance: All
Loans Secured by Real Estate (as of June 30, 2010).
header row col1:All Loans Secured By Real Estate
col2:Loans Outstanding ($B) col3:30-89 Days Past Due (%)
col4:Non-Current** (%) col5:Total Past Due (%)
col6:Charged Off (%) end header row
All Loans Secured By Real Estate:Loans Outstanding($B):$4,366.80
30-89 Days Past Due (%):1.96 Non-Current**(%):7.32 Total Past Due (%):9.28 Charged Off (%):1.97
All Loans Secured by Real Estate:Construction and Development*:Loans Outstanding($B):$383.30:30-89 Days Past Due (%):2.36:Non-Current(%):16.87:Total Past Due (%):19.23:Charge-Off (%):5.14.
All Loans Secured By Real Estate:Nonfarm nonresidential Loans Outstanding($B):$1,081.00,30-89 Days Past Due (%):1.14:Non-Current** (%):4.28:Total Past Due (%):5.42
Charged Off (%):1.12. All Loans Secured By Real Estate:Multifamily residential real estate:Loans Outstanding($B):$214.70 30-89 Days Past Due(%):1.06 Non-Current** (%):4.16 Total Past Due (%):5.22 Charged Off (%):1.20.
All Loans Secured By Real Estate:Home Equity Loans: Loans Outstanding ($B):$654.50 30-89 Days Past Due (%):1.16 Non-Current** (%):1.71 Total Past Due (%):2.87 Charged Off (%):2.89.All Loans Secured By Real Estate:Other 1-4 family
residential: Loans Outstanding ($B):$1,874.30 30-89 Days Past Due (%):2.79 Non-Current** (%):9.75 Total Past Due (%):12.54 Charged Off (%):1.65.
Source FDIC *Construction and development loans includes loans for all property types under construction, as well as loans for land acquisition and development. **Non-current loan rates represent the perentage of loans in each category that
are past due 90 days or more or that are in non-accrual status.

Fixed-Rate CMBS Delinquencies to Rise to >10% by Year-End 2010
F i x e d C M B S d e l i n q u e n c y r a t e u p 4 6 6 b a s i s p o i n t s Y O Y ( a s o f 0 8 / 1 0 ) 8 . 7 % d e l i n q u e n c y r a t e P r e v i o u s a l l - t i m e h i g h o f 7 . 5 3 % i n 6 / 9 2 ( L i f e c o . l o a n s ) E x c e e d s p r e v i o u s C M B S u n i v e r s e h i g h o f 2 . 4 8 % i n 1 0 / 0 3 D o l l a r v o l u m e o f d e l i n q u e n t l o a n s m o r e t e l l i n g t h a n r a t e . $ 5 5 . 6 b i l l i o n i n 0 8 / 1 0 v s . $ 2 8 b i l l i o n i n 0 8 / 0 9 D r i v e r s o f C R E p e r f o r m a n c e p o s t - 9 / 0 7 U . S . r e c e s s i o n O v e r l y o p t i m i s t i c
c a s h - f l o w a s s u m p t i o n s / m i n i m a l t o n o u p s i d e i n p r o p e r t y v a l u a t i o n s . Sources: Jefferies and Co and Intex Solutions, Inc.
Line chart titled Fixed Rate Conduit CMBS Special Serviced & Delinquent Loans (%). Delinquency/Special Serviced Rate (%). There are three different Loans tracked on this chart. SS Loans, Delinquent Loans and SS & Current. A-03 starts with SS&Current at 2, dropping near 0 between A-07 and A-08 before ending at 4.41 at A-10. Delinquent Loans (%)
starts at A-03 at 2 dropping near 0 between A-06, A-06, and A-08 before ending at 8.70 at A-10. A-03 starts with SS Loans (%) at 4, dropping near 0 between A-07 and A-08, before ending at 12.69 at A-10. Sources Jefferies &Coand Intex Solutions Inc.

S p e c i a l - S e r v i c e r L o a n V o l u m e S o a r s
M a n y l o a n s m o v i n g d i r e c t l y f r o m c u r r e n t s t a t u s t o s p e c i a l s e r v i c i n g a s b o r r o w e r s c r y " I m m i n e n t D e f a u l t "
2 0 0 5 v i n t a g e f i v e - y e a r l o a n s m a i n d r i v e r o f i n c r e a s e d S S l o a n s i n 2 0 1 0
S h a r p u p w a r d v o l u m e i n S S l o a n s r a i s e s c o n c e r n s o f i n t e r e s t s h o r t f a l l s r e a c h i n g h i g h e r u p t h e c a p i t a l s t a c k Bar Chart titled Fixed Rate CMBS Special Serviced Loan Volume. Special Servicer Loan Volume ($MM). Sources Jefferies and Intex Solutions, Inc. Chart has information from Feb 05 to August 10. The Loan Volume starts in Feb 05 with 10,000 and stays around that area or lower from Feb 05 until Feb 08 until it starts to continually climb until Aug-09 where it hits 44,048 and ends in April 09 with 80,000 and August 2010 with 81,491.

'Amazing Shrinking Denominator' Effect to Push Delinquency Rate Higher
Fixed CMBS delinquency rate skewed higher by technical and fundamental factors
Fundamental: Increasing Numerator (Delinquent Loans)
Recession, aggressive underwriting, loan maturities, lack of capital drive up delinquencies
Technical: Decreasing Denominator
No new CMBS issuance since July 2008 and continuing through late-2009
Normal amortization and loan payoffs at maturity will cause further deterioration in the denominator
Loans with a current balance of $39 billion scheduled to mature in 2010
Factoring in projected declines in outstanding universe due to loan payoffs and amortization only in 2009
Assume average YTD '09 month-over-month increase in delinquent loans of $2.3 billion,
Delinquency rate climbs to 10+% by YE10

R i s i n g D e l i n q u e n c y C o n t r i b u t o r s : R e c e n t V i n t a g e s header row col1:Conduit/Fusion Fixed-Rate CMBS Conduit/ Fusion WA Delinquencies by Vintage (8/10) Col2:Orig Bal.($B) col3:Curr. Bal.($B)col4:30+Del.(%) col5:60+Del.(%) col6:90+Del.(%) col7:FC(%)col8:REO(%) col9:Total DEL.(%) col10:Cum.Loss(%) col11:Curr.&SS(%) col12:Watchlisted Loans(%) end header row Fixed-Rate:1996:Orig Bal:0.38:Curr.Bal:0.31:30+:0.00:60+Del:0.00:90+Del:0.33:FC:4.51 :REO:1.06:Total Del:6.37:Cum.Loss:3.03:Curr&SS:0.81:Watchlisted:21.33 Fixed-Rate:1997:Orig Bal:2.10:Curr.Bal:1.81:30+:0.41:60+Del:0.00:90+Del:0.35:FC:0.46 :REO:1.09:Total Del:2.30:Cum.Loss:2.77:Curr&SS:5.96:Watchlisted:19.63 Fixed-Rate:1998:Orig Bal:6.54:Curr. Bal:5.48:30+:0.24:60+Del:0.18:90+Del:3.17:FC:2.60 :REO:2.32:Total Del:8.51:Cum.Loss:2.14:Curr&SS:6.49:Watchlisted:17.97 Fixed-Rate:1999:Orig Bal:6.22:Curr.Bal:4.41:30+:0.72:60+Del:0.84:90+Del:9.88:FC:3.67 :REO:3.97:Total Del:19.12:Cum.Loss:2.19:Curr&SS:6.82:Watchlisted:19.32Fixed-Rate:2000:Orig Bal:7.94:Curr.Bal:4.88:30+:3.12:60+Del:2.03: 90+Del:10.02:FC:4.51 :REO:7.32:Total Del:27.04:Cum.Loss:2.42:Curr&SS:13.95:Watchlisted:25.93 Fixed-Rate:2001:Orig Bal:27.62:Curr.Bal:23.09:30+:0.50:60+Del:0.32:90+Del:2.69:FC:1.59 :REO:1.12:Total Del:6.26:Cum.Loss:1.83:Curr&SS:2.19:Watchlisted:24.99 Fixed-Rate:2002:Orig Bal:29.99:Curr.Bal:25.27:30+:0.56:60+Del:0.30:90+Del:1.37:FC:0.56 :REO:1.03:Total Del:3.83:Cum.Loss:1.14:Curr&SS:1.16:Watchlisted:20.22 Fixed-Rate:2003:Orig Bal:48.28:Curr.Bal:37.44:30+:0.73:60+Del:0.38:90+Del:1.38:FC:0.99 :REO:0.64:Total Del:4.12:Cum.Loss:0.55:Curr&SS:4.18:Watchlisted:19.28 Fixed-Rate:2004:Orig Bal:74.31:Curr.Bal:59.19:30+:0.96:60+Del:0.29:90+Del:1.99:FC:1.54 :REO:0.75: Total Del:5.54:Cum.Loss:0.48:Curr&SS:4.32:Watchlisted:21.46 Fixed-Rate:2005:Orig Bal:157.35:Curr.Bal:120.03:30+:1.13:60+Del:0.86:90+Del:3.57: FC:1.23:REO:0.70:Total Del:7.66:Cum.Loss:0.56:Curr&SS:5.69:Watchlisted:23.41 Fixed-Rate:2006:Orig Bal:204.47:Curr.Bal:158.49:30+:0.93:60+Del:0.54:90+Del:3.97: FC:1.92:REO:1.18:Total Del:8.55:Cum.Loss:0.50:Curr&SS:3.20:Watchlisted:26.76 Fixed-Rate:2007:Orig Bal:250.47:Curr.Bal:191.39:30+:0.99:60+Del:1.12:90+Del:4.40: FC:3.91:REO:1.00:Total Del:11.47:Cum.Loss:0.34:Curr&SS:5.11:Watchlisted:25.92 Fixed-Rate:2008:Orig Bal:16.23:Curr.Bal:10.57:30+:1.19:60+Del:0.51:90+Del:6.08:FC:2.31 :REO:1.70:Total Del:11.78:Cum.Loss:0.49:Curr&SS:2.48:Watchlisted:27.48 Fixed-Rate:Total:Orig Bal:831.91:Curr.Bal:642.37:30+:0.96:60+Del:0.73:90+Del:3.65: FC:2.27:REO:1.04:Total Del:8.70:Cum.Loss:0.58:Curr&SS:4.41:Watchlisted:24.50

Historical Delinquency Rates by Seasoning
F i x e d - R a t e C M B S L o a n D e l i n q u e n c y b y V i n t a g e Historical Delinquency Rates by Seasoning Line chart titled Fixed Rate CMBS Loan Delinquency by Vintage. Delinquency (%). Source Jefferies & Co and Intex Solutions, Inc. There are the years from 2002 to 2008 covered on the line chart with the delinquency percentage rate going from 0.0 to 28.0. The line chart measures the performance from April 07 to August 2010. All years commence from 0.0 and rise over time starting at April 09. From April 09 the line flow following 2000 climbs from April 2009 to August2010 to 28.0%. The other years rise slightly only to 12 and 4%.

D e l i n q u e n c y R a t e s b y T o p 1 0 S t a t e s C a l i f o r n i a : M a g u i r e P r o p e r t i e s f o r f e i t u r e o f o f f i c e h i g h l i g h t s C A w o e s : $ 9 5 b o f f i x e d - r a t e C M B S l o a n s i n s t a t e T e x a s a n d F l o r i d a : H i g h u n e m p l o y m e n t r a t e s a n d s o m e o f t h e h i g h e s t f o r e c l o s u r e r a t e s i n t h e U . S . h u r t multi-family 5 , 2 9 7 L o a n s o u t s t a n d i n g i n T e x a s 3 , 8 4 0 L o a n s o u t s t a n d i n g i n F l o r i d a GNMA Project Loan REMIC Issuance Vs. CMBS Information in this bar chart is from the years 1990 t0 2010 covering Project Loan and CMBS. The Project Loan Issuance is in the ($B). The CMBS Issuance is ($B). 1990 Project Loan:2.6 CMBS:0.0 1991 Project Loan:1.1 CMBS:0.0 1992 Project Loan:0.9 CMBS:0.0 1993 Project Loan:2.1 CMBS:0.1 1994 Project Loan:2.0 CMBS:0.1 1995 Project Loan:2.0 CMBS:0.1 1996 Project Loan:2.0 CMBS:0.2 1997 Project Loan:2.6 CMBS:1.0 1998 Project Loan:2.7 CMBS:2.0 1999 Project Loan:1.7 CMBS:2.0 2000 Project Loan:1.3 CMBS:1.3 2001 Project Loan:2.2 CMBS:2.0 2002 Project Loan:4.8 CMBS:1.5 2003 Project Loan:6.3 CMBS:2.5 2004 Project Loan:6.0 CMBS:3.0 2005 Project Loan:4.5 CMBS:5.02006 Project Loan:5.9 CMBS:6.0 2007 Project Loan:2.9 CMBS:8.0 2008 Project Loan:3.6 CMBS:0.02009 Project Loan:6.0 CMBS:0.0 2010 Project Loan:8.3 CMBS:0.0

Hotel and Multi-family Assets Lead Delinquencies
F i x e d R a t e C o n d u i t / F u s i o n C M B S D e l i n q u e n c i e s b y P r o p e r t y T y p e Hotel and Multi-family Assets Lead Delinquencies Line chart titled:fixed rate conduit/Fusion CMBS Delinquencies by Property Type. Delinquency Rate (%). Delinquency Rates are based upon August 2010 and August 2009 figures. Sources: Jefferies & Co and Intrex Solutions, Inc. HC Aug 10:3.8% HC Aug 09:8.7% HT Aug 10:16.1% HT Aug 09:5.9% IN Aug 10:6.0% IN Aug 09:2.9% MU Aug 10:8.0% MU Aug 09:3.6% MF Aug 10:13.6% MF Aug 09:6.5% OF Aug 10:6.6% OF Aug 09:2.6% RT Aug 10:6.9% RT Aug 09:4.0% SS Aug 10:2.8% SS Aug 09:2.0%

Average Sub-35% Loss Severities But on Limited Liquidations
F i x e d R a t e C o n d u i t / F u s i o n C M B S L i q u i d a t i o n s &
L o s s S e v e r i t i e s b y P r o p e r t y T y p e ( 8 / 1 0 )
Bar Chart Titled:Fixed Rate Conduit/Fusion CMBS
Liquidations & Loss Severities by Property Type
(8/10). Sources Jefferies and Intex Solutions Inc.
Chart information is based upon Cum Loss Severity
and # Liq. Loans.
HC Cum Loss Severity:37.9%
HC # Liq. Loans:5%
LO Cum Loss Severity:32.2% LO # Liq. Loans:20% IN Cum Loss Severity:33.0% IN # Liq. Loans:10%
MU Cum Loss Severity:34.5%
MU # Liq. Loans:5%
APT Cum Loss Severity:32.6%
APT # Liq. Loans:55%
OF Cum Loss Severity:29.6% OF # Liq. Loans:29% RT Cum Loss Severity:35.9% RT # Liq. Loans:40% SS Cum Loss Severity:20.8% SS # Liq. Loans:5% Unlabeled Cum Loss Severity Bar:35%

The Refinance Conundrum: CMBS Fixed- and Floating-Rate Loan Maturities

CMBS Loan Maturities "Manageable" But Overall Volume Overwhelming
Fixed-Rate CMBS Loan Maturities (2009-2019)
Bar Chart titled Fixed-Rate CMBS Loan Maturities (2009-2019) indicating the outstanding current balance ($B). 2009:19 2010:34 2011:44 2012:56 2013:42 2014:51 2015:99 2016:135 2017:119
Floating-Rate CMBS Loan Maturities (2009-2013)
Bar Chart titled Floating Rate CMBS Loan Maturities (2009-2013) indicating the loan maturity. 2009:1.6 2010:5.4 2011:16.1 2012:9.9 2013:0.7
Despite CMBS maturities of <$60 billion annually over next 5 years, overall commercial real estate loan maturities (banks, insurance companies and CMBS) loom large at $200 to >$300 billion annually between 2010 and 2013.

CMBS Spreads / Balance-sheet Issues Improve, Still No 'Real' Conduit lending
Commercial Mortgage Spreads to Treasurys header row col1:Commercial Mortgage Spreads to Treasurys Col2:vintage col3:Multifamily col4:Retail col5:Office col6:Industrial col7:Hotel end header row Commercial Mortgage:Year:Vintage 1999:Multifamily:195:Retail:233: Office:223:Hotel:298 Commercial Mortgage:Year:Vintage 2000:Multifamily:194:Retail:228:Office:221:Hotel:302 Commercial Mortgage:Year: Vintage 2001:Multifamily:205:Retail:239:Office:230:Hotel:286 Commercial Mortgage:Year:Vintage 2002:Multifamily:166:Retail:205: Office:188:Hotel:261 Commercial Mortgage:Year:Vintage 2003:Multifamily:143:Retail:172:Office:149:Hotel:252 Commercial Mortgage:Year:Vintage 2004:Multifamily:118:Retail:144:Office:123:Hotel:236 Commercial Mortgage:Year:Vintage 2005: Multifamily:107:Retail:124:Office:112:Hotel:194 Commercial Mortgage:Year:Vintage 2006:Multifamily:115:Retail:129:Office:119:Hotel:192 Commercial Mortgage:Year:Vintage 2007:Multifamily:315:Retail:315:Office:315:Hotel:378 Commercial Mortgage:Year:Vintage 2008:Multifamily:1200:Retail:1300:Office:1200:Hotel:1350 Commercial Mortgage:Year:Vintage 2009:Multifamily:1200:Retail:1300:Office:1200:Hotel:1350 Line Chart titled:Historical Commercial Mortgage Financing Spreads by Asset Type. Assets covered include Multi-family, Retail,Office, Hotel, Industrial. Source: Jefferies. Chart has information on the years 1997,1999,2001,2003, 2005, 2007, and 2009. All the Assets: Multi-family, Retail, Office, Hotel, and Industrial begin at or around 200 to 250 in 1999. There is no activity before 1999 on this chart. From 1999 to 2005 all activity takes a steep decrease toward zero. However, from 2005 to 2009 there is a sharp rise from near zero to 1200 for Industrial, 1200 for Office, 1300 for Retail and 1395 for Hotel.

Ability to Refinance Depends on Vintage/Seasoning M a j o r i t y o f l o a n s m a t u r i n g i n 2 0 1 0 w e r e o r i g i n a t e d i n 2 0 0 0 a n d 2 0 0 5
A m o r t i z i n g H i g h e r l o a n c o u p o n s a t o r i g i n a t i o n t h a n t o d a y H i g h e r c a p r a t e s a t o r i g i n a t i o n a n d t h u s e q u i t y b u i l d - u p a s c a p r a t e s m u c h l o w e r t o d a y $ 9 . 2 B o f f i x e d r a t e 1 0 - y e a r 2 0 0 0 v i n t a g e l o a n s m a t u r e i n 2 0 1 0
$ 1 5 . 6 B o f f i x e d r a t e 5 - y e a r 2 0 0 5 v i n t a g e l o a n s m a t u r e i n 2 0 1 0 - n o t a s w e l l p r o t e c t e d a s 2 0 0 0 v i n t a g e l o a n s header row col1:Average Commercial Mortgage Fixed Rate Col2:vintage-Year col3:Avg. Coupon (%)
col4:Avg. Cap Rate(%) col5:Avg. Loan Spread (BPs) col6:Avg. Pool LTV (%) col7:Avg. 10 Trsy. (%)
end header row Average Fixed Rate:Vintage:1998:Avg.Coupon(%):8.25:Avg.CapRate(%):8.56:Avg.Loan Spread (BPs):300:Avg. Pool LTV(%):69.3:Avg.10 Trsy.(%):5.25 Average Fixed Rate:Vintage:1999:Avg.
Coupon(%):7.99:Avg.CapRate(%):8.45:Avg.Loan Spread (BPs):234:Avg. Pool LTV(%):69.2:Avg.10 Trsy.(%):5.64 Average Fixed Rate:Vintage:2000:Avg.Coupon(%):8.35:Avg.CapRate(%):8.64:Avg.Loan Spread (BPs):233:Avg. Pool LTV(%):69.4:Avg.10 Trsy.(%):6.02
Average Fixed Rate:Vintage:2001:Avg.Coupon(%):7.38:Avg.CapRate(%):8.41:Avg.Loan Spread (BPs):238:Avg. Pool LTV(%):68.7:Avg.10 Trsy.(%):5.00
Average Fixed Rate:Vintage:2002:Avg.Coupon(%):6.61:Avg.CapRate(%):7.98:Avg.Loan Spread (BPs):202:Avg. Pool LTV(%):68.9:Avg.10 Trsy.(%):4.59
Average Fixed Rate:Vintage:2003:Avg.Coupon(%):5.73:Avg.CapRate(%):7.67:Avg.Loan Spread (BPs):173:Avg. Pool LTV(%):66.8:Avg.10 Trsy.(%):4.00
Average Fixed Rate:Vintage:2004:Avg.Coupon(%):5.75:Avg.CapRate(%):7.25:Avg.Loan Spread (BPs):149:Avg. Pool LTV(%):68.9:Avg.10 Trsy.(%):4.26
Average Fixed Rate:Vintage:2005:Avg.Coupon(%):5.58:Avg.CapRate(%):6.79:Avg.Loan Spread (BPs):130:Avg. Pool LTV(%):68.7:Avg.10 Trsy.(%):4.28
Average Fixed Rate:Vintage:2006:Avg.Coupon(%):6.14:Avg.CapRate(%):6.36:Avg.Loan Spread (BPs):135:Avg. Pool LTV(%):68.0:Avg.10 Trsy.(%):4.79
Average Fixed Rate:Vintage:2007:Avg.Coupon(%):7.91:Avg.CapRate(%):5.74:Avg.Loan Spread (BPs):328:Avg. Pool LTV(%):69.1:Avg.10 Trsy.(%):4.63
Average Fixed Rate:Vintage:2008:Avg.Coupon(%):10.00:Avg.CapRate(%):5.36:Avg.Loan Spread (BPs):635:Avg. Pool LTV(%):66.8:Avg.10 Trsy.(%):3.65

Refinance Activity
S t a t u s o f F i x e d - R a t e L o a n s w i t h 2 0 1 0 F i n a l M a t u r i t i e s ( a s o f 0 6 / 1 0 ) header row col1:Status of Fixed Rate Loans Col2:Status col3:Loan Count col4:Balance ($) col5:Maturities:1H10(%) col6:Maturities:FY09(%) col7:Maturities:FY08(%) end header row Source:Jefferies,Intex Solutions Inc. Status:All 1H10 Maturities:1957:Balance($):17,458,706,456 Status:Loans Paid-Off:1472:Balance($):12,611,288,565:Maturities:1H10(%):72.2%: :Maturities:FY09(%):62.9%:Maturities:FY08(%):82.0% Status:Loans Paid-Off:Full Payoff at Maturity:643:Balance($):5,184,006,366 Status:Loans Paid-Off:Payoff Prior to Maturity:679:Balance($):6,442,544,333 Status:Loans Paid-Off:Payoff with Prepay.Penalty:150:Balance($):984,737,866 Status:Loans Liquidated:156:Balance($):1,340,994,294:Maturities:1H10(%):7.7%: :Maturities:FY09(%):3.2%:Maturities:FY08(%):4.4% Status:Loans Liquidated:Disposition:109:Balance($):966,648,980 Status:Loans Liquidated:Disconted Pay Off:47:Balance($):374,345,314 Status:Loans Outstanding Post Maturity:329:Balance($):3,506,423,597:Maturities:1H10(%):20.1%: :Maturities:FY09(%):33.9%::Maturities:FY08(%):13.6% Status:Loans Outstanding Post Maturity:Loans Extended/Modified:59:Balance($):590,052,440 Status:Loans Outstanding Post Maturity:Loans Matured & Non-performing:258:Balance($):2,706,991,157 Status:Loans Outstanding Post Maturity:Loans Matured & Performing:9:Balance($):197,850,000 Status:Loans Outstanding Post Maturity:Loans Matured & Performing:3:Balance($):11,530,000

L a r g e s t F i x e d - R a t e C M B S L o a n s M a t u r i n g i n 2 0 1 0
F i x e d - R a t e C o n d u i t / F u s i o n L o a n s > $ 1 5 0 M i l l i o n M a t u r i n g i n 2 0 1 0 header row col1:Fixed Rate Conduit/Fusion Loans >$150 Million Maturing in 2010 Col2:Deal: col3:Loan col4:Orig. Bal ($MM): col5:Curr. Bal.($MM): col6:Statecol7:Prop. Type:col8:Orig.Bln.Term: col9:MR. DSCR: col10:MR.NCF col 11:MR Fin.Date: col 12: Sponsor/Borrower end header row Deal:CD06CD2 Loan:Villas Parkmerced Orig. Bal ($MM):550.00Curr. Bal.($MM):550.00 State:C Prop. Type:M F Orig.Bln.Term:60MR. DSCR:1.10MR.NCF:34,606,100 MR Fin.Date:9/30/2009 Sponsor/Borrower:Stellar Mgt & Rockpoint Grp Deal:JPC05LD4 Loan:Regency Portfolio Orig. Bal ($MM):349.7 Curr. Bal.($MM):317.4 State:NONE Prop. Type:RT Orig.Bln.Term:60 MR. DSCR:1.92MR. NCF:15,391,000MR Fin.Date:6/30/2009Sponsor/Borrower:Macquarie et al Deal:LBUB05C5 Loan:Providence PlaceOrig. Bal ($MM):273.60 Curr. Bal.($MM):258.53 State:RIProp. Type:RTOrig.Bln.Term:60 MR. DSCR:1.7MR.NCF:23,490,100 MR Fin.Date:9/30/2008Sponsor/Borrower:GGP Deal:CGG05CC5 Loan:Lynhaven Mall Orig. Bal ($MM):251.00Curr. Bal.($MM):233.88State:VAProp. Type:RTOrig.Bln.Term:50MR. DSCR:1.24MR.NCF:20,202,500MR Fin.Date:3/31/2008Sponsor/Borrower:GGP Deal:MLT05MC1 Loan:The Westchester Mall Orig. Bal ($MM):200.00Curr. Bal.($MM):200.00State:NYProp. Type:RTOrig.Bln.Term:60MR. DSCR:1.79MR.NCF:44,128,000MR Fin.Date:6/30/2009 Sponsor/Borrower:SPG Deal:MLT05CO Loan:The Westchester Mall Orig. Bal ($MM): 100.00Curr. Bal.($MM):100.00 State:NY Prop. Type:RTOrig.Bln.Term:60MR. DSCR:1.79 MR.NCF:44,128,00 0 MR Fin.Date:6/30/2009 Sponsor/Borrower:SPG Deal:LBUB06C6 Loan:Reckson Portfolio I Orig. Bal ($MM):196.07Curr. Bal.($MM):196.07State:NONE Prop. Type:OF Orig.Bln.Term:60MR. DSCR:2.50MR.NCF:8,067,350MR Fin.Date:6/30/2009 Sponsor/Borrower:NA Deal:LBUB05C7 Loan:Reckson Portfolio I Orig. Bal ($MM):196.07Curr. Bal.($MM):196.07State:NONEProp. Type:OFOrig.Bln.Term:60MR. DSCR:2.12MR.NCF:15,401,100MR Fin.Date:9/30/2009 Sponsor/Borrower:Reckson Australia Op. Co et al Deal:Loan:JPC05LD5Orig. Bal ($MM):2 Grand Central Tower Curr. Bal.($MM):190.00State:190.00Prop . Type:OFOrig.Bln.Term:60MR. DSCR:2.12 MR.NCF:15,401,100 MR Fin.Date:9/30/2009 Sponsor/Borrower:Two Grand Central TowerDeal:MSC04HQ3Loan:Arundel Mills Orig. Bal ($MM):187.00Curr. Bal.($MM):187.00State:MD Prop. Type:RT Orig.Bln.Term:84 MR. DSCR:3.16MR.NCF:27,598,100MR Fin.Date:9/30/2005Sponsor/Borrower:The Mills LP et al Deal:JPC05C13Loan:DRA-CRT Portfolio Orig. Bal ($MM):180.90 Curr. Bal.($MM):180.90 State:NONEProp. Type:OFOrig.Bln.Term:60MR. DSCR:1.67MR.NCF:8,178,020MR Fin.Date:6/30/2006Sponsor/Borrower:DRA-CRTDeal:WBC04C14 Loan:Park Place Mall Orig. Bal ($MM):190.00 Curr. Bal.($MM):176.44State:AZProp. Type:RTOrig.Bln.Term:66MR. DSCR:NONEMR.NCF:13/667/300MR Fin.Date:9/30/2008 Sponsor/Borrower:CGP Deal:BACM0503 Loan:Ridgedale Center Orig. Bal ($MM):190.00Curr. Bal.($MM):175.74State:MNProp. Type:RT Orig.Bln.Term:60 MR. DSCR:1.20 MR.NCF:3,621,120MR Fin.Date:3/31/2009 Sponsor/Borrower:Ridgedale Center LLC Deal:CSM06C01 Loan:Saint Louis Galleria Orig. Bal ($MM):180.00Curr. Bal.($MM):167.25State:MOProp. Type:RT Orig.Bln.Term:60 MR. DSCR:1.88 MR.NCF:5,024,790 MR Fin.Date:3/31/2009 Sponsor/Borrower:Saint Louis Galleria LLC Deal:MLT05CP1Loan:Highwoods Portfolio 56Orig. Bal ($MM):160.00 Curr. Bal.($MM):160.0 0 State:NONE Prop. Type:OF Orig.Bln.Term:60MR. DSCR:1.13MR.NCF:9,081,010MR Fin.Date:6/30/2009Sponsor/Borrower:Capital Partners Deal:GECC05C3 Loan:Oakland City Center Orig. Bal ($MM):150.00Curr. Bal.($MM):150.00 State:CA Prop. Type:OF Orig.Bln.Term:60 MR. DSCR:3.24 MR.NCF:22,836,400 MR Fin.Date:12/31/2008 Sponsor/Borrower:Shorenstein Realty Inv et al

CRE Loan Historical and Projected Default and loss Seasoning Curves

Historical CMBS Loan Defaults and Losses Modest to Date
1 0 . 1 % t o 1 1 . 6 % c u m u l a t i v e d e f a u l t s o n ' 9 5 - ' 9 7 v i n t a g e f i x e d - r a t e C M B S p o o l s
2 . 7 % t o 3 . 7 % c u m u l a t i v e l o s s e s o n ' 9 5 - ' 9 7 v i n t a g e f i x e d - r a t e C M B S p o o l s
M i n i m a l d e f a u l t s i n y e a r s 1 - 3 , c l i m b i n g i n y e a r s 4 - 7 , t h e n s t a b i l i z i n g / f a l l i n g t h e r e a f t e r
L o s s e s f o l l o w b y 1 2 t o 1 8 m o n t h s , l o n g e r i n s t r e s s e d r e a l e s t a t e / f i n a n c i n g m a r k e t s
Bar Chart with 13 Bar Charts titled Fixed Rate Commercial Mortgage Default and Loss Rates- All Property Types by Vintage. Range is from
the years 1995 to 2007 and Cumulative Default and Loss Rates Percentage. Range from 0 to 14%. Sources are Jefferies and Intex
Solutions as of 03/09. header row col1:Year: Col2:Cumulative Default Rate: col3:Cumulateive Loss Rate: end header row
Year:1995 Cumulative Default Rate:10.1Cumulative Loss Rate:3.7Year:1996Cumulative Default Rate:10.6Cumulative Loss Rate:2.7
Year:1997 Cumulative Default Rate:11.6Cumulative Loss Rate:2.6Year:1998Cumulative Default Rate:8.9Cumulative Loss Rate:1.8
Year:1999 Cumulative Default Rate:8.4Cumulative Loss Rate:1.5Year:2000Cumulative Default Rate:8.0 Cumulative Loss Rate:1.5
Year:2001 Cumulative Default Rate:5.9Cumulative Loss Rate:1.0Year:2002Cumulative Default Rate:3.0 Cumulative Loss Rate:0.5
Year:2003 Cumulative Default Rate:1.4 Cumulative Loss Rate:0.1Year:2004Cumulative Default Rate:1.1 Cumulative Loss Rate:0.1
Year:2005Cumulative Default Rate:0.9 Cumulative Loss Rate:0.0Year:2006Cumulative Default Rate:0.9Cumulative Loss Rate:0.0
Year:2007 Cumulative Default Rate:0.6Cumulative Loss Rate:0.0

Worst-Case Historical Scenario...Breaking the "Historicals"
Late-1980s/early-1990s represent worst CRE period since the Great Depression
CRE supply glut meets recession
- 1986: 10.9% cumulative losses
- 1990: 11.8% cumulative losses
Current cycle expected to exceed previous high in cumulative losses Bar Chart with Commercial Mortgage Losses (1978-1994) Sources Intex Solutions, Inc. Various Studies conducted by Howard Esaki, Masumi Goldman, Steven L'Heureux, and Mark Synderman. This Bar chart contains 17 bar charts with the percentage rates from 0% to 14%. Year:1978 Commercial Mortgage Losses:2.9 Year:1979 Commercial Mortgage Losses:2.1 Year:1980 Commercial Mortgage Losses:4.0Year:1981Commercial Mortgage Losses:5.5Year:1982 Commercial Mortgage Losses:6.7 Year:1983 Commercial Mortgage Losses:7.1Year:1984Commercial Mortgage Losses:9.1Year:1985Commercial Mortgage Losses:7.1 Year:1986 Commercial Mortgage Losses:10.9Year:1987Commercial Mortgage Losses:8.0 Year:1988 Commercial Mortgage Losses:6.9 Year:1989 Commercial Mortgage Losses:7.1Year:1990Commercial Mortgage Losses:11.8Year:1991 Commercial Mortgage Losses:2.2 Year:1992 Commercial Mortgage Losses:1.3Year:1993Commercial Mortgage Losses:1.0 Year:1994 Commercial Mortgage Losses:0.5
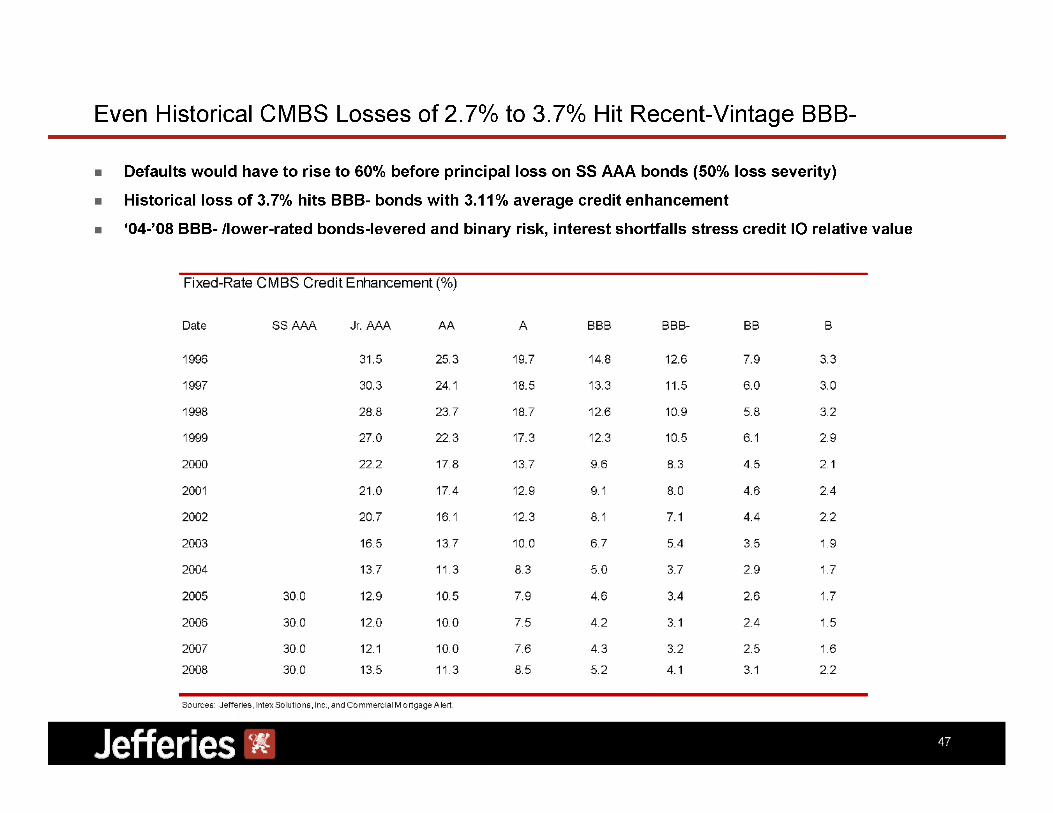
Even Historical CMBS Losses of 2.7% to 3.7% Hit Recent-Vintage BBB-
Defaults would have to rise to 60% before principal loss on SS AAA bonds (50% loss severity)
Historical loss of 3.7% hits BBB- bonds with 3.11% average credit enhancement
'04-'08 BBB- /lower-rated bonds-levered and binary risk, interest shortfalls stress credit IO relative value
Table titled: Fixed-Rate CMBS Credit Enhancement (%)
Contains information from 1996 to 2008 from SSAAA to
B Bond information.
header row Fixed-Rate CMBS Credit Enhancement (%) col1:Date: Col2:SS AAA: col3:Jr. AAA:col4:AA: col5:A:col6:BBB:
col7:BBB-: col8:BB:col9:B:end header row Date:1996 SS AAA:NONE Jr. AAA:31.5 AA:25.3 A:19.7
BBB:14.8 BBB-:12.6BB:7.9B:3.3Date:1997 SS AAA:None Jr. AAA:30.3 AA:24.1 A:18. BBB:13.3 BBB-:11.5
BB:6.0 B:3.0 Date:1998 SS AAA:NoneJr. AAA:28.8AA:23.7 A:18.7 BBB:12.6
BBB-:10.9BB:5.8 B:3.2 Date:1999 SS AAA:NONE Jr. AAA:27.0AA:22.3A:17.3BBB:12.3 BBB-:10.5 BB:6.1
B:2.9 Date:2000SS AAA:NoneJr. AAA:22.2AA:17.8A:13.7BBB:9.6 BBB-:8.3 BB:4.5 B:2.1 Date:2001
SS AAA:NONE Jr. AAA:21.0AA:17.4A:12.9BBB:9.1BBB-:8.0BB:4.6B:2.4 Date:2002 SS AAA:Non e Jr. AAA:20.7
AA:16.1 A:12.3BBB:8.1BBB-:7.1BB:4.4 B:2.2 Date:2003SS AAA:NoneJr. AAA:16.5AA:13.7A:10.0
BBB:6.7 BBB-:5.4 BB:3.5B:1.9 Date:2004 SS AAA:NoneJr. AAA:13.7AA:11.3A:8.3 BBB:5.0 BBB-:3.7BB:2.9B:1.7
Date:2005 SS AAA:30.0 Jr. AAA:12.9AA:10.5A:7.9BBB:4.6 BBB-:3.4 BB:2.6B:1.7Date:2006 SS AAA:30.0 Jr. AAA:12.0
AA:10.0 A:7.5 BBB:4.2 BBB-:3.1 BB:2.4B:1.5 Date:2007SS AAA:30.0Jr. AAA:12.1AA:10.0A:7.6BBB:4.3 BBB-:3.2
BB:2.5 B:1.6Date:2008SS AAA:30.0Jr. AAA:13.5AA:11.3A:8.5 BBB:5.2 BBB-:4.1 BB:3.1 B:2.2

CRE Default & Loss Vectors: Base Stress
B a s e - C a s e S t r e s s S c e n a r i o D e f i n e d : H i s t o r i c a l E x p e r i e n c e o f C R E l o a n s o r i g i n a t e d f r o m ' 7 2 - ' 0 7 A c c o u n t s f o r f u l l e c o n o m i c / C R E c y c l e s
H i s t o r i c a l D e f a u l t s a n d L o s s e s C u m u l a t i v e D e f a u l t R a t e : 1 3 . 6 5 % C u m u l a t i v e L o s s R a t e : 3 . 7 6 % header row Base Case Scenario col1:Year: Col2:CDR(%):col3:Rem. Balance (%):col4:Loss by Year of Seasoning (%): col5:Cumulative Loss (%): end header rowYear:0CDR(%):0.25Rem. Balance(%):99.75Loss by Year of Seasoning (%):0.00 Cumulative Loss (%):0.00 Year:1CDR(%):0.94Rem. Balance (%):98.81Loss by Year of Seasoning (%):0.00Cumulative Loss (%):0.00 Year:2 CDR(%):1.31Rem. Balance (%):97.50Loss by Year of Seasoning (%):0.10Cumulative Loss (%):0.10Year:3CDR(%):1.43 Rem. Balance (%):96.07 Loss by Year of Seasoning (%):0.33Cumulative Loss (%):0.43 Year:4 CDR(%):1.56 Rem. Balance (%):94.51 Loss by Year of Seasoning (%):0.40Cumulative Loss (%):0.83Year:5CDR(%):1.54 Rem. Balance (%):92.97 Loss by Year of Seasoning (%):0.46Cumulative Loss (%):1.29 Year:6 CDR(%):1.58 Rem. Balance (%):91.39Loss by Year of Seasoning (%):0.43Cumulative Loss (%):1.71Year:7 CDR(%):1.14Rem. Balance (%):90.25 Loss by Year of Seasoning (%):0.21Cumulative Loss (%):1.92 Year:8CDR(%):1.03Rem. Balance (%):89.21 Loss by Year of Seasoning (%):0.5 8 Cumulative Loss (%):2.50 Year:9CDR(%):0.78 Rem. Balance (%):88.43 Loss by Year of Seasoning (%):0.39 Cumulative Loss (%):2.89 Year:10CDR(%):0.88Rem. Balance (%):87.56 Loss by Year of Seasoning (%):0.3 3 Cumulative Loss (%):3.22 Year:1CDR(%):0.63Rem. Balance (%):86.92Loss by Year of Seasoning (%):0.25Cumulative Loss (%):3.47 Year:12 CDR(%):0.57 Rem. Balance (%):86.35Loss by Year of Seasoning (%):0.29Cumulative Loss (%):3.76Total:CDR(%):13.65 Loss by Year of Seasoning:3.76

Commercial Real Estate Default & Loss Vectors: Moderate-Stress
M o d e r a t e S t r e s s S c e n a r i o D e f i n e d ' 8 0 t o ' 9 0 v i n t a g e s
M o r t g a g e p e r f o r m a n c e f r o m ' 8 0 - ' 0 0 E c o n o m i c E n v i r o n m e n t 3 r e c e s s i o n s ( 9 / 7 4 t o 3 / 7 5 , 6 / 8 0 t o 1 2 / 8 0 , 1 2 / 9 0 t o 3 / 9 1 ) P r o l o n g e d p e r i o d s o f g r o w t h ( 6 / 7 5 t o 3 / 8 0 , 1 2 / 8 0 t o 9 / 9 0 , 6 / 9 1 t o 1 2 / 0 7 ) C o m m e r c i a l R e a l E s t a t e E n v i r o n m e n t
W i d e r a n g e o f c a p r a t e s : 6 . 6 5 % t o 9 . 6 2 % H i s t o r i c a l D e f a u l t s a n d L o s s e s C u m u l a t i v e D e f a u l t R a t e : 2 0 . 3 6 % C u m u l a t i v e L o s s R a t e : 7 . 0 6 % header row Moderate Stress Scenario Fixed Rate Commercial Mortgage Moderate Stress Scenario: The Experience of 1980-1990 Vintage Loans col1:Year Col2:CDR(%): col3:Rem. Balance (%): col4:Loss by Year of Seasoning (%): col5:Cumulative Loss (%): end header rowYear:0CDR(%):0.25Rem. Balance(%):99.75Loss by Year of Seasoning (%):0.00 Cumulative Loss (%):0.00Year:1 CDR(%):0.97Rem. Balance (%):98.77Loss by Year of Seasoning (%):0.00Cumulative Loss (%):0.00Year:2 CDR(%):1.92Rem. Balance(%):96.86Loss by Year of Seasoning (%):0.10Cumulative Loss (%):0. 10Year:3CDR(%):2.13 Rem. Balance(%):94.73 Loss by Year of Seasoning (%):0.35 Cumulative Loss (%):0.45Year:4CDR(%):2.51Rem. Balance(%):92.21 Loss by Year of Seasoning (%):0.70 Cumulative Loss (%):1.15 Year: 5CDR(%):2.89Rem. Balance(%):89.32Loss by Year of Seasoning (%):0.78Cumulative Loss (%):1.93Year:6 CDR(%):3.56 Rem. Balance(%):85.76Loss by Year of Seasoning (%):0.90Cumulative Loss (%):2.83Year:7CDR(%):1.83Rem. Balance(%):83.93 Loss by Year of Seasoning (%):1.04 Cumulative Loss (%):3.87Year:8CDR(%):1.56Rem. Balance(%):82.37Loss by Year of Seasoning (%):1.23 Cumulative loss (%):5.10 Year:9CDR(%):0.63Rem. Balance(%):81.73Loss by Year of Seasoning (%):0.65Cumulative Loss (%):5.75 Year:10 CDR(%):1.3 Rem. Balance(%):80.40 Loss by Year of Seasoning (%):0.58 Cumulative Loss (%):6.33 Year:11CDR(%):0.56 Rem. Balance(%):79.84 Loss by Year of Seasoning (%):0.23Cumulative Loss (%):6.57Year:12CDR(%):0.21Rem. Balance(%):79.64 Loss by Year of Seasoning (%):0.49 Cumulative Loss (%):7.06 Year:Total CDR(%):20.36 Loss by Year of Seasoning (%):7.06

CRE Default and Loss Vectors: Moderate to Severe Stress
M o d e r a t e t o S e v e r e S t r e s s S c e n a r i o D e f i n e d ' 8 4 t o ' 8 7 v i n t a g e s E c o n o m i c / C R E E n v i r o n m e n t 8 0 s C R E b o o m d u e t o ' 8 1 E c o n o m i c R e c o v e r y
A c t T a x R e f o r m A c t o f ' 8 6 r e d u c e s d e m a n d E a r l y ' 9 0 s r e c e s s i o n H i s t o r i c a l D e f a u l t s a n d L o s s e s C u m u l a t i v e D e f a u l t R a t e : 3 1 . 6 %
C u m u l a t i v e L o s s R a t e : 9 . 3 % header row Moderate Stress Scenario Fixed Rate Commercial Mortgage Moderate Stress Scenario: The Experience of 1984-1987 Vintage Loans col1:Year: Col2:CDR(%): col3:Rem. Balance (%): col4:Loss by Year of Seasoning (%): col5:Cumulative Loss (%): end header row Year:0 CDR(%):0.00Rem. Balance (%):100.00 Loss by Year of Seasoning (%):0.00 Cumulative Loss (%):0.00Year:1 CDR(%):0.92 Rem. Balance (%):99.08 Loss by Year of Seasoning (%):0.00 Cumulative Loss (%):0.00 Year:2 CDR(%):2.28Rem. Balance (%):96.80Loss by Year of Seasoning (%):0.28Cumulative Loss (%):0.28 Year:3CDR(%):2.14Rem. Balance (%):94.66Loss by Year of Seasoning (%):0.68 Cumulative Loss (%):0.96 Year:4 CDR(%):3.25 Rem. Balance (%):91.41 Loss by Year of Seasoning (%):0.89Cumulative Loss (%):1.85 Year:5 CDR(%):5.82Rem. Balance (%):85.59 Loss by Year of Seasoning (%):0.95 Cumulative Loss (%):2.80 Year:6 CDR(%):10.30Rem. Balance (%):75.29 Loss by Year of Seasoning (%):0.98 Cumulative Loss (%):3.78Year:7CDR(%):2.47Rem. Balance (%):72.82Loss by Year of Seasoning (%):1.59 Cumulative Loss (%):5.37 Year:8 CDR(%):1.31Rem. Balance (%):71.51Loss by Year of Seasoning (%):1.75 Cumulative Loss (%):7.12 Year:9 CDR(%):0.24Rem. Balance (%):71.27Loss by Year of Seasoning (%):0.85Cumulative Loss (%):7.97 Year:10 CDR(%):2.32 Rem. Balance (%):68.95 Loss by Year of Seasoning (%):0.60Cumulative Loss (%):8.57Year:11CDR(%):0.23Rem. Balance (%):68.72 Loss by Year of Seasoning (%):0.25 Cumulative Loss (%):8.82 Year:12 CDR(%):0.31 Rem. Balance (%):68.41 Loss by Year of Seasoning (%):0.50 Cumulative Loss (%):9.32 Year:TotalCDR(%):31.59Loss by Year of Seasoning (%):9.32

CRE Default and Loss Vectors: Severe Stress
S e v e r e S t r e s s S c e n a r i o D e f i n e d ' 8 6 e x p e r i e n c e w i t h ' 0 7 - ' 0 8 l o s s l e v e l s H i s t o r i c a l D e f a u l t s a n d L o s s e s C u m u l a t i v e D e f a u l t R a t e : 3 1 . 6 %
C u m u l a t i v e L o s s R a t e : 1 4 . 2 2 % header row Ultra Severe Stress Scenario Fixed Rate Commercial Mortgage Moderate Stress Scenario: The Experience of 1986-Plus Loans Sources:Intex Solutions, inc. Various Studies conducted by Howard Esaki, Masumi Goldman, Steven L'Heureux, and Mark Snyderman. col1:Year: Col2:CDR(%): col3:Rem. Balance (%):col4:Loss by Year of Seasoning (%): col5:Cumulative Loss (%): end header rowYear:0CDR(%):0.00Rem. Balance (%):100.00Loss by Year of Seasoning (%):0.00 Cumulative Loss (%):0.00 Year:1CDR(%):0.92Rem. Balance (%):99.08Loss by Year of Seasoning (%):0.41Cumulative Loss (%):0.41 Year:2CDR(%):2.28Rem. Balance (%):96.80Loss by Year of Seasoning (%):1.03Cumulative Loss (%):1.44 Year:3CDR(%):2.14 Rem. Balance (%):94.66 Loss by Year of Seasoning (%):0.96 Cumulative Loss (%):2.40Year:4CDR(%):3.25Rem. Balance (%):91.41 Loss by Year of Seasoning (%):1.46 Cumulative Loss (%):3.86Year:5CDR(%):5.82Rem. Balance (%):85.59 Loss by Year of Seasoning (%):2.62 Cumulative Loss (%):6.48 Year:6CDR(%):10.30Rem. Balance (%):75.29Loss by Year of Seasoning (%):4.64 Cumulative Loss (%):11.12 Year:7CDR(%):2.47Rem. Balance (%):72.82 Loss by Year of Seasoning (%):1.11 Cumulative Loss (%):12.23 Year:8CDR(%):1.31Rem. Balance (%):71.51Loss by Year of Seasoning (%):0.59Cumulative Loss (%):12.82 Year:9 CDR(%):0.24 Rem. Balance (%):71.27Loss by Year of Seasoning (%):0.11Cumulative Loss (%):12.93 Year:10 CDR(%):2.32 Rem. Balance (%):68.95 Loss by Year of Seasoning (%):1.04Cumulative Loss (%):13.97Year:11 CDR(%):0.2 Rem. Balance (%):68.72 Loss by Year of Seasoning (%):0.11 Cumulative Loss (%):14.08Year:12CDR(%):0.31Rem. Balance (%):68.41Loss by Year of Seasoning (%):0.11 Cumulative Loss (%):14.22 Year:TotalCDR(%):31.59Loss by Year of Seasoning (%):14.22

Rating Agency CMBS Actions

CMBS Bond Ratings Change Course: Downgrades Lead Upgrades
Ten years of historically high upgrade/downgrade ratios High levels of defeasance Strong pool performance Rising property valuations
Amortization As of 2008 inverted upgrade/downgrade ratios going forward Reduced credit enhancement on more recent CMBS
Reduced defeasance Growing volume of watch listed loans Refinance risk on 2005-2007 vintage loans Inability to reach pro-forma cash-
flow assumptions Changes to rating agency models
Bar chart of CMBS Upgrade/Downgrade Ratios by Year of Ratings Action. Chart ranges from the years 1997-2009. CMBS Upgrade/
Downgrade Ratios by Year of Ratings Actions Year:1997 Ratios:9.7Year:1998Ratios:7.0Year:1999Ratios:11.4Year:2000 Ratios:6.1 Year:2001
Ratios:7.1 Year:2002Ratios:1.3Year:2003Ratios:1.7Year:2004Ratios:3.3Year:2005Ratios:7.7Year:2006 Ratios:15. Year:2007
Ratios:9.2 Year:2008Ratios:0.7Year:2009Ratios:0.0

S&P Proposed Changes in Conduit/Fusion CMBS Rating Methodology
Property evaluation criteria unchanged
Criteria updates
Established new 'AAA' CE levels to withstand declining commercial-property income
CE target of 20% deemed sufficient to allow AAAs to withstand extreme economic downturn without defaulting
Refined cap rates for greater specificity and consistency from one pool to another
Introduced a standardized method to assess loan and geographic concentrations
Employed a forward-looking CRE forecast to determine the expected loss for the transaction
Refined surveillance methodology for projected losses
S & P ' s n e w m o d e l p r o j e c t s l o s s e s o f 2 0 % o r m o r e o n m o s t ' 0 7 c o n d u i t / f u s i o n p o o l s ; 2 5 % , 6 0 % a n d 9 0 % o f m o s t s e n i o r b o n d s w i t h i n t h e ' 0 5 , ' 0 6
a n d ' 0 7 v i n t a g e s r e s p e c t i v e l y m a y b e d o w n g r a d e d ' 0 0 t o ' 0 4 C M B S b o n d s w i l l s e e d o w n g r a d e s t o a l e s s e r d e g r e e
T h e c h a n g e i n r a t i n g m e t h o d o l o g y a f f e c t e d t h e r a t i n g s o u t l o o k s o n 3 , 5 6 3 t r a n c h e s f r o m 2 1 7 t r a n s a c t i o n s Information on S&P Downgraded
Super Senior Classes in 2009
Class and # of Downgrades Source of information: Standard and Poors Class:A1-A# of Downgrades:77Class: A1
# of Downgrades:1 Class:A2# of Downgrades:5Class:A3# of Downgrades:22Class:A4# of Downgrades:68
CLass:A5 # of Downgrades:11Class:AAB# of Downgrades:5

Moody's and Fitch: More Gradual Approach Than S&P, Same Ultimate Rating
Moody's
Expected loss estimate of 5% on average for 2006-2008 conduit and fusion deals
"Super-duper Aaa-rated classes for late vintage deals, with 30% credit enhancement and a six times multiple of current expected loss, are unlikely to experience downgrades. "
June 2009, Sector Comment - Moody's Structured Finance - Update To February U.S. CMBS Ratings Sweep: Super-Duper Aaa's
Unlikely to Experience Downgrades
Fitch
Completed review of 78, 2006-2008 vintage CMBS transactions ($230.4 billion)
Affirmed 80% ($186.1 billion) of the tranches and downgraded 20% ($44.3 billion)
"Fitch affirmed all 492 super senior 'AAA' classes in its rated portfolio ($164 billion), along with seven junior 'AAA' classes ($1.1 billion) and 88 mezzanine 'AAA' classes ($17.6 billion)."
16 Oct 2009, Fitch Completes Analysis on 2006-2008 Fixed Rate U.S. CMBS

C M B S M a s t e r S e r v i c e r s F a c e D o w n g r a d e R i s k Details on Largest Master Servicers Downgrade Risk Chart header row Details on Largest Master Servicers Sources:Intex Solutions, Inc. Fitch Ratings, Moody's Investors Service, Standard & Poors, Bloomberg Unlisted. col1:Servicer:Col2:Curr. Rating (Fitch):col3:MR Action (Fitch):col4:Curr.Rating (S&P): col5:MR Action (S&P): end header row Master Servicer: Berkadia Comm. Morg. LLC Curr. Rating (Fitch):CMS2+MR Action (Fitch):Affirmed 11/12/09Curr.Rating (S&P):StrongMR Action (S&P):Affirmed 12/11/2009 Master Servicer:Wells Fargo Bank, N.A. Curr. Rating (Fitch):CMS2-MR Action (Fitch):Downgraded 8/12/10 Curr.Rating (S&P):Above Avg MR Action (S&P):Downgraded 3/25/201 Master Servicer:Midland Loan Services, Inc. Curr. Rating (Fitch):CMS1 MR Action (Fitch):Affirmed 9/22/2009 Curr.Rating (S&P):Strong MR Action (S&P):Affirmed 4/7/2009 Master Servicer:Bank of America Merrill Lynch Curr. Rating (Fitch):CMS2+MR Action (Fitch):Affirmed 11/12/2009 Curr.Rating (S&P):Strong MR Action (S&P):Affirmed 9/17/2007Master Servicer:KeyBank Real Estate Capital Curr. Rating (Fitch):CMS1MR Action (Fitch):Affirmed 9/18/2009 Curr.Rating (S&P):Strong MR Action (S&P):Affirmed 2/9/2009 Master Servicer:GEMSA Loan Services Curr. Rating (Fitch):CMS1-MR Action (Fitch):Affirmed 12/8/2009Curr.Rating (S&P):StrongMR Action (S&P):Affirmed 8/14/2008 Master Servicer:Prudential Asset Resources Curr. Rating (Fitch):CMS2MR Action (Fitch):Affirmed 8/19/2010Curr.Rating (S&P):Above Avg. MR Action (S&P):Raised 3/08/2010Master Servicer: Bank of New York Curr. Rating (Fitch):CMS3+ MR Action (Fitch):Affirmed 6/16/2010Curr.Rating (S&P):AverageMR Action (S&P):Affirmed 3/5/2010Master Servicer:Pacific Life Curr. Rating (Fitch):CMS2+MR Action (Fitch):Affirmed 7/22/2010 Curr.Rating (S&P):Above Avg. MR Action (S&P):Affirmed 12/23/2008

C M B S S p e c i a l S e r v i c e r s F a c e D o w n g r a d e R i s k header row Details on Largest Special Servicers Sources:Intex Solutions, Inc. Fitch Ratings, Moody's Investors Service, Standard & Poors, Bloomberg Unlisted. col1:Special Servicer: Col2:Curr. Rating (Fitch):col3:MR Action (Fitch):col4:Curr.Rating (S&P):col5:MR Action (S&P):end header row Special Servicer:LNR REFSG Curr. Rating (Fitch):CSS2MR Action (Fitch):Affirmed 8/27/2010 Curr.Rating (S&P):Strong MR Action (S&P):Affirmed 3/16/2010 Special Servicer:CWCapital Asset Mgmt. LLC. Curr. Rating (Fitch):CsS1-MR Action (Fitch):Downgraded 9/22/10Curr.Rating (S&P):StrongMR Action (S&P):Affirmed 7/22/09 Special Servicer:C-III Asset Management LLC Curr. Rating (Fitch):CSS1- MR Action (Fitch):Affirmed 6/22/2010 Curr.Rating (S&P):StrongMR Action (S&P):Affirmed 12/17/2008 Special Servicer:Midland Loan Services Inc Curr. Rating (Fitch):CSS1MR Action (Fitch):Affirmed 9/22/2009 Curr.Rating (S&P):Strong MR Action (S&P):Affirmed 4/7/2009Special Servicer:Berkadia Comm. Mort. LLCCurr. Rating (Fitch):CSS2MR Action (Fitch):Upgraded 11/12/09Curr.Rating (S&P):StrongMR Action (S&P):Affirmed 12/11/2009 Special Servicer:J.E. Robert C Curr. Rating (Fitch):CSS2+MR Action (Fitch):Downgraded 2/18/2010Curr.Rating (S&P):StrongMR Action (S&P):Affirmed 5/11/2009Special Servicer:ING Clarion Capital Loan Services Curr. Rating (Fitch):CSS2+ MR Action (Fitch):Affirmed 7/31/2008 Curr.Rating (S&P):Above Avg. MR Action (S&P):Assigned 8/26/2009 Special Servicer: KeyBank Real Estate Captial Curr. Rating (Fitch):CSS2+MR Action (Fitch):Affirmed 9/18/2009 Curr.Rating (S&P):Strong MR Action (S&P):Affirmed 2/9/2009 Special Servicer:Bank of America Merrill Lynch Curr. Rating (Fitch):CSS2MR Action (Fitch):Upgraded 11/12/09Curr.Rating (S&P):Above Avg.MR Action (S&P):Raised 1/26/2009 Special Servicer:Wells Fargo Bank, N.A Curr. Rating (Fitch):CSS2-MR Action (Fitch):Upgraded 8/12/10Curr. Rating (S&P):Above Avg.MR Action (S&P):Affirmed 5/19/2009

The Commercial Real Estate Space Markets

Constrained Capital and Uncertain Valuations Slash CRE Transactions
C o m m e r c i a l - p r o p e r t y t r a n s a c t i o n s d o w n s h a r p l y - 7 3 % i n 2 0 0 8 - 7 4 % i n 2 0 0 9 ( d o l l a r v o l u m e ) R e d u c e d c r e d i t a v a i l a b i l i t y
D e t e r i o r a t i n g f u n d a m e n t a l s 2 0 0 4 - 2 0 0 7 : S u r g e i n p r o p e r t y t r a n s a c t i o n s 2 0 0 7 : P e a k i n t r a n s a c t i o n v o l u m e ,
$ 5 1 3 b i l l i o n i n v o l u m e v i a 7 , 2 7 4 t r a n s a c t i o n s D r i v e n b y p u b l i c t o p r i v a t e m e g a d e a l s 2 0 0 7 C R E i n v e s t o r s n o w u n d e r w a t e r
Bar Chart is shown with CRE Transaction Volume (All Asset Ty;es) as the titled. It reflects information from the years
2001-2010 as of 8/10 and the Sources are Jefferies and RCA. It tracks within the bar chart and one line graph via the bar chart
the Sales Volumes ($B) and the line chart is the # of Transactions. Special Servicer:Wells Fargo Bank, N.A Curr. Rating (Fitch):CSS2-
MR Action (Fitch):Upgraded 8/12/10 Curr. Rating (S&P):Above Avg. MR Action (S&P):Affirmed 5/19/2009Year:2001 Sales Volume ($B):79.0
# of Transactions:4,888 Year:2002Sales Volume ($B):101.5# of Transactions:4979Year:2003Sales Volume ($B):122.0
# of Transactions:6357 Year:2004Sales Volume ($B):206.8# of Transactions:10165Year:2005Sales Volume ($B):307.6
# of Transactions:13,965 Year:2006Sales Volume ($B):353.7# of Transactions:16,027Year:2007Sales Volume ($B):513.0
# of Transactions:18,323 Year:2008Sales Volume ($B):139.4# of Transactions:7274Year:2009Sales Volume ($B):49.0
# of Transactions:1750Year:2010Sales Volume ($B):51.6# of Transactions:2549

'05-'07 Public-to-Private M&A Activity Suggests Key Borrowers Underwater
M a s s i v e s h i f t i n C R E f r o m p u b l i c t o p r i v a t e h a n d s a t t h e ' t o p o f t h e m a r k e t ' i n v a l u a t i o n s 2 0 0 5 : $ 1 4 . 8 b i l l i o n t h r o u g h 9 t r a n s a c t i o n s
2 0 0 6 : $ 1 3 6 . 1 b i l l i o n t h r o u g h 4 1 t r a n s a c t i o n s 2 0 0 7 : $ 1 3 8 . 7 b i l l i o n t h r o u g h 2 7 t r a n s a c t i o n s
header row M&A Activities 2005-2007 Source:Jefferies
col1:Acquirer: Col2:Target: col3:Acquirer Type: col4:Total Value ($B):end header row Acquirer:Year 2005 ING Clarion Target:Gables Residential Trust
Acquirer Type:Private Equity Joint Venture Total Value ($B):4.90Acquirer:PrologisTarget:Catellus Development Corp. Acquirer Type:Public REIT
Total Value ($B):3.82 Acquirer:DRA AdvisorsTarget:Capital Automotive REIT Acquirer Type:Investment Advisor Total Value ($B):1.80
Acquirer:The Lightstone GroupTarget:Prince Group Realty Trust Acquirer Type:Private Real Estate Company Total Value ($B):1.50
Acquirer:Camden Property TrustTarget:Summit Property Group Acquirer Type:Public REIT Total Value ($B):1.10
Acquirer:Year 2006 Blackstone Group Target:Equity Office Properties Trust Acquirer Type:Private Equity Total Value ($B):39.00
Acquirer:Fertitta Colony PartnersTarget:Station Casinos Acquirer Type:Private Equity Total Value ($B):8.80
Acquirer:Blackstone Group, Brookfield Prop. Co. Target:Trizec Properties INC Acquirer Type:JV-Private Equity &REOCTotal Value ($B):6.50
Acquirer:Developers Diversified Realty Corp.Target:Inland Retail Real Estate Trust Inc Acquirer Type:JV-Private REIT Total Value ($B):6.20
Acquirer:SL Green Realty Corp.Target:Reckson Associates Realty Cor Acquirer Type:Public REI Total Value ($B):6.00
Acquirer:Year 2007: Apollo Management TPG INc Target:Harrah's Entertainment Acquirer Type:Private EquityTotal Value ($B):28.00
Acquirer:Blackstone Group Target:Hilton Hotels Cor Acquirer Type:Private Equit Total Value ($B):26.00
Acquirer:Tishman Speyer, Lehman Brothers Target:Archstone-SmithAcquirer Type:Private CO/BrokerageTotal Value ($B):22.00
Acquirer:SPG, Farallon Target:Mills Corp. Acquirer Type:Public REIT Total Value ($B):7.90 Acquirer:Morgan Stanley Real Estate
Target:CNL Hotel & Resort
Acquirer Type:Private Equity
Total Value ($B):6.70

NCREIF Unleveraged CRE Equity Returns for all Property Types
A n n u a l r e t u r n s p e a k e d i n 2 0 0 5 T o t a l R e t u r n : 1 8 . 7 2 % I n c o m e R e t u r n : 6 . 5 9 % C a p i t a l A p p r e c i a t i o n : 1 2 . 1 3 %
2 0 0 9 a n n u a l i z e d t o t a l r e t u r n s a r e d o w n 2 1 3 % f r o m t h e p e a k
T o t a l R e t u r n : - 2 1 . 1 2 % I n c o m e R e t u r n : 5 . 9 1 % C a p i t a l A p p r e c i a t i o n : - 2 7 . 0 3 % ( a s o f 4 Q 0 9 )
Line chart titled: NCREIF Unleveraged Returns on All Property Types (as of 2Q10). Source: NCREIF This Line chart follows Total Return, Income Return,
and Capital Appreciation from the years 1977, 1982, 1988, 1993, 1999,2004, and 2010 called out on the timeline. The total return commences in 1977 around 2
and slightly rises and drops back and forth from close to 5 to back below 0 in the time period between 1977 through 1988. From 1988 until 1999
there is a sharp drop and the Total Return drops to below zero roughly around the years1989 through1993 while picking back up and is close to 5 in
1999 and sharply dropping to -10 in roughly 2009/ 2010 where it takes a V dive back up to roughly 4 in 2010. Income Return commences in 1997 at
roughly 3 and is steadily along the path of 3 throughout the time period of 1977 through 2010 without any spiking highs or lows. Capital Appreciation commences
in 1977 near 1 and spikes and drops through out the period of 1977 until 1990-1993 where it dips below zero and reaches a low of -7 in 1992 before climbing to 4 in1999 and fluctuates with high and lose before sharply dropping to -10 in roughly 2009/ 2010 where it takes a V dive back up to roughly 4 in 2010.
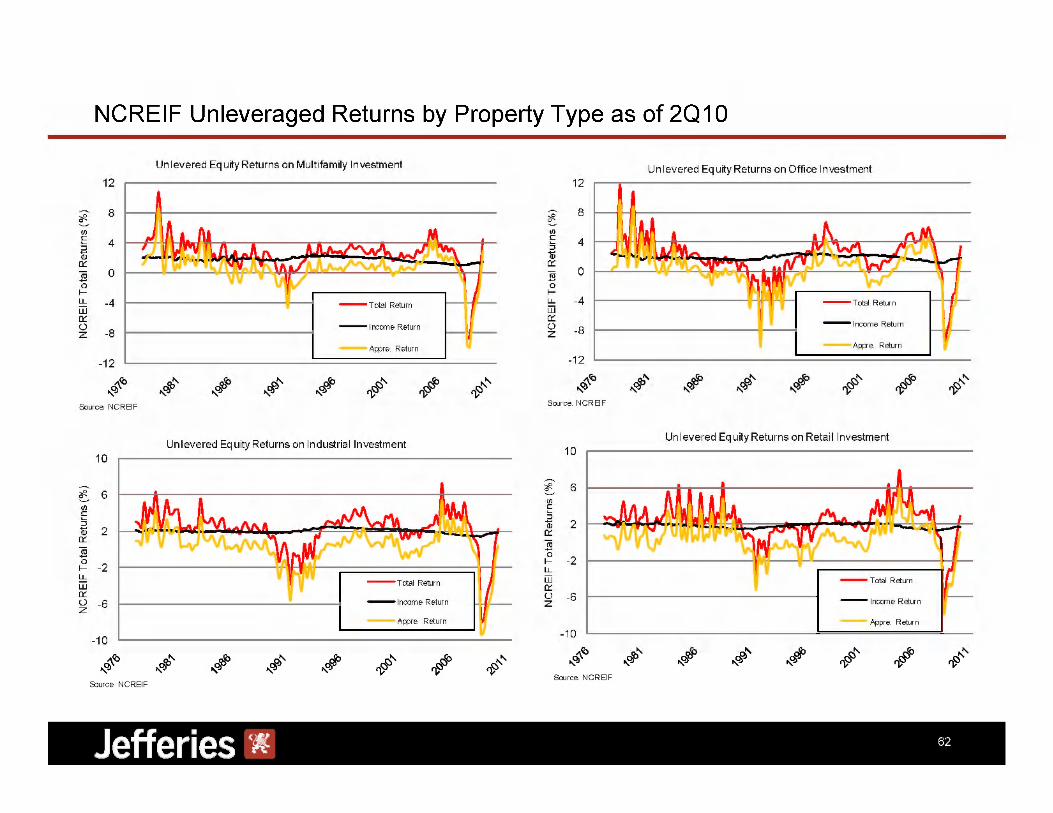
N C R E I F U n l e v e r a g e d R e t u r n s b y P r o p e r t y T y p e a s o f 2 Q 1 0 Line chart titled: NCREIF Unleveraged Returns on All Property Types (as of 2Q10). Source: NCREIF This Line chart follows Total Return, Income Return, and Capital Appreciation from the years 1977, 1982, 1988, 1993, 1999,2004, and 2010 called out on the time line. The total return commences in 1977 around 2 and slightly rises and drops back and forth from close to 5 to back below 0 in the time period between 1977 through 1988. From 1988 until 1999 there is a sharp drop and the Total Return drops to below zero roughly around the years1989 through 1993 while picking back up and is close to 5 in 1999 and sharply dropping to -10 in roughly 2009/ 2010 where it takes a V dive back up to roughly 4 in 2010. Income Return commences in 1997 at roughly 3 and is steadily along the path of 3 throughout the time period of 1977 through 2010 without any spiking highs or lows. Capital Appreciation commences in 1977 near 1 and spikes and drops through out the period of 1977 until 1990-1993 where it dips below zero and reaches a low of -7 in 1992 before climbing to 4 in1999 and fluctuates with high and lose before sharply dropping to -10 in roughly 2009/ 2010 where it takes a V dive back up to roughly 4 in 2010. There are 4 line charts on this page titled: Unlevered Equity Returns on Muiltifamily investment, unlevered equity returns on office investment,Unlevered equity returns on industrial investment and Unlevered equity returns on Retail investment. All 4 of these line charts track the years from 1976-2011, and feature Total Return, Income Return, and Appre. Return. Unlevered Equity Returns on Multi-family investment commences in 1976 with Income return staying a flat steady line from 3 with hardly any variation from 1976 until 2011. total return starts roughly near 4 and wildly spikes to 11 before dropping with a sharp series of peaks and valleys between 8 and 5 from the time period of 1981 until 2009 before ending at 5 in 2011. Appre. Return commences near 2 and wildly spikes to 9 before dropping with a sharp series of peaks and valleys between 4 and -5 in1991 before climbing above and maintaining around 0 through3 in 1991 through 2005 before climbing to 4 in 2006 and finally dropping in 2009 to -10 and rising in 2011 to just below 4. Unlevered equity returns on office investment commences in 1976 with Appre.Return starting on 0 and wildly peaking in roughly1980-1981 to 11 before a sharp series of peaks and valleys between 10 and -11 in 1981 through 1992 and edging its way from -11 up to zero in 1996 before climbing and slipping back around -3 in 2001 and rising to a high of 4 in 2006 before falling sharply in 2009back down to -9 and ending in 2011 at 3. Unlevered equity returns on Industrial Investment starts with Income Return commencing in 1976 and steadily staying around 2 to 3 throughout the time period from 1976 until 2011. Total Return commences in 1976 around 3 and steadily rises to 7 in 1981 before dropping and hitting a series of peaks and valleys between 1981 and 1990 which drops it down to -4 in 1992 and slowly climbs back above zero in 1996 at 2 before reaching a high of 7 in 2006, dropping to -11 in 2009 and returning upward to close in 2011 with 2. Appre. Return is at 1 in 1976, drops to -5 in 1991 enters a series of peaks and valleys between 1986 and 1996 in which it drops to -5 in 1992 and climbs to it's highest of 6 in 2006, before falling to -9 in 2009 and rising to 1 in 2011. Unlevered equity returns on retail investment commences with Income Return a steady 2 from 1976 until 2011, dipping at times to 1 before returning to 2. Total Return commences in 1976 at 3 climbs to 7 in1991 before falling to -5 in 1992 and climbs to it's highest again in 2006 at 8 before falling to -8 in 2009 and climbing again to end 2011 at 1.

N C R E I F U n l e v e r a g e d R e t u r n s b y P r o p e r t y T y p e a s o f 2 Q 1 0 Line chart titled: Unlevered Equity Returns on Hotel Investment. NCREIF Total Returns (%). 1980 until 2010. Source: NCREIF. This chart covers the years from 1980 until 2010. This chart covers the three areas of: Total Return, Income Return, and Appre. Return. In 1980 Income Return commences at 3 and steadily hovers around that area until the chart ends in 2010. Appre. Return commences in 1980 at 3 and drops to -7 in 1984and rises to 4 before dropping and hovering around -2 in roughly 1989. It rose to 4 in 1993 before dropping to -5 in 1995 and rising sharply in 1998 and 1999 to 10 before dropping to -7 in 2001 and rising slowly to 6 in 2007 before dropping sharply to -13 in 2009 before climbing to 3 in 2010.Total Return commences around roughly 3 rising to near 8 in 1984 and hovering around that mark before dropping in in 1995 to roughly -6 and climbing sharply to12 in both 1999 and 2000. It remained then around the 5-8 range from 2005-2008 until2009 when it dropped to -12 and rose to 3 in 2010.

O f f i c e P r o p e r t y M a r k e t S t a t i s t i c s header row National Office Market Fundamentals Source:CBRE Econometric Advisors *As of 2Q10. col1:Year:Col2:NRA (SFx1000): col3:Completions (SFx1000): col4:Vac Rate (%): col5:Net Absorption (SFX1000): col6: Gross Asking Rent ($/SF): col7:Net Asking Rent ($/SF)col 8: NCREIF TRR (%): col9:Cap.Rate (%): col10:CMBS Del.Rate (%)end header row Year:2000 NRA (SFx1000):3,049,909 Completions (SFx1000):91,106Vac Rate (%):8.60 Net Absorption (SFX1000):111,011 Gross Asking Rent ($/SF):24.10Net Asking Rent ($/SF):17.84 NCREIF TRR (%):13.42 Cap.Rate (%):8.30CMBS Del.Rate (%):0.35 Year:2001NRA (SFx1000):3,137,792 Completions (SFx1000):87,883 Vac Rate (%):14.20Net Absorption (SFX1000):-96,294Gross Asking Rent ($/SF):24.91 Net Asking Rent ($/SF):18.18 NCREIF TRR (%):6.08 Cap.Rate (%):8.76 CMBS Del.Rate (%):0.51 Year:2002NRA (SFx1000):3,210,048Completions (SFx1000):72,256Vac Rate (%):16.50Net Absorption (SFX1000):-12,831Gross Asking Rent ($/SF):23.15 Net Asking Rent ($/SF)16.78 NCREIF TRR (%):2.76 Cap.Rate (%):8.79CMBS Del.Rate (%):0.51Year:2003NRA (SFx1000):3,251,520 Completions (SFx1000):41,472Vac Rate (%):16.80Net Absorption (SFX1000):25,013 Gross Asking Rent ($/SF):22.19 Net Asking Rent ($/SF):16.00 NCREIF TRR (%):5.56Cap.Rate (%):8.22CMBS Del.Rate (%):1.79Year:2004NRA (SFx1000):3,284,03 Completions (SFx1000):32,514 Vac Rate (%):15.40 Net Absorption (SFX1000):72,948Gross Asking Rent ($/SF):22.03Net Asking Rent ($/SF)16.38 NCREIF TRR (%):18.19 Cap.Rate (%):6.49 CMBS Del.Rate (%):0.92 Year:2005 NRA (SFx1000):3,321,602 Completions (SFx1000):37,568Vac Rate (%):13.60 Net Absorption (SFX1000):89,871 Gross Asking Rent ($/SF):22.41Net Asking Rent ($/SF):16.38 NCREIF TRR (%):18.19 Cap.Rate (%):6.49CMBS Del.Rate (%):0.92 Year:2006 NRA (SFx1000):3,375,705 Completions (SFx1000):54,103 Vac Rate (%):12.60 Net Absorption (SFX1000):82,401 Gross Asking Rent ($/SF):23.79Net Asking Rent ($/SF):17.54NCREIF TRR (%):17.93 Cap.Rate (%):5.9CMBS Del.Rate (%):0.42 Year:2007 NRA (SFx1000):3,442,669 Completions (SFx1000):66,96 4 Vac Rate (%):12.50 Net Absorption (SFX1000):58,37 Gross Asking Rent ($/SF):26.3 Net Asking Rent ($/SF):19.01 NCREIF TRR (%):20.39 Cap.Rate (%):5.19 CMBS Del.Rate (%):0.23Year:2008NRA (SFx1000):3,521,876Completions (SFx1000):79,207 Vac Rate (%):14.00 Net Absorption (SFX1000):19,422 Gross Asking Rent ($/SF):25.79 Net Asking Rent ($/SF):19.61NCREIF TRR (%):-7.09 Cap.Rate (%):5.01 CMBS Del.Rate (%):0.79 Year:2009 NRA (SFx1000):3,572,692 Completions (SFx1000):50,816 Vac Rate (%):16.3 Net Absorption (SFX1000):-41,11 Gross Asking Rent ($/SF):23.9 Net Asking Rent ($/SF)18.8 NCREIF TRR (%):-20.5 Cap.Rate (%):6.7 CMBS Del.Rate (%):3.8 Year:2010* NRA (SFx1000):3,574,186 Completions (SFx1000):13,656Vac Rate (%):16.70Net Absorption (SFX1000):-496Gross Asking Rent ($/SF):23.80Net Asking Rent ($/SF)18.39NCREIF TRR (%):3.37Cap.Rate (%):7.01CMBS Del.Rate (%):6.38

R e t a i l P r o p e r t y M a r k e t S t a t i s t i c s header row National Retail Market Fundamental Shopping Center Supply Source:CBRE Econometric Advisors *As of 2Q10. col1:Year: Col2:Stock (SFx1000): col3:Completions (SFx1000):col4:Vac Rate (%): col5:Net Absorption (SFX1000):col6: Gross Asking Rent ($/SF):col7:Net Asking Rent ($/SF)col 8: NCREIF TRR (%):col9:Cap.Rate (%):col10:CMBS Del. Rate (%):end header row Year:2000 Stock (SFx1000):1,431,017 Completions (SFx1000):40,351 Vac Rate (%):6.88Net Absorption (SFX1000):50,996Gross Asking Rent ($/SF):naNet Asking Rent ($/SF)naNCREIF TRR (%):7.55Cap.Rate (%):8.39 CMBS Del.Rate (%):0.63 Year:2001Stock (SFx1000):1,463,693Completions (SFx1000):32,678Vac Rate (%):8.20Net Absorption (SFX1000):11,040Gross Asking Rent ($/SF):NA Net Asking Rent ($/SF):NA NCREIF TRR (%):6.58 Cap.Rate (%):8.7 CMBS Del.Rate (%):1.39Year:2002Stock (SFx1000):1,486,964 Completions (SFx1000):23,27 Vac Rate (%):8.45Net Absorption (SFX1000):17,621 Gross Asking Rent ($/SF):na Net Asking Rent ($/SF)n NCREIF TRR (%):13.10Cap.Rate (%):8.59CMBS Del.Rate (%):1.7 Year:2003 Stock (SFx1000):1,506,459 Completions (SFx1000):19,500 Vac Rate (%):8.37 Net Absorption (SFX1000):19,047 Gross Asking Rent ($/SF):naNet Asking Rent ($/SF):naNCREIF TRR (%):16.18Cap.Rate (%):8.12 CMBS Del.Rate (%):1.7 Year:2004Stock (SFx1000):1,527,806Completions (SFx1000):21,358Vac Rate (%):7.96Net Absorption (SFX1000):25,889 Gross Asking Rent ($/SF):13.14Net Asking Rent ($/SF):13.13NCREIF TRR (%):21.26 Cap.Rate (%):7.28 CMBS Del.Rate (%):0.99 Year:200 5Stock (SFx1000):1,554,063 Completions (SFx1000):26,263 Vac Rate (%):7.65 Net Absorption (SFX1000):28,983 Gross Asking Rent ($/SF):13.62Net Asking Rent ($/SF):14.59NCREIF TRR (%):18.65Cap.Rate (%):6.46CMBS Del.Rate (%):0.54 Year:2006 Stock (SFx1000):1,581,756 Completions (SFx1000):27,705 Vac Rate (%):7.83Net Absorption (SFX1000):22,683Gross Asking Rent ($/SF):14.55Net Asking Rent ($/SF):15.93NCREIF TRR (%):12.73 Cap.Rate (%):6.09 CMBS Del.Rate (%):0.2 Year:2007 Stock (SFx1000):1,613,084 Completions (SFx1000):31,326Vac Rate (%):8.79 Net Absorption (SFX1000):13,38 Gross Asking Rent ($/SF):16.75 Net Asking Rent ($/SF):16.60 NCREIF TRR (%):12.88 Cap.Rate (%):5.69CMBS Del.Rate (%):0.25 Year:200 Stock (SFx1000):1,640,29 Completions (SFx1000):27,218 Vac Rate (%):10.64 Net Absorption (SFX1000):-5,410Gross Asking Rent ($/SF):16.75Net Asking Rent ($/SF):16.60 NCREIF TRR (%):12.8 Cap.Rate (%):5.69 CMBS Del.Rate (%):0.25 Year:2009Stock (SFx1000):1,653,293Completions (SFx1000):13,003 Vac Rate (%):12.50Net Absorption (SFX1000):-19,181Gross Asking Rent ($/SF):15.67Net Asking Rent ($/SF):16.57NCREIF TRR (%):-11.40Cap.Rate (%):6.73 CMBS Del.Rate (%):5.17 Year:2010 (as of 2Q10) Stock (SFx1000):1,644,010 Completions (SFx1000):2,13 Vac Rate (%):13.1 Net Absorption (SFX1000):-344 9 Gross Asking Rent ($/SF):14.39 Net Asking Rent ($/SF):16.25 NCREIF TRR (%):2.81 Cap.Rate (%):6.73 CMBS Del.Rate (%):6.59
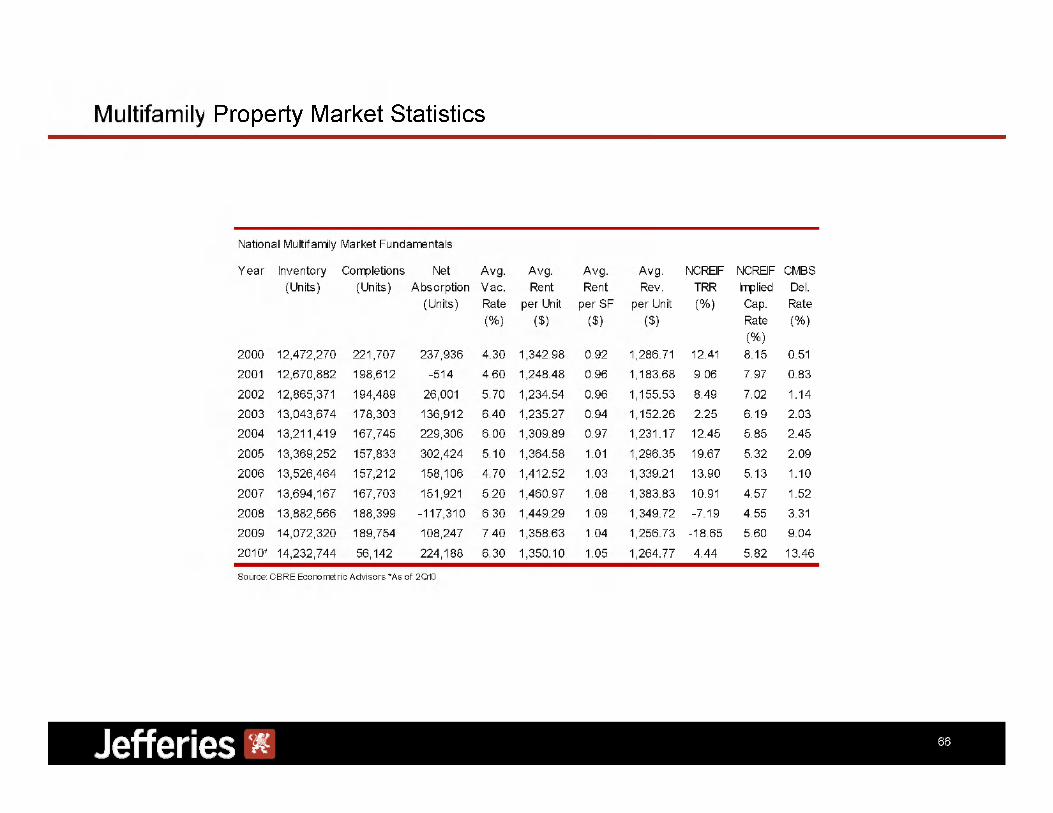
Multi-family P r o p e r t y M a r k e t S t a t i s t i c s header row National Multi-family Market Fundamentals col1:Year:Col2:Inventory (Units): col3:Completions (units): col 4:Net Absorptions (Units):col 5: Avg.Vac.Rate(%):col 6:Avg.Rent per Unit ($): col 7:Avg. Rent per SF ($): col 8:Avg. Rev. Per Unit ($):col 9: NCREIF TRR (%):col 10:NCREIF Implied Cap.Rate (%):col 11:CMBS Del. Rate (%):end header row Year:2000Inventory (Units):12,412,270Completions (units):221,707Net Absorptions (Units):237,936 Avg.Vac.Rate(%):4.30 Avg.Rent per Unit ($):1342.98Avg. Rent per SF ($):0.92Avg. Rev. Per Unit ($):1286.71NCREIF TRR (%):12.41 NCREIF Implied Cap.Rate (%):8.1CMBS Del. Rate (%):0.51Year:2001Inventory (Units):12,670,882Completions (units):198,612 Net Absorptions (Units):-514 Avg. Vac.Rate(%):4.60Avg.Rent per Unit ($):1248.48Avg. Rent per SF ($):0.96Avg. Rev. Per Unit ($):1183.68NCREIF TRR (%):9.06NCREIF Implied Cap.Rate (%):7.97CMBS Del. Rate (%):0.83 Year:2002Inventory (Units):12,865,371Completions (units):194,489Net Absorptions (Units):26,001Avg.Vac.Rate(%):5.70Avg.Rent per Unit ($):1234.54Avg. Rent per SF ($):0.96Avg. Rev. Per Unit ($):1155.53N CREIF TRR (%):8.49 NCREIF Implied Cap.Rate (%):7.02CMBS Del. Rate (%):1.14 Year:2003Inventory (Units):13,043,674Completions (units):178,303Net Absorptions (Units):136,912Avg.Vac.Rate(%):6.40Avg.Rent per Unit ($):1235.27 Avg. Rent per SF ($):0.94 Avg. Rev. Per Unit ($):1152.2 NCREIF TRR (%):6.1NCREIF Implied Cap.Rate (%):2.25CMBS Del. Rate (%):2.03Year:2004Inventory (Units):13,211,419 Completions (units):167745 Net Absorptions (Units):229306 Avg.Vac.Rate(%):6.00Avg.Rent per Unit ($):1309.89Avg. Rent per SF ($):0.97Avg. Rev. Per Unit ($):1231.17NCREIF TRR (%):12.45NCREIF Implied Cap.Rate (%):5.85CMBS Del. Rate (%):2.45Year:2005 Inventory (Units):13,369,252Completions (units):157,833Net Absorptions (Units):302,424Avg.Vac.Rate(%):5.10Avg. Rent per Unit ($):1364.58 Avg. Rent per SF ($):1.01 Avg. Rev. Per Unit ($):1296.35NCREIF TRR (%):19.67NCREIF Implied Cap.Rate (%):5.32CMBS Del. Rate (%):2.09Year:2006Inventory (Units):13,526,464Completions (units):157,212Net Absorptions (Units):158,106Avg.Vac.Rate(%):4.70Avg.Rent per Unit ($):1412.52 Avg. Rent per SF ($):1.0 Avg. Rev. Per Unit ($):1339.2 1 NCREIF TRR (%):13.90 NCREIF Implied Cap.Rate (%):5.13 CMBS Del. Rate (%):1.10Year:2007Inventory (Units):13,694,167Completions (units):167703Net Absorptions (Units):151,921Avg.Vac.Rate(%):5.20Avg.Rent per Unit ($):1460.97Avg. Rent per SF ($):1.08Avg. Rev. Per Unit ($):1383.83NCREIF TRR (%):10.91NCREIF Implied Cap.Rate (%):4.57CMBS Del. Rate (%):1.52Year:2008Inventory (Units):13,882,566 Completions (units):188.399 Net Absorptions (Units):-117,310 Avg.Vac.Rate(%):6.30Avg.Rent per Unit ($):1449.29Avg. Rent per SF ($):1.09Avg. Rev. Per Unit ($):1349.72NCREIF TRR (%):-7.19NCREIF Implied Cap.Rate (%):4.55CMBS Del. Rate (%):3.31Year:2009Inventory (Units):14072320 Completions (units):189,754 Net Absorptions (Units):108,247Avg.Vac.Rate(%):7.40Avg.Rent per Unit ($):1358.63Avg. Rent per SF ($):1.04 Avg. Rev. Per Unit ($):1256.73NCREIF TRR (%):-18.65NCREIF Implied Cap.Rate (%):5.60CMBS Del. Rate (%):9.04Year:2010 (as of 1Q10) Inventory (Units):14,232,744 Completions (units):56,142Net Absorptions (Units):224,188 Avg.Vac.Rate(%):6.30Avg.Rent per Unit ($):1350.10Avg. Rent per SF ($):1.05A vs. Rev. Per Unit ($):1264.77NCREIF TRR (%):4.44 NCREIF Implied Cap.Rate (%):5.82 CMBS Del. Rate (%):13.46
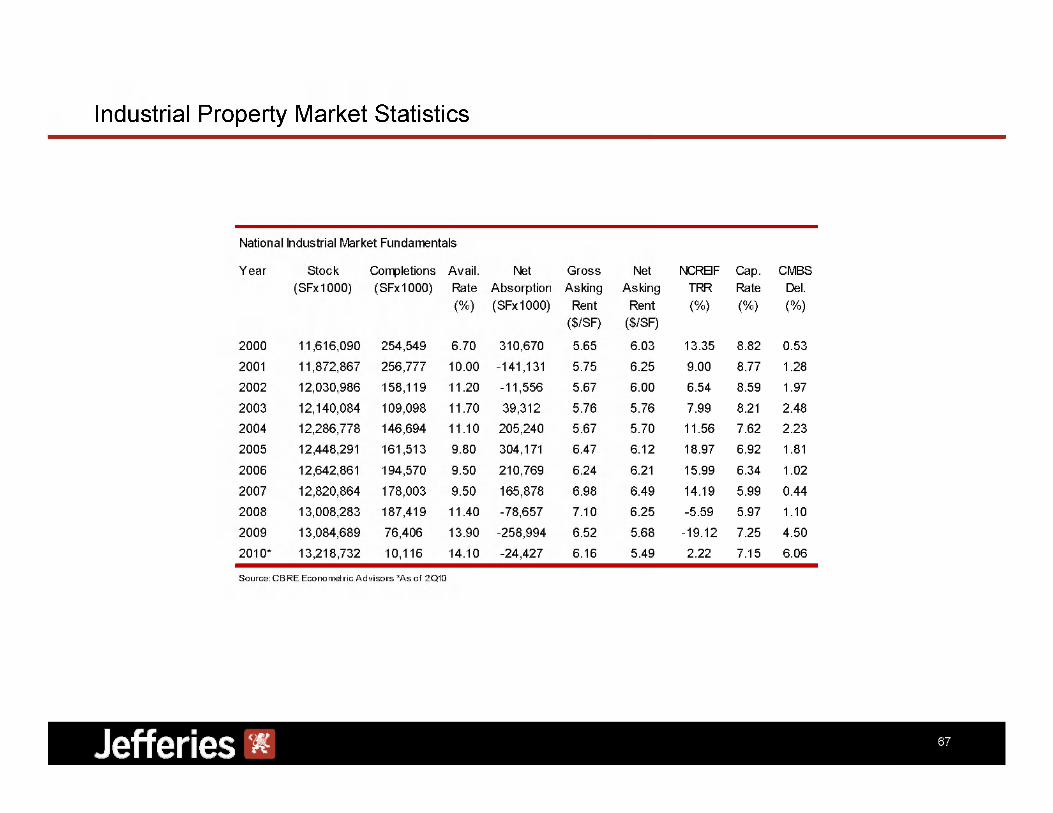
I n d u s t r i a l P r o p e r t y M a r k e t S t a t i s t i c s header row National Industrial Market Fundamentals col1:Year: Col2:Stock (SFx1000): col3:Completions (SFx1000):col5:Avail. Rate (%):col6:Net Absorption(SFx1000): col6:Gross Asking Rent ($/SF):col7:Net Asking Rent ($/SF):col 8:NCREIF TRR (%): col9:Cap.Rate (%): col10:CMBS Del.(%) end header row Year:2000Stock (SFx1000):11,616,090Completions (SFx1000):254,549Avail. Rate (%):6.70 Net Absorption(SFx1000):310,670 Gross Asking Rent ($/SF):5.65 Net Asking Rent ($/SF):6.03NCREIF TRR (%):13.35Cap.Rate (%):8.82 CMBS Del.(%):0.5 Year:2001Stock (SFx1000):11,872,867Completions (SFx1000):256,777 Avail. Rate (%):10.00 Net Absorption(SFx1000):-141,131 Gross Asking Rent ($/SF):5.75Net Asking Rent ($/SF):6.25NCREIF TRR (%):9.00 Cap.Rate (%):8.77CMBS Del.(%):1.28Year:2002Stock (SFx1000):12,030,986 Completions (SFx1000):158,119 Avail. Rate (%):11.20 Net Absorption(SFx1000):-11,556 Gross Asking Rent ($/SF):5.67 Net Asking Rent ($/SF):6.0 NCREIF TRR (%):6.54Cap.Rate (%):8.59 CMBS Del.(%):1.97 Year:2003 Stock (SFx1000):12,140,084 Completions (SFx1000):109,098 Avail. Rate (%):11.70Net Absorption(SFx1000): 39,312Gross Asking Rent ($/SF):5.76Net Asking Rent ($/SF):5.76NCREIF TRR (%):7.99Cap.Rate (%):8.21 CMBS Del.(%):2.48 Year:2004 Stock (SFx1000):12,286,778 Completions (SFx1000):146,694Avail. Rate (%):11.10Net Absorption(SFx1000):205,240 Gross Asking Rent ($/SF):5.67 Net Asking Rent ($/SF):5.70 NCREIF TRR (%):11.56 Cap.Rate (%):7.62CMBS Del.(%):2.23 Year:2005Stock (SFx1000):12,448,291Completions (SFx1000):161,513Avail. Rate (%):9.80Net Absorption(SFx1000):304,171 Gross Asking Rent ($/SF):6.47Net Asking Rent ($/SF):6.12NCREIF TRR (%):18.97 Cap.Rate (%):6.92 CMBS Del.(%):1.81 Year:2006Stock (SFx1000):12,642,861Completions (SFx1000):194,570Avail. Rate (%):9.50Net Absorption(SFx1000): 210,769Gross Asking Rent ($/SF):6.24 Net Asking Rent ($/SF):6.21 NCREIF TRR (%):15.99Cap.Rate (%):6.34 CMBS Del.(%):1.02 Year:2007 Stock (SFx1000):12,820,864Completions (SFx1000):178,003 Avail. Rate (%):9.50 Net Absorption(SFx1000):165,878 Gross Asking Rent ($/SF):6.98Net Asking Rent ($/SF):6.49NCREIF TRR (%):14.19Cap.Rate (%):5.99CMBS Del.(%):0.44Year:2008Stock (SFx1000):13,008,283Completions (SFx1000):187,419Avail. Rate (%):11.40Net Absorption(SFx1000):-78657 Gross Asking Rent ($/SF):7.10 Net Asking Rent ($/SF):6.2 NCREIF TRR (%):-5.59 Cap.Rate (%):5.97CMBS Del.(%):1.10Year:2009Stock (SFx1000):13,084,689Completions (SFx1000):76,406Avail. Rate (%):13.90Net Absorption(SFx1000):-258,994 Gross Asking Rent ($/SF):6.52Net Asking Rent ($/SF):5.68NCREIF TRR (%):-19.12Cap.Rate (%):7.25CMBS Del.(%):4.50Year:2010 (as of 2Q10)Stock (SFx1000):13,218,732 Completions (SFx1000):10,116 Avail. Rate (%):14.10 Net Absorption(SFx1000): -24,427Gross Asking Rent ($/SF):6.16Net Asking Rent ($/SF):5.49NCREIF TRR (%):2.22Cap.Rate (%):7.15 CMBS Del.(%):6.06
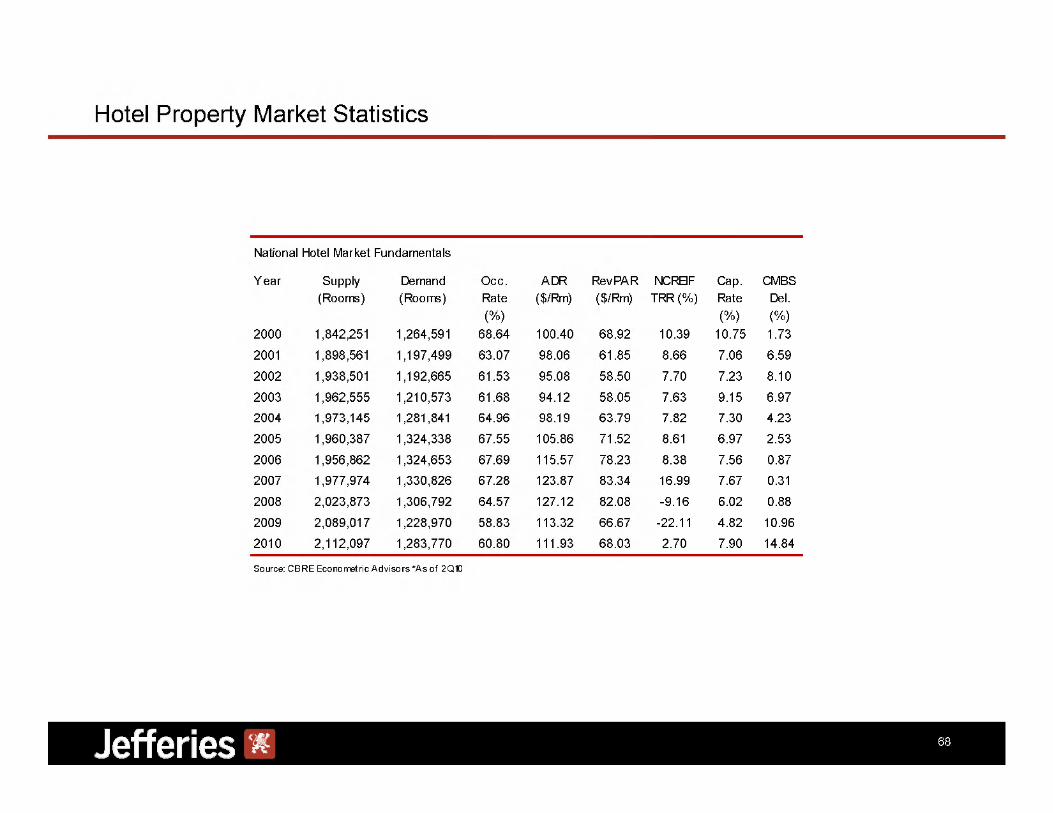
National Hotel Market Fundamentals header row col1:National Hotel Market Fundamentals Col2:Year, col3:Supply (Rooms) col4:Demand (Rooms), col5:Occ. Rate (%) col6:A DR ($/Rm), col7:Rev PAR($/Rm) col8:NCREIF TRR (%), col9: Cap. Rate (%) col10:CMBS Del.(%), end header row Year:2000:Supply:1,842,251,Demand:1,264,591 Occ.Rate:68.64:ADR:100.40: REVPAR:68.92:NCREIFTRR:10.39:CAP.RATE:10.75:CMBS:1.73 Year:2001:Supply:1,898,561:Demand:1,264,591 Occ.Rate:63.07:ADR:98.06:REVPAR:61.85:NCREIFTRR:8.66 CAP.RATE:7.06:CMBS:6.59 Year:2002:Supply:1,938,501:Demand:1,192,665 Occ.Rate:61.53:ADR:95.08: REVPAR:58.05 NCREIFTRR:7.70:CAP.RATE:7.23:CMBS:8.10 Year:2003:Supply:1,962,555: Demand:1,210,841 Occ.Rate:61.68:ADR:94.12:REVPAR:58.05: NCREIFTRR:7.63:CAP.RATE:9.15:CMBS:6.97 Year:2004:Supply:1,973,145:Demand:1,281,841 Occ. Rate:64.96:ADR:98.19:REVPAR:63.79: NCREIFTRR:7.82:CAP.RATE:7.30:CMBS:4.23 Year:2005:Supply:1,960,387:Demand:1,324,338 Occ.Rate:67.55:ADR:105.86: REVPAR:71.52: NCREIFTRR:8.61:CAP.RATE:6.97:CMBS:2.53 Year:2006:Supply:1,956,862:Demand:1,324,653 Occ.Rate:67.69:ADR:115.57:REVPAR:78.23 NCREIFTRR:8.38:CAP.RATE:7.56:CMBS:0.87 Year:2007:Supply:1,977,974:Demand:1,330,826 Occ.Rate:67.28:ADR:123.87:REVPAR:83.34 NCREIFTRR:16.99:CAP.RATE:7.67:CMBS:0.31 Year:2008:Supply:2,023,873:Demand:1,306,792 Occ.Rate:64.57:ADR:127.12:REVPAR:82.08 NCREIFTRR:-9.16:CAP.RATE:6.02:CMBS:0.88 Year:2009:Supply:2,089,017:Demand:1,228,770 Occ.Rate:58.83:ADR:113.32::REVPAR:66.67 NCREIFTRR:-22.11:CAP.RATE:4.82 CMBS:10.96 Year:2010:Supply:2,112,097:Demand:1,283,770 Occ.Rate:60.80:ADR:111.93:REVPAR:68.03 NCREIFTRR:2.70:CAP.RATE:7.90:CMBS:14.84 Source: CBRE Econometric Advisors *As of 2Q10

Relative Value in Cash and Synthetic CMBS

C u r r e n t C M B S S n a p s h o t Commercial/Multifamily Real Estate Related Spreads Price/Spreads to Swaps/LIBOR (BPs) Source:Jefferies &Co. Note: YE09 Figures are as of 12/24/09. header row Fixed Rate Spreadscol1:Fixed Rate CMBS: Col2:9/24/10: col3:YE09:col5:9/30/09:col6:6/30/09:col6:3/31/09:col7:YE08:col 8:09 Tights:col9:09 Wides:col10:09 Avg. Sprd.: col11:08 Avg. Sprd:end header row Fixed Rate CMBS:AAA-3YSS 9/24/10:180YE09:2759/30/09:2306/30/09:285 3/31/09:475 YE08:800 09 Tights:17509 Wides:77509 Avg. Sprd.:34708 Avg. Sprd:331Fixed Rate CMBS:AAA-5Y SS 9/24/10:245YE09:330 9/30/09:400 6/30/09:6003/31/09:1050YE08:125009 Tights:33009 Wides:135009 Avg. Sprd.:68308 Avg. Sprd:427 Fixed Rate CMBS:AAA-7YSS9/24/10:265 YE09:40 9/30/09:46 6/30/09:7003/31/09:110 YE08:135 09 Tights:40 09 Wides:140 09 Avg. Sprd.:75 08 Avg. Sprd:44 Fixed Rate CMBS:AAA-A-AB9/24/10:210 YE09:370 9/30/09:3806/30/09:4753/31/09:825YE08:102509 Tights:31009 Wides:1200 09 Avg. Sprd.:59 08 Avg. Sprd:37 Fixed Rate CMBS:AAA-10YSS9/24/10:290YE09:4259/30/09:440 6/30/09:5753/31/09:875 YE08:885 09 Tights:36009 Wides:112509 Avg. Sprd.:62808 Avg. Sprd:353Fixed Rate CMBS:AAA-10YMezz9/24/10:600 YE09:105 9/30/09:105 6/30/09:130 3/31/09:2200YE08:170009 Tights:950 09 Wides:2300 09 Avg. Sprd.:1410 08 Avg. Sprd:56 Fixed Rate CMBS:AAA-10Y JR9/24/10:1050YE09:13509/30/09:16006/30/09:19003/31/09:3500YE08:270009 Tights:1300 09 Wides:360 09 Avg. Sprd.:214 08 Avg. Sprd:848 Fixed Rate CMBS:A 9/24/10:290 YE09:27509/30/09:270 6/30/09:340 3/31/09:4550YE08:420009 Tights2450: 09 Wides:4800 09 Avg. Sprd.:3460 08 Avg. Sprd:1195Fixed Rate CMBS:A 9/24/10:400YE09:4050 9/30/09:4200 6/30/09:460 3/31/09:5800YE08:4400 09 Tights:37009 Wides:600009 Avg. Sprd.:4628 08 Avg. Sprd:141 Fixed Rate CMBS:BBB9/24/10:6500 YE09:645 9/30/09:590 6/30/09:620 3/31/09:1100 YE08:650009 Tights:5250 09 Wides:11000 09 Avg. Sprd.:723 08 Avg. Sprd:213 Fixed Rate CMBS:BBB-9/24/10:10200 YE09:7000 9/30/09:7600 6/30/09:85003/31/09:11000YE08:850009 Tights:635009 Wides:1200009 Avg. Sprd.:870608 Avg. Sprd:2505 Fixed Rate AAA CMBS Relationships:SS Vs Mezz 9/24/10:310 YE09:1050 9/30/09:1600 6/30/09:725 3/31/09:1300YE08:181509 Tights:none09 Wides:none09 Avg. Sprd.:none08 Avg. Sprd:213Fixed Rate AAA CMBS Relationships:Mezz vs Junior 9/24/10:450 YE09:1350 9/30/09:610 6/30/09:603/31/09:2625 YE08:81509 Tights:none09 Wides:none09 Avg. Sprd.:none08 Avg. Sprd:282Fixed Rate AAA CMBS Relationships:SS Vs Junior 9/24/10:760 YE09:6259/30/09:5506 /30/09:13253/31/09:1325 YE08:1000 09 Tights:none 09 Wides:none09 Avg. Sprd.:none08 Avg. Sprd:495Agency Related Commercial/Multifamily Securities:FNMA DUS 10/9.5 9/24/10:73 YE09:69/30/09:756/30/09:903/31/09:165YE08:28009 Tights:5009 Wides:28009 Avg. Sprd.:97 08 Avg. Sprd:138Agency Related Commercial/Multifamily Securities:FNMA DUS 7/6.5 9/24/10:62YE09:559/30/09:606/30/09:78 3/ 31/09:155 YE08:270 09 Tights:40 09 Wides:27009 Avg. Sprd.:8608 Avg. Sprd:125Agency Related Commercial/Multifamily Securities:GNMA Proj. 3.59/24/10:65YE09:759/30/09:826/30/09:1003/31/09:140YE08:19009 Tights:6509 Wides:22509 Avg. Sprd.:9208 Avg. Sprd:114Agency Related Commercial/Multifamily Securities:GNMA Proj 7.5:9/24/10:80YE09:809/30/09:936/30/09:1253/31/09:165YE08:195 09 Tights:80 09 Wides:25 09 Avg. Sprd.:111 08 Avg. Sprd:122 Agency Related Commercial/Multifamily Securities:GNMA Proj 10.5: 9/24/10:95 YE09:90 9/30/09:106/30/09:135 3/31/09:175YE08:200 09 Tights:90 09 Wides:27509 Avg. Sprd.:123 08 Avg. Sprd:130

C M B S R e l a t i v e V a l u e A n a l y s i s Table of CMBS One Year Historical Relative Value Analysis: Five Year Heat Map. Source: Jefferies (as of 9/24/10). col1:CMBS SS AAA 5Y Avg. Life Vs: Col2:Current Spread/Pick up/Give up (BPs): col3:Min.Spread/Pick up/Give up (BPs) : col4:Max. Spread/Pick up/Give up (BPs): col5:Avg. Spread/Pick up/Give up (BPs): col6:Z score: Col7:Heat Map: end header row CMBS SS AAA 5Y Avg. Life Vs:FNMA DUS 7/6.5 Current Spread/Pick up/Give up (BPs):183 Min.Spread/Pick up/Give up (BPs) :180 Max. Spread/Pick up/Give up (BPs):319Avg. Spread/Pick up/Give up (BPs):213 Z score:-0.94 Heat Map:Neutral to Rich -1.0 CMBS SS AAA 5Y Avg. Life Vs:GNMA Project Loan 3.5Y Current Spread/Pick up/Give up (BPs):180Min.Spread/Pick up/Give up (BPs) :180 Max. Spread/Pick up/Give up (BPs):295 Avg. Spread/Pick up/Give up (BPs):203 Z score:-0.95Heat Map:Neutral to Rich -1.0 CMBS SS AAA 5Y Avg. Life Vs:Auto 3Y Current Spread/Pick up/Give up (BPs):225 Min.Spread/Pick up/Give up (BPs) :215 Max. Spread/Pick up/Give up (BPs):330 Avg. Spread/Pick up/Give up (BPs):244 Z score:-0.80Heat Map:Neutral to Rich -1.0CMBS SS AAA 5Y Avg. Life Vs:Credit Cards 5Y Current Spread/Pick up/Give up (BPs):210 Min.Spread/Pick up/Give up (BPs) :205 Max. Spread/Pick up/Give up (BPs):300 Avg. Spread/Pick up/Give up (BPs):227 Z score:-0.88Heat Map:Neutral to Rich -1.0CMBS SS AAA 5Y Avg. Life Vs:FNMA 15YCC PT Current Spread/Pick up/Give up (BPs):240Min.Spread/Pick up/Give up (BPs) :240Max. Spread/Pick up/Give up (BPs):391 Avg. Spread/Pick up/Give up (BPs):287 Z score:-1.41 Heat Map:Neutral to Rich -1.0 CMBS SS AAA 5Y Avg. Life Vs:Swap 5YCurrent Spread/Pick up/Give up (BPs):221Min.Spread/Pick up/Give up (BPs) :220Max. Spread/Pick up/Give up (BPs):337 Avg. Spread/Pick up/Give up (BPs):246 Z score:-1.03 Heat Map:Neutral to Rich -1.0 CMBS SS AAA 5Y Avg. Life Vs:Industrial A5Y Current Spread/Pick up/Give up (BPs):156Min.Spread/Pick up/Give up (BPs) :155 Max. Spread/Pick up/Give up (BPs):277 Avg. Spread/Pick up/Give up (BPs):186 Z score:-1.09 Heat Map:Neutral to Rich -1.0 CMBS SS AAA 5Y Avg. Life Vs:Financial A5Y Current Spread/Pick up/Give up (BPs):38 Min.Spread/Pick up/Give up (BPs) :28Max. Spread/Pick up/Give up (BPs):169 Avg. Spread/Pick up/Give up (BPs):71 Z score:-0.84 Heat Map:Neutral to Rich -1.0 CMBS SS AAA 5Y Avg. Life Vs:REITsCurrent Spread/Pick up/Give up (BPs):46 Min.Spread/Pick up/Give up (BPs) :38 Max. Spread/Pick up/Give up (BPs):183Avg. Spread/Pick up/Give up (BPs):88Z score:-1.00Heat Map:Neutral to Rich -1.0

C M B S R e l a t i v e V a l u e A n a l y s i s Table of CMBS One Year Historical Relative Value Analysis: Ten Year Heat Map. Source: Jefferies (as of 9/24/10). col1:CMBS SS AAA 10Y Avg. Life Vs: Col2:Current Spread/Pick up/Give up (BPs): col3:Min.Spread/Pick up/Give up (BPs) : col4:Max. Spread/Pick up/Give up (BPs):col5:Avg. Spread/Pick up/Give up (BPs):col6:Z score :end header row CMBS SS AAA 10Y Avg. Life Vs:CMBS AM Current Spread/Pick up/Give up (BPs):(310) Min.Spread/Pick up/Give up (BPs) :(650) Max. Spread/Pick up/Give up (BPs):(215)Avg. Spread/Pick up/Give up (BPs):(443)Z score:1.22Ten Year Heat Map:Neutral to Cheap 1.0CMBS SS AAA 10Y Avg. Life Vs:CMBS AJ Current Spread/Pick up/Give up (BPs):(760) Min.Spread/Pick up/Give up (BPs) : (1240) Max. Spread/Pick up/Give up (BPs):(675)Avg. Spread/Pick up/Give up (BPs):(912) Z score:1.22Ten Year Heat Map:Neutral to Cheap 1.0 CMBS SS AAA 10Y Avg. Life Vs:CMBS AACurrent Spread/Pick up/Give up (BPs):(2610)Min.Spread/Pick up/Give up (BPs) :(2890)Max. Spread/Pick up/Give up (BPs):(2025)Avg. Spread/Pick up/Give up (BPs):(2595) Z score:-0.07 Ten Year Heat Map:NONECMBS SS AAA 10Y Avg. Life Vs:CMBS ACurrent Spread/Pick up/Give up (BPs):(3710)Min.Spread/Pick up/Give up (BPs) :(4310)Max. Spread/Pick up/Give up (BPs):(3275) Avg. Spread/Pick up/Give up (BPs):(3777) Z score:0.27 Ten Year Heat Map:Neutral to Cheap:0CMBS SS AAA 10Y Avg. Life Vs:CMBS BBBCurrent Spread/Pick up/Give up (BPs):(6210) Min.Spread/Pick up/Give up (BPs) :(8380)Max. Spread/Pick up/Give up (BPs):(4825) Avg. Spread/Pick up/Give up (BPs):(6854) Z score:0.94 Ten Year Heat Map:Neutral to Cheap:1.0 CMBS SS AAA 10Y Avg. Life Vs:CMBS BBB- Current Spread/Pick up/Give up (BPs):(9910)Min.Spread/Pick up/Give up (BPs) :(11605) Max. Spread/Pick up/Give up (BPs):(5975) Avg. Spread/Pick up/Give up (BPs):(10335) Z score:0.23Ten Year Heat Map:Neutral to Cheap:0CMBS SS AAA 10Y Avg. Life Vs:FNMA DUS 10/9.5Current Spread/Pick up/Give up (BPs):217Min.Spread/Pick up/Give up (BPs) :215 Max. Spread/Pick up/Give up (BPs):405 Avg. Spread/Pick up/Give up (BPs):269 Z score :-1.08Ten Year Heat Map:Neutral to Rich:-1.0CMBS SS AAA 10Y Avg. Life Vs:GNMA Project Loan 7.5YCurrent Spread/Pick up/Give up (BPs):210 Min.Spread/Pick up/Give up (BPs) :195 Max. Spread/Pick up/Give up (BPs):385 Avg. Spread/Pick up/Give up (BPs):256 Z score:-1.03 Ten Year Heat Map:Neutral to Rich:-1.0 CMBS SS AAA 10Y Avg. Life Vs:GNMA Project Loan 10.5Y Current Spread/Pick up/Give up (BPs):195Min.Spread/Pick up/Give up (BPs) :185 Max. Spread/Pick up/Give up (BPs):380 Avg. Spread/Pick up/Give up (BPs):246 Z score :-1.08Ten Year Heat Map:Neutral to Rich:-1.0 CMBS SS AAA 10Y Avg. Life Vs:FNMA 30Y CC PT Current Spread/Pick up/Give up (BPs):210 Min.Spread/Pick up/Give up (BPs) :202 Max. Spread/Pick up/Give up (BPs):412Avg. Spread/Pick up/Give up (BPs):272 Z score:-1. 22 Ten Year Heat Map:Neutral to Rich:-1.0 CMBS SS AAA 10Y Avg. Life Vs:Swap 10Y Current Spread/Pick up/Give up (BPs):287 Min.Spread/Pick up/Give up (BPs) :275Max. Spread/Pick up/Give up (BPs):461Avg. Spread/Pick up/Give up (BPs):334 Z score:-1.1 Ten Year Heat Map:Neutral to Rich:-1. 0 CMBS SS AAA 10Y Avg. Life Vs:Credit Cards 10Y Current Spread/Pick up/Give up (BPs):240 Min.Spread/Pick up/Give up (BPs) :225 Max. Spread/Pick up/Give up (BPs):385 Avg. Spread/Pick up/Give up (BPs):280 Z score:-1.05Ten Year Heat Map:Neutral to Rich:-1.0CMBS SS AAA 10Y Avg. Life Vs:Industrial A 10Y Current Spread/Pick up/Give up (BPs):185 Min.Spread/Pick up/Give up (BPs) :185 Max. Spread/Pick up/Give up (BPs):360 Avg. Spread/Pick up/Give up (BPs):234 Z score :-1.12Ten Year Heat Map:Neutral to Rich:-1.0 CMBS SS AAA 10Y Avg. Life Vs:Financial A 10Y Current Spread/Pick up/Give up (BPs):47 Min.Spread/Pick up/Give up (BPs) :41Max. Spread/Pick up/Give up (BPs):234 Avg. Spread/Pick up/Give up (BPs):100Z score:-0.97Ten Year Heat Map:Neutral to Rich:-1.0

C M B S C a s h a n d C M B X S p r e a d s R e m a i n s H i g h l y C o r r e l a t e d w i t h E q u i t y V o l a t i l i t y This page contains a line chart for the 10Y SS AAA CMBS/CMBX Vs. the VIX line chart.The Sources for this information is: Bloomberg, Markit Inc, and Jefferies and Co. The VIX start around 300 roughly 9/24/06 and steadily rises to a high of 2,000 roughly around 9.24.08 before steadily falling and dropping to near 20 in 9/24/10. The 10Y SS AAA begins near 0 in 9/24/06 and slowly rises to it's high of near roughly 1500 before slowly and steadily falling to 10 in 9/24/10. The CMBX AAA OTR starts around 0 in 9/24/10 and slowly rises to roughly around 2100 around 9/24/08 and slowly falls until it reaches a low of near 20 in 9/24/10.
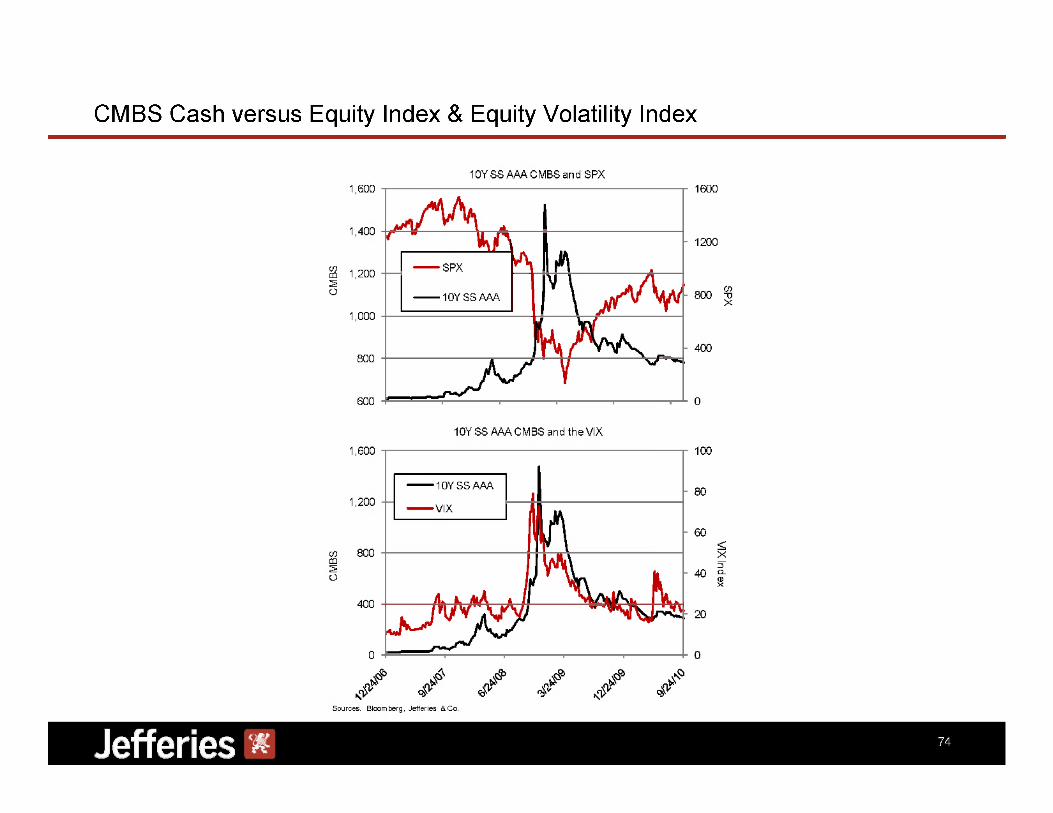
C M B S C a s h v e r s u s E q u i t y I n d e x & E q u i t y V o l a t i l i t y I n d e x This page contains two line charts. One titled 10Y SS AAA and CMBS and SPX and the other is titled 10YSS AA CMBS and the VIX. Source is Bloomberg, Jefferies and Co. CMBS Line chart 10Y SS AAA CMBS and SPX line chart. This chart documents the SPX and the 10Y SS AA. The CMBS ranges from 600 to 1600 and the SPX ranges from 0 to 1600. The SPX begins around roughly the 1390 mark and rises slowly before sharply dropping to roughly around 700 before peaking again at 1300 and ending around roughly 900. The 10Y SS AAA begins around roughly 600 and slowly climbs until it peaks at roughly 1500 and then drops sharply until it ends at roughly below 40 The 10Y SS AAA CMBS and the VIX documents the period between 12/24/06, 9/24/07,6/24/08, 3/24/09,12/24/09, and 9/24/10. The CMBS index is measured from 0 to 1600 and the VIX Index is from 0 to 100. The VIX rises from around roughly 100 and steadily rises to above 1300 before falling sharply to near 20. The 10Y SS AAA starts at near 0 in 12/24/06 and rises steadily to roughly around 1500 in the period near 3/24/09 before sharply dropping to around 20 also.

Handicapping the CMBX Indices
C r e d i t Q u a l i t y / C r e d i t E n h a n c e m e n t V a r i e s b y S e r i e s C M B X . 1 : 2 n d H i g h e s t c r e d i t e n h a n c e m e n t & l e s s a g g r e s s i v e u n d e r w r i t i n g C M B X . 2 a n d C M B X . 3 : H i s t o r i c a l l y l o w c r e d i t e n h a n c e m e n t a n d m o s t a g g r e s s i v e u n d e r w r i t i n g C M B X . 4 : I m p r o v i n g c r e d i t e n h a n c e m e n t ,
b u t a g g r e s s i v e u n d e r w r i t i n g C M B X . 5 : R a t i n g A g e n c i e s ' F i n d S o m e ' r e l i g i o n H i g h e s t C E M o r e s c r u t i n y o n a s s e t s S t i l l a g g r e s s i v e U W Table of CMBX Summary Statistics by Series Sources:Fitch, S&P, Moody's, Commercial Real Estate Direct.
(Note: Stressed Rating Agency LTV and DSCR) header row CMBX Summary Statistics by Series col1:Series:Col2:Avg.Deal Size ($B): col3:Total Series Size ($B): col4:$ of Loans: col5:Avg.Loan Size ($MM):col6:Largest Loan (%):col 7:UV LTV:col 8:Stress
LTV (%)*Note:Stressed Rating Agency LTV and DSCR. col9:UW DSCR: col 10:Stress DSCR * Note:Stressed Rating Agency LTV and DSCR.col 11:IG Loan (%): col 12:Prai-Passu: col 13:B Note:col 14:Sub Debt (%):col 15:IO Initial (%): col 16:IO Term (%):
col 17:Mdy's Prop.Score: col 18:CE (%) AJ col 19: CE (%) BBB-col 20:Deliq Rate **Note:Note:Stressed Rating Agency LTV and DSCR. col 21:Watchlisted Loans (%): end header row Series:CMBX.5 Avg.Deal Size($B):2.09 Total Series Size($B):52.27
$ of Loans:3,542 Avg.Loan Size($MM):15.2 Largest Loan(%):11.1 UV LTV:67.6Stress LTV(%):109.0 UW DSCR:1.36 Stress DSCR:1.24 IG Loan(%):5.6Prai-Passu:15.5 B Note:8.6 Sub Debt(%):52.4 IO Initial(%):41.3 IO Term(%):41.7
Mdy's Prop.Score:1.8 CE(%)AJ:12.70CE(%)BBB-:3.68 Deliq Rate: 1.56 Watchlisted Loans(%):14.88 Series:CMBX.4 Avg.Deal Size($B):3.34 Total Series Size($B):83.6 $ of Loans:5,240 Avg.Loan Size($MM):17.4 Largest Loan(%):10
UV LTV:70.1 Stress LTV(%):114.9 UW DSCR:1.37 Stress DSCR:1.28 IG Loan(%):4.8 Prai-Passu:13.5 B Note:9.5 Sub Debt(%):55.7 IO Initial(%):30.8 IO Term(%):56.0Mdy's Prop.Score:1.6CE(%)AJ:12.32CE(%)BBB-:3.36 Deliq Rate:3.13
Watchlisted Loans(%):13.28Series:CMBX.3Avg.Deal Size($B):3.4Total Series Size($B):85.03 $ of Loans:5,293 Avg.Loan Size($MM):16.2 Largest Loan(%):8.9 UV LTV:68.3Stress LTV(%):104.3 UW DSCR:1.45 Stress DSCR:1.4 IG Loan(%):11.0
Prai-Passu:8.9 B Note:5.2Sub Debt(%):45.4IO Initial(%):31.2 IO Term(%):50.3 Mdy's Prop.Score:1.7 CE(%)AJ:11.42 CE(%)BBB-:2.77 Deliq Rate: 3.00Watchlisted Loans(%):22.03 Series:CMBX.2Avg.Deal Size($B):2.47 Total Series Size($B):61.82
$ of Loans:4,513 Avg.Loan Size($MM):14.6 Largest Loan(%):9.7UV LTV:68.6Stress LTV(%):101.2UW DSCR:1.43Stress DSCR:1.33IG Loan(%):9.4 Prai-Passu:7.2 B Note:0.0Sub Debt(%):43.1IO Initial(%):49.9 IO Term(%):24.1 Mdy's Prop.
Score:1.8 CE(%)AJ:12.22 CE(%)BBB-:3.16 Deliq Rate: 3.15 Watchlisted Loans(%):22.26 Series:CMBX.1 Avg.Deal Size($B):2.52 Total Series Size($B):63.11 $ of Loans:4,517 Avg.Loan Size($MM):14.6 Largest Loan(%):8.8 UV LTV:68.2
Stress LTV(%):98.3 UW DSCR:1.57 Stress DSCR:1.56 IG Loan(%):14.5 Prai-Passu:6.6 B Note:7.3 Sub Debt(%):44.8 IO Initial(%):43.1 IO Term(%):23.8 Mdy's Prop.Score:1.8 CE(%)AJ:12.50CE(%)BBB-:3.32 Deliq Rate:2.93 Watchlisted
Loans(%):20.42

C M B X H i s t o r i c a l P r i c i n g Table of CMBX Price Level and Statistics Sources: Markit Inc. header row CMBX Price Level & Statisticscol1:CMBX: Col2:Fixed Rate:col3:9/24/10:col4:9/17/10: col5:12/31/09: col6:12/31/08: end header row CMBX:NA.AAA.5Fixed Rate:35 9/24/10:92.69/17/10:92.25 12/31/09:84.1812/31/08:68.40CMBX:NA.AM5Fixed Rate:509/24/10:84.139/17/10:83.2912/31/09: NONE12/31/08:NoneCMBX:NA.AJ5 Fixed Rate:98 9/24/10:65.059/17/10:63.3212/31/09:56.2312/31/08:37.15 CMBX:AA.5 Fixed Rate:175 9/24/10:42.259/17/10:40.6412/31/09:34.0412/31/08:30.43CMBX:NA.BBB.5Fixed Rate:5009/24/10:19.189/17/10:18.96 12/31/09:18.10 12/31/08:22.89 CMBX:NA.BBB-.5Fixed Rate:5009/24/10:18.419/17/10:18.0512/31/09:16.3912/31/08:21.47CMBX:NA.AAA.4 Fixed Rate:35 9/24/10:92.349/17/10:91.88 12/31/09:82.9 12/31/08:69.92 CMBX:NA.AM4Fixed Rate:509/24/10:82.59 9/17/10:81.612/31/09:None12/31/08:NoneCMBX:NA.AJ.4Fixed Rate:969/24/10:61.009/17/10:59.43 12/31/09:51.2 3 12/31/08:37.96 CMBX:NA.AA.4Fixed Rate:165 9/24/10:39.07 9/17/10:37.5712/31/09:30.9612/31/08:32.08CMBX:NA.A.4Fixed Rate:3489/24/10:32.79 9/17/10:30.95 12/31/09:23.6612/31/08:31.68CMBX:NA.BBB.4Fixed Rate:5009/24/10:19.46 9/17/10:19.0712/31/09:17.17 12/31/08:24.05 CMBX:NA.BBB-4 Fixed Rate:50 9/24/10:18.86 9/17/10:18.4312/31/09:16.07 12/31/08:21.9 CMBX:NA.BB Fixed Rate:50 9/24/10:5.0 9/17/10:5.0 12/31/09:5.0 12/31/08:16.9 CMBX:NA.AAA. Fixed Rate: 9/24/10:93.14 9/17/10:92.9512/31/09:84.54 12/31/08:70.19 CMBX:NA.AM3Fixed Rate:509/24/10:85.369/17/10:84.82 12/31/09:None 12/31/08:None CMBX:NA.AJ3Fixed Rate:1479/24/10:66.889/17/10:64.0712/31/09:55.0912/31/08:42.41 CMBX:NA.AA.3 Fixed Rate:27 9/24/10:37.89 9/17/10:36.43 12/31/09:33.1612/31/08:28.09 CMBX:NA.A.3 Fixed Rate:629/24/10:29.279/17/10:26.7512/31/09:24.7512/31/08:25.79CMBX:NA.BBB.3 Fixed Rate:200 9/24/10:17.32 9/17/10:16.95 12/31/09:15.7812/31/08:20.21CMBX:NA.BBB-3Fixed Rate:3209/24/10:15.329/17/10:15.0012/31/09:14.3812/31/08:21.42 CMBX:NA.BB3Fixed Rate:500 9/24/10:5.00 9/17/10:5.0012/31/09:5.0012/31/08:17.65CMBX:NA.AAA.2Fixed Rate:79/24/10:94.299/17/10:94.2012/31/09:88.8912/31/08:79.82CMBX:NA.AM.2Fixed Rate:509/24/10:89.09 9/17/10:89.03 12/31/09:NONE 12/31/08:None CMBX:NA.AJ.2 Fixed Rate:1099/24/10:81.329/17/10:79.05 12/31/09:64.11 12/31/08:56.98CMBX:NA.AA.2 Fixed Rate:15 9/24/10:59.25 9/17/10:58.00 12/31/09:41.12 12/31/08:43.77 CMBX:NA.A.2Fixed Rate:259/24/10:47.559/17/10:46.6412/31/09:32.7812/31/08:40.51CMBX:NA.BBB.2 Fixed Rate:60 9/24/10:23.049/17/10:21.6412/31/09:19.82 12/31/08:31.32 CMBX:NA.BBB-2 Fixed Rate:879/24/10:18.02 9/17/10:17.34 12/31/09:15.9512/31/08:29.33 CMBX:NA.BB2 Fixed Rate:1809/24/10:5.009/17/10:5.0012/31/09:5.0012/31/08:12.53CMBX:NA.AAA.1 Fixed Rate:10 9/24/10:96.249/17/10:96.1112/31/09:92.5012/31/08:85.92 CMBX:NA.Am1 Fixed Rate:509/24/10:93.019/17/10:92.9412/31/09:None12/31/08:None CMBX:NA.AJ1 Fixed Rate:84 9/24/10:87.73 9/17/10:87.79 12/31/09:75.75 12/31/08:65.52CMBX:NA.AA.1Fixed Rate:259/24/10:75.579/17/10:73.7512/31/09:56.3812/31/08:51.45 CMBX:NA.A.1 Fixed Rate:35 9/24/10:59.73 9/17/10:57.57 12/31/09:46.19 12/31/08:45.66CMBX:NA.BBB.1 Fixed Rate:76 9/24/10:34.86 9/17/10:35.2312/31/09:30.2012/31/08:39.89 CMBX:BBB.-1Fixed Rate:1349/24/10:24.869/17/10:23.84 12/31/09:25.18 12/31/08:35.56

Markit TRX.NA Index
Markit launched Commercial Mortgage Total Return Swap Index on Sep. 10, 2009
Designed to provide investors an opportunity to gain exposure to CMBS through TRS contracts
Investors can replicate short or long positions on cash bonds independent of credit & prepayment risk
Attractive for Asset Managers, Hedge Funds, Prop Trading, Research & Strategy, Commercial Loan Originators, Correlation Trading Desks, Corporate Treasury Desks
TRX.NA index series is based on a standardized basket of 118 CMBS reference obligations underlying the CMBX.NA.AAA index series.
12 contributors to the daily pricing process

Important Disclosures
This material is provided for informational purposes only and is intended solely for your use. It may not be quoted, circulated or otherwise referred to without our express consent. This material is a product of Jefferies & Company, Inc. ("Jefferies") trading and sales desk personnel. This material is not a research report and the commentary contained herein may contain views that differ from the Jefferies Fixed Income Research Department. Jefferies may have accumulated a long or short position in the subject security or securities or in related financial instruments on the basis of this analysis prior to its dissemination. All prices, yields, estimates and opinions expressed are indicative only and are subject to change without notice. This material is based on sources that we believe to be reliable, but we do not represent that it is accurate or complete. Additional and supporting information is available upon request. Certain transactions or securities mentioned herein, including those involving future, options, and other derivatives products give rise to substantial risk and are not suitable for all investors. Jefferies transacts business with counterparties on an arm's length basis and on the basis that each counterparty is sophisticated and capable of independently evaluating the merits and risks of each transaction and that each counterparty is making an independent decision regarding any transaction. This information is not to be considered an offer to sell or solicitation of an offer to buy the securities or other products discussed herein. Jefferies may have a long or short position in the securities or in related financial instruments or other products discussed herein, and may make purchases from and/or sales to customers on a principal basis or as agent for another person. Jefferies also may have acted as an underwriter of such securities or other products, and may currently be providing investment banking services to the issuers of such securities products. Pursuant to this relationship, Jefferies may have provided in the past, and may provide in the future, financing, advice, and securitization and underwriting services to these clients in connection with which it has received or will receive compensation.