jeffrey l. chastain - jefferies · jeffrey l. chastain ... fleet strategy, growth into new market...
TRANSCRIPT

Jefferies 2015 Energy ConferenceNovember 12, 2015
Jeffrey L. ChastainVice President Investor Relations and Corporate Communications

2
Forward Looking Statement
This presentation contains “forward‐looking statements” about Noble’s business, financialperformance, contracts and prospects. Statements regarding contract backlog, costs,benefits, opportunities, financial performance, anticipated timing and cost of newbuildrigs, fleet strategy, growth into new market segments, bidding activity, rig demand,contract commencements, dayrates, impact of future regulations, contract duration, fleetcondition, capabilities or performance, industry fundamentals, shareholder value, timingor number of share repurchases, as well as any other statements that are not historicalfacts in this release, are forward‐looking statements that involve certain risks,uncertainties and assumptions. These include but are not limited to actions by regulatoryauthorities or other third parties, market conditions, financial results and performance,ability to repay debt and timing thereof, actions by customers and other third parties,factors affecting the level of activity in the oil and gas industry, supply and demand ofdrilling rigs, factors affecting the duration of contracts, the actual amount of downtime,factors that reduce applicable dayrates, violations of anti‐corruption laws, hurricanes andother weather conditions, delays, costs and difficulties related to the construction ofnewbuild rigs, the future price of oil and gas and other factors detailed in the Company’smost recent Form 10‐K, Form 10‐Q’s and other filings with the Securities and ExchangeCommission. Should one or more of these risks or uncertainties materialize, or shouldunderlying assumptions prove incorrect, actual results may vary materially from thoseindicated. The Company disclaims any duty to update the information presented here.

3
Best Positioned Offshore Driller
Premium Fleet
Strong Operations Execution
Solid Balance Sheet and Liquidity
Sustainable Cash Allocation Strategy
Managing Cyclical Weakness

Company Overview
9 Drillships 8 UDW, DP 8 added to fleet since 2011
4
8 Semisubmersibles 3 UDW, DP 5 conv. moored, UDW, DW
15 Jackups 6 added since 2012 3 added since 2007 1 under construction
Average Fleet Age – 11 years
Source: Noble as of November 2015
Current Status:Contracted: 9 6 14Idle: 0 1 1Stacked: 0 1 0

Source: Noble as of November 2015
Company OverviewGlobal Drilling Presence with Established Deep and Shallow Water Experience
5
Global Fleet CompositionCorporate Headquarters - UK
U.S. Operations
46
3
1
18
1
1 1
1 1
1
11
1

Company OverviewRevenues Diversified by Region and Rig Type
6Source: Noble as of September 30, 2015
Revenues by Rig Type
YTD September 30, 2015Total Revenues
$2.5 Billion
Revenues by Region

7
54%
31%
15%
1. Shell
2. Freeport-McMoRan
3. Saudi Aramco
4. Anadarko
Revenue Split by Customer
Top Customers
Source: Noble as of September 30, 2015
Company OverviewDiverse Base of Quality Customers
YTD September 30, 2015

Strong Operations Execution
8

Strong Operations ExecutionReduction in Fleet Downtime
9
10.5%
7.4%
3.9%4.4% 4.6%
3.0%
5.0%
7.0%
9.0%
11.0%
Percent of Total Downtime per Quarter

Strong Operations ExecutionSuccessful Cost Management Efforts
10
$139.4
$135.2
$121.3 $116.9
$106.7
$117.8
$100
$110
$120
$130
$140
$150
Drivers
Reduction in: Labor Costs Idle Rig Costs Operations Support
Costs Insurance Costs
$112.3 -
Contract Drilling Costs Per Available Day($ Thousands)

Strong Operations ExecutionMargin Preservation
11
52.4%
50.4%
58.7% 58.6% 58.9%
45.0%
50.0%
55.0%
60.0%
65.0%
Contract Drilling Margin per Quarter
(1)
(1) Adjusted for Noble Homer Ferrington arbitration award

Strong Operations Execution
12
Two Important Keys Driving Improved Operations Execution:
Noble NEXT Center
Long-Term Focus onSubsea Operations

Solid Balance Sheet and Liquidity
13

37%
40% 40% 40%
37% 37%
35%
36%
37%
38%
39%
40%
41%
14
($ Millions)
Solid Balance Sheet and Liquidity
Target Range 35% to 40%
Debt/Total CapitalizationManageable Debt Maturities

Solid Balance Sheet and Liquidity
15
$2.0
$1.8
$2.7
$2.9$2.8
$3.0
$1.5
$2.0
$2.5
$3.0
Liquidity Improvement Supported by Strong Operations
($ Billions)
Liquidity Components:Cash (@ 9/30/15) $165
5-year RCF $2,445(1)
1-year RCF $225(2)
(1) Matures January 2020(2) Matures January 2016

Sustainable Cash Allocation Strategy
16

Positive FCF and Sustainable Cash Allocation Strategy
Dividend
Share Repurchase
Debt Retirement
Premium Fleet Expansion
17

Managing Cyclical Weakness
18

19
Managing Cyclical WeaknessSolid Contract Visibility
• 8 rigs contracted into 2017 or later, including 3 rigs contracted beyond 2020
12/31/176/30/176/30/15 12/31/15 6/30/16 12/31/1612/31/14
Cold stacked
Idle
17 Floating Rigs
Source: Noble Corporation plc Fleet Status Report as of October 15, 2015
20
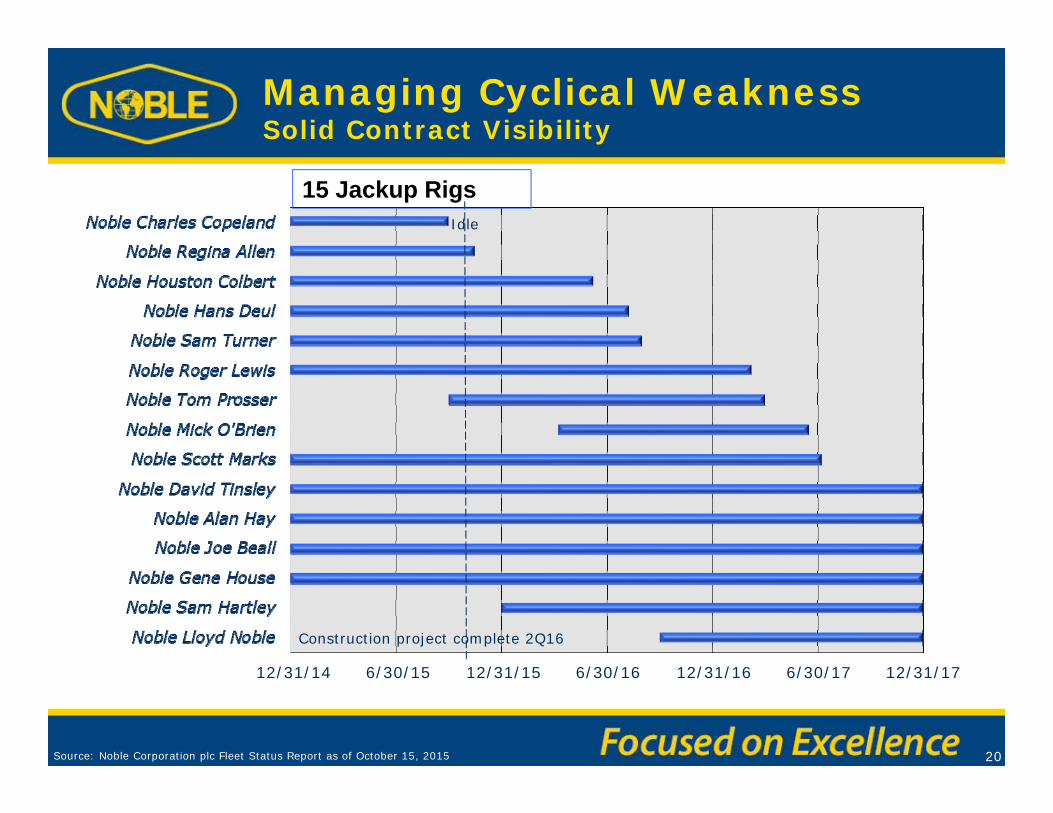
Managing Cyclical WeaknessSolid Contract Visibility
12/31/176/30/176/30/15 12/31/15 6/30/16 12/31/1612/31/14
Construction project complete 2Q16
15 Jackup Rigs
Source: Noble Corporation plc Fleet Status Report as of October 15, 2015
Idle

21
80% Committed
58% Committed
Jackup Rigs
2015
2016
74% Committed
76% Committed
Floating Rigs
2015
2016
Percentage of Available Operating Days
Source: Noble as of September 30, 2015
Managing Cyclical WeaknessSolid Contract Coverage
35% Committed
48% Committed
2017
2017

Managing Cyclical WeaknessBacklog Provides Excellent Visibility
22
$0.7
$2.5
$1.6
$1.0
$2.3
$0
$1
$2
$3
$4
20
15
20
16
20
17
20
18
20
19
-2
02
3
Shell60.4%
Freeport-McMoRan
11.2%
Saudi Aramco7.5%
Statoil7.9%
Anadarko3.7%
Other9.3%
Note: Backlog includes between 25-50% performance bonus realization on rigs with bonus provisions.
Estimated Annual Contribution Backlog by Client
Backlog at September 30, 2015: $8.1 Billion
Source: Noble

23
$2.1
$1.2
$2.1$1.9
$.450$.340
$0
$1
$2
$3
2011 2012 2013 2014 2015 2016
($ Billions)
3 3 22 4
Annual Capex(1)2011-2014 Avg. - $2.0 billion
(1) Totals prior to 2015 adjusted for spin-off of Paragon Offshore
Source: Noble
Managing Cyclical WeaknessDeclining Capex
(P)
$.585
3Q15 Guidance
Down $135mm
$.800
Newbuild CapexNoble Lloyd Noble
Delivery
(P)

Extending a 95-Year Legacy
Operational PerformanceFinancial DisciplinePosition for Advantage
24

Noble Corporation plcDevonshire House1 Mayfair PlaceLondon W1J 8AJEnglandwww.noblecorp.com
Investor contacts:Jeffrey L. Chastain Vice President Investor Relations281-276-6383
John S. BreedDirector Investor Relations281-276-6729
Enterprise Value (as of 11/9/15)Exchange ListingShares Outstanding (ex. Treasury Shares)52-Week Average Daily Trading Volume Debt Rating
$8.3hp billionNYSE: NE
241.9 million9.1 millionBBB/Baa3