jay chou - jackson school of geosciences project... · jay chou geo327g 5/5/2016 flooded venice...
TRANSCRIPT
Jay Chou
GEO327G
5/5/2016
Flooded Venice Project Write-up
The icepacks on Greenland and Antarctica contain 70% of all freshwater on Earth, and they are rapidly melting due to climate change. Scientists have calculated a sea level rise of 65 meters if all the ice on these two landmasses melted. This is bad news for the famously sinking Venice, Italy, which is situated right on the shore of the Adriatic Sea. Venice is sinking because the sediments that the city is built on are still settling and compacting. Satellite measurements reveal that Venice sinks at an average of 1-2 millimeters per year. It’s already sunk so much that lower-lying areas of Venice flood about 4 times a year during high tides. Rising water levels only compounds this problem for the city of canals, which has dozens of cultural landmarks and historic architecture that are in danger of being swallowed by the sea. Which areas are in the most immediate danger if the Greenland and Antarctica icepacks were to melt is a question that can be answered using GIS data.
In 2007, the Intergovernmental Panel on Climate Change (IPCC) forecasted a sea level rise of only
0.6 meters by the year 2100. By its own admission, however, the IPCC said that that forecast was a lowball
and ignores meltwater contributions from Greenland and Antarctica because scientists were so uncertain
of icepack behavior at the time. In 2013, they revised their forecast after further research to a 0.28- 0.98
meter rise in sea level by 2100. There are a few different models they used to come to this conclusion.
The main one was a physics-based model that took into account thermal expansion of water and the
melting rate of icepacks. Another model was based on a 2013 paper by Levermann that said for every
degree of global warming, sea level would rise by 2 meters. The Earth has warmed by 1-1.6 degrees F
since 1906, but the warming rate is increasing. A final model was semi-empirical in its approach and
involved extrapolating data on how sea level corresponds to temperature over the past few hundred
years. This model forecasted a sea level rise of 2 meters by 2100. Even combined with Venice’s sinking
rate of 2mm/year none of these forecasts put Venice in great danger (The lowest parts of Venice are 4
meters ASL). This wouldn’t be particularly interesting to map, so I next looked at the worst cases of
flooding Venice has ever experienced. The highest sea levels ever rose during a flood was 1.94 meters in
1966. This isn’t enough to submerge the city, but high water and strong winds can cause major flooding
in the lower areas of Venice. Despite the added impact of the sea level rise, this data wasn’t particularly
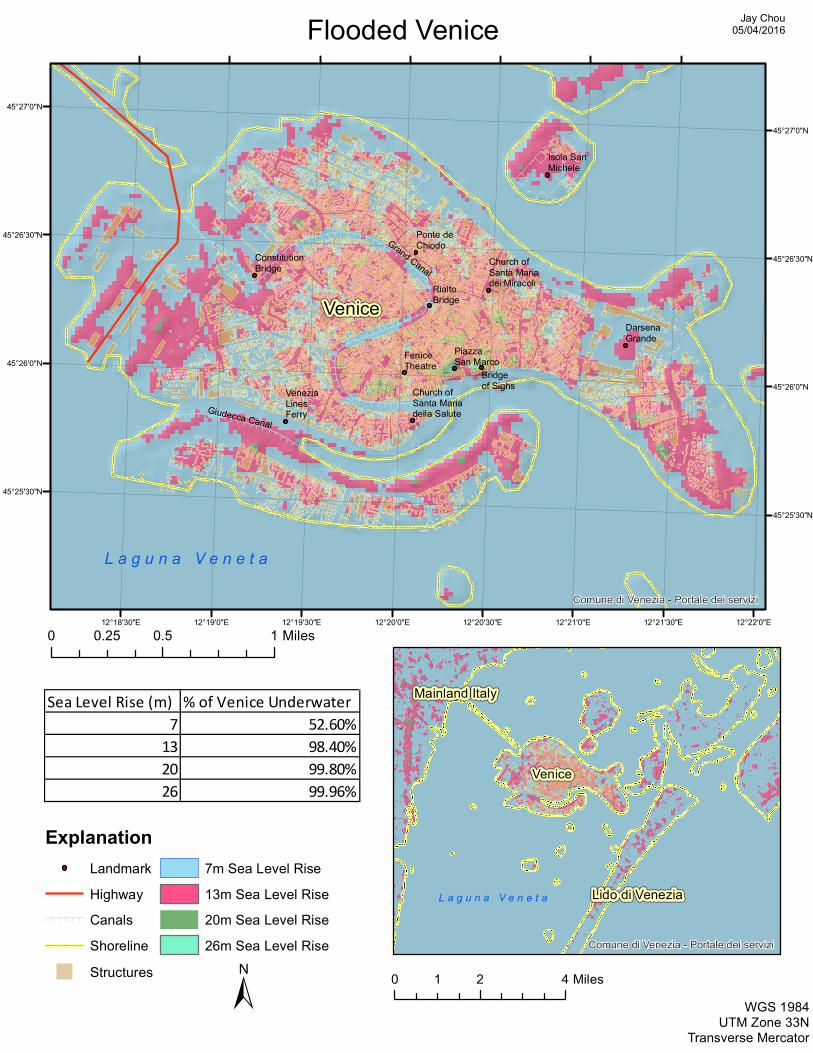
interesting to map either. So finally, I settled on mapping the worst-case scenario – if 10%, 20%, 30%, and
40% of the Greenland and Antarctica icepacks melted. These percentages of melt correspond to a 7 meter,
13 meter, 20 meter, and 26 meter rise in sea level. The highest point in Venice is 33 meters, so mapping
the effects of further melt beyond 40% is redundant.
Procedure
1. First I found and downloaded a 30-meter ASTER GDEM file of the Venetian lagoon from NASA
Reverb by using their interactive world map and drawing a rectangle around my study area. 30
meters isn’t the best resolution for this project of this detail (there are some anomalous elevation
readings, mostly concentrated in the canals), but it’s workable. There was a 10 meter DEM from
a recent Italian study, but I had to request permission to download that data and I never received
a response.

2. Next, I added the TIFF file downloaded from NASA reverb into ArcGIS and changed the projection
coordinate system to WGS 1984 UTM Zone 33N using the project raster tool. Figure 1 is a
screenshot of the projected raster.
3. I created a personal geodatabase in ArcCatalog for my Venice project.
4. The range of elevations in the original raster was too big for a stretched display (it was 0-1560m)
because I included too much of the mainland in the study area. I clipped the raster to include just
the lagoon so that the range of data became 0-33 meters by creating a feature class called
clipping_box in my geodatabase and then drawing a rectangular polygon using the editor toolbar.
Then, I changed the symbology of the raster from stretched black and white to elevation #1 for
better contrast and appearance. Figure 2 is an image of the clipped raster with elevation #1
symbology. I also created a hillshade using the hillshade tool.
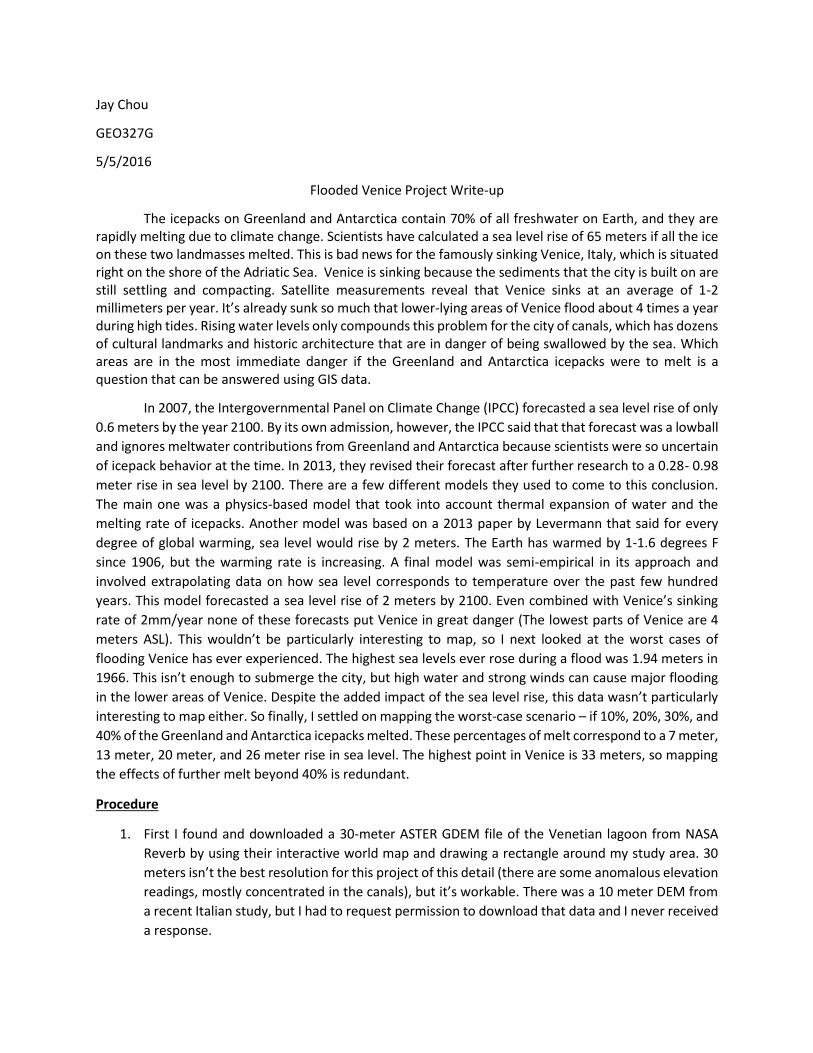
5. Next, I found some base maps that ArcGIS provided online that showed points of interest and a
map of structures in Venice and added them to my project. The points of interest base map
contained no data about what those points were, so I replaced them later with my own landmarks
feature class. Figure 3 shows Venice zoomed in with the two base maps.
6. Now it was time to show what areas would be affected by rising sea levels. I used the raster
calculator tool and created an expression that read con(“clp_venice” <= …) to create a new raster
for cells that had an elevation less than or equal to 7m, 13m, 20m, and 26m. This gave me 4 new
rasters that I symbolized and ordered so that each color showed the area that was in danger from
each category of sea level rise. Figure 4 is a picture of the results.
7. I then created a feature class for everything that I wanted to add into my project. I made one for
canals, highways, shorelines, and landmarks, and then used the editor toolbar to go in and draw
in each of these features by hand, using the GDEM and google maps as a guide. I also added the
names of every feature into their attribute tables so I could use the labeling tool to generate labels
for everything.
8. To quantify how much of Venice is underwater at each stage of sea level rise, I first had to find
Venice’s total area. I converted the shoreline feature class for Venice from a line feature into a
polygon using the feature to polygon tool under data management. This created a polygon for the
entirety of Venice. I then found the area of this polygon inside its attribute table by calculating
geometry. The total area is 9168396 square meters. Figure 5 is a picture of the area polygon with
labeled features.
9. Next, I used the extract by mask tool to extract only the cells of each of the sea level rise rasters
(7m, 13m, 20m, 26m) that were inside the Venice area polygon. These became new rasters with
their own attribute tables that display the number of cells covered by each stage of sea level rise.
10. Multiplying the cell count by 900 square meters (from the 30x30 resolution GDEM) gives me the
total area covered by each stage of sea level rise. Dividing these numbers by the total area of
Venice gives me the percentage of Venice that is underwater at each stage. I created a data table
in excel, then pasted the results onto my final product layout in ArcGIS.
Sea Level Rise (m) % of Venice Underwater
7 52.60%
13 98.40%
20 99.80%
26 99.96%

Figures
Figure 1. Projected ASTER GDEM Raster.

Figure 2. Clipped Raster with elevation #1 symbology.
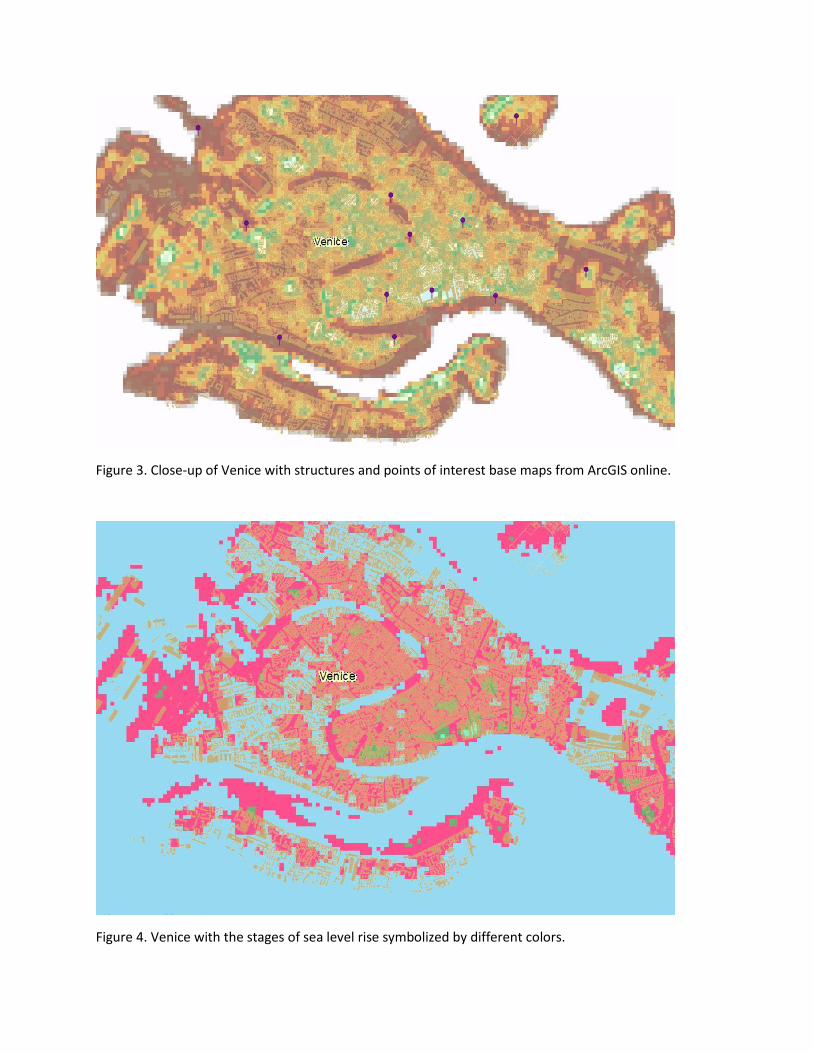
Figure 3. Close-up of Venice with structures and points of interest base maps from ArcGIS online.
Figure 4. Venice with the stages of sea level rise symbolized by different colors.
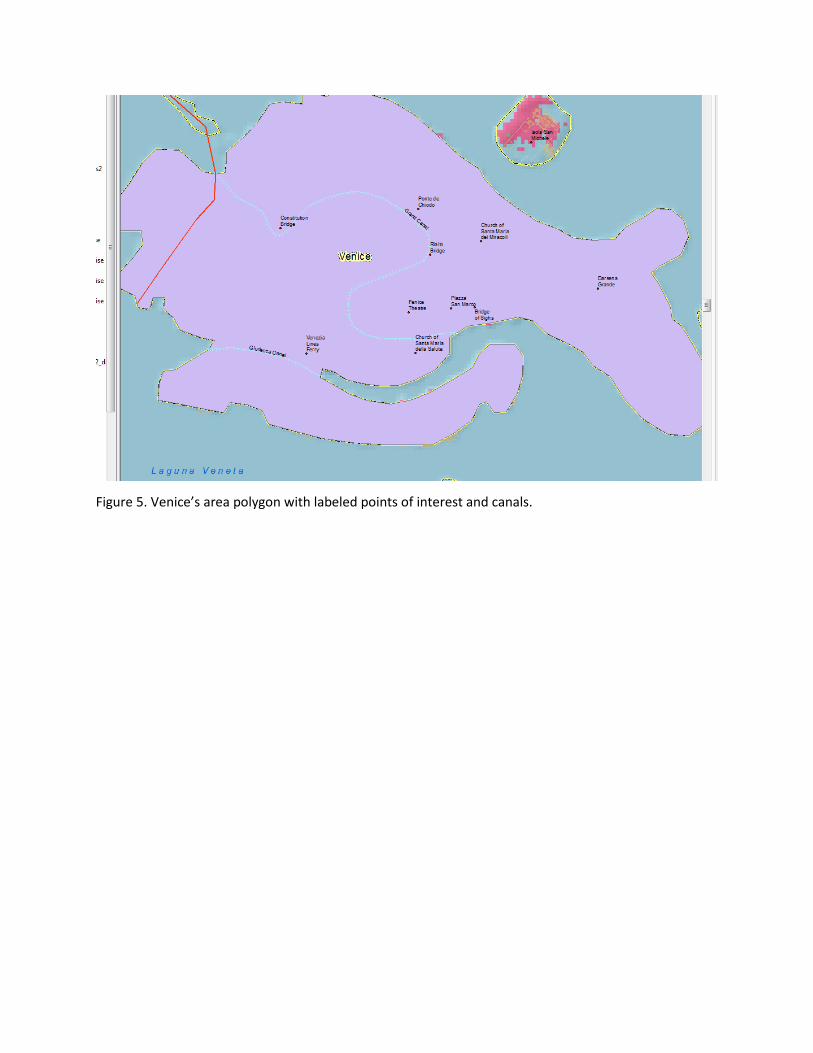
Figure 5. Venice’s area polygon with labeled points of interest and canals.
Venice
L a g u n a V e n e t a
VeneziaLinesFerry
Church ofSanta Mariadella Salute
FeniceTheatre
PiazzaSan Marco
Church ofSanta Mariadei MiracoliRialto
Bridge
DarsenaGrande
Isola SanMichele
Bridgeof Sighs
Ponte deChiodo
ConstitutionBridge
Giudecca Canal
Grand Canal
Comune di Venezia - Portale dei servizi12°21'30"E12°21'0"E12°20'30"E12°20'0"E12°19'30"E12°19'0"E12°18'30"E 12°22'0"E
45°27'0"N
45°27'0"N
45°26'30"N
45°26'30"N
45°26'0"N
45°26'0"N
45°25'30"N
45°25'30"N
ExplanationLandmarkHighwayCanalsShorelineStructures
7m Sea Level Rise13m Sea Level Rise20m Sea Level Rise26m Sea Level Rise
±
0 0.5 10.25 Miles
L a g u n a V e n e t a
Venice
Mainland Italy
Lido di Venezia
Comune di Venezia - Portale dei servizi
Flooded Venice
WGS 1984UTM Zone 33N
Transverse Mercator
Jay Chou05/04/2016
Sea Level Rise (m) % of Venice Underwater7 52.60%
13 98.40%20 99.80%26 99.96%
0 2 41 Miles