japanese equity quantitative strategy - nomura · japanese equity quantitative strategy akihiro...
TRANSCRIPT

Connecting Markets East & West
© Nomura
Global Quantitative Investment Strategies Conference
May, 2015
Japanese equity quantitative strategy
Akihiro MURAKAMI Chief Quantitative Strategist, JapanNomura Securities Co., Ltd+81 (0)3 6703 [email protected]
See Appendix A-1 for analyst certification,
important disclosures and the status of non-
US analysts.
Any authors named on this report are research
analysts unless otherwise indicated.
The shift to passive management in Japan and its market impacts
The expanding of “highly active funds” management such as "under-diversified fund" or "concentrated fund" and its problems
Importance of avoiding herding regardless whether quant or fundamental based active funds, when shifting to passive management
Topics
1
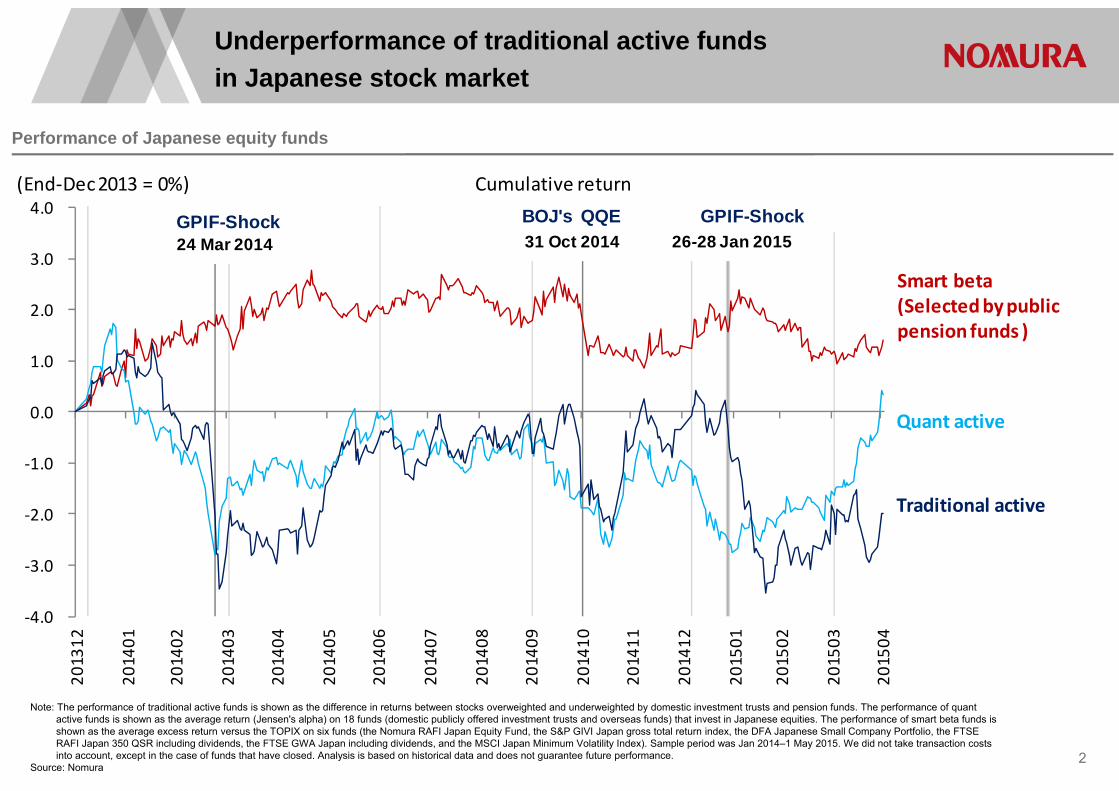
Performance of Japanese equity funds
Underperformance of traditional active funds in Japanese stock market
2
Note: The performance of traditional active funds is shown as the difference in returns between stocks overweighted and underweighted by domestic investment trusts and pension funds. The performance of quant active funds is shown as the average return (Jensen's alpha) on 18 funds (domestic publicly offered investment trusts and overseas funds) that invest in Japanese equities. The performance of smart beta funds is shown as the average excess return versus the TOPIX on six funds (the Nomura RAFI Japan Equity Fund, the S&P GIVI Japan gross total return index, the DFA Japanese Small Company Portfolio, the FTSE RAFI Japan 350 QSR including dividends, the FTSE GWA Japan including dividends, and the MSCI Japan Minimum Volatility Index). Sample period was Jan 2014–1 May 2015. We did not take transaction costs into account, except in the case of funds that have closed. Analysis is based on historical data and does not guarantee future performance.
Source: Nomura
‐4.0
‐3.0
‐2.0
‐1.0
0.0
1.0
2.0
3.0
4.0
201312
201401
201402
201403
201404
201405
201406
201407
201408
201409
201410
201411
201412
201501
201502
201503
201504
(End‐Dec 2013 = 0%) Cumulative return
Smart beta(Selectedby public pension funds )
Quant active
Traditional active
24 Mar 2014GPIF-Shock
31 Oct 2014 BOJ's QQE
26-28 Jan 2015 GPIF-Shock
1 2 3 4 5 6 7 8 9 10 11 12 13 14 15 16 17 18 19 20 21 22 23 24 25 26 27 28 29 30 31 32 33 34 35 36 37 38 39 40 41 42 43 44 45 46 47 48 49 50 51 52 53 54 55 56 57 58 59 60 61 62 63 64 65 66 67 68 69 70 71 72 73 74 75 76 77 78 79 80 81 82 83 84 85 86 87 88 89 90 91 92 93 94 95 96 97 98 99 ##
123456789
101112131415161718192021222324252627282930313233343536373839404142434445464748495051525354555657585960616263646566676869707172737475767778798081828384858687888990919293949596979899
100
JPX NK400 MSCI Japan R/N Prime
Traditional active investment
86.0% (17.9 trillion yen)
7.5% (1.5 trillion yen)
Smart beta 4.8% (1.0 trillion yen)
TOPIXIndexingStrategy
Passiveinvestments
Activeinvestments
0.7%(0.15 trn yen)
0.5%(0.1trn yen)
0.5%(0.1 trn yen)
Passive investments
21.2% (3.7 trillion yen)
78.8% (13.8 trillion yen)
(TOPIX)
Traditional active investment
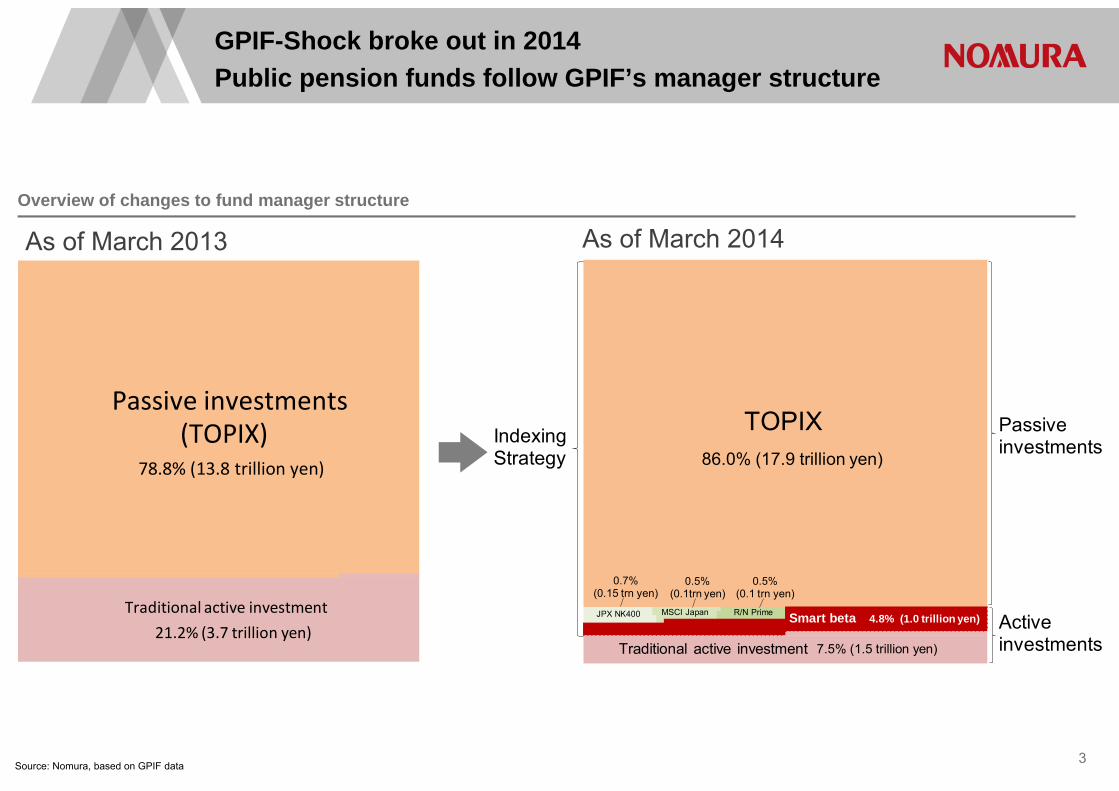
Overview of changes to fund manager structure
Source: Nomura, based on GPIF data 3
GPIF-Shock broke out in 2014Public pension funds follow GPIF’s manager structure
As of March 2013 As of March 2014
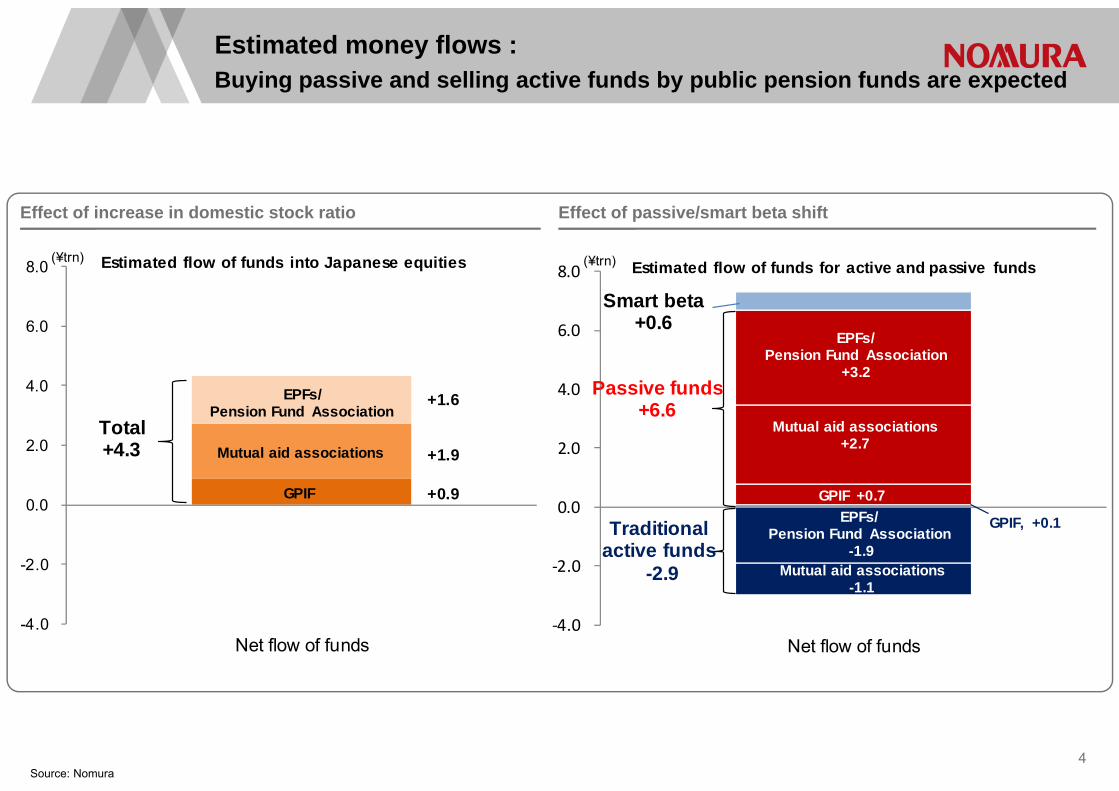
+0.9
+1.9
+1.6
-4.0
-2.0
0.0
2.0
4.0
6.0
8.0
Net flow of funds
Estimated flow of funds into Japanese equities
GPIF
Total+4.3
(¥trn)
EPFs/Pension Fund Association
Mutual aid associations
GPIF, +0.1
‐4.0
‐2.0
0.0
2.0
4.0
6.0
8.0
Net flow of funds
Estimated flow of funds for active and passive funds(¥trn)
Smart beta+0.6
Passive funds +6.6
Traditional active funds
-2.9
GPIF +0.7
Mutual aid associations+2.7
EPFs/Pension Fund Association
+3.2
EPFs/Pension Fund Association
-1.9Mutual aid associations
-1.1
Effect of increase in domestic stock ratio
Estimated money flows :Buying passive and selling active funds by public pension funds are expected
Source: Nomura4
Effect of passive/smart beta shift

0.0
0.5
1.0
1.5
2.0
2.5
3.0
3.5
4.0
4.5
5.0
5.5
6.0
6.5
7.0
7.5
2010
12
2011
03
2011
06
2011
09
2011
12
2012
03
2012
06
2012
09
2012
12
2013
03
2013
06
2013
09
2013
12
2014
03
2014
06
2014
09
2014
12
2015
03
2015
06
2015
09
2015
12 (yyymm)
Cumulative value of REITpurchased by BOJCumulative value of ETFpurchased by BOJ
14.Feb.2014 ETF+REIT ¥0.87trn
(¥trn)
4.Apr.2013Introduction of the QQE
ETF+REIT ¥1.61trn
31.Oct.2014Expansion of the QQEETF+REIT ¥3.42trn
(¥trn) Dec.2015(Est.)¥6.83trn
+¥2.5trn
Cumulative value of ETF/REIT purchased by BOJ
BOJ’s QQE also encourages money flows into passive funds
Note: Figures show cumulative value of ETF/REIT purchased by the Bank of Japan (BOJ) and cumulative return of TOPIX. Sample period was Dec 2010 through 1 May 2015. Estimated figures as of end-Dec 2015 is total of BOJ’s holding ETF/REIT as of 1 May 2015 and the rest of annual purchases.
Source: Nomura, based on the Bank of Japan 5
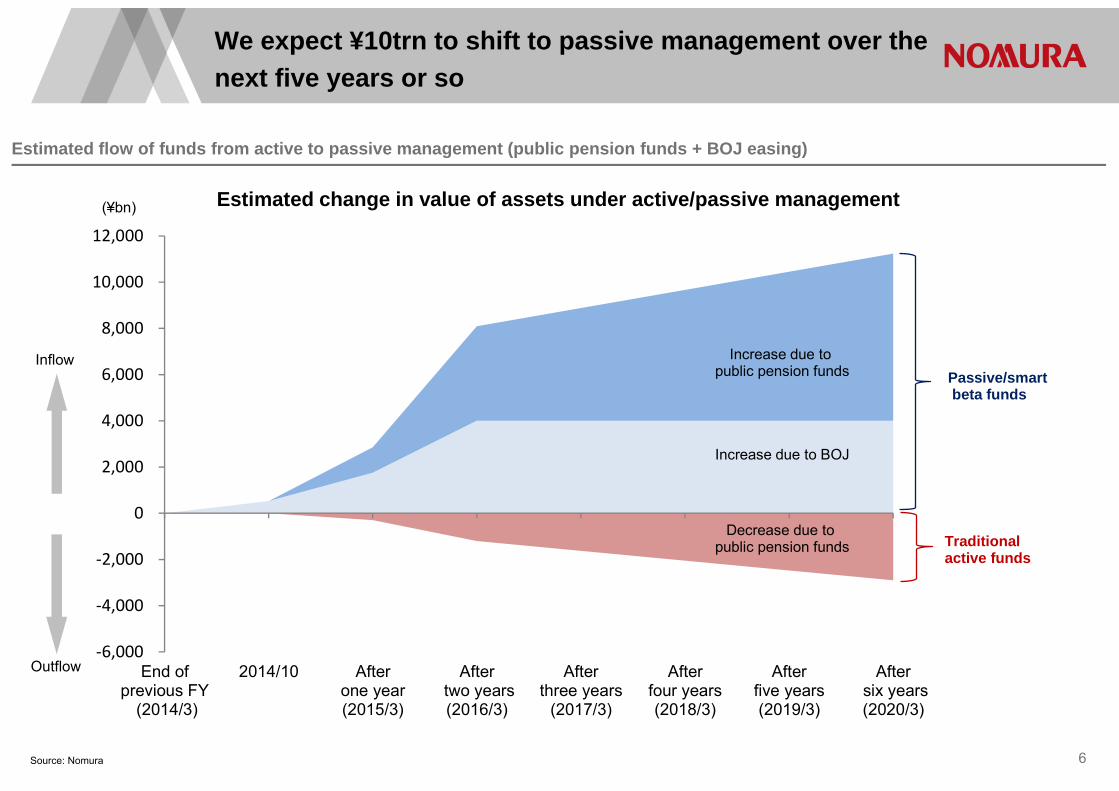
‐6,000
‐4,000
‐2,000
0
2,000
4,000
6,000
8,000
10,000
12,000
End ofprevious FY
(2014/3)
2014/10 Afterone year(2015/3)
After two years(2016/3)
Afterthree years
(2017/3)
Afterfour years(2018/3)
Afterfive years(2019/3)
After six years(2020/3)
Estimated change in value of assets under active/passive management(¥bn)
Inflow
Outflow
Increase due to BOJ
Increase due to public pension funds
Decrease due to public pension funds
Passive/smartbeta funds
Traditional active funds
Estimated flow of funds from active to passive management (public pension funds + BOJ easing)
We expect ¥10trn to shift to passive management over the next five years or so
Source: Nomura 6
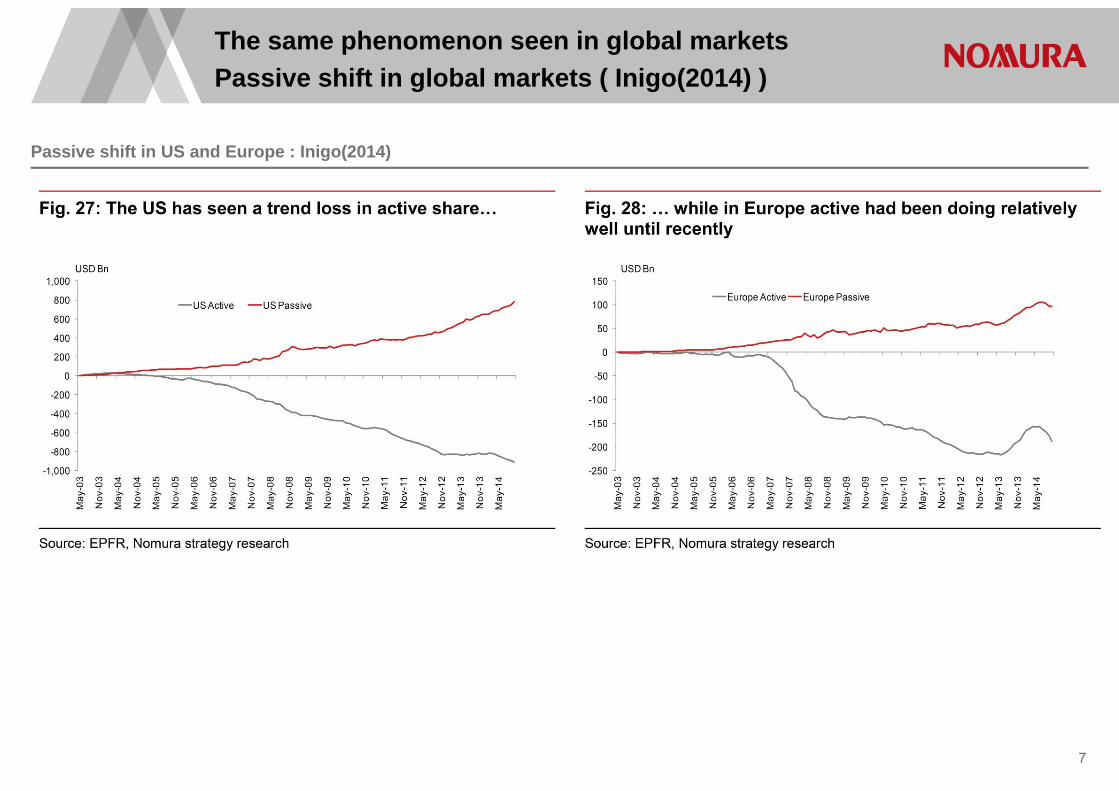
Passive shift in US and Europe : Inigo(2014)
The same phenomenon seen in global marketsPassive shift in global markets ( Inigo(2014) )
7
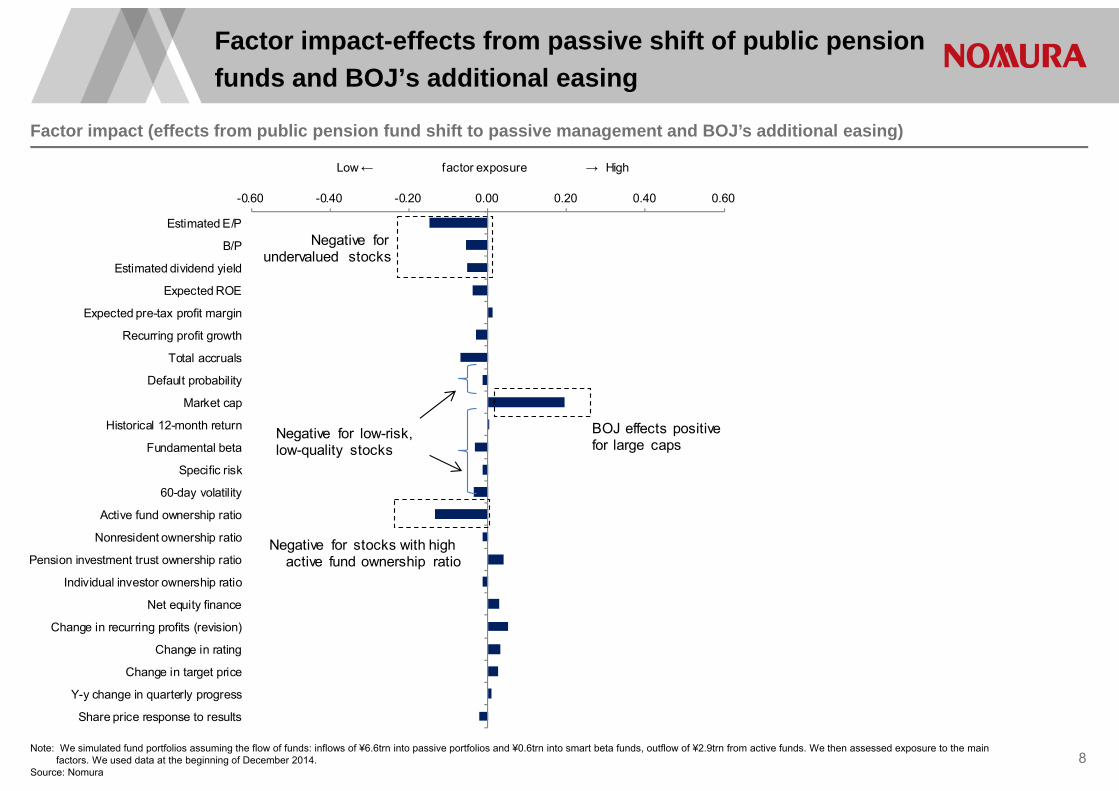
-0.60 -0.40 -0.20 0.00 0.20 0.40 0.60
Estimated E/P
B/P
Estimated dividend yield
Expected ROE
Expected pre-tax profit margin
Recurring profit growth
Total accruals
Default probability
Market cap
Historical 12-month return
Fundamental beta
Specific risk
60-day volatility
Active fund ownership ratio
Nonresident ownership ratio
Pension investment trust ownership ratio
Individual investor ownership ratio
Net equity finance
Change in recurring profits (revision)
Change in rating
Change in target price
Y-y change in quarterly progress
Share price response to results
Low← factor exposure → High
Negative for undervalued stocks
Negative for stocks with high active fund ownership ratio
Negative for low-risk, low-quality stocks
BOJ effects positive for large caps
Factor impact (effects from public pension fund shift to passive management and BOJ’s additional easing)
Factor impact-effects from passive shift of public pension funds and BOJ’s additional easing
Note: We simulated fund portfolios assuming the flow of funds: inflows of ¥6.6trn into passive portfolios and ¥0.6trn into smart beta funds, outflow of ¥2.9trn from active funds. We then assessed exposure to the main factors. We used data at the beginning of December 2014.
Source: Nomura8
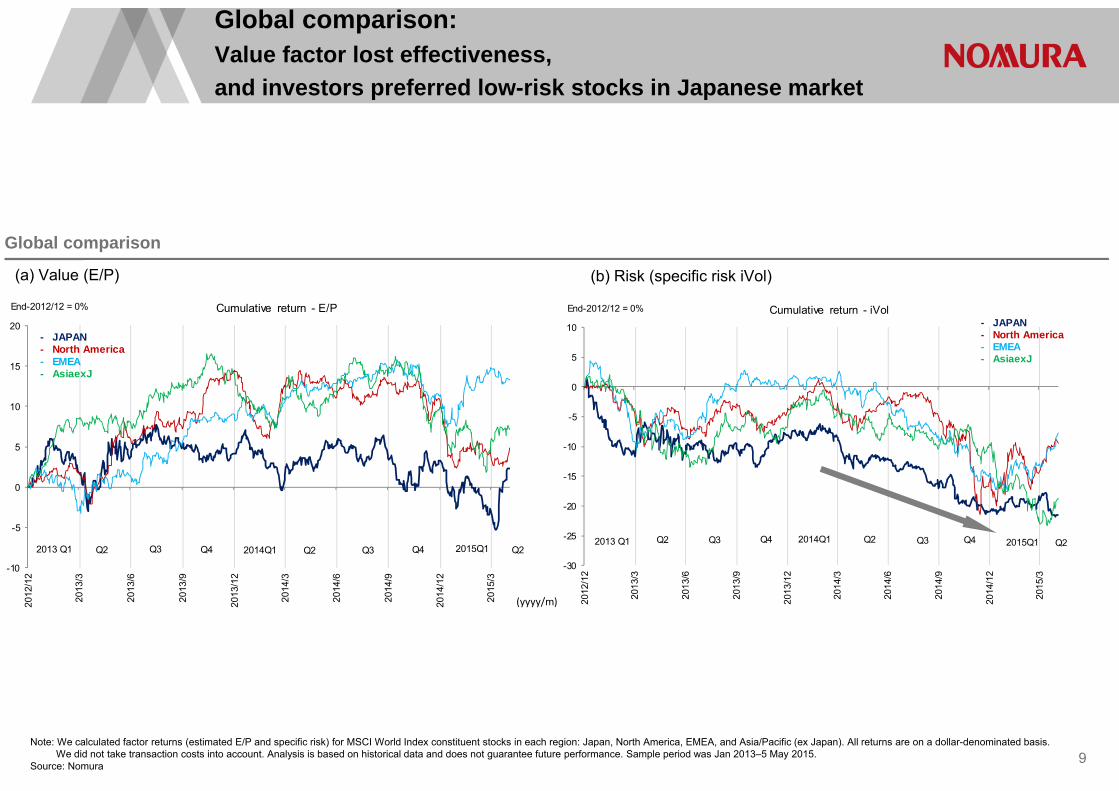
Global comparison:Value factor lost effectiveness,and investors preferred low-risk stocks in Japanese market
9
Global comparison
(a) Value (E/P) (b) Risk (specific risk iVol)
-10
-5
0
5
10
15
20
2012
/12
2013
/3
2013
/6
2013
/9
2013
/12
2014
/3
2014
/6
2014
/9
2014
/12
2015
/3
End-2012/12 = 0% Cumulative return - E/P
Q22013 Q1 Q3 Q4
(yyyy/m)
2014Q1 Q2
- JAPAN- North America- EMEA- AsiaexJ
Q3 Q4 2015Q1 Q2-30
-25
-20
-15
-10
-5
0
5
10
2012
/12
2013
/3
2013
/6
2013
/9
2013
/12
2014
/3
2014
/6
2014
/9
2014
/12
2015
/3
End-2012/12 = 0% Cumulative return - iVol
Q22013 Q1 Q3 Q4 2014Q1 Q2
- JAPAN- North America- EMEA- AsiaexJ
Q3 Q4 2015Q1 Q2
Note: We calculated factor returns (estimated E/P and specific risk) for MSCI World Index constituent stocks in each region: Japan, North America, EMEA, and Asia/Pacific (ex Japan). All returns are on a dollar-denominated basis. We did not take transaction costs into account. Analysis is based on historical data and does not guarantee future performance. Sample period was Jan 2013–5 May 2015.
Source: Nomura
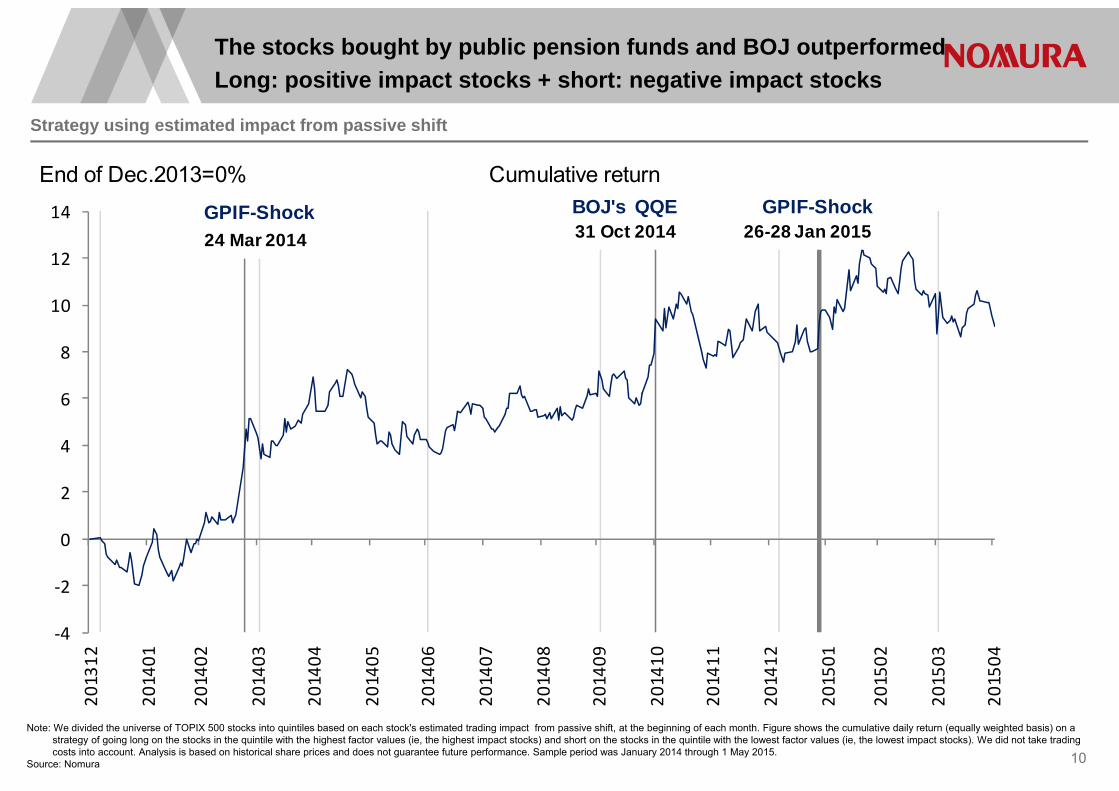
Strategy using estimated impact from passive shift
The stocks bought by public pension funds and BOJ outperformedLong: positive impact stocks + short: negative impact stocks
10
‐4
‐2
0
2
4
6
8
10
12
14
201312
201401
201402
201403
201404
201405
201406
201407
201408
201409
201410
201411
201412
201501
201502
201503
201504
End of Dec.2013=0% Cumulative return
24 Mar 2014GPIF-Shock
31 Oct 2014 BOJ's QQE
26-28 Jan 2015 GPIF-Shock
Note: We divided the universe of TOPIX 500 stocks into quintiles based on each stock's estimated trading impact from passive shift, at the beginning of each month. Figure shows the cumulative daily return (equally weighted basis) on a strategy of going long on the stocks in the quintile with the highest factor values (ie, the highest impact stocks) and short on the stocks in the quintile with the lowest factor values (ie, the lowest impact stocks). We did not take trading costs into account. Analysis is based on historical share prices and does not guarantee future performance. Sample period was January 2014 through 1 May 2015.
Source: Nomura
11
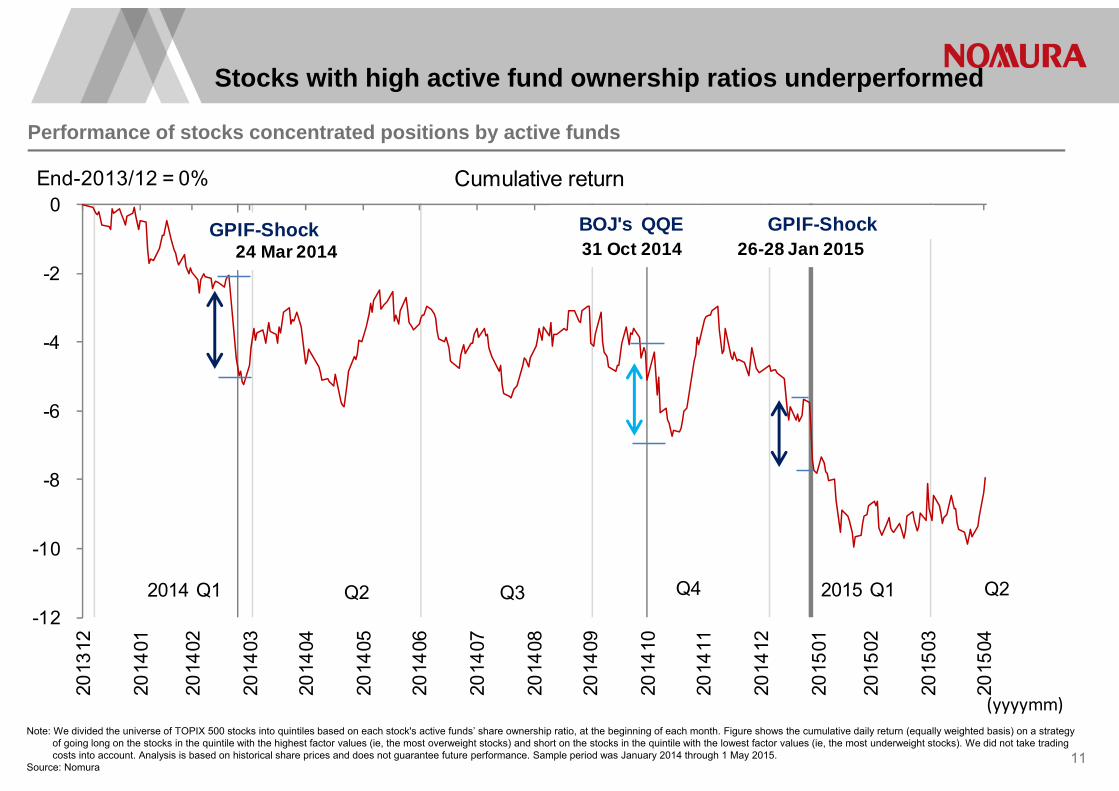
Performance of stocks concentrated positions by active funds
Note: We divided the universe of TOPIX 500 stocks into quintiles based on each stock's active funds’ share ownership ratio, at the beginning of each month. Figure shows the cumulative daily return (equally weighted basis) on a strategy of going long on the stocks in the quintile with the highest factor values (ie, the most overweight stocks) and short on the stocks in the quintile with the lowest factor values (ie, the most underweight stocks). We did not take trading costs into account. Analysis is based on historical share prices and does not guarantee future performance. Sample period was January 2014 through 1 May 2015.
Source: Nomura
Stocks with high active fund ownership ratios underperformed
-12
-10
-8
-6
-4
-2
0
2013
12
2014
01
2014
02
2014
03
2014
04
2014
05
2014
06
2014
07
2014
08
2014
09
2014
10
2014
11
2014
12
2015
01
2015
02
2015
03
2015
04
End-2013/12 = 0% Cumulative return
(yyyymm)
2014 Q1 Q2 Q3 Q4 2015 Q1 Q2
24 Mar 2014GPIF-Shock
31 Oct 2014 BOJ's QQE
26-28 Jan 2015 GPIF-Shock
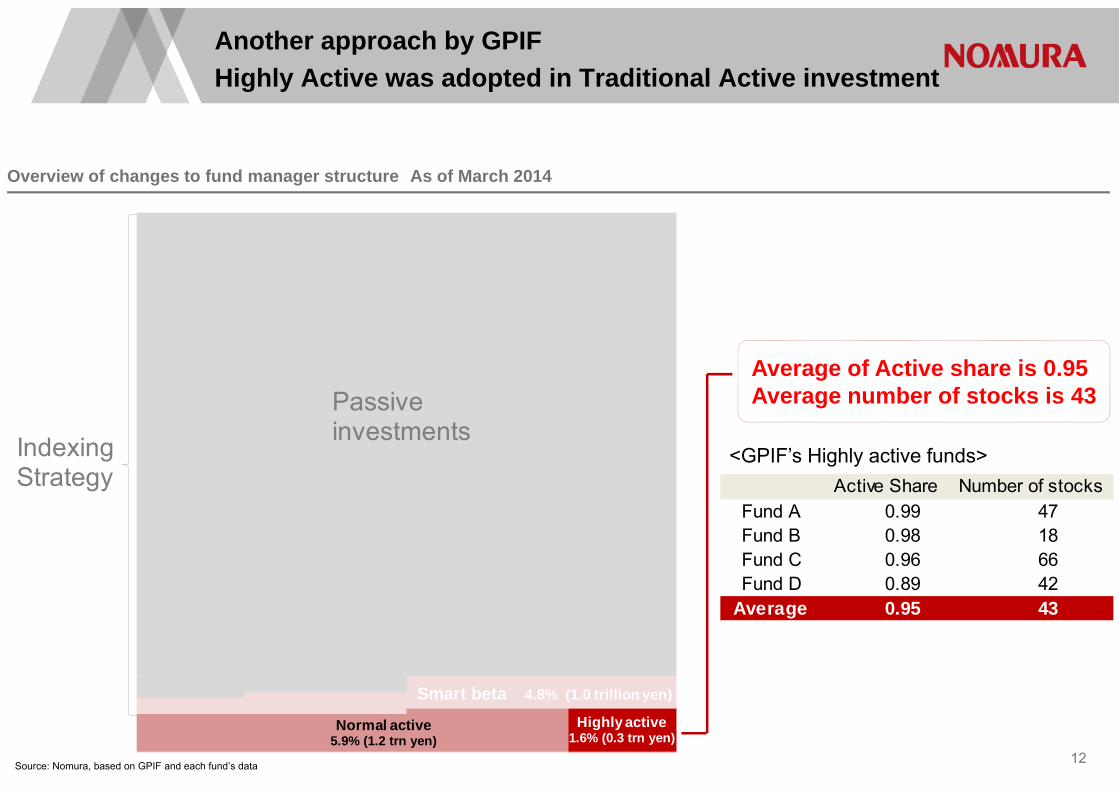
Overview of changes to fund manager structure As of March 2014
Source: Nomura, based on GPIF and each fund’s data 12
Another approach by GPIFHighly Active was adopted in Traditional Active investment
123456789
101112131415161718192021222324252627282930313233343536373839404142434445464748495051525354555657585960616263646566676869707172737475767778798081828384858687888990919293949596979899
100
Smart beta 4.8% (1.0 trillion yen)
IndexingStrategy
Highly active1.6% (0.3 trn yen)
Normal active5.9% (1.2 trn yen)
Passiveinvestments
Active Share Number of stocksFund A 0.99 47Fund B 0.98 18Fund C 0.96 66Fund D 0.89 42
Average 0.95 43
<GPIF’s Highly active funds>
Average of Active share is 0.95Average number of stocks is 43

1.0
0.0
8.0
0.8
0.6
0.2
6.0
(b) Diversified stock picker
(a) Concentratedstock picker
(e) Quasi-index (closet indexer)
(c) Normal-type
11%11%
52%
11%
(d) Systematic factor bets
14%
(f) Pure index fund
Tracking error (annualized %)
Active share
Tracking error (annualized %)
0%
Highly Active
Moderately Active
(%) Percentage of all funds in universe
Share of all funds by active fund type in Japan mutual funds (as of end-April 2015)
Active fund categories based on active share and tracking error : Cremers and Petajisto (2009)
13Note: We divided Japan equity active funds into six categories based on active share and tracking error sizes. For each fund, we calculated active share using the most recent data from management reports disclosed
over a one-year period up to end-April 2015, and tracking error using historical returns for the 36-month period up to end-April 2015. The figure given to each category in the table represents a percentage (share) of all funds in our universe.
Source: Nomura
, , :The portfolio weighting of stock i:The benchmark weighting of stock i
Active share indicates the extent to which the portfolio weighting diverges from the benchmark. For long-only funds, it has a value ranging from 0% to 100%.
Activeshare: 12 , ,
1
“Active share” is defined as the percentage of a portfolio that differs from a benchmark to measure the degree of active management.
‐10
0
10
20
30
40
50
200206
200306
200406
200506
200606
200706
200806
200906
201006
201106
201206
201306
201406
(a) Concentrated stock picker
(b) Diversified stock picker
(c) Normal-type
(d) Systematic factor bets
(e) Quasi-index(closet indexer)
(end-Jun 2002 = 0%)
(yyyymm)
Timeframe of highly active funds' underperformance
→←
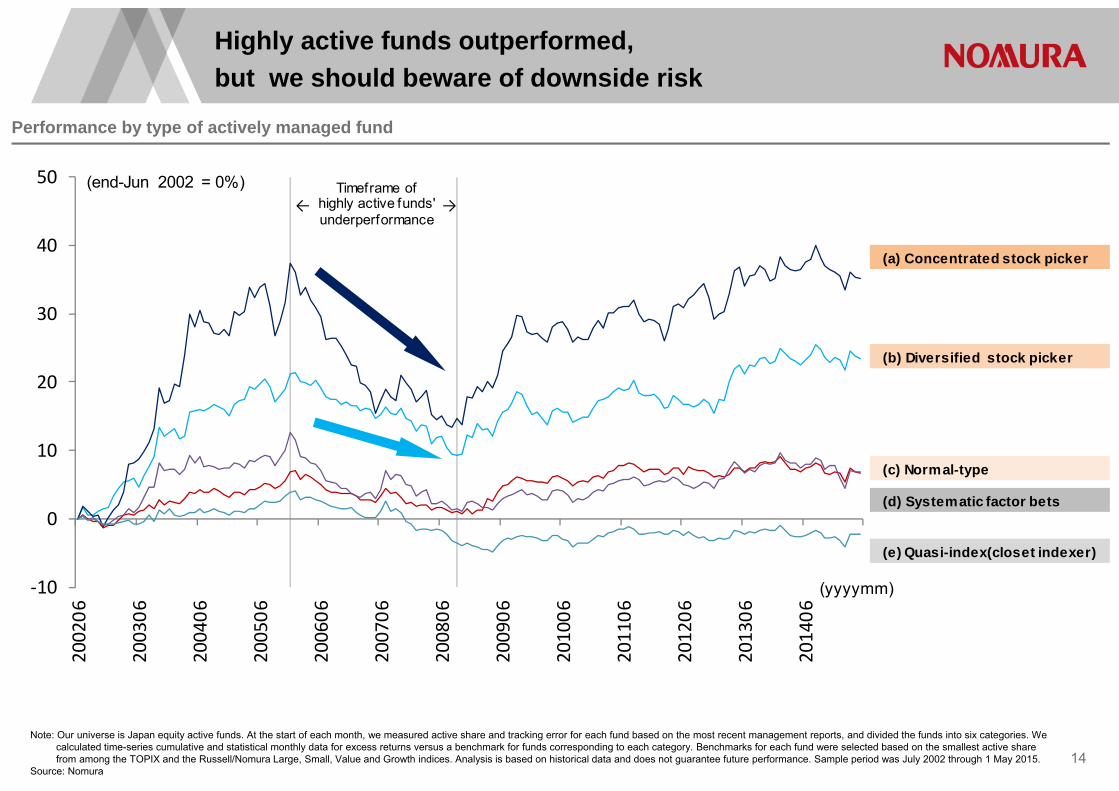
Performance by type of actively managed fund
Highly active funds outperformed,but we should beware of downside risk
14
Note: Our universe is Japan equity active funds. At the start of each month, we measured active share and tracking error for each fund based on the most recent management reports, and divided the funds into six categories. We calculated time-series cumulative and statistical monthly data for excess returns versus a benchmark for funds corresponding to each category. Benchmarks for each fund were selected based on the smallest active share from among the TOPIX and the Russell/Nomura Large, Small, Value and Growth indices. Analysis is based on historical data and does not guarantee future performance. Sample period was July 2002 through 1 May 2015.
Source: Nomura

Performance of Japanese equity traditional active funds
Highly Active has been underperforming even after the second half of 2014
15
Note: The performance of traditional active funds is shown as the difference in returns between stocks overweighted and underweighted by domestic investment trusts and pension funds. The performance of highly active funds is shown as the average excess return versus the benchmark of long-only publicly offered investment trusts with an active share of more than 0.8. The performance of highly active (GPIF) is shown as the average excess return versus the TOPIX on three funds (Eastspring Japan Smaller Companies Fund, MHAM Japan Small Cap Stock Open, and Invesco Japanese Equity Advantage Fund ). Sample period was Jan 2014–1 May 2015. We did not take transaction costs into account, except in the case of funds that have closed. Analysis is based on historical data and does not guarantee future performance.
Source: Nomura
‐6.0
‐4.0
‐2.0
0.0
2.0
4.0
6.0
201312
201401
201402
201403
201404
201405
201406
201407
201408
201409
201410
201411
201412
201501
201502
201503
201504
(End‐Dec 2013 = 0%) Cumulative return
Traditional active
Highly Active (Mutual Funds)
Highly Active (GPIF)
24 Mar 2014GPIF-Shock
31 Oct 2014 BOJ's QQE
26-28 Jan 2015 GPIF-Shock
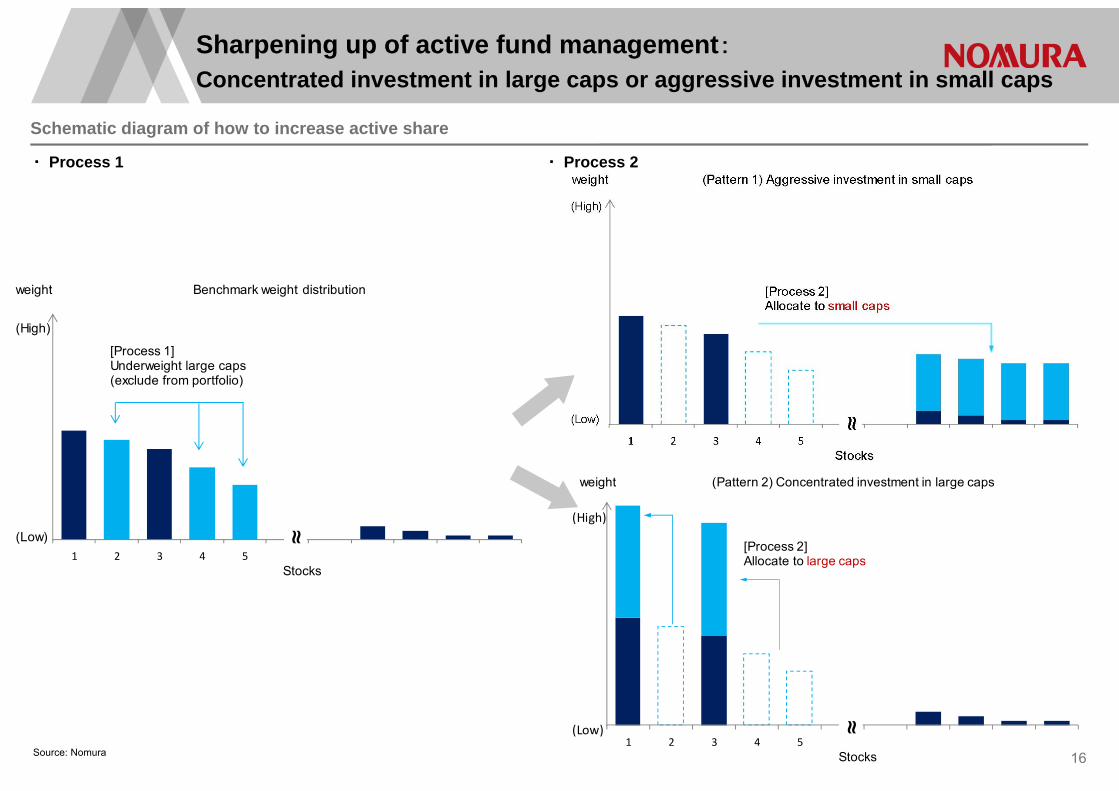
1 2 3 4 5
weight (Pattern 2) Concentrated investment in large caps
≈
Stocks
[Process 2]Allocate to large caps
(High)
(Low)
1 2 3 4 5
≈
Stocks
[Process 1]Underweight large caps(exclude from portfolio)
weight Benchmark weight distribution
(High)
(Low)
Schematic diagram of how to increase active share
Sharpening up of active fund management:Concentrated investment in large caps or aggressive investment in small caps
16Source: Nomura
・ Process 1 ・ Process 2
0.0
0.1
0.2
0.3
0.4
0.5
0.6
0.7
0.8
0.9
1.0
0.0 0.2 0.4 0.6 0.8 1.0
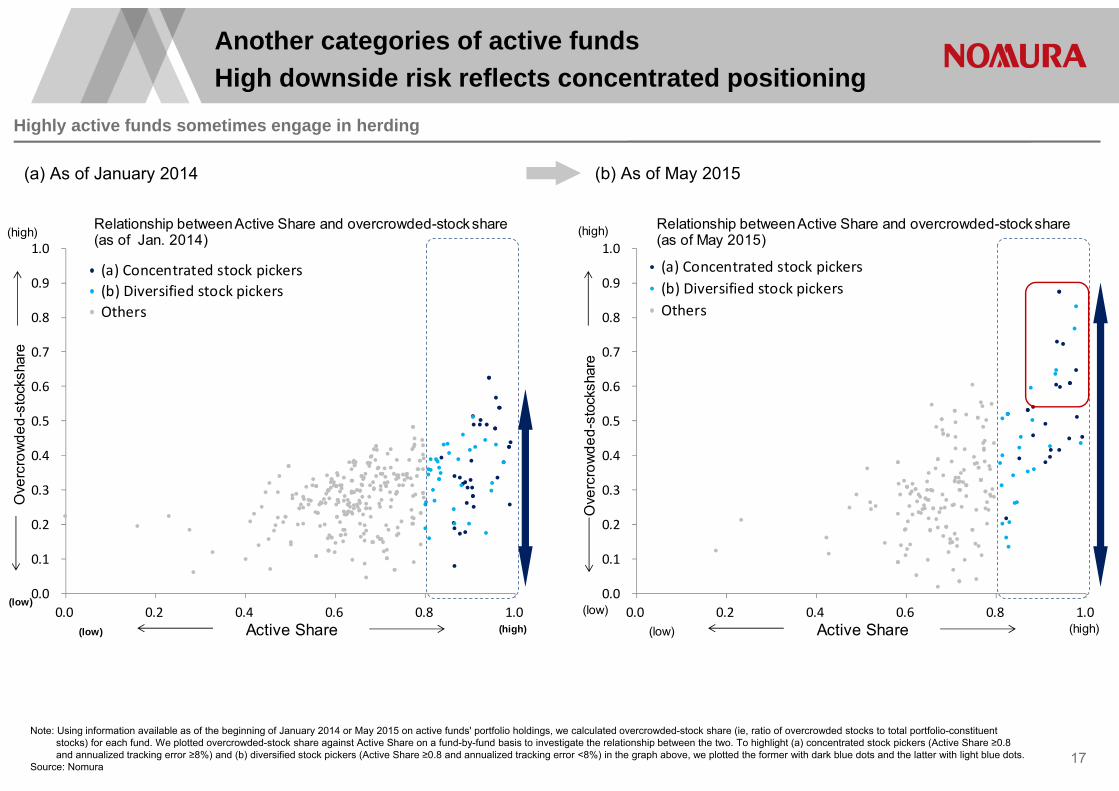
Relationship between Active Share and overcrowded-stock share (as of Jan. 2014)
(a) Concentrated stock pickers(b) Diversified stock pickersOthers
Active Share
Ove
rcro
wde
d-st
ocks
hare
(high)
(low)
(high)(low)
0.0
0.1
0.2
0.3
0.4
0.5
0.6
0.7
0.8
0.9
1.0
0.0 0.2 0.4 0.6 0.8 1.0
Relationship between Active Share and overcrowded-stock share (as of May 2015)
(a) Concentrated stock pickers(b) Diversified stock pickersOthers
Active Share
Ove
rcro
wde
d-st
ocks
hare
(high)
(low)(high)(low)
Highly active funds sometimes engage in herding
Another categories of active funds High downside risk reflects concentrated positioning
17
Note: Using information available as of the beginning of January 2014 or May 2015 on active funds' portfolio holdings, we calculated overcrowded-stock share (ie, ratio of overcrowded stocks to total portfolio-constituent stocks) for each fund. We plotted overcrowded-stock share against Active Share on a fund-by-fund basis to investigate the relationship between the two. To highlight (a) concentrated stock pickers (Active Share ≥0.8 and annualized tracking error ≥8%) and (b) diversified stock pickers (Active Share ≥0.8 and annualized tracking error <8%) in the graph above, we plotted the former with dark blue dots and the latter with light blue dots.
Source: Nomura
(a) As of January 2014 (b) As of May 2015
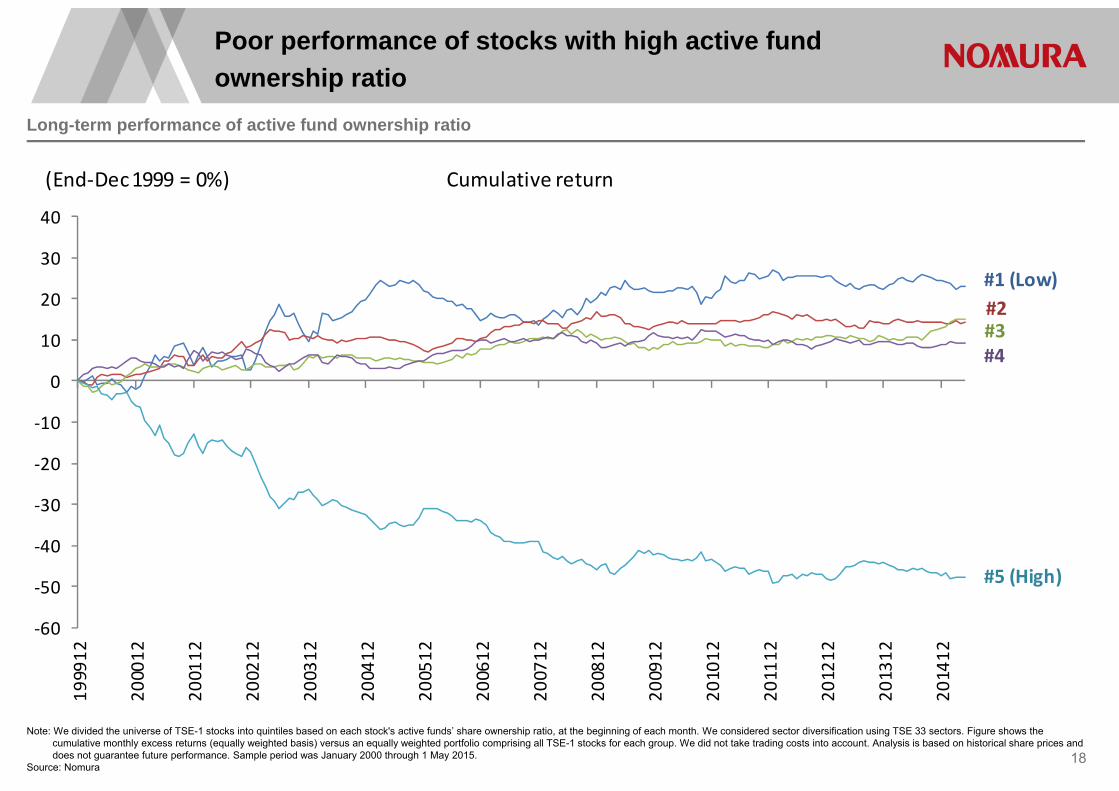
Poor performance of stocks with high active fund ownership ratio
18
Long-term performance of active fund ownership ratio
Note: We divided the universe of TSE-1 stocks into quintiles based on each stock's active funds’ share ownership ratio, at the beginning of each month. We considered sector diversification using TSE 33 sectors. Figure shows the cumulative monthly excess returns (equally weighted basis) versus an equally weighted portfolio comprising all TSE-1 stocks for each group. We did not take trading costs into account. Analysis is based on historical share prices and does not guarantee future performance. Sample period was January 2000 through 1 May 2015.
Source: Nomura
‐60
‐50
‐40
‐30
‐20
‐10
0
10
20
30
40
199912
200012
200112
200212
200312
200412
200512
200612
200712
200812
200912
201012
201112
201212
201312
201412
(End‐Dec 1999 = 0%) Cumulative return
#1 (Low)
#5 (High)
#4#3#2
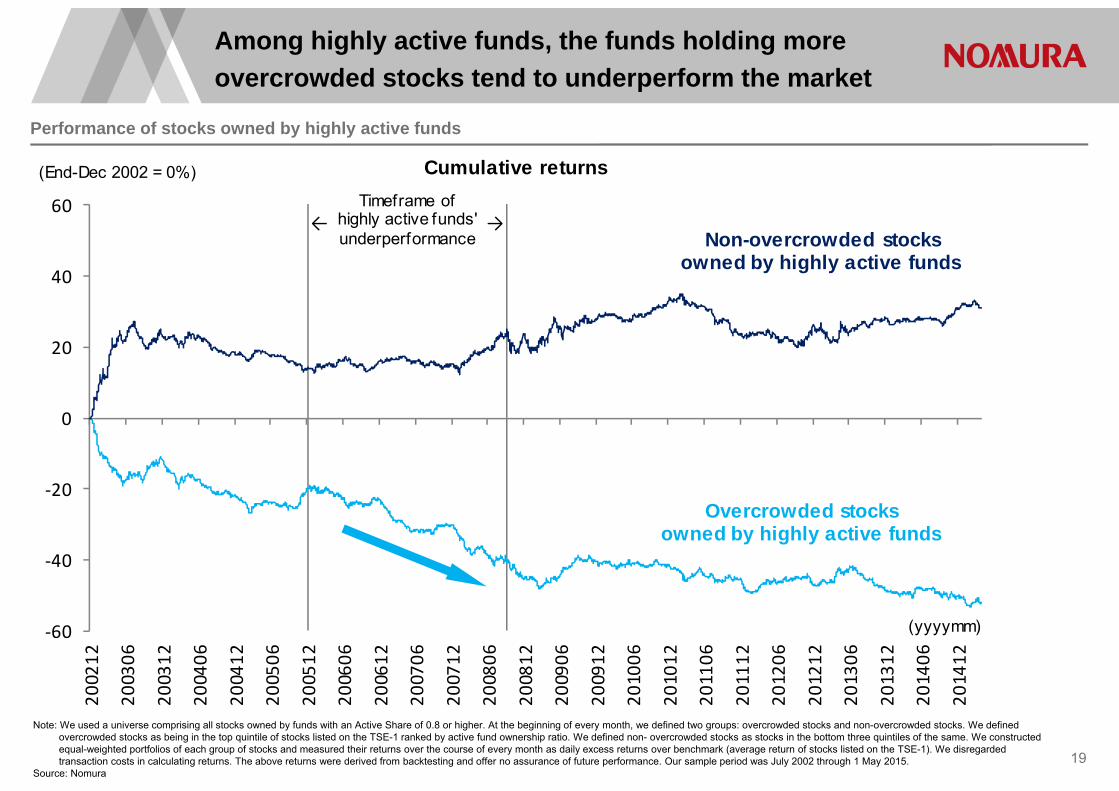
Performance of stocks owned by highly active funds
Among highly active funds, the funds holding more overcrowded stocks tend to underperform the market
19
Note: We used a universe comprising all stocks owned by funds with an Active Share of 0.8 or higher. At the beginning of every month, we defined two groups: overcrowded stocks and non-overcrowded stocks. We defined overcrowded stocks as being in the top quintile of stocks listed on the TSE-1 ranked by active fund ownership ratio. We defined non- overcrowded stocks as stocks in the bottom three quintiles of the same. We constructed equal-weighted portfolios of each group of stocks and measured their returns over the course of every month as daily excess returns over benchmark (average return of stocks listed on the TSE-1). We disregarded transaction costs in calculating returns. The above returns were derived from backtesting and offer no assurance of future performance. Our sample period was July 2002 through 1 May 2015.
Source: Nomura
‐60
‐40
‐20
0
20
40
60
200212
200306
200312
200406
200412
200506
200512
200606
200612
200706
200712
200806
200812
200906
200912
201006
201012
201106
201112
201206
201212
201306
201312
201406
201412
Cumulative returns
Overcrowded stocks owned by highly active funds
Non-overcrowded stocksowned by highly active funds
Timeframe of highly active funds' underperformance
→←
(End-Dec 2002 = 0%)
(yyyymm)

Avoiding herding is also crucial for factor strategy
20
Correlation between herding and performance
Note: We had three sample periods: Dec 2014, Jan 2015, and Feb 2015 (through 20 Feb). For each factor, we divided our universe of TOPIX 500 constituent stocks into quintiles based on factor values at the start of each month. To determine the degree of herding for each factor, we calculated the average active fund ownership ratio for the quintiles with the highest and lowest factor values, and standardized our data by dividing the difference between the two by the average active fund ownership ratio for the universe as a whole. We calculated the monthly factor return as the monthly return on a strategy of going long on the stocks in the top quintile and short on the stocks in the bottom quintile. Figure shows the relationship between herding and subsequent factor returns in our three periods, with the degree of herding at the beginning of each month shown on the x-axis and subsequent factor returns shown on the y-axis. We did not take transaction costs into account. Analysis is based on historical data and does not guarantee future performance.
Source: Nomura
E/P (actual profits)
Historical 12-month return
Estimated dividend yield
B/P
-8
-6
-4
-2
0
2
4
6
8
-1.00 -0.50 0.00 0.50 1.00
Correlation between herding and performance (Dec 2014–Feb 2015)
Dec 2014Jan 2015Feb 2015線形 (Jan 2015)線形 (Feb 2015)
Herding (at beginning of month)
Monthly return (%)
(High)(Low )
Low herding
High herdingLow return
Regression line (Feb 2015)
Regression line (Jan 2015)
Regression line (Jan 2015)Regression line (Feb 2015)
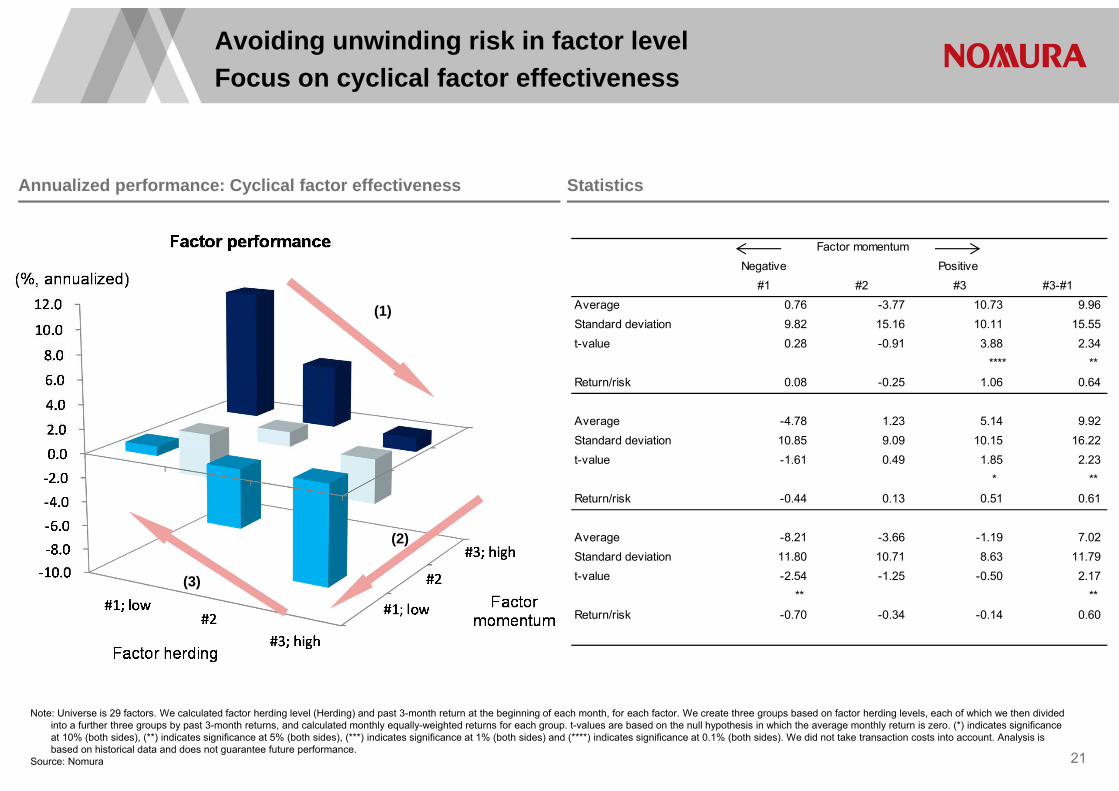
Avoiding unwinding risk in factor levelFocus on cyclical factor effectiveness
21
Annualized performance: Cyclical factor effectiveness Statistics
(1)
(2)
(3)
Note: Universe is 29 factors. We calculated factor herding level (Herding) and past 3-month return at the beginning of each month, for each factor. We create three groups based on factor herding levels, each of which we then divided into a further three groups by past 3-month returns, and calculated monthly equally-weighted returns for each group. t-values are based on the null hypothesis in which the average monthly return is zero. (*) indicates significance at 10% (both sides), (**) indicates significance at 5% (both sides), (***) indicates significance at 1% (both sides) and (****) indicates significance at 0.1% (both sides). We did not take transaction costs into account. Analysis is based on historical data and does not guarantee future performance.
Source: Nomura
Negative Positive #1 #2 #3 #3-#1
Average 0.76 -3.77 10.73 9.96Standard deviation 9.82 15.16 10.11 15.55t-value 0.28 -0.91 3.88 2.34
**** ** Return/risk 0.08 -0.25 1.06 0.64
Average -4.78 1.23 5.14 9.92Standard deviation 10.85 9.09 10.15 16.22t-value -1.61 0.49 1.85 2.23
* ** Return/risk -0.44 0.13 0.51 0.61
Average -8.21 -3.66 -1.19 7.02Standard deviation 11.80 10.71 8.63 11.79t-value -2.54 -1.25 -0.50 2.17
** ** Return/risk -0.70 -0.34 -0.14 0.60
Factor momentum
The fund flows into passive funds are likely to far exceed those into active funds,because of the expanding passive management by public pension funds and the QQE by BOJ.
While the stocks preferred by passive/smart-beta management are expected to outperform, the overcrowded stocks held by active managers are likely to underperform the market .
Active investment holding a small number of stocks has been also expanding, but has resulted in underperformance in recent years.
Avoiding herding is crucial both for active and quantitative funds in Japan equities.
Conclusion
22
Reference materials
• Inigo Fraser-Jenkins, et al., 2014, 2015 European Strategy Outlook, Preparing for a low-return world, 25 November 2014
• Akihiro Murakami, 2015, Japanese equity quantitative strategy: Unwinding amid global correlation of factor trends, Nomura Quantitative Research Report, 26 February, 2015
• Akihiro Murakami, 2014, Japanese equity quantitative strategy: 2015 factor outlook for Japanese equities, Nomura Quantitative Research Report, 18 December 2014
• Akihiro Murakami, 2014, Japanese equity quantitative strategy: More on sharpening up, Nomura Quantitative Research Report, 29 September 2014
• Akihiro Murakami, 2014, Japanese equity quantitative strategy: Sharpening up of active fund management, Nomura Quantitative Research Report, 22 August 2014
• Akihiro Murakami, 2014, Japanese equity quantitative strategy: Knock-on effect of increasing passive management, Nomura Quantitative Research Report, 9 July 2014
• Akihiro Murakami, 2014, Japanese equity quantitative strategy: Active funds still facing headwinds, Nomura Quantitative Research Report, 30 April 2014
23
Appendix A-1
Analyst CertificationI, Akihiro MURAKAMI, hereby certify (1) that the views expressed in this Research report accurately reflect my personal views about any or all of the subject securities or issuers referred to in this Research report, (2) no part of my compensation was, is or will be directly or indirectly related to the specific recommendations or views expressed in this Research report and (3) no part of my compensation is tied to any specific investment banking transactions performed by Nomura Securities International, Inc., Nomura International plc or any other Nomura Group company.
Important DisclosuresThe lists of issuers that are affiliates or subsidiaries of Nomura Holdings Inc., the parent company of Nomura Securities Co., Ltd., issuers that have officers who concurrently serve as officers of Nomura Securities Co., Ltd., issuers in which the Nomura Group holds 1% or more of any class of common equity securities and issuers for which Nomura Securities Co., Ltd. has lead managed a public offering of equity or equity linked securities in the past 12 months are available at http://www.nomuraholdings.com/jp/report/. Please contact the Research Product Management Dept. of Nomura Securities Co., Ltd. for additional information.
Online availability of research and conflict-of-interest disclosuresNomura research is available on www.nomuranow.com/research, Bloomberg, Capital IQ, Factset, MarkitHub, Reuters and ThomsonOne.Important disclosures may be read at http://go.nomuranow.com/research/globalresearchportal/pages/disclosures/disclosures.aspx or requested from Nomura Securities International, Inc., on 1-877-865-5752. If you have any difficulties with the website, please email [email protected] for help.
The analysts responsible for preparing this report have received compensation based upon various factors including the firm's total revenues, a portion of which is generated by Investment Banking activities. Unless otherwise noted, the non-US analysts listed at the front of this report are not registered/qualified as research analysts under FINRA/NYSE rules, may not be associated persons of NSI, and may not be subject to FINRA Rule 2711 and NYSE Rule 472 restrictions on communications with covered companies, public appearances, and trading securities held by a research analyst account.
Nomura Global Financial Products Inc. (“NGFP”) Nomura Derivative Products Inc. (“NDPI”) and Nomura International plc. (“NIplc”) are registered with the Commodities Futures Trading Commission and the National Futures Association (NFA) as swap dealers. NGFP, NDPI, and NIplc are generally engaged in the trading of swaps and other derivative products, any of which may be the subject of this report.
Any authors named in this report are research analysts unless otherwise indicated. Industry Specialists identified in some Nomura International plc research reports are employees within the Firm who are responsible for the sales and trading effort in the sector for which they have coverage. Industry Specialists do not contribute in any manner to the content of research reports in which their names appear.
Distribution of ratings (Global)The distribution of all ratings published by Nomura Global Equity Research is as follows:48% have been assigned a Buy rating which, for purposes of mandatory disclosures, are classified as a Buy rating; 43% of companies with this rating are investment banking clients of the Nomura Group*.44% have been assigned a Neutral rating which, for purposes of mandatory disclosures, is classified as a Hold rating; 53% of companies with this rating are investment banking clients of the Nomura Group*. 8% have been assigned a Reduce rating which, for purposes of mandatory disclosures, are classified as a Sell rating; 25% of companies with this rating are investment banking clients of the Nomura Group*.As at 31 March 2015. *The Nomura Group as defined in the Disclaimer section at the end of this report.
Explanation of Nomura's equity research rating system in Europe, Middle East and Africa, US and Latin America, and Japan and Asia ex-Japan from 21 October 2013The rating system is a relative system, indicating expected performance against a specific benchmark identified for each individual stock, subject to limited management discretion. An analyst’s target price is an assessment of the current intrinsic fair value of the stock based on an appropriate valuation methodology determined by the analyst. Valuation methodologies include, but are not limited to, discounted cash flow analysis, expected return on equity and multiple analysis. Analysts may also indicate expected absolute upside/downside relative to the
stated target price, defined as (target price - current price)/current price.
STOCKSA rating of 'Buy', indicates that the analyst expects the stock to outperform the Benchmark over the next 12 months. A rating of 'Neutral', indicates that the analyst expects the stock to perform in line with the Benchmark over the next 12 months. A rating of 'Reduce', indicates that the analyst expects the stock to underperform the Benchmark over the next 12 months. A rating of 'Suspended', indicates that the rating, target price and estimates have been suspended temporarily to comply with applicable regulations and/or firm policies. Securities and/or companies that are labelled as 'Not rated' or shown as 'No rating' are not in regular research coverage. Investors should not expect continuing or additional information from Nomura relating to such securities and/or companies. Benchmarks are as follows: United States/Europe/Asia ex-Japan: please see valuation methodologies for explanations of relevant benchmarks for stocks, which can be accessed at: http://go.nomuranow.com/research/globalresearchportal/pages/disclosures/disclosures.aspx; Global Emerging Markets (ex-Asia): MSCI Emerging Markets ex-Asia, unless otherwise stated in the valuation methodology; Japan: Russell/Nomura Large Cap.
SECTORSA 'Bullish' stance, indicates that the analyst expects the sector to outperform the Benchmark during the next 12 months. A 'Neutral' stance, indicates that the analyst expects the sector to perform in line with the Benchmark during the next 12 months. A 'Bearish' stance, indicates that the analyst expects the sector to underperform the Benchmark during the next 12 months. Sectors that are labelled as 'Not rated'or shown as 'N/A' are not assigned ratings. Benchmarks are as follows: United States: S&P 500; Europe: Dow Jones STOXX 600; Global Emerging Markets (ex-Asia): MSCI Emerging Markets ex-Asia. Japan/Asia ex-Japan: Sector ratings are not assigned.
Explanation of Nomura's equity research rating system in Japan and Asia ex-Japan prior to 21 October 2013STOCKSStock recommendations are based on absolute valuation upside (downside), which is defined as (Target Price - Current Price) / Current Price, subject to limited management discretion. In most cases, the Target Price will equal the analyst's 12-month intrinsic valuation of the stock, based on an appropriate valuation methodology such as discounted cash flow, multiple analysis, etc. A 'Buy' recommendation indicates that potential upside is 15% or more. A 'Neutral' recommendation indicates that potential upside is less than 15% or downside is less than 5%. A 'Reduce' recommendation indicates that potential downside is 5% or more. A rating of 'Suspended' indicates that the rating and target price have been suspended temporarily to comply with applicable regulations and/or firm policies in certain circumstances including when Nomura is acting in an advisory capacity in a merger or strategic transaction involving the subject company. Securities and/or companies that are labelled as 'Not rated' or shown as 'No rating'are not in regular research coverage of the Nomura entity identified in the top banner. Investors should not expect continuing or additional information from Nomura relating to such securities and/or companies.
SECTORSA 'Bullish' rating means most stocks in the sector have (or the weighted average recommendation of the stocks under coverage is) a positive absolute recommendation. A 'Neutral' rating means most stocks in the sector have (or the weighted average recommendation of the stocks under coverage is) a neutral absolute recommendation. A 'Bearish' rating means most stocks in the sector have (or the weighted average recommendation of the stocks under coverage is) a negative absolute recommendation.
Target PriceA Target Price, if discussed, reflect in part the analyst's estimates for the company's earnings. The achievement of any target price may be impeded by general market and macroeconomic trends, and by other risks related to the company or the market, and may not occur if the company's earnings differ from estimates.
DisclaimersThis document contains material that has been prepared by the Nomura entity identified on page 1 and/or with the sole or joint contributions of one or more Nomura entities whose employees and their respective affiliations are also specified on page 1 or identified elsewhere in the document. The term "Nomura Group" used herein refers to Nomura Holdings, Inc. or any of its affiliates or subsidiaries and may refer to one or more Nomura Group companies including: Nomura Securities Co., Ltd. ('NSC') Tokyo, Japan; Nomura International plc ('NIplc'), UK; Nomura Securities International, Inc. ('NSI'), New York, US; Nomura International (Hong Kong) Ltd. (‘NIHK’), Hong Kong; Nomura Financial Investment (Korea) Co., Ltd. (‘NFIK’), Korea (Information on Nomura analysts registered with the Korea Financial Investment Association ('KOFIA') can be found on the KOFIA Intranet at http://dis.kofia.or.kr); Nomura Singapore Ltd. (‘NSL’), Singapore (Registration number 197201440E, regulated by the Monetary Authority of Singapore); Nomura Australia Ltd. (‘NAL’), Australia (ABN 48 003 032 513), regulated by the Australian Securities and Investment Commission ('ASIC') and holder of an Australian financial services licence number 246412; P.T. Nomura Indonesia (‘PTNI’), Indonesia; Nomura Securities Malaysia Sdn. Bhd. (‘NSM’), Malaysia; NIHK, Taipei Branch (‘NITB’), Taiwan; Nomura Financial Advisory and Securities (India) Private Limited (‘NFASL’), Mumbai, India (Registered Address: Ceejay House, Level 11, Plot F, Shivsagar Estate, Dr. Annie Besant Road, Worli, Mumbai- 400 018, India; Tel: +91 22 4037 4037, Fax: +91 22 4037 4111; CIN No :
U74140MH2007PTC169116, SEBI Registration No: BSE INB011299030, NSE INB231299034, INF231299034, INE 231299034, MCX: INE261299034) and NIplc, Madrid Branch (‘NIplc, Madrid’). ‘CNS Thailand’ next to an analyst’s name on the front page of a research report indicates that the analyst is employed by Capital Nomura Securities Public Company Limited (‘CNS’) to provide research assistance services to NSL under a Research Assistance Agreement. ‘NSFSPL’ next to an employee’s name on the front page of a research report indicates that the individual is employed by Nomura Structured Finance Services Private Limited to provide assistance to certain Nomura entities under inter-company agreements.THIS MATERIAL IS: (I) FOR YOUR PRIVATE INFORMATION, AND WE ARE NOT SOLICITING ANY ACTION BASED UPON IT; (II) NOT TO BE CONSTRUED AS AN OFFER TO SELL OR A SOLICITATION OF AN OFFER TO BUY ANY SECURITY IN ANY JURISDICTION WHERE SUCH OFFER OR SOLICITATION WOULD BE ILLEGAL; AND (III) BASED UPON INFORMATION FROM SOURCES THAT WE CONSIDER RELIABLE, BUT HAS NOT BEEN INDEPENDENTLY VERIFIED BY NOMURA GROUP.Nomura Group does not warrant or represent that the document is accurate, complete, reliable, fit for any particular purpose or merchantable and does not accept liability for any act (or decision not to act) resulting from use of this document and related data. To the maximum extent permissible all warranties and other assurances by Nomura group are hereby excluded and Nomura Group shall have no liability for the use, misuse, or distribution of this information.Opinions or estimates expressed are current opinions as of the original publication date appearing on this material and the information, including the opinions and estimates contained herein, are subject to change without notice. Nomura Group is under no duty to update this document. Any comments or statements made herein are those of the author(s) and may differ from views held by other parties within Nomura Group. Clients should consider whether any advice or recommendation in this report is suitable for their particular circumstances and, if appropriate, seek professional advice, including tax advice. Nomura Group does not provide tax advice. Nomura Group, and/or its officers, directors and employees, may, to the extent permitted by applicable law and/or regulation, deal as principal, agent, or otherwise, or have long or short positions in, or buy or sell, the securities, commodities or instruments, or options or other derivative instruments based thereon, of issuers or securities mentioned herein. Nomura Group companies may also act as market maker or liquidity provider (within the meaning of applicable regulations in the UK) in the financial instruments of the issuer. Where the activity of market maker is carried out in accordance with the definition given to it by specific laws and regulations of the US or other jurisdictions, this will be separately disclosed within the specific issuer disclosures. This document may contain information obtained from third parties, including ratings from credit ratings agencies such as Standard & Poor’s. Reproduction and distribution of third-party content in any form is prohibited except with the prior written permission of the related third-party. Third-party content providers do not guarantee the accuracy, completeness, timeliness or availability of any information, including ratings, and are not responsible for any errors or omissions (negligent or otherwise), regardless of the cause, or for the results obtained from the use of such content. Third-party content providers give no express or implied warranties, including, but not limited to, any warranties of merchantability or fitness for a particular purpose or use. Third-party content providers shall not be liable for any direct, indirect, incidental, exemplary, compensatory, punitive, special or consequential damages, costs, expenses, legal fees, or losses (including lost income or profits and opportunity costs) in connection with any use of their content, including ratings. Credit ratings are statements of opinions and are not statements of fact or recommendations to purchase hold or sell securities. They do not address the suitability of securities or the suitability of securities for investment purposes, and should not be relied on as investment advice.Any MSCI sourced information in this document is the exclusive property of MSCI Inc. (‘MSCI’). Without prior written permission of MSCI, this information and any other MSCI intellectual property may not be reproduced, re-disseminated or used to create any financial products, including any indices. This information is provided on an "as is" basis. The user assumes the entire risk of any use made of this information. MSCI, its affiliates and any third party involved in, or related to, computing or compiling the information hereby expressly disclaim all warranties of originality, accuracy, completeness, merchantability or fitness for a particular purpose with respect to any of this information. Without limiting any of the foregoing, in no event shall MSCI, any of its affiliates or any third party involved in, or related to, computing or compiling the information have any liability for any damages of any kind. MSCI and the MSCI indexes are services marks of MSCI and its affiliates.Russell/Nomura Japan Equity Indexes are protected by certain intellectual property rights of Nomura Securities Co., Ltd. and Russell Investments. Nomura Securities Co., Ltd. and Russell Investments do not guarantee the accuracy, completeness, reliability, or usefulness thereof and do not account for business activities and services that any index user and its affiliates undertake with the use of the Indexes. Investors should consider this document as only a single factor in making their investment decision and, as such, the report should not be viewed as identifying or suggesting all risks, direct or indirect, that may be associated with any investment decision. Nomura Group produces a number of different types of research product including, among others, fundamental analysis and quantitative analysis; recommendations contained in one type of research product may differ from recommendations contained in other types of research product, whether as a result of differing time horizons, methodologies or otherwise. Nomura Group publishes research product in a number of different ways including the posting of product on Nomura Group portals and/or distribution directly to clients. Different groups of clients may receive different products and services from the research department depending on their individual requirements. Figures presented herein may refer to past performance or simulations based on past performance which are not reliable indicators of future performance. Where the information contains an indication of future performance, such forecasts may not be a reliable indicator of future performance. Moreover, simulations are based on models and simplifying assumptions which may oversimplify and not reflect the future distribution of returns.Certain securities are subject to fluctuations in exchange rates that could have an adverse effect on the value or price of, or income derived from, the investment. The securities described herein may not have been registered under the US Securities Act of 1933 (the ‘1933 Act’), and, in such case, may not be offered or sold in the US or to US persons unless they have been registered under the 1933 Act, or except in compliance with an exemption from the registration requirements of the 1933 Act. Unless governing law permits
otherwise, any transaction should be executed via a Nomura entity in your home jurisdiction.This document has been approved for distribution in the UK and European Economic Area as investment research by NIplc. NIplc is authorised by the Prudential Regulation Authority and regulated by the Financial Conduct Authority and the Prudential Regulation Authority. NIplc is a member of the London Stock Exchange. This document does not constitute a personal recommendation within the meaning of applicable regulations in the UK, or take into account the particular investment objectives, financial situations, or needs of individual investors. This document is intended only for investors who are 'eligible counterparties' or 'professional clients' for the purposes of applicable regulations in the UK, and may not, therefore, be redistributed to persons who are 'retail clients' for such purposes. This document has been approved by NIHK, which is regulated by the Hong Kong Securities and Futures Commission, for distribution in Hong Kong by NIHK. This document has been approved for distribution in Australia by NAL, which is authorized and regulated in Australia by the ASIC. This document has also been approved for distribution in Malaysia by NSM. In Singapore, this document has been distributed by NSL. NSL accepts legal responsibility for the content of this document, where it concerns securities, futures and foreign exchange, issued by their foreign affiliates in respect of recipients who are not accredited, expert or institutional investors as defined by the Securities and Futures Act (Chapter 289). Recipients of this document in Singapore should contact NSL in respect of matters arising from, or in connection with, this document. Unless prohibited by the provisions of Regulation S of the 1933 Act, this material is distributed in the US, by NSI, a US-registered broker-dealer, which accepts responsibility for its contents in accordance with the provisions of Rule 15a-6, under the US Securities Exchange Act of 1934. The entity that prepared this document permits its separately operated affiliates within the Nomura Group to make copies of such documents available to their clients.This document has not been approved for distribution to persons other than ‘Authorised Persons’, ‘Exempt Persons’ or ‘Institutions’ (as defined by the Capital Markets Authority) in the Kingdom of Saudi Arabia (‘Saudi Arabia’) or 'professional clients' (as defined by the Dubai Financial Services Authority) in the United Arab Emirates (‘UAE’) or a ‘Market Counterparty’ or ‘Business Customers’ (as defined by the Qatar Financial Centre Regulatory Authority) in the State of Qatar (‘Qatar’) by Nomura Saudi Arabia, NIplc or any other member of Nomura Group, as the case may be. Neither this document nor any copy thereof may be taken or transmitted or distributed, directly or indirectly, by any person other than those authorised to do so into Saudi Arabia or in the UAE or in Qatar or to any person other than ‘Authorised Persons’, ‘Exempt Persons’ or ‘Institutions’ located in Saudi Arabia or 'professional clients' in the UAE or a ‘Market Counterparty’ or ‘Business Customers’ in Qatar . By accepting to receive this document, you represent that you are not located in Saudi Arabia or that you are an ‘Authorised Person’, an ‘Exempt Person’ or an ‘Institution’ in Saudi Arabia or that you are a 'professional client' in the UAE or a ‘Market Counterparty’ or ‘Business Customers’ in Qatar and agree to comply with these restrictions. Any failure to comply with these restrictions may constitute a violation of the laws of the UAE or Saudi Arabia or Qatar.NO PART OF THIS MATERIAL MAY BE (I) COPIED, PHOTOCOPIED, OR DUPLICATED IN ANY FORM, BY ANY MEANS; OR (II) REDISTRIBUTED WITHOUT THE PRIOR WRITTEN CONSENT OF A MEMBER OF NOMURA GROUP. If this document has been distributed by electronic transmission, such as e-mail, then such transmission cannot be guaranteed to be secure or error-free as information could be intercepted, corrupted, lost, destroyed, arrive late or incomplete, or contain viruses. The sender therefore does not accept liability for any errors or omissions in the contents of this document, which may arise as a result of electronic transmission. If verification is required, please request a hard-copy version.
Disclaimers required in JapanInvestors in the financial products offered by Nomura Securities may incur fees and commissions specific to those products (for example, transactions involving Japanese equities are subject to a sales commission of up to 1.404% on a tax-inclusive basis of the transaction amount or a commission of ¥2,808 for transactions of ¥200,000 or less, while transactions involving investment trusts are subject to various fees, such as commissions at the time of purchase and asset management fees (trust fees), specific to each investment trust). In addition, all products carry the risk of losses owing to price fluctuations or other factors. Fees and risks vary by product. Please thoroughly read the written materials provided, such as documents delivered before making a contract, listed securities documents, or prospectuses.
Transactions involving Japanese equities (including Japanese REITs, Japanese ETFs, and Japanese ETNs) are subject to a sales commission of up to 1.404% of the transaction amount (or a commission of ¥2,808 for transactions of ¥200,000 or less). When Japanese equities are purchased via OTC transactions (including offerings), only the purchase price shall be paid, with no sales commission charged. However, Nomura Securities may charge a separate fee for OTC transactions, as agreed with the customer. Japanese equities carry the risk of losses owing to price fluctuations. Japanese REITs carry the risk of losses owing to fluctuations in price and/or earnings of underlying real estate. Japanese ETFs carry the risk of losses owing to fluctuations in the underlying indexes or other benchmarks.Transactions involving foreign equities are subject to a domestic sales commission of up to 1.026% of the transaction amount (which equals the local transaction amount plus local fees and taxes in the case of a purchase or the local transaction amount minus local fees and taxes in the case of a sale) (for transaction amounts of ¥750,000 and below, maximum domestic sales commission is ¥7,668). Local fees and taxes in foreign financial instruments markets vary by country/territory. When foreign equities are purchased via OTC transactions (including offerings), only the purchase price shall be paid, with no sales commission charged. However, Nomura Securities may charge a separate fee for OTC transactions, as agreed with the customer. Foreign equities carry the risk of losses owing to factors such as price fluctuations and foreign exchange rate fluctuations.Margin transactions are subject to a sales commission of up to 1.404% of the transaction amount (or a commission of ¥2,808 for transactions of ¥200,000 or less), as well as management fees and rights handling fees. In addition, long margin transactions are subject to interest on the purchase amount, while short margin transactions are subject to fees for the lending of the shares borrowed. A margin equal to at least 30% of the transaction amount and at least ¥300,000 is required. With margin transactions, an amount up to roughly 3.3x the margin may be
traded. Margin transactions therefore carry the risk of losses in excess of the margin owing to share price fluctuations. For details, please thoroughly read the written materials provided, such as listed securities documents or documents delivered before making a contract.Transactions involving convertible bonds are subject to a sales commission of up to 1.08% of the transaction amount (or a commission of ¥4,320 if this would be less than ¥4,320). When convertible bonds are purchased via OTC transactions (including offerings), only the purchase price shall be paid, with no sales commission charged. However, Nomura Securities may charge a separate fee for OTC transactions, as agreed with the customer. Convertible bonds carry the risk of losses owing to factors such as interest rate fluctuations and price fluctuations in the underlying stock. In addition, convertible bonds denominated in foreign currencies also carry the risk of losses owing to factors such as foreign exchange rate fluctuations.When bonds are purchased via public offerings, secondary distributions, or other OTC transactions with Nomura Securities, only the purchase price shall be paid, with no sales commission charged. Bonds carry the risk of losses, as prices fluctuate in line with changes in market interest rates. Bond prices may also fall below the invested principal as a result of such factors as changes in the management and financial circumstances of the issuer, or changes in third-party valuations of the bond in question. In addition, foreign currency-denominated bonds also carry the risk of losses owing to factors such as foreign exchange rate fluctuations.When Japanese government bonds (JGBs) for individual investors are purchased via public offerings, only the purchase price shall be paid, with no sales commission charged. As a rule, JGBs for individual investors may not be sold in the first 12 months after issuance. When JGBs for individual investors are sold before maturity, an amount calculated via the following formula will be subtracted from the par value of the bond plus accrued interest: (1) for 10-year variable rate bonds, an amount equal to the two preceding coupon payments (before tax) x 0.79685 will be used, (2) for 5-year and 3-year fixed rate bonds, an amount equal to the two preceding coupon payments (before tax) x 0.79685 will be used.When inflation-indexed JGBs are purchased via public offerings, secondary distributions (uridashi deals), or other OTC transactions with Nomura Securities, only the purchase price shall be paid, with no sales commission charged. Inflation-indexed JGBs carry the risk of losses, as prices fluctuate in line with changes in market interest rates and fluctuations in the nationwide consumer price index.The notional principal of inflation-indexed JGBs changes in line with the rate of change in nationwide CPI inflation from the time of its issuance. The amount of the coupon payment is calculated by multiplying the coupon rate by the notional principal at the time of payment. The maturity value is the amount of the notional principal when the issue becomes due. For JI17 and subsequent issues, the maturity value shall not undercut the face amount.Purchases of investment trusts (and sales of some investment trusts) are subject to a purchase or sales fee of up to 5.4% of the transaction amount. Also, a direct cost that may be incurred when selling investment trusts is a fee of up to 2.0% of the unit price at the time of redemption. Indirect costs that may be incurred during the course of holding investment trusts include, for domestic investment trusts, an asset management fee (trust fee) of up to 5.4% (annualized basis) of the net assets in trust, as well as fees based on investment performance. Other indirect costs may also be incurred. For foreign investment trusts, indirect fees may be incurred during the course of holding such as investment company compensation.Investment trusts invest mainly in securities such as Japanese and foreign equities and bonds, whose prices fluctuate. Investment trust unit prices fluctuate owing to price fluctuations in the underlying assets and to foreign exchange rate fluctuations. As such, investment trusts carry the risk of losses. Fees and risks vary by investment trust. Maximum applicable fees are subject to change; please thoroughly read the written materials provided, such as prospectuses or documents delivered before making a contract.In interest rate swap transactions and USD/JPY basis swap transactions (“interest rate swap transactions, etc.”), only the agreed transaction payments shall be made on the settlement dates. Some interest rate swap transactions, etc. may require pledging of margin collateral. In some of these cases, transaction payments may exceed the amount of collateral. There shall be no advance notification of required collateral value or collateral ratios as they vary depending on the transaction. Interest rate swap transactions, etc. carry the risk of losses owing to fluctuations in market prices in the interest rate, currency and other markets, as well as reference indices. Losses incurred as such may exceed the value of margin collateral, in which case margin calls may be triggered. In the event that both parties agree to enter a replacement (or termination) transaction, the interest rates received (paid) under the new arrangement may differ from those in the original arrangement, even if terms other than the interest rates are identical to those in the original transaction. Risks vary by transaction. Please thoroughly read the written materials provided, such as documents delivered before making a contract and disclosure statements.In OTC transactions of credit default swaps (CDS), no sales commission will be charged. When entering into CDS transactions, the protection buyer will be required to pledge or entrust an agreed amount of margin collateral. In some of these cases, the transaction payments may exceed the amount of margin collateral. There shall be no advance notification of required collateral value or collateral ratios as they vary depending on the financial position of the protection buyer. CDS transactions carry the risk of losses owing to changes in the credit position of some or all of the referenced entities, and/or fluctuations of the interest rate market. The amount the protection buyer receives in the event that the CDS is triggered by a credit event may undercut the total amount of premiums that he/she has paid in the course of the transaction. Similarly, the amount the protection seller pays in the event of a credit event may exceed the total amount of premiums that he/she has received in the transaction. All other conditions being equal, the amount of premiums that the protection buyer pays and that received by the protection seller shall differ. In principle, CDS transactions will be limited to financial instruments business operators and qualified institutional investors.No account fee will be charged for marketable securities or monies deposited. Transfers of equities to another securities company via the Japan Securities Depository Center are subject to a transfer fee of up to ¥10,800 per issue transferred depending on volume.
Nomura Securities Co., Ltd.Financial instruments firm registered with the Kanto Local Finance Bureau (registration No. 142)Member associations: Japan Securities Dealers Association; Japan Investment Advisers Association; The Financial Futures Association of Japan; and Type II Financial Instruments Firms Association.
Nomura Group manages conflicts with respect to the production of research through its compliance policies and procedures (including, but not limited to, Conflicts of Interest, Chinese Wall and Confidentiality policies) as well as through the maintenance of Chinese walls and employee training.Additional information is available upon request and disclosure information is available at the Nomura Disclosure web page:http://go.nomuranow.com/research/globalresearchportal/pages/disclosures/disclosures.aspxCopyright © 2015 Nomura Securities Co., Ltd. All rights reserved.
Disclosures as of 06-Apr-2015.