japan economics weekly 2011 12
TRANSCRIPT
8/3/2019 Japan Economics Weekly 2011 12
http://slidepdf.com/reader/full/japan-economics-weekly-2011-12 1/26
ANALYST CERTIFICATIONS AND IMPORTANT DISCLOSURES ARE IN THE DISCLOSURE APPENDIX. FOR OTHER
IMPORTANT DISCLOSURES, PLEASE REFER TO https://firesearchdisclosure.credit-suisse.com .
Japan Economics Weekly
Focus of the week················································ ·2
Economic outlook into 2013We forecast real GDP growth to return to plus mid-1% territory into 2013following a 0.8% contraction in 2011. We continue to believe the probability islow that the country’s trend real GDP growth rate, which is around +0.8%, willpick up materially in the foreseeable future, as the authorities remain focusedon gradual fiscal tightening aimed at maintaining the social security system’sstatus quo.
Business cycle update ······································· ·12
December BoJ Tankan Survey showed deterioration of businesssentiment
Money and credit update ··································· ·19 Money stock continued to grow in November
Upcoming Indicators/Events
Major Economic Data
Japan Economic Forecasts
15 December 2011Economics Research
http://www.credit-suisse.com/researchandanalytics
Research Analysts
Hiromichi Shirakawa+ 81 3 4550 7117
Takashi Shiono+81 3 4550 7189
8/3/2019 Japan Economics Weekly 2011 12
http://slidepdf.com/reader/full/japan-economics-weekly-2011-12 2/26
15 December 2011
Japan Economics Weekly 2
Focus of the weekEconomic outlook into 2013
• We forecast real GDP growth to return to plus mid-1% territory into 2013following a 0.8% contraction in 2011
• We continue to believe the probability is low that the country’s trend real GDPgrowth rate, which is around +0.8%, will pick up materially in the foreseeablefuture, as the authorities remain focused on gradual fiscal tightening aimed atmaintaining the social security system’s status quo
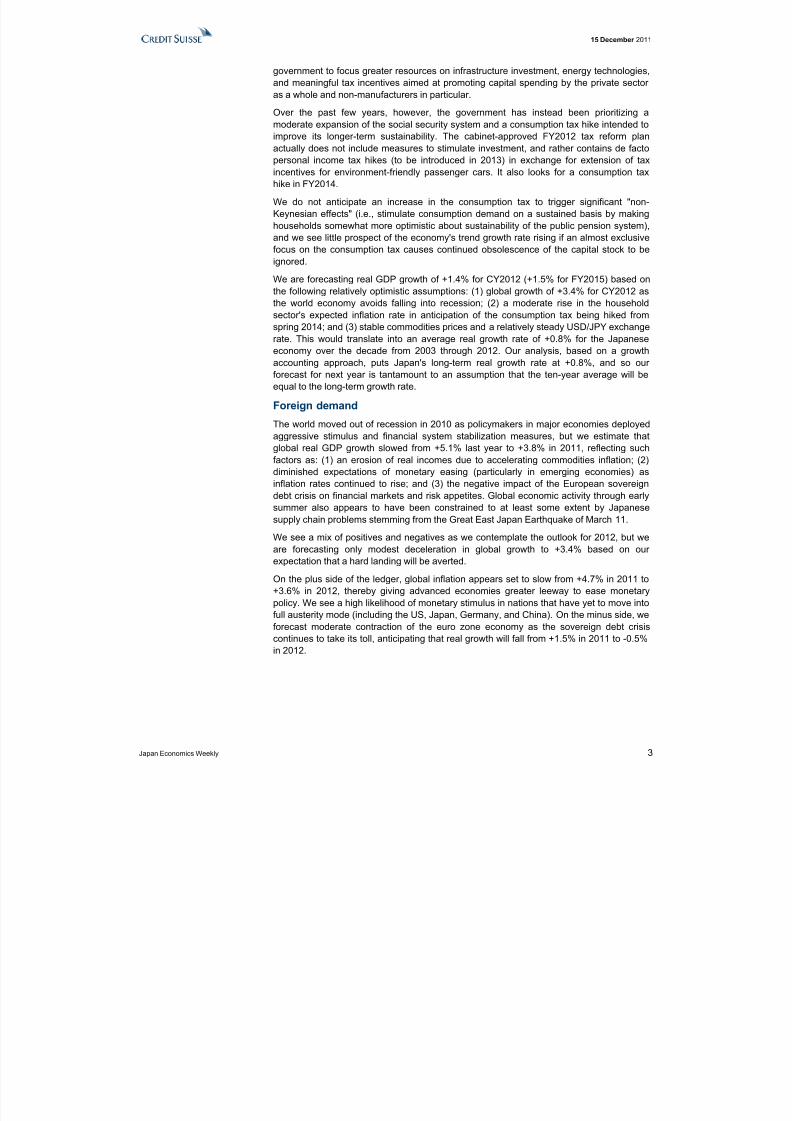
OverviewStrong foreign demand ledJapan out of a cyclical troughfrom 1Q 2009 onward, butthe domestic economymoved back into contractionmode following the GreatEast Japan Earthquake of March 11, with continuedappreciation of the yen alsoweighing on activity. RealGDP for 2Q 2011 was downmore than 2% from the pre-quake (4Q 2010) peak, andeven a 1.4% increase in 3Q2011 still left price-adjustedGDP down some 3.9% fromthe previous cyclical high in1Q 2008. We expect to see another small contraction in real GDP in the final quarter of
this year, which would translate into contraction of 0.8% for 2011 as a whole.Even more troubling is a continuing decline in Japanese nominal GDP, which could havemajor ramifications for asset prices and longer-term fiscal sustainability. Nominal GDPincreased to almost ¥515 trillion in 2Q 2007, but has followed a downward trajectory ever since, dropping below ¥470 trillion in 3Q 2011. Continued shrinkage during 4Q wouldtranslate into a substantial 2.8% contraction for 2011. Although this would be significantlybetter than the 6% fall in 2009, it is nevertheless worrying to see negative nominal growthfor three of the past four calendar years.
Public works spending and residential investment are back on the rise as a consequenceof post-quake reconstruction, and the surprisingly rapid restoration of supply chains hashelped to prevent exports from falling through the floor. GDP continues to contract,however, due to the greater impact of increased imports (a reflection of higher energy
prices), weak consumer spending, and sluggish corporate capex. Ongoing industrial"hollowing out" has reduced the need for manufacturers to invest domestically, and fuelimports have also increased in volume terms owing to deterioration in energy efficiency.
We attribute much of Japan's present woes to a continued decline in investment.Contraction of combined public- and private-sector investment ─ including spending onpower plants ─ hastens the pace of capital stock obsolescence (increases the averagevintage of capital), thereby reducing productivity and depressing the economy's trendgrowth rate, in our view. This creates a vicious cycle in which declines in the (domestic)income of households and firms cause the government's fiscal position to worsen, which inturn impacts on sentiment to the point where households and firms become reluctant toloosen their purse strings. In our view, breaking out of this cycle will require the
Exhibit 1: Real and nominal GDP growth
0.2
-0.6
2.3
-2.8
1.61.4
-0.8
4.4
-4.0-3.0-2.0-1.00.01.0
2.03.04.05.0
2 0 1 0 ( a )
2 0 1 1 ( p )
2 0 1 2 ( e )
2 0 1 3 ( e )
Nominal GDP Real GDP
Source: Cabinet office, Credit Suisse
8/3/2019 Japan Economics Weekly 2011 12
http://slidepdf.com/reader/full/japan-economics-weekly-2011-12 3/26
15 December 2011
Japan Economics Weekly 3
government to focus greater resources on infrastructure investment, energy technologies,and meaningful tax incentives aimed at promoting capital spending by the private sector as a whole and non-manufacturers in particular.
Over the past few years, however, the government has instead been prioritizing amoderate expansion of the social security system and a consumption tax hike intended toimprove its longer-term sustainability. The cabinet-approved FY2012 tax reform plan
actually does not include measures to stimulate investment, and rather contains de factopersonal income tax hikes (to be introduced in 2013) in exchange for extension of taxincentives for environment-friendly passenger cars. It also looks for a consumption taxhike in FY2014.
We do not anticipate an increase in the consumption tax to trigger significant "non-Keynesian effects" (i.e., stimulate consumption demand on a sustained basis by makinghouseholds somewhat more optimistic about sustainability of the public pension system),and we see little prospect of the economy's trend growth rate rising if an almost exclusivefocus on the consumption tax causes continued obsolescence of the capital stock to beignored.
We are forecasting real GDP growth of +1.4% for CY2012 (+1.5% for FY2015) based onthe following relatively optimistic assumptions: (1) global growth of +3.4% for CY2012 as
the world economy avoids falling into recession; (2) a moderate rise in the householdsector's expected inflation rate in anticipation of the consumption tax being hiked fromspring 2014; and (3) stable commodities prices and a relatively steady USD/JPY exchangerate. This would translate into an average real growth rate of +0.8% for the Japaneseeconomy over the decade from 2003 through 2012. Our analysis, based on a growthaccounting approach, puts Japan's long-term real growth rate at +0.8%, and so our forecast for next year is tantamount to an assumption that the ten-year average will beequal to the long-term growth rate.
Foreign demand
The world moved out of recession in 2010 as policymakers in major economies deployedaggressive stimulus and financial system stabilization measures, but we estimate thatglobal real GDP growth slowed from +5.1% last year to +3.8% in 2011, reflecting suchfactors as: (1) an erosion of real incomes due to accelerating commodities inflation; (2)diminished expectations of monetary easing (particularly in emerging economies) asinflation rates continued to rise; and (3) the negative impact of the European sovereigndebt crisis on financial markets and risk appetites. Global economic activity through earlysummer also appears to have been constrained to at least some extent by Japanesesupply chain problems stemming from the Great East Japan Earthquake of March 11.
We see a mix of positives and negatives as we contemplate the outlook for 2012, but weare forecasting only modest deceleration in global growth to +3.4% based on our expectation that a hard landing will be averted.
On the plus side of the ledger, global inflation appears set to slow from +4.7% in 2011 to+3.6% in 2012, thereby giving advanced economies greater leeway to ease monetary
policy. We see a high likelihood of monetary stimulus in nations that have yet to move intofull austerity mode (including the US, Japan, Germany, and China). On the minus side, weforecast moderate contraction of the euro zone economy as the sovereign debt crisiscontinues to take its toll, anticipating that real growth will fall from +1.5% in 2011 to -0.5%in 2012.
8/3/2019 Japan Economics Weekly 2011 12
http://slidepdf.com/reader/full/japan-economics-weekly-2011-12 4/26
15 December 2011
Japan Economics Weekly 4
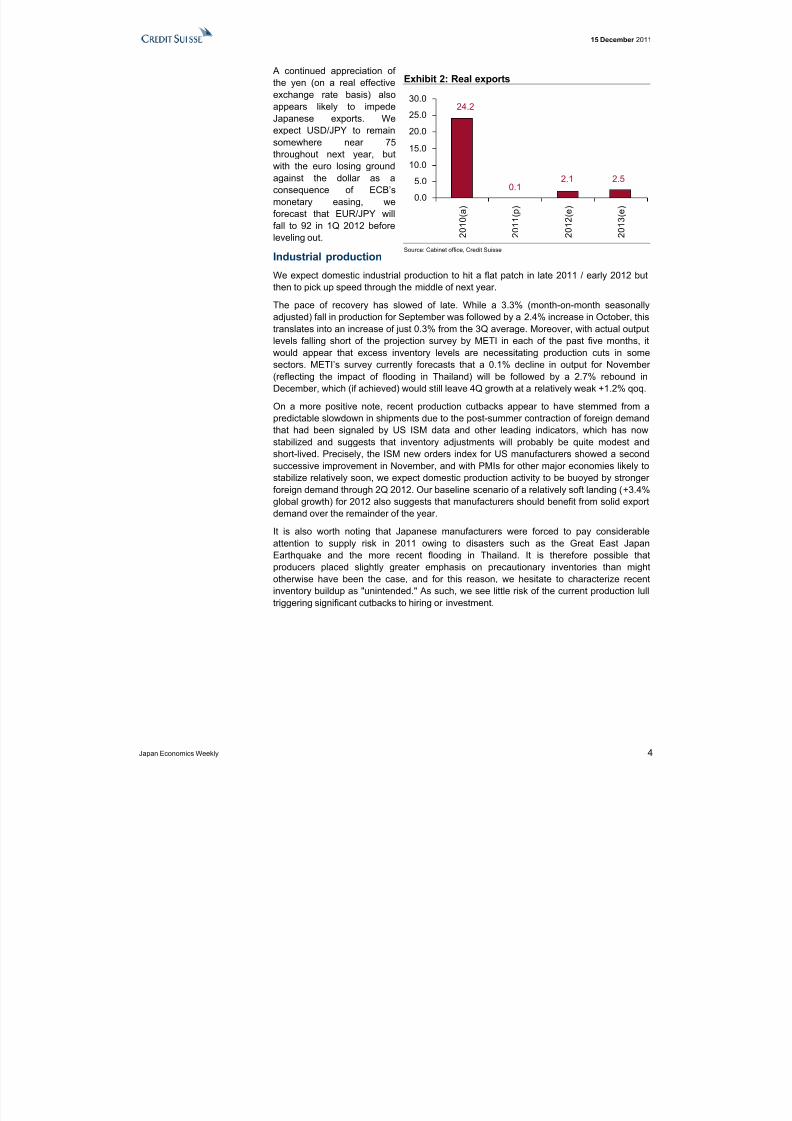
A continued appreciation of the yen (on a real effectiveexchange rate basis) alsoappears likely to impedeJapanese exports. Weexpect USD/JPY to remainsomewhere near 75throughout next year, butwith the euro losing groundagainst the dollar as aconsequence of ECB’smonetary easing, weforecast that EUR/JPY willfall to 92 in 1Q 2012 beforeleveling out.
Industrial production
We expect domestic industrial production to hit a flat patch in late 2011 / early 2012 butthen to pick up speed through the middle of next year.
The pace of recovery has slowed of late. While a 3.3% (month-on-month seasonallyadjusted) fall in production for September was followed by a 2.4% increase in October, thistranslates into an increase of just 0.3% from the 3Q average. Moreover, with actual outputlevels falling short of the projection survey by METI in each of the past five months, itwould appear that excess inventory levels are necessitating production cuts in somesectors. METI’s survey currently forecasts that a 0.1% decline in output for November (reflecting the impact of flooding in Thailand) will be followed by a 2.7% rebound inDecember, which (if achieved) would still leave 4Q growth at a relatively weak +1.2% qoq.
On a more positive note, recent production cutbacks appear to have stemmed from apredictable slowdown in shipments due to the post-summer contraction of foreign demandthat had been signaled by US ISM data and other leading indicators, which has nowstabilized and suggests that inventory adjustments will probably be quite modest and
short-lived. Precisely, the ISM new orders index for US manufacturers showed a secondsuccessive improvement in November, and with PMIs for other major economies likely tostabilize relatively soon, we expect domestic production activity to be buoyed by stronger foreign demand through 2Q 2012. Our baseline scenario of a relatively soft landing (+3.4%global growth) for 2012 also suggests that manufacturers should benefit from solid exportdemand over the remainder of the year.
It is also worth noting that Japanese manufacturers were forced to pay considerableattention to supply risk in 2011 owing to disasters such as the Great East JapanEarthquake and the more recent flooding in Thailand. It is therefore possible thatproducers placed slightly greater emphasis on precautionary inventories than mightotherwise have been the case, and for this reason, we hesitate to characterize recentinventory buildup as "unintended." As such, we see little risk of the current production lull
triggering significant cutbacks to hiring or investment.
Exhibit 2: Real exports
2.52.1
24.2
0.10.0
5.0
10.015.0
20.0
25.0
30.0
2 0 1 0 ( a )
2 0 1 1 ( p )
2 0 1 2 ( e )
2 0 1 3 ( e )
Source: Cabinet office, Credit Suisse
8/3/2019 Japan Economics Weekly 2011 12
http://slidepdf.com/reader/full/japan-economics-weekly-2011-12 5/26
15 December 2011
Japan Economics Weekly 5
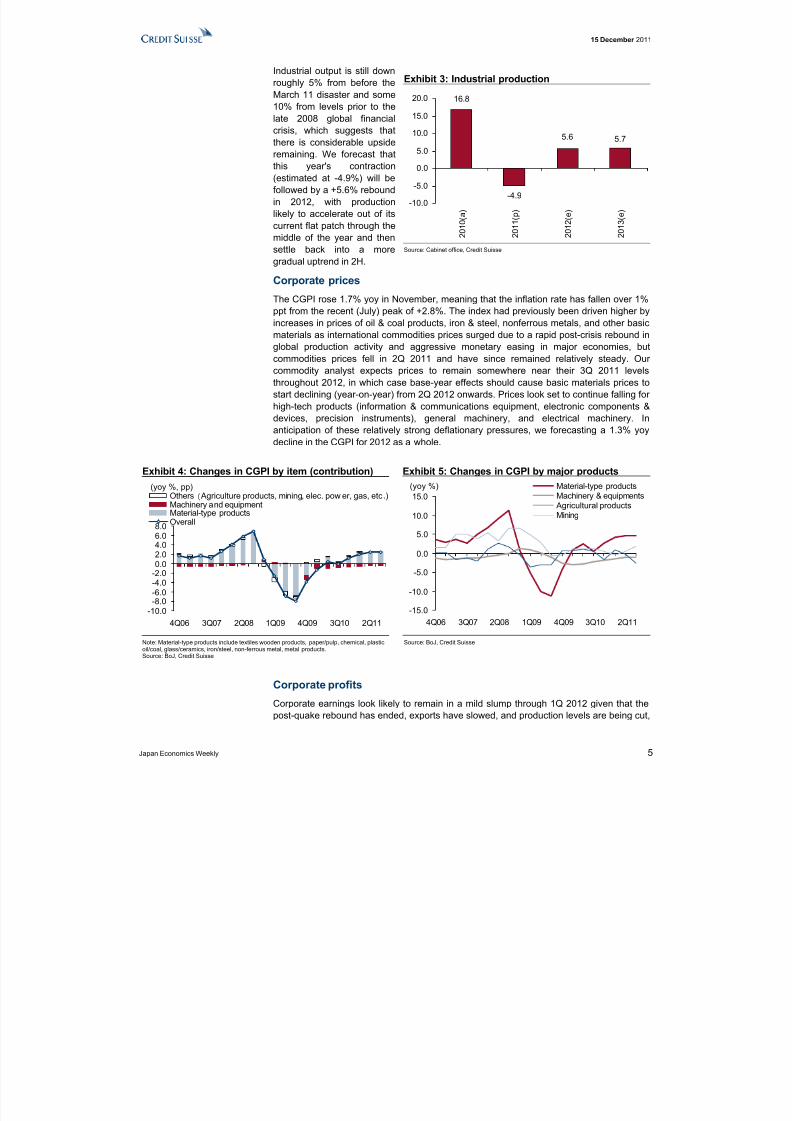
Industrial output is still downroughly 5% from before theMarch 11 disaster and some10% from levels prior to thelate 2008 global financialcrisis, which suggests thatthere is considerable upsideremaining. We forecast thatthis year's contraction(estimated at -4.9%) will befollowed by a +5.6% reboundin 2012, with productionlikely to accelerate out of itscurrent flat patch through themiddle of the year and thensettle back into a moregradual uptrend in 2H.
Corporate prices
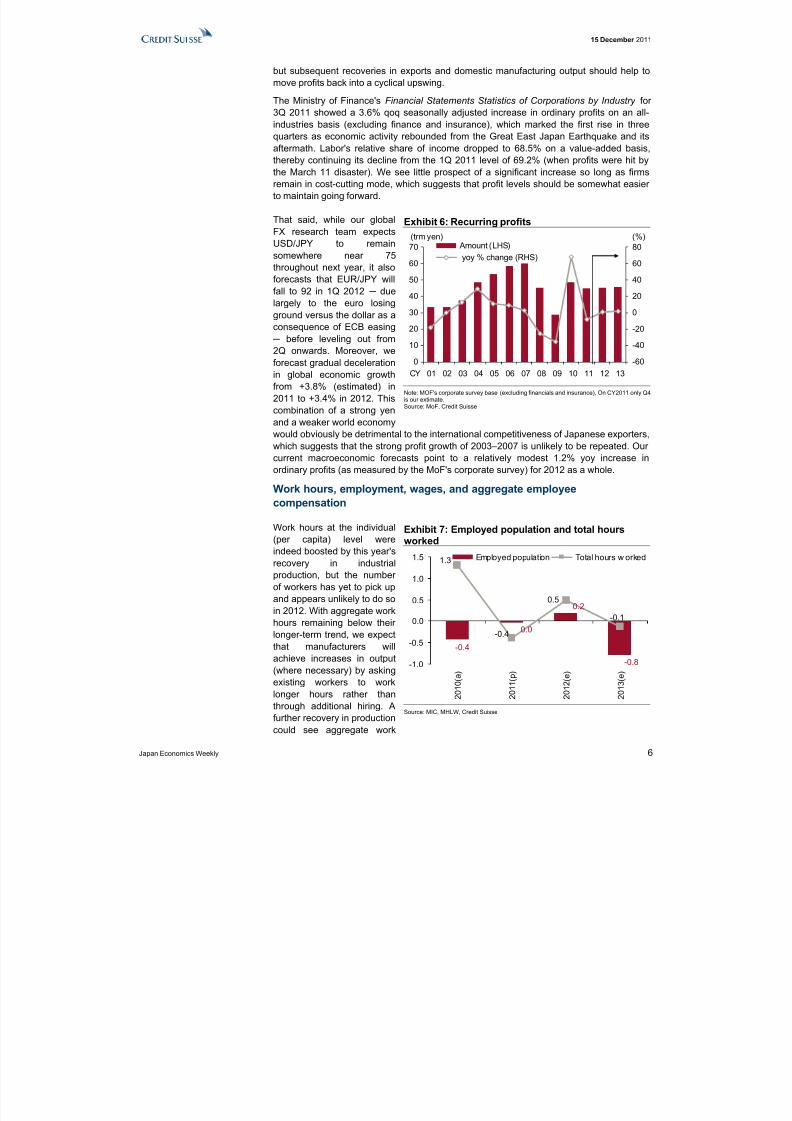
The CGPI rose 1.7% yoy in November, meaning that the inflation rate has fallen over 1%ppt from the recent (July) peak of +2.8%. The index had previously been driven higher byincreases in prices of oil & coal products, iron & steel, nonferrous metals, and other basicmaterials as international commodities prices surged due to a rapid post-crisis rebound inglobal production activity and aggressive monetary easing in major economies, butcommodities prices fell in 2Q 2011 and have since remained relatively steady. Our commodity analyst expects prices to remain somewhere near their 3Q 2011 levelsthroughout 2012, in which case base-year effects should cause basic materials prices tostart declining (year-on-year) from 2Q 2012 onwards. Prices look set to continue falling for high-tech products (information & communications equipment, electronic components &devices, precision instruments), general machinery, and electrical machinery. Inanticipation of these relatively strong deflationary pressures, we forecasting a 1.3% yoydecline in the CGPI for 2012 as a whole.
Exhibit 4: Changes in CGPI by item (contribution) Exhibit 5: Changes in CGPI by major products
-10.0-8.0-6.0-4.0-2.00.02.04.06.08.0
4Q06 3Q07 2Q08 1Q09 4Q09 3Q10 2Q11
Others Agriculture products, mining, elec. pow er, gas, etc .)Machinery and equipmentMaterial-type productsOverall
(yoy %, pp)
-15.0
-10.0
-5.0
0.0
5.0
10.0
15.0
4Q06 3Q07 2Q08 1Q09 4Q09 3Q10 2Q11
Material-type productsMachinery & equipmentsAgricultural productsMining
(yoy %)
Note: Material-type products include textiles wooden products, paper/pulp, chemical, plastic,oil/coal, glass/ceramics, iron/steel, non-ferrous metal, metal products.Source: BoJ, Credit Suisse
Source: BoJ, Credit Suisse
Corporate profits
Corporate earnings look likely to remain in a mild slump through 1Q 2012 given that thepost-quake rebound has ended, exports have slowed, and production levels are being cut,
Exhibit 3: Industrial production
-4.9
16.8
5.6 5.7
-10.0
-5.0
0.0
5.0
10.0
15.0
20.0
2 0 1 0 ( a )
2 0 1 1 ( p )
2 0 1 2 ( e )
2 0 1 3 ( e )
Source: Cabinet office, Credit Suisse
8/3/2019 Japan Economics Weekly 2011 12
http://slidepdf.com/reader/full/japan-economics-weekly-2011-12 6/26
15 December 2011
Japan Economics Weekly 6
but subsequent recoveries in exports and domestic manufacturing output should help tomove profits back into a cyclical upswing.
The Ministry of Finance's Financial Statements Statistics of Corporations by Industry for 3Q 2011 showed a 3.6% qoq seasonally adjusted increase in ordinary profits on an all-industries basis (excluding finance and insurance), which marked the first rise in threequarters as economic activity rebounded from the Great East Japan Earthquake and its
aftermath. Labor's relative share of income dropped to 68.5% on a value-added basis,thereby continuing its decline from the 1Q 2011 level of 69.2% (when profits were hit bythe March 11 disaster). We see little prospect of a significant increase so long as firmsremain in cost-cutting mode, which suggests that profit levels should be somewhat easier to maintain going forward.
That said, while our globalFX research team expectsUSD/JPY to remainsomewhere near 75throughout next year, it alsoforecasts that EUR/JPY willfall to 92 in 1Q 2012 ─ due
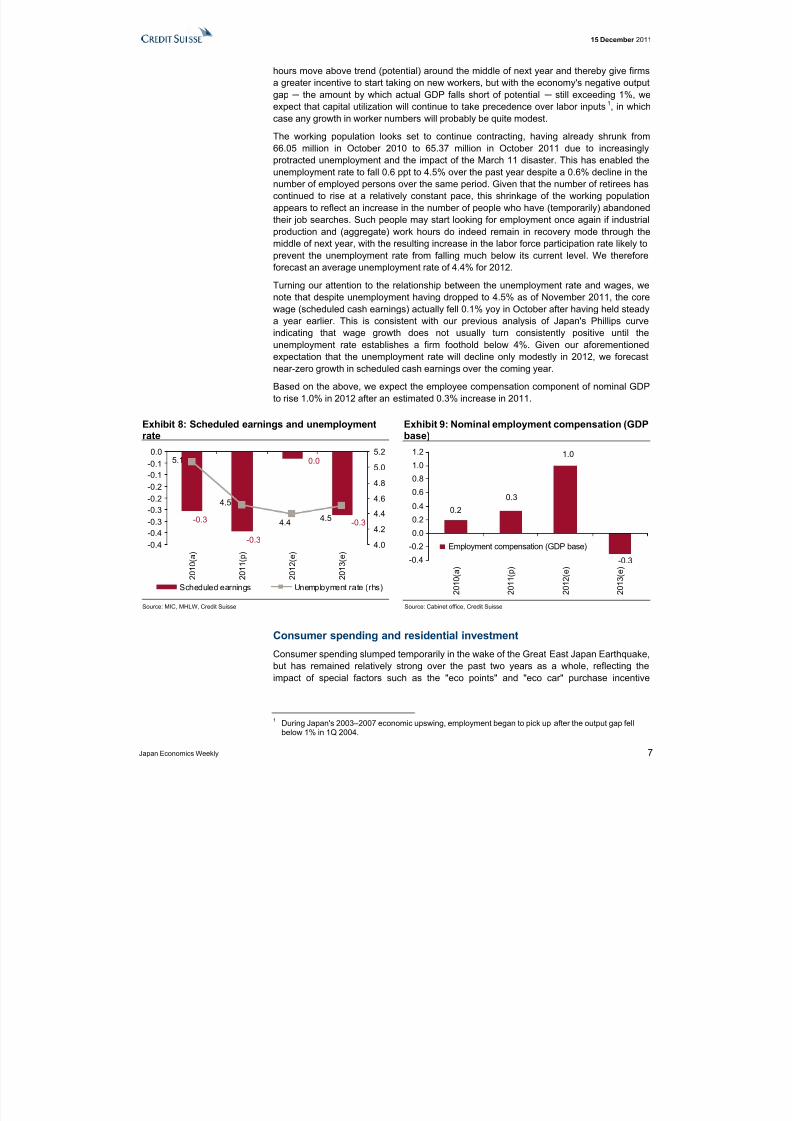
largely to the euro losingground versus the dollar as aconsequence of ECB easing ─ before leveling out from2Q onwards. Moreover, weforecast gradual decelerationin global economic growthfrom +3.8% (estimated) in2011 to +3.4% in 2012. Thiscombination of a strong yenand a weaker world economywould obviously be detrimental to the international competitiveness of Japanese exporters,which suggests that the strong profit growth of 2003–2007 is unlikely to be repeated. Our current macroeconomic forecasts point to a relatively modest 1.2% yoy increase inordinary profits (as measured by the MoF's corporate survey) for 2012 as a whole.
Work hours, employment, wages, and aggregate employeecompensation
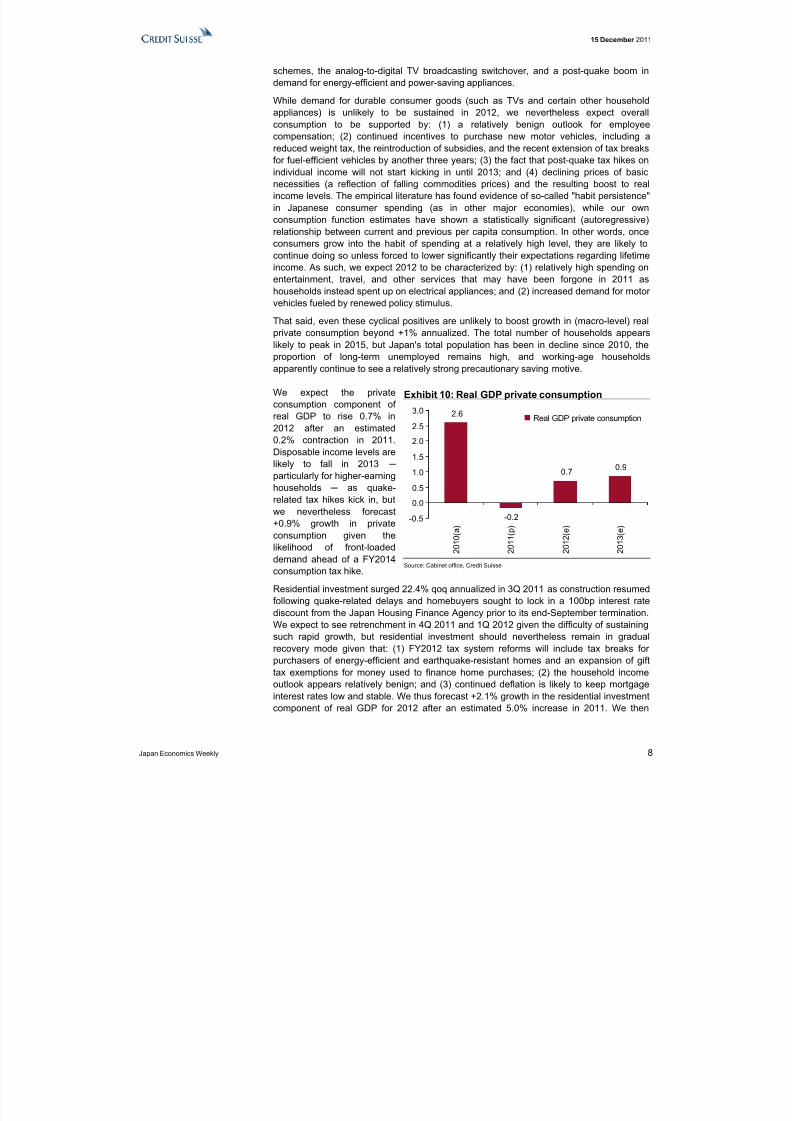
Work hours at the individual(per capita) level wereindeed boosted by this year'srecovery in industrialproduction, but the number of workers has yet to pick upand appears unlikely to do soin 2012. With aggregate workhours remaining below their longer-term trend, we expectthat manufacturers willachieve increases in output(where necessary) by askingexisting workers to worklonger hours rather thanthrough additional hiring. Afurther recovery in productioncould see aggregate work
Exhibit 6: Recurring profits
0
10
20
30
40
50
60
70
01 02 03 04 05 06 07 08 09 10 11 12 13-60
-40
-20
0
20
40
60
80Amount (LHS)yoy % change (RHS)
(trm yen) (%)
CY
Note: MOF's corporate survey base (excluding financials and insurance), On CY2011 only Q4is our extimate.Source: MoF, Credit Suisse
Exhibit 7: Employed population and total hoursworked
0.0
-0.4
0.2
-0.8
1.3
-0.4
0.5
-0.1
-1.0
-0.5
0.0
0.5
1.0
1.5
2 0 1 0 ( a )
2 0 1 1 ( p )
2 0 1 2 ( e )
2 0 1 3 ( e )
Employed population Total hours w orked
Source: MIC, MHLW, Credit Suisse
8/3/2019 Japan Economics Weekly 2011 12
http://slidepdf.com/reader/full/japan-economics-weekly-2011-12 7/26
15 December 2011
Japan Economics Weekly 7
hours move above trend (potential) around the middle of next year and thereby give firmsa greater incentive to start taking on new workers, but with the economy's negative outputgap ─ the amount by which actual GDP falls short of potential ─ still exceeding 1%, weexpect that capital utilization will continue to take precedence over labor inputs 1, in whichcase any growth in worker numbers will probably be quite modest.
The working population looks set to continue contracting, having already shrunk from
66.05 million in October 2010 to 65.37 million in October 2011 due to increasinglyprotracted unemployment and the impact of the March 11 disaster. This has enabled theunemployment rate to fall 0.6 ppt to 4.5% over the past year despite a 0.6% decline in thenumber of employed persons over the same period. Given that the number of retirees hascontinued to rise at a relatively constant pace, this shrinkage of the working populationappears to reflect an increase in the number of people who have (temporarily) abandonedtheir job searches. Such people may start looking for employment once again if industrialproduction and (aggregate) work hours do indeed remain in recovery mode through themiddle of next year, with the resulting increase in the labor force participation rate likely toprevent the unemployment rate from falling much below its current level. We thereforeforecast an average unemployment rate of 4.4% for 2012.
Turning our attention to the relationship between the unemployment rate and wages, wenote that despite unemployment having dropped to 4.5% as of November 2011, the corewage (scheduled cash earnings) actually fell 0.1% yoy in October after having held steadya year earlier. This is consistent with our previous analysis of Japan's Phillips curveindicating that wage growth does not usually turn consistently positive until theunemployment rate establishes a firm foothold below 4%. Given our aforementionedexpectation that the unemployment rate will decline only modestly in 2012, we forecastnear-zero growth in scheduled cash earnings over the coming year.
Based on the above, we expect the employee compensation component of nominal GDPto rise 1.0% in 2012 after an estimated 0.3% increase in 2011.
Exhibit 8: Scheduled earnings and unemploymentrate
Exhibit 9: Nominal employment compensation (GDPbase)
-0.3
0.0
-0.3
-0.3
4.54.4
4.5
5.1
-0.4-0.4-0.3-0.3-0.2-0.2-0.1-0.10.0
2 0 1 0 ( a )
2 0 1 1 ( p )
2 0 1 2 ( e )
2 0 1 3 ( e )
4.0
4.2
4.4
4.6
4.8
5.05.2
Scheduled earnings Unemployment rate (rhs)
0.3
0.2
1.0
-0.3-0.4
-0.2
0.0
0.2
0.4
0.6
0.8
1.01.2
2 0 1 0 ( a )
2 0 1 1 ( p )
2 0 1 2 ( e )
2 0 1 3 ( e )
Employment compensation (GDP base)
Source: MIC, MHLW, Credit Suisse Source: Cabinet office, Credit Suisse
Consumer spending and residential investment
Consumer spending slumped temporarily in the wake of the Great East Japan Earthquake,but has remained relatively strong over the past two years as a whole, reflecting theimpact of special factors such as the "eco points" and "eco car" purchase incentive
1 During Japan's 2003–2007 economic upswing, employment began to pick up after the output gap fellbelow 1% in 1Q 2004.
8/3/2019 Japan Economics Weekly 2011 12
http://slidepdf.com/reader/full/japan-economics-weekly-2011-12 8/26
15 December 2011
Japan Economics Weekly 8
schemes, the analog-to-digital TV broadcasting switchover, and a post-quake boom indemand for energy-efficient and power-saving appliances.
While demand for durable consumer goods (such as TVs and certain other householdappliances) is unlikely to be sustained in 2012, we nevertheless expect overallconsumption to be supported by: (1) a relatively benign outlook for employeecompensation; (2) continued incentives to purchase new motor vehicles, including a
reduced weight tax, the reintroduction of subsidies, and the recent extension of tax breaksfor fuel-efficient vehicles by another three years; (3) the fact that post-quake tax hikes onindividual income will not start kicking in until 2013; and (4) declining prices of basicnecessities (a reflection of falling commodities prices) and the resulting boost to realincome levels. The empirical literature has found evidence of so-called "habit persistence"in Japanese consumer spending (as in other major economies), while our ownconsumption function estimates have shown a statistically significant (autoregressive)relationship between current and previous per capita consumption. In other words, onceconsumers grow into the habit of spending at a relatively high level, they are likely tocontinue doing so unless forced to lower significantly their expectations regarding lifetimeincome. As such, we expect 2012 to be characterized by: (1) relatively high spending onentertainment, travel, and other services that may have been forgone in 2011 ashouseholds instead spent up on electrical appliances; and (2) increased demand for motor
vehicles fueled by renewed policy stimulus.That said, even these cyclical positives are unlikely to boost growth in (macro-level) realprivate consumption beyond +1% annualized. The total number of households appearslikely to peak in 2015, but Japan's total population has been in decline since 2010, theproportion of long-term unemployed remains high, and working-age householdsapparently continue to see a relatively strong precautionary saving motive.
We expect the privateconsumption component of real GDP to rise 0.7% in2012 after an estimated0.2% contraction in 2011.
Disposable income levels arelikely to fall in 2013 ─ particularly for higher-earninghouseholds ─ as quake-related tax hikes kick in, butwe nevertheless forecast+0.9% growth in privateconsumption given thelikelihood of front-loadeddemand ahead of a FY2014consumption tax hike.
Residential investment surged 22.4% qoq annualized in 3Q 2011 as construction resumedfollowing quake-related delays and homebuyers sought to lock in a 100bp interest ratediscount from the Japan Housing Finance Agency prior to its end-September termination.We expect to see retrenchment in 4Q 2011 and 1Q 2012 given the difficulty of sustainingsuch rapid growth, but residential investment should nevertheless remain in gradualrecovery mode given that: (1) FY2012 tax system reforms will include tax breaks for purchasers of energy-efficient and earthquake-resistant homes and an expansion of gifttax exemptions for money used to finance home purchases; (2) the household incomeoutlook appears relatively benign; and (3) continued deflation is likely to keep mortgageinterest rates low and stable. We thus forecast +2.1% growth in the residential investmentcomponent of real GDP for 2012 after an estimated 5.0% increase in 2011. We then
Exhibit 10: Real GDP private consumption
2.6
-0.2
0.7 0.9
-0.5
0.0
0.5
1.0
1.5
2.0
2.5
3.0
2 0 1 0 ( a )
2 0 1 1 ( p )
2 0 1 2 ( e )
2 0 1 3 ( e )
Real GDP private consumption
Source: Cabinet office, Credit Suisse
8/3/2019 Japan Economics Weekly 2011 12
http://slidepdf.com/reader/full/japan-economics-weekly-2011-12 9/26
15 December 2011
Japan Economics Weekly 9
expect to see a further 2.7% increase in 2013 as construction activity is accelerated aheadof a FY2014 consumption tax hike.
Corporate capex
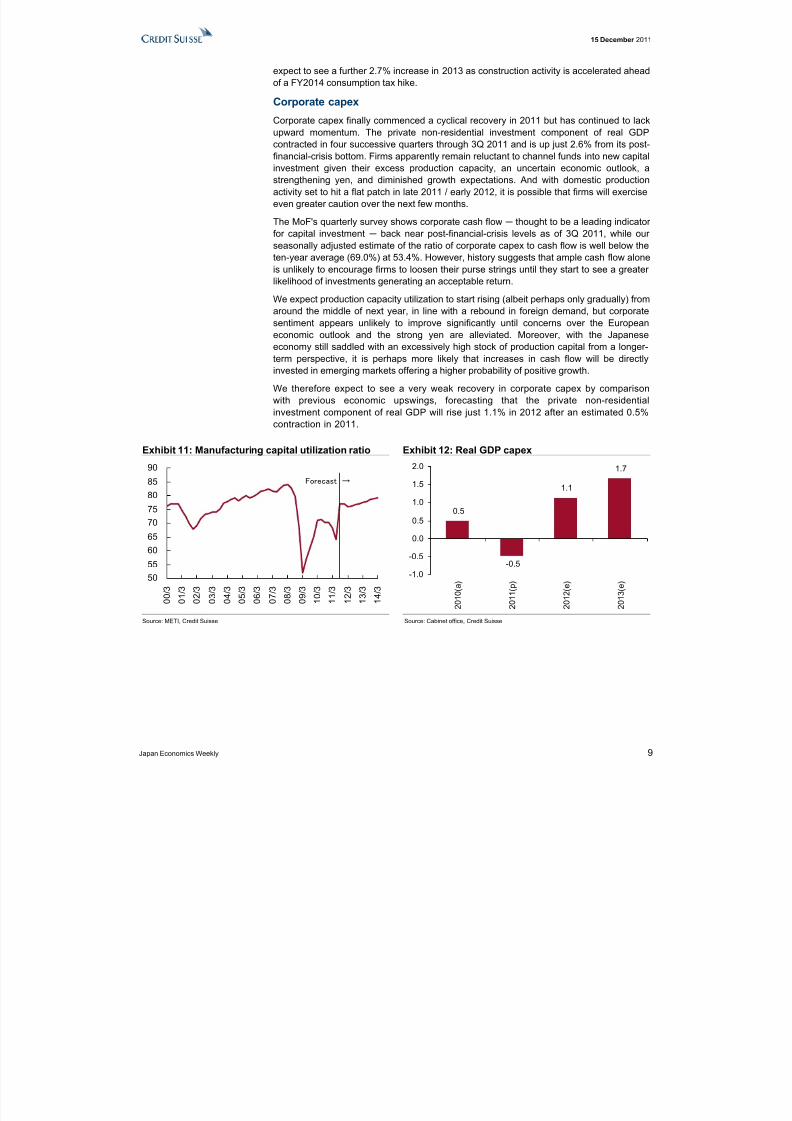
Corporate capex finally commenced a cyclical recovery in 2011 but has continued to lackupward momentum. The private non-residential investment component of real GDPcontracted in four successive quarters through 3Q 2011 and is up just 2.6% from its post-financial-crisis bottom. Firms apparently remain reluctant to channel funds into new capitalinvestment given their excess production capacity, an uncertain economic outlook, astrengthening yen, and diminished growth expectations. And with domestic productionactivity set to hit a flat patch in late 2011 / early 2012, it is possible that firms will exerciseeven greater caution over the next few months.
The MoF's quarterly survey shows corporate cash flow ─ thought to be a leading indicator for capital investment ─ back near post-financial-crisis levels as of 3Q 2011, while our seasonally adjusted estimate of the ratio of corporate capex to cash flow is well below theten-year average (69.0%) at 53.4%. However, history suggests that ample cash flow aloneis unlikely to encourage firms to loosen their purse strings until they start to see a greater likelihood of investments generating an acceptable return.
We expect production capacity utilization to start rising (albeit perhaps only gradually) fromaround the middle of next year, in line with a rebound in foreign demand, but corporatesentiment appears unlikely to improve significantly until concerns over the Europeaneconomic outlook and the strong yen are alleviated. Moreover, with the Japaneseeconomy still saddled with an excessively high stock of production capital from a longer-term perspective, it is perhaps more likely that increases in cash flow will be directlyinvested in emerging markets offering a higher probability of positive growth.
We therefore expect to see a very weak recovery in corporate capex by comparisonwith previous economic upswings, forecasting that the private non-residentialinvestment component of real GDP will rise just 1.1% in 2012 after an estimated 0.5%contraction in 2011.
Exhibit 11: Manufacturing capital utilization ratio Exhibit 12: Real GDP capex
5055
6065
7075
8085
90
0 0 / 3
0 1 / 3
0 2 / 3
0 3 / 3
0 4 / 3
0 5 / 3
0 6 / 3
0 7 / 3
0 8 / 3
0 9 / 3
1 0 / 3
1 1 / 3
1 2 / 3
1 3 / 3
1 4 / 3
Forecast →
0.5
-0.5
1.1
1.7
-1.0
-0.5
0.0
0.5
1.0
1.5
2.0
2 0 1 0 ( a )
2 0 1 1 ( p )
2 0 1 2 ( e )
2 0 1 3 ( e )
Source: METI, Credit Suisse Source: Cabinet office, Credit Suisse
8/3/2019 Japan Economics Weekly 2011 12
http://slidepdf.com/reader/full/japan-economics-weekly-2011-12 10/26
15 December 2011
Japan Economics Weekly 10
Consumer prices
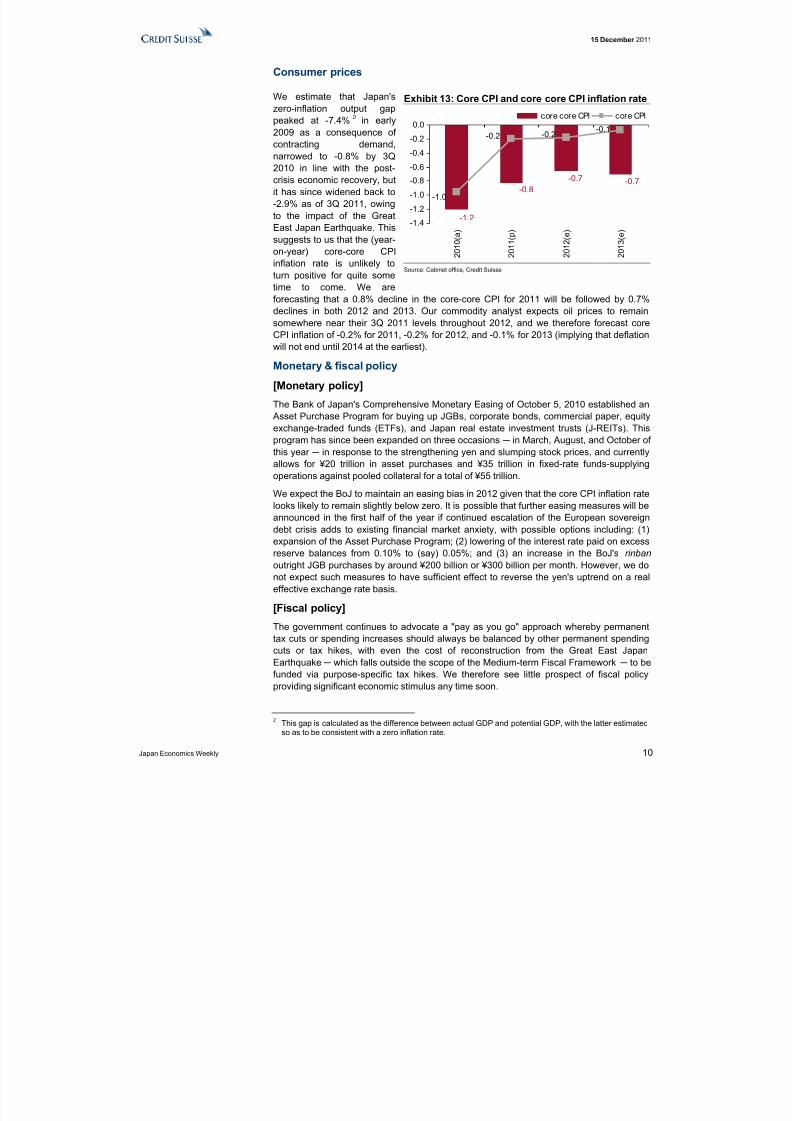
We estimate that Japan'szero-inflation output gappeaked at -7.4% 2 in early2009 as a consequence of contracting demand,narrowed to -0.8% by 3Q2010 in line with the post-crisis economic recovery, butit has since widened back to-2.9% as of 3Q 2011, owingto the impact of the GreatEast Japan Earthquake. Thissuggests to us that the (year-on-year) core-core CPIinflation rate is unlikely toturn positive for quite sometime to come. We are
forecasting that a 0.8% decline in the core-core CPI for 2011 will be followed by 0.7%declines in both 2012 and 2013. Our commodity analyst expects oil prices to remainsomewhere near their 3Q 2011 levels throughout 2012, and we therefore forecast coreCPI inflation of -0.2% for 2011, -0.2% for 2012, and -0.1% for 2013 (implying that deflationwill not end until 2014 at the earliest).
Monetary & fiscal policy
[Monetary policy]
The Bank of Japan's Comprehensive Monetary Easing of October 5, 2010 established anAsset Purchase Program for buying up JGBs, corporate bonds, commercial paper, equityexchange-traded funds (ETFs), and Japan real estate investment trusts (J-REITs). Thisprogram has since been expanded on three occasions ─ in March, August, and October of
this year ─ in response to the strengthening yen and slumping stock prices, and currentlyallows for ¥20 trillion in asset purchases and ¥35 trillion in fixed-rate funds-supplyingoperations against pooled collateral for a total of ¥55 trillion.
We expect the BoJ to maintain an easing bias in 2012 given that the core CPI inflation ratelooks likely to remain slightly below zero. It is possible that further easing measures will beannounced in the first half of the year if continued escalation of the European sovereigndebt crisis adds to existing financial market anxiety, with possible options including: (1)expansion of the Asset Purchase Program; (2) lowering of the interest rate paid on excessreserve balances from 0.10% to (say) 0.05%; and (3) an increase in the BoJ's rinban outright JGB purchases by around ¥200 billion or ¥300 billion per month. However, we donot expect such measures to have sufficient effect to reverse the yen's uptrend on a realeffective exchange rate basis.
[Fiscal policy]The government continues to advocate a "pay as you go" approach whereby permanenttax cuts or spending increases should always be balanced by other permanent spendingcuts or tax hikes, with even the cost of reconstruction from the Great East JapanEarthquake ─ which falls outside the scope of the Medium-term Fiscal Framework ─ to befunded via purpose-specific tax hikes. We therefore see little prospect of fiscal policyproviding significant economic stimulus any time soon.
2 This gap is calculated as the difference between actual GDP and potential GDP, with the latter estimatedso as to be consistent with a zero inflation rate.
Exhibit 13: Core CPI and core core CPI inflation rate
-1.2
-0.8-0.7 -0.7
-1.0
-0.2 -0.2-0.1
-1.4
-1.2
-1.0
-0.8
-0.6-0.4
-0.2
0.0
2 0 1 0 ( a )
2 0 1 1 ( p )
2 0 1 2 ( e )
2 0 1 3 ( e )
core core CPI core CPI
Source: Cabinet office, Credit Suisse
8/3/2019 Japan Economics Weekly 2011 12
http://slidepdf.com/reader/full/japan-economics-weekly-2011-12 11/26
15 December 2011
Japan Economics Weekly 11
Public investment and other discretionary expenditures continue to decline as aconsequence of rising social security costs. With the government having promised to limit"primary expenditures" (general account spending excluding debt-servicing costs) toaround ¥71 trillion through FY2014, the next five years or so are likely to see increasedreconstruction-related investment offset by declines in other public works spending. Weexpect annual public investment to be boosted by over ¥2 trillion through FY2015 as thegovernment deploys around 70% of its reconstruction budget, but a continued downtrendin other public spending is likely to prevent double-digit growth in the real publicinvestment component of GDP. We forecast than an estimated 4.5% increase in FY2011will be followed by growth of +5.1% in FY2012 and +2.9% in FY2013.
The general government sector's social security outlays continue to grow by around ¥3trillion–¥4 trillion per annum as a consequence of increases in pension benefits andmedical expenses for elderly households. Spending on medical care and nursing servicesis counted as government consumption for GDP purposes, and we therefore expect aging-driven increases in social security expenditures to boost government consumption by over 2% in both FY2012 and FY2013.
On the revenue side of the ledger, the government is planning a number of tax hikestargeting both households (with personal income tax levies to be hiked by 2.1% for 25years to pay for post-quake rebuilding, and the employment income deduction to becapped at ¥2.45 million for individuals who earn gross salaries of more than ¥15 million)and businesses (although it remains to be seen whether a proposed "carbon tax" can beimplemented in the face of strong opposition from industry). That said, personal tax hikeslook unlikely to kick in before 2013, which suggests that household-related tax policy for 2012 could have a mildly stimulatory impact (with proposed FY2012 reforms pointing to anextension of "eco car" tax breaks, a reduction of the motor vehicle weight tax, and interestrate discounts for loans used to purchase energy-efficient and earthquake-resistanthomes). The special corporate tax for post-quake reconstruction is to be imposed fromFY2012, but should have a roughly neutral impact on the effective tax rate whileexpanding the tax base given that the income tax rate will be lowered by 5% (as previouslypromised) prior to imposition of the new 2.4% levy.
At this point in time our base-case scenario is for the consumption tax to be hiked to either 7% or 8% from FY2014 and then to 10% from FY2016, but we must stress that thisschedule remains somewhat uncertain amid continued domestic political instability.
8/3/2019 Japan Economics Weekly 2011 12
http://slidepdf.com/reader/full/japan-economics-weekly-2011-12 12/26
15 December 2011
Japan Economics Weekly 12
Business cycle updateDecember BoJ Tankan Survey showed deterioration of business sentiment
• Business conditions DI for large manufacturers dropped six points over the lastquarter and returned to negative territory
• Deterioration of the index was substantial for electric machinery, non-ferrousmetals and ceramics
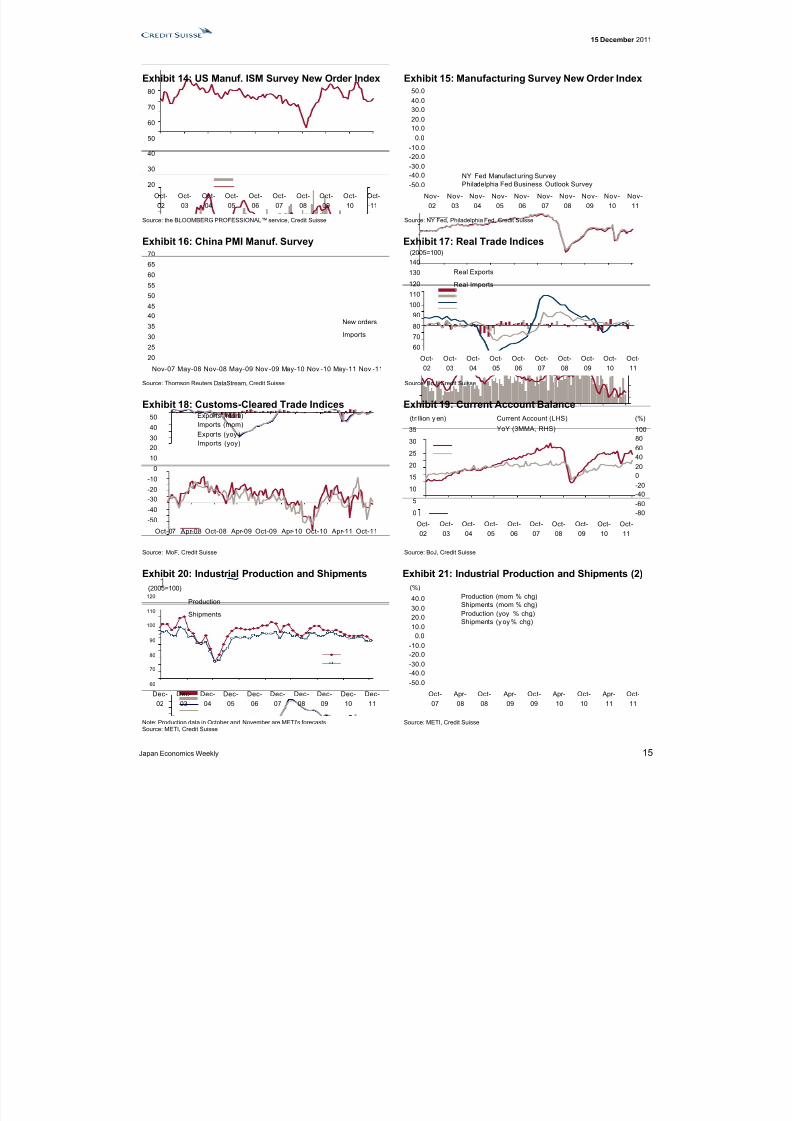
Foreign demand (Exhibits 14-19)
The BoJ’s real export index for October fell 4.8% mom seasonally adjusted, the firstdecline in three months. Production trends indicate that production levels have normalizedfor many industries, and we are beginning to see the impact that global manufacturingsentiment, which has weakened since the summer, is having on exports. The recent USISM new orders index and China’s PMI showed the first signs that manufacturingsentiment is bottoming out, so we expect export volumes to correct in Oct-Dec and thenrecover in Jan-Mar. In contrast, the BoJ real imports index rose a substantial 4.7% mom.The breakdown shows a marked increase in the import of mineral fuels such as LNG,which points to the impact of the shift to thermal power generation resulting from nuclear power plant shutdowns. The trade deficit amounted to ¥273.8 billion. The structuralincrease in fuel imports means that weak exports immediately translate into a trade deficit.We will continue to closely monitor electric power policies.
Industrial production (Exhibits 20-23)
Industrial production rose 2.4% mom in October, stronger than the Bloomberg consensusexpectation (+1.1%) and our forecast (+0.6%). However, this increase is a rebound fromSeptember’s fall (-3.3%), so the October level of production is still lower than that inAugust by 0.9%. Today’s data are broadly consistent with our view, since leadingindicators such as the US ISM new orders index suggested a soft patch for exports andproduction in the September to November period.
Corporate sentiment (Exhibits 24-25)The December 2011 Tankan results showed deterioration of corporate sentiment, with theheadline business conditions DI for large manufacturing firms dropping from +2 to -4. Webelieve that weakening of domestic consumer demand for electric appliances, the recentsoftening of global demand, and continued strength of the exchange rate are the mainbackgrounds. The three-month ahead index slipped 1ppt to -5, seemingly reflectingconcerns over Europe. In our judgment, however, the index for March could turn out bebetter given that leading indicators for exports have improved lately.
We expect exportvolumes to temporarily
correct temporarily inOctober-December
Production remainsflat
December BoJ Tankan
showed deterioration of corporate sentiment
8/3/2019 Japan Economics Weekly 2011 12
http://slidepdf.com/reader/full/japan-economics-weekly-2011-12 13/26
15 December 2011
Japan Economics Weekly 13
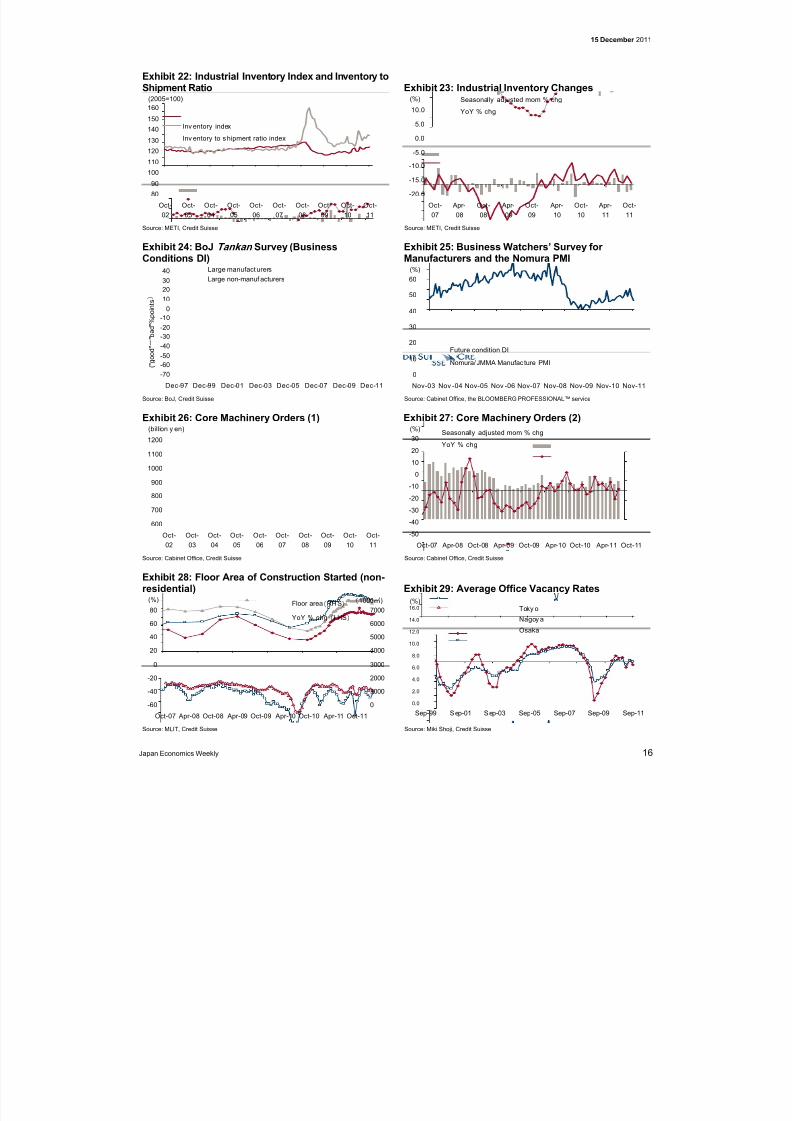
Corporate capex (Exhibits 26-29)
Investment in plant and equipment (excluding software) marked a third successive declineby falling 2.7%qoq on an all-industries basis (excluding the finance and insurance sectors).Capital spending by manufacturers rose 3.0%qoq after falling quite sharply in 2Q, whichpoints to a resumption of investment that had previously been delayed by the Great EastJapan Earthquake of March 11. However, this was more than offset by a fifth consecutive
contraction in investment by non manufacturers (-5.8%qoq). October core machineryorders (orders from the private sector excluding shipping and electrical power) fell 6.9%mom, which was weaker than the Bloomberg consensus forecast (+0.5%). Thebackground was weak orders from the non-manufacturing sector (core, -7.3% mom), whilethose from manufacturing and abroad turned positive (+5.5% mom, and 1.6% mom,respectively). On an unadjusted basis, however, core machinery orders continued to rise,growing 1.5% yoy, keeping the three-month moving average growth rate at a robust 4.5%,although the pace likely started slowing.
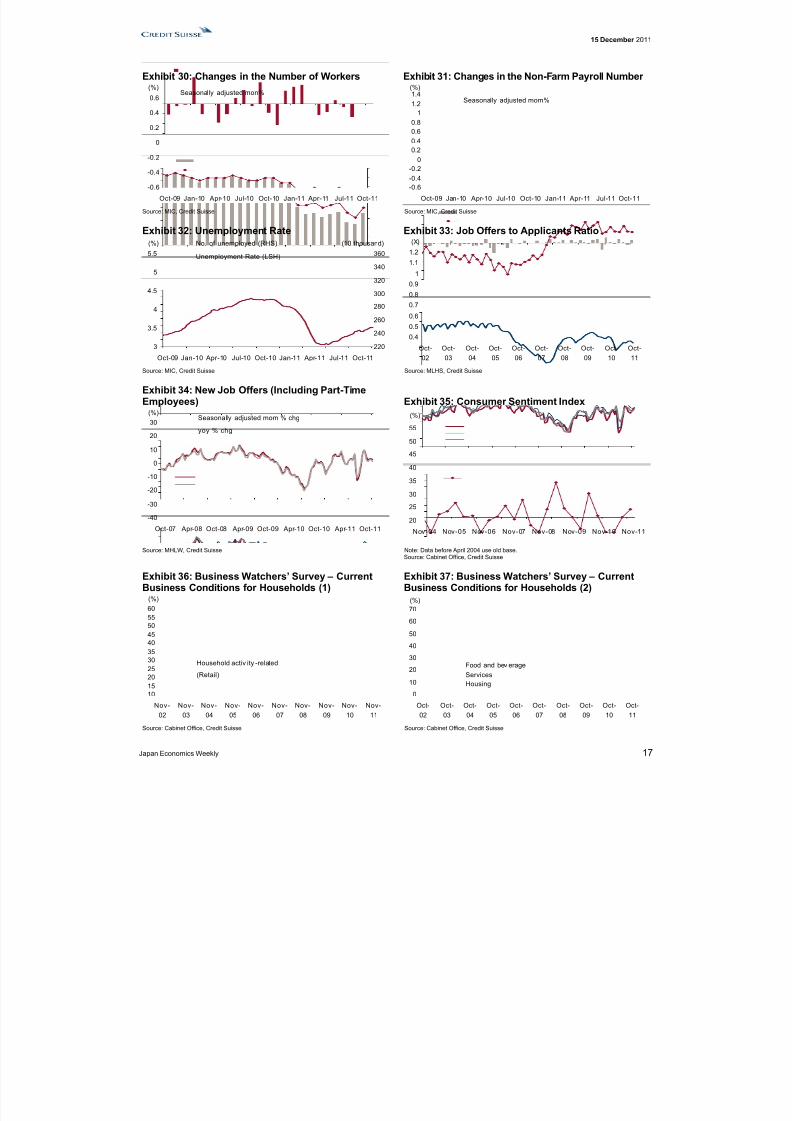
Employment (Exhibits 30-34)
The nationwide unemployment rate was 4.5% in October, up 0.4pp from 4.1% inSeptember. The driver was a rise in the labor force of 250K (September: -970K fromFebruary), rather than a drop in employment. The employed population in October was flat
from September, while corporate employment fell slightly by 70K (September: -710K fromFebruary).
Consumer sentiment (Exhibits 35-37)
The November Economy Watchers Survey reported a 0.9pt month-on-month decline in thehousehold activity-related DI. However, the only negative sub-component was retailrelated DI (-2.3ppt), as drinking and eating related (+3.2ppt), service related (+0.1ppt), andhousing related (+3.1ppt) were all positive. Meanwhile, the DI for future economicconditions was down -1.8ppt month on month at 44.3. Consumer sentiment stayed almostflat, although it may deteriorate going forward. The November Consumer Confidenceindex was 38.1, down 0.5 pt from the previous month. The indices for overall livelihood(down 0.7pt), income growth (down 0.5pt) and employment (down 1.0pt) deteriorated,while willingness to buy durable goods (up 0.1pt) improved.
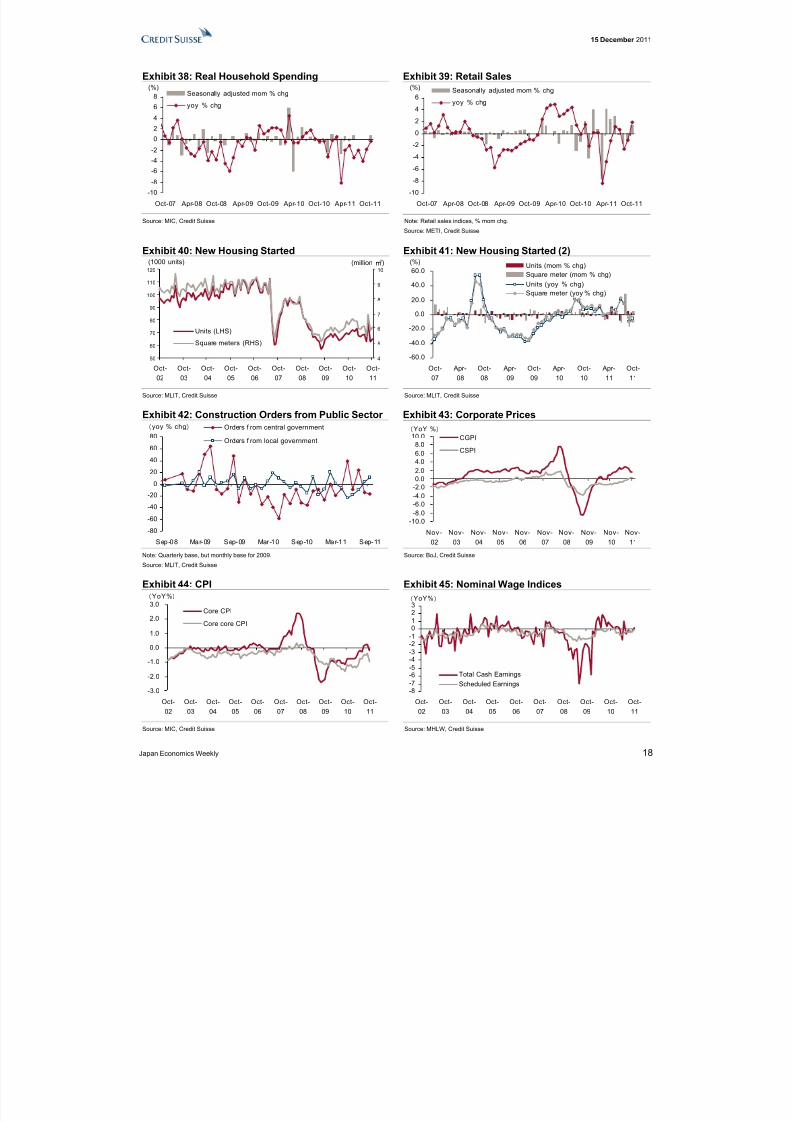
Consumer spending (Exhibits 38-39)
Real household consumption rose 0.3% mom in October, according to the MIC’sHousehold Survey (Family Income and Expenditure Survey, seasonally adjusted).Consumption in October remained resilient as it was 0.9% higher than the July-September average. Expenditure on clothing (+7.6%), healthcare (+10.2%), transportation andcommunications (+3.1%), and recreation (+2.2%) were healthy. In addition, real retailsales in October rose +1.6% mom for the first increase in four months and 0.2% higher than the July-September average. As for the future, since corporate bonuses were lower this winter than they were last year, we expect overall consumption to weaken over theyear-end period.
Fourth straightcontraction in
corporate capex
Volatile jobless ratestems from increase in
the labor force
Consumer sentimentremains flat
Oct Consumption was healthier than expected
8/3/2019 Japan Economics Weekly 2011 12
http://slidepdf.com/reader/full/japan-economics-weekly-2011-12 14/26
15 December 2011
Japan Economics Weekly 14
Residential investment (Exhibits 40-41)
The number of new housing starts rose 3.9% mom (seasonally adjusted) in October,stabilizing after the reactionary decline (20.2% drop) following last-minute demand beforethe expiration of the eco point system for housing in July. Building starts rose for owner-occupied housing (up 2.8%), rental properties (up 3.8%) and built-for-sale housing (up7.7%), and fell for flats for company housing (down 75.9%). Housing starts stood at
774,432 in annualized terms.According to the October Monthly Labor Survey, total cash earnings rose 0.1% yoy, withgrowth picking up over the previous month (up 0.0% in September). The decline inscheduled earnings narrowed with a 0.1% yoy drop (down 0.3% in September), but non-scheduled earnings rose 1.8%, improving over the 0.1% gain in September to support theheadline figure.
Public demand (Exhibit 42)
Real public works spending rose 9.3% in FY2009, for the first time in 15 years, thanks tothe formulation of a large-scale supplemental budget and the decision to bring forward thepublic works budget as an additional stimulus measure. However, the DPJ governmentfroze about ¥3tn worth of projects in the first supplementary budget, and the secondsupplementary budget for fiscal 2009 consists almost entirely of financing support for SMEs and employment measures. Public works spending amounts to only ¥500bn for regional infrastructure development. On a GDP basis, real public works spending hasfallen quarter on quarter since autumn 2009.
Wage and price indicators (Exhibits 43-45)
According to the September Monthly Labor Survey, total cash earnings were unchangedyoy, narrowing the decline over the previous month (down 0.4% in August). Scheduledearnings were flat (down 0.0% yoy in September and 0.2% in August), but non-scheduledearnings rose 0.2%, an improvement over the 1.6% decline in August that supported theheadline figure. Although there was no improvement in the number of employees, theunemployment rate fell due to a decline in the working population, and downwardpressures on wages also appears to be weakening somewhat. October nationwide core
core CPI (CPI excluding food and energy) was -1.0% yoy, widening the negative marginfrom September (-0.4% yoy). The November CGPI (Corporate Goods Price Index) was+0.1% mom, the first positive number since July, reflecting a slight weakening of theexchange rate.
Steady increase followsend of reactionarydecline after last-
minute demand beforeexpiration of eco point
system for housing
Second supplementarybudget consists
primarily of financingsupport for SMEs and
employment measures
Upward pressure onwages and prices
remains limited
8/3/2019 Japan Economics Weekly 2011 12
http://slidepdf.com/reader/full/japan-economics-weekly-2011-12 15/26
15 December 2011
Japan Economics Weekly 15
Exhibit 14: US Manuf. ISM Survey New Order Index Exhibit 15: Manufacturing Survey New Order Index
20
30
40
50
60
70
80
Oct-02
Oct-03
Oct-04
Oct-05
Oct-06
Oct-07
Oct-08
Oct-09
Oct-10
Oct-11
-50.0-40.0-30.0-20.0-10.0
0.010.020.030.040.050.0
Nov-02
Nov-03
Nov-04
Nov-05
Nov-06
Nov-07
Nov-08
Nov-09
Nov-10
Nov-11
NY Fed Manufact uring SurveyPhiladelphia Fed Business Outlook Survey
Source: the BLOOMBERG PROFESSIONAL™ service, Credit Suisse Source: NY Fed, Philadelphia Fed, Credit Suisse
Exhibit 16: China PMI Manuf. Survey Exhibit 17: Real Trade Indices
20
25
30
35
4045
50
55
60
65
70
Nov-07 May-08 Nov-08 May-09 Nov -09 May-10 Nov -10 May-11 Nov -11
New orders
Imports
60
70
80
90100
110
120
130
140
Oct-02
Oct-03
Oct-04
Oct-05
Oct-06
Oct-07
Oct-08
Oct-09
Oct-10
Oct-11
Real Exports
Real Imports
(2005=100)
Source: Thomson Reuters DataStream, Credit Suisse Source: BoJ, Credit Suisse
Exhibit 18: Customs-Cleared Trade Indices Exhibit 19: Current Account Balance
-50
-40
-30-20
-10
0
10
2030
40
50
Oct-07 Apr-08 Oct-08 Apr-09 Oct-09 Apr-10 Oct-10 Apr-11 Oct-11
Exports (mom)Imports (mom)Exports (yoy )Imports (yoy)
0
5
10
15
2025
30
35
Oct-02
Oct-03
Oct-04
Oct-05
Oct-06
Oct-07
Oct-08
Oct-09
Oct-10
Oct-11
-80-60-40-20020406080100
Current Account (LHS)
YoY (3MMA, RHS)
(trillion y en) (%)
Source: MoF, Credit Suisse Source: BoJ, Credit Suisse
Exhibit 20: Industrial Production and Shipments Exhibit 21: Industrial Production and Shipments (2)
60
70
80
90
100
110
120
Dec-02
Dec-03
Dec-04
Dec-05
Dec-06
Dec-07
Dec-08
Dec-09
Dec-10
Dec-11
Production
Shipments
(2005=100)
-50.0-40.0-30.0-20.0-10.0
0.010.020.030.0
40.0
Oct-07
Apr-08
Oct-08
Apr-09
Oct-09
Apr-10
Oct-10
Apr-11
Oct-11
Production (mom % chg)
Shipments (mom % chg)Production (yoy % chg)Shipments (y oy % chg)
(%)
Note: Production data in October and November are METI's forecasts.Source: METI, Credit Suisse
Source: METI, Credit Suisse
8/3/2019 Japan Economics Weekly 2011 12
http://slidepdf.com/reader/full/japan-economics-weekly-2011-12 16/26
15 December 2011
Japan Economics Weekly 16
Exhibit 22: Industrial Inventory Index and Inventory toShipment Ratio Exhibit 23: Industrial Inventory Changes
80
90
100
110120
130
140
150
160
Oct-02
Oct-03
Oct-04
Oct-05
Oct-06
Oct-07
Oct-08
Oct-09
Oct-10
Oct-11
Inv entory index
Inv entory to s hipment ratio index
(2005=100)
-20.0
-15.0
-10.0
-5.0
0.0
5.0
10.0
Oct-07
Apr-08
Oct-08
Apr-09
Oct-09
Apr-10
Oct-10
Apr-11
Oct-11
Seasonally adjusted mom % chg
YoY % chg
(%)
Source: METI, Credit Suisse Source: METI, Credit Suisse
Exhibit 24: BoJ Tankan Survey (BusinessConditions DI)
Exhibit 25: Business Watchers’ Survey for Manufacturers and the Nomura PMI
-70-60-50-40-30-20-10
010203040
Dec-97 Dec-99 Dec-01 Dec-03 Dec-05 Dec-07 Dec-09 Dec-11
Large manufact urersLarge non-manuf acturers
( " g o o d " " b a d " % p o i n t s
0
10
20
30
40
50
60
Nov-03 Nov -04 Nov-05 Nov -06 Nov-07 Nov-08 Nov-09 Nov-10 Nov-11
Future condition DI
Nomura/ JMMA Manufac ture PMI
(%)
Source: BoJ, Credit Suisse Source: Cabinet Office, the BLOOMBERG PROFESSIONAL™ service
Exhibit 26: Core Machinery Orders (1) Exhibit 27: Core Machinery Orders (2)
600
700
800
900
1000
1100
1200
Oct-02
Oct-03
Oct-04
Oct-05
Oct-06
Oct-07
Oct-08
Oct-09
Oct-10
Oct-11
(billion y en)
-50
-40
-30
-20
-10
0
10
20
30
Oct-07 Apr-08 Oct-08 Apr-09 Oct-09 Apr-10 Oct-10 Apr-11 Oct-11
Seasonally adjusted mom % chg
YoY % chg
(%)
Source: Cabinet Office, Credit Suisse Source: Cabinet Office, Credit Suisse
Exhibit 28: Floor Area of Construction Started (non-residential) Exhibit 29: Average Office Vacancy Rates
-60
-40
-20
0
20
40
60
80
Oct-07 Apr-08 Oct-08 Apr-09 Oct-09 Apr-10 Oct-10 Apr-11 Oct-11
0
1000
2000
3000
4000
5000
6000
7000Floor area RH SYoY % chg LHS
(%) 1000 )
0.0
2.0
4.0
6.0
8.0
10.0
12.0
14.0
16.0
Sep-99 Sep-01 Sep-03 Sep-05 Sep-07 Sep-09 Sep-11
Toky oNagoy a
Osaka
(%)
Source: MLIT, Credit Suisse Source: Miki Shoji, Credit Suisse
8/3/2019 Japan Economics Weekly 2011 12
http://slidepdf.com/reader/full/japan-economics-weekly-2011-12 17/26
15 December 2011
Japan Economics Weekly 17
Exhibit 30: Changes in the Number of Workers Exhibit 31: Changes in the Non-Farm Payroll Number
-0.6
-0.4
-0.2
0
0.2
0.4
0.6
Oct-09 Jan-10 Apr-10 Jul-10 Oct-10 Jan-11 Apr-11 Jul-11 Oct-11
Seasonally adjusted mon%(%)
-0.6-0.4-0.2
00.2
0.40.60.8
11.21.4
Oct-09 Jan-10 Apr-10 Jul-10 Oct-10 Jan-11 Apr-11 Jul-11 Oct-11
Seasonally adjusted mom%
(%)
Source: MIC, Credit Suisse Source: MIC, Credit Suisse
Exhibit 32: Unemployment Rate Exhibit 33: Job Offers to Applicants Ratio
3
3.5
4
4.5
5
5.5
Oct-09 Jan-10 Apr-10 Jul-10 Oct-10 Jan-11 Apr-11 Jul-11 Oct-11
220
240
260
280
300
320
340
360
No. of unemployed (RHS)
Unemployment Rate (LSH)
(%) (10 thousand)
0.4
0.5
0.6
0.7
0.8
0.9
1
1.1
1.2
Oct-02
Oct-03
Oct-04
Oct-05
Oct-06
Oct-07
Oct-08
Oct-09
Oct-10
Oct-11
(X)
Source: MIC, Credit Suisse Source: MLHS, Credit Suisse
Exhibit 34: New Job Offers (Including Part-TimeEmployees) Exhibit 35: Consumer Sentiment Index
-40
-30
-20
-10
0
10
20
30
Oct-07 Apr-08 Oct-08 Apr-09 Oct-09 Apr-10 Oct-10 Apr-11 Oct-11
Seasonally adjusted mom % chg
yoy % chg
(%)
20
25
30
35
4045
50
55
Nov-04 Nov-05 Nov-06 Nov-07 Nov-08 Nov-09 Nov-10 Nov-11
(%)
Source: MHLW, Credit Suisse Note: Data before April 2004 use old base.Source: Cabinet Office, Credit Suisse
Exhibit 36: Business Watchers’ Survey – CurrentBusiness Conditions for Households (1)
Exhibit 37: Business Watchers’ Survey – CurrentBusiness Conditions for Households (2)
1015202530354045505560
Nov-02
Nov-03
Nov-04
Nov-05
Nov-06
Nov-07
Nov-08
Nov-09
Nov-10
Nov-11
Household activ ity -related
(Retail)
(%)
0
10
20
30
40
50
60
70
Oct-02
Oct-03
Oct-04
Oct-05
Oct-06
Oct-07
Oct-08
Oct-09
Oct-10
Oct-11
Food and bev erageServicesHousing
(%)
Source: Cabinet Office, Credit Suisse Source: Cabinet Office, Credit Suisse
8/3/2019 Japan Economics Weekly 2011 12
http://slidepdf.com/reader/full/japan-economics-weekly-2011-12 18/26
15 December 2011
Japan Economics Weekly 18
Exhibit 38: Real Household Spending Exhibit 39: Retail Sales
-10
-8
-6
-4-2
0
2
4
6
8
Oct-07 Apr-08 Oct-08 Apr-09 Oct-09 Apr-10 Oct-10 Apr-11 Oct-11
Seasonally adjusted mom % chg
yoy % chg
(%)
-10
-8
-6
-4
-2
0
2
4
6
Oct-07 Apr-08 Oct-08 Apr-09 Oct-09 Apr-10 Oct-10 Apr-11 Oct-11
Seasonally adjusted mom % chg
yoy % chg
(%)
Source: MIC, Credit Suisse Note: Retail sales indices, % mom chg.
Source: METI, Credit Suisse
Exhibit 40: New Housing Started Exhibit 41: New Housing Started (2)
50
60
70
80
90
100
110
120
Oct-02
Oct-03
Oct-04
Oct-05
Oct-06
Oct-07
Oct-08
Oct-09
Oct-10
Oct-11
4
5
6
7
8
9
10
Units (LHS)
Square meters (RHS)
(1000 units) (million )
-60.0
-40.0
-20.0
0.020.0
40.0
60.0
Oct-07
Apr-08
Oct-08
Apr-09
Oct-09
Apr-10
Oct-10
Apr-11
Oct-11
Units (mom % chg)Square meter (mom % chg)Units (yoy % chg)Square meter (yoy % chg)
(%)
Source: MLIT, Credit Suisse Source: MLIT, Credit Suisse
Exhibit 42: Construction Orders from Public Sector Exhibit 43: Corporate Prices
-80
-60
-40
-20
0
20
40
60
80
Sep-08 Mar-09 Sep-09 Mar-10 Sep-10 Mar-11 Sep-11
Orders f rom central government
Orders f rom local government
yoy % chg
-10.0-8.0-6.0-4.0-2.00.02.04.06.0
8.010.0
Nov-02
Nov-03
Nov-04
Nov-05
Nov-06
Nov-07
Nov-08
Nov-09
Nov-10
Nov-11
CGPI
CSPI
YoY %
Note: Quarterly base, but monthly base for 2009.
Source: MLIT, Credit Suisse
Source: BoJ, Credit Suisse
Exhibit 44: CPI Exhibit 45: Nominal Wage Indices
-3.0
-2.0
-1.0
0.0
1.0
2.03.0
Oct-02
Oct-03
Oct-04
Oct-05
Oct-06
Oct-07
Oct-08
Oct-09
Oct-10
Oct-11
Core CPI
Core core CPI
YoY%
-8-7-6-5-4-3-2-10123
Oct-02
Oct-03
Oct-04
Oct-05
Oct-06
Oct-07
Oct-08
Oct-09
Oct-10
Oct-11
Total Cash EarningsScheduled Earnings
YoY%
Source: MIC, Credit Suisse Source: MHLW, Credit Suisse
8/3/2019 Japan Economics Weekly 2011 12
http://slidepdf.com/reader/full/japan-economics-weekly-2011-12 19/26
15 December 2011
Japan Economics Weekly 19
Money and credit updateMoney stock continued to grow in November
• Money stock continued to grow in November with the yoy growth of M2accelerating from +2.8% to 3.0%
Steady growth of money stock amid continued moderate shrinkage in nominal GDPsuggests a pickup in precautionary demand for money, in our view
The BoJ decided to expand the size of its asset purchase program at its regular MonetaryPolicy Meeting in October. The BoJ continues to watch market and FOMC, and positionedto emphasize its credit risk taking for the moment.
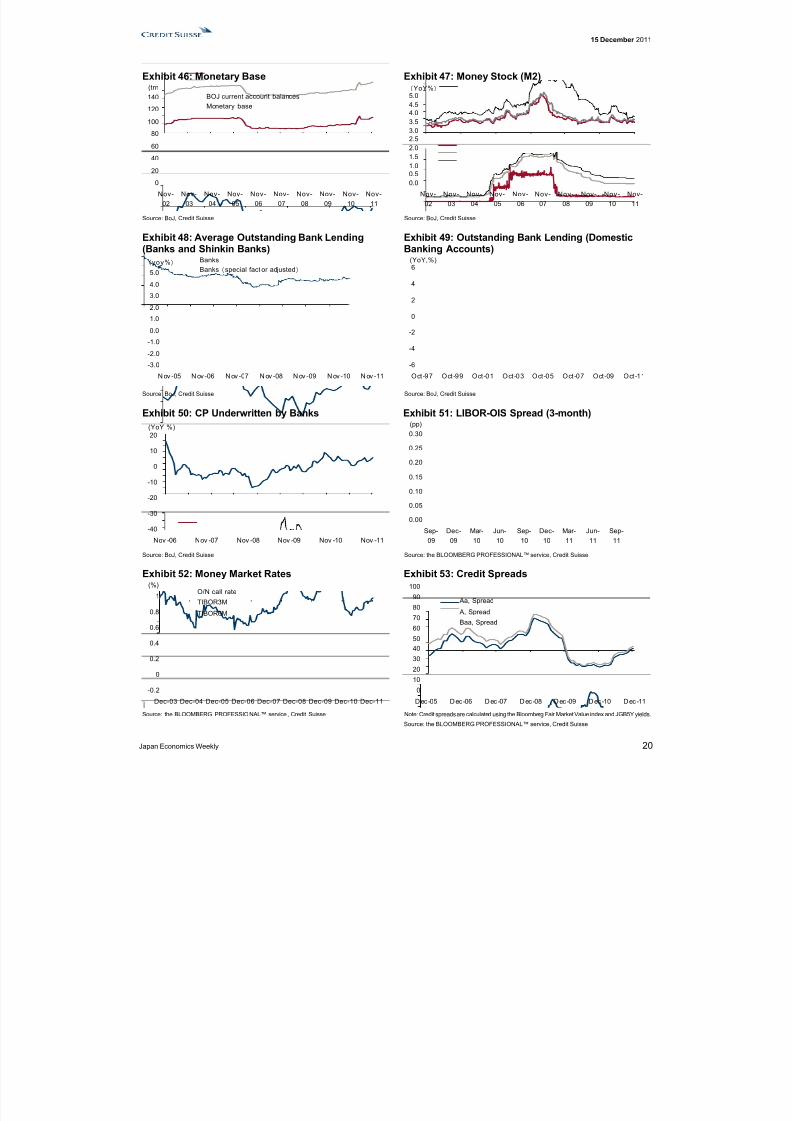
BoJ current account and monetary base (Exhibit 46)
The monetary base expanded a substantial 41.2% mom (seasonally adjusted, annualized)in November. The pace of year-on-year growth clearly picked up from 17.0% to 19.5%.Growth in banknotes in circulation slowed slightly from the last month (+2.4% yoy), whilegrowth in current account balances accelerated sharply from +84.6% in October to 99.1%
in November, showing that the BoJ has continued to keep monetary conditions loose sinceit increased its asset purchase program on October 27.
Money stock (Exhibit 47)
The November money stock data published by the BoJ showed M2 growth up 3.0% yoy,up from the previous month. M2 was up 3.5% mom, seasonally adjusted, for the thirdstraight month of positive growth. M3 and M1 increased 2.5% yoy and 5.1% yoy,respectively. Broadly defined liquidity accelerated with 0.2% yoy growth and rose 0.8%mom in seasonally adjusted terms for the first positive growth in four months.
Bank lending (Exhibits 48-50)
The November Principal Figures of Financial Institutions show average outstanding loanand discount amounts increasing 0.2% yoy for the banking sector, recording the second
consecutive month of positive growth. The outstanding loan balance for regional banksand tier 2 regional banks rose 1.9%, sustaining positive growth, while the city banks’ loanbalance was 1.3%, a clear improvement over the 1.6% decrease in October. Thissuggests that reconstruction loan disbursement, which had been slow to get started, isfinally getting underway.
Credit markets (Exhibits 51-53)
Spreads in the credit market are widening somewhat as a result of heightened riskaversion induced by anxiety over the US and European economies and expectations for enhanced monetary easing. With LIBOR standing firm, the LIBOR-OIS spread haswidened slightly as the OIS has dropped. The spread between corporate bonds and JGBsis widening. In particular, the spread between A-rated corporate bonds and JGBs iscurrently 19.94, the highest level since May 2011. That said, this is about 30% of the
spread at its peak just after the financial crisis, and remains stable, in our view.
8/3/2019 Japan Economics Weekly 2011 12
http://slidepdf.com/reader/full/japan-economics-weekly-2011-12 20/26
15 December 2011
Japan Economics Weekly 20
Exhibit 46: Monetary Base Exhibit 47: Money Stock (M2)
0
20
40
60
80
100
120
140
Nov-02
Nov-03
Nov-04
Nov-05
Nov-06
Nov-07
Nov-08
Nov-09
Nov-10
Nov-11
BOJ current account balancesMonetary base
(trn
0.00.51.01.52.0
2.53.03.54.04.55.0
Nov-02
Nov-03
Nov-04
Nov-05
Nov-06
Nov-07
Nov-08
Nov-09
Nov-10
Nov-11
YoY%
Source: BoJ, Credit Suisse Source: BoJ, Credit Suisse
Exhibit 48: Average Outstanding Bank Lending(Banks and Shinkin Banks)
Exhibit 49: Outstanding Bank Lending (DomesticBanking Accounts)
-3.0
-2.0
-1.0
0.0
1.0
2.0
3.0
4.0
5.0
N ov -05 N ov -06 N ov -07 N ov -08 N ov -09 N ov -10 N ov -11
BanksBanks special fact or adjusted
yoy%
-6
-4
-2
0
2
4
6
Oct-97 Oct-99 Oct-01 Oct-03 Oct-05 Oct-07 Oct-09 Oct-11
(YoY,%)
Source: BoJ, Credit Suisse Source: BoJ, Credit Suisse
Exhibit 50: CP Underwritten by Banks Exhibit 51: LIBOR-OIS Spread (3-month)
-40
-30
-20
-10
0
10
20
Nov -06 Nov -07 Nov -08 Nov -09 Nov -10 Nov -11
(YoY %)
0.00
0.05
0.10
0.15
0.20
0.25
0.30
Sep-09
Dec-09
Mar-10
Jun-10
Sep-10
Dec-10
Mar-11
Jun-11
Sep-11
(pp)
Source: BoJ, Credit Suisse Source: the BLOOMBERG PROFESSIONAL™ service, Credit Suisse
Exhibit 52: Money Market Rates Exhibit 53: Credit Spreads
-0.2
0
0.2
0.4
0.6
0.8
1
Dec-03 Dec-04 Dec-05 Dec-06 Dec-07 Dec-08 Dec-09 Dec-10 Dec-11
O/N call rate
TIBOR3M
TIBOR6M
(%)
0
10
20
30
4050
60
7080
90
100
D ec -05 D ec -06 D ec -07 D ec -08 D ec -09 D ec -10 D ec -11
Aa, Spread
A, Spread
Baa, Spread
Source: the BLOOMBERG PROFESSIONAL™ service , Credit Suisse Note: Credit spreads are calculated using the Bloomberg Fair Market Value index and JGB5Y yields.
Source: the BLOOMBERG PROFESSIONAL™ service, Credit Suisse
8/3/2019 Japan Economics Weekly 2011 12
http://slidepdf.com/reader/full/japan-economics-weekly-2011-12 21/26
15 December 2011
Japan Economics Weekly 21
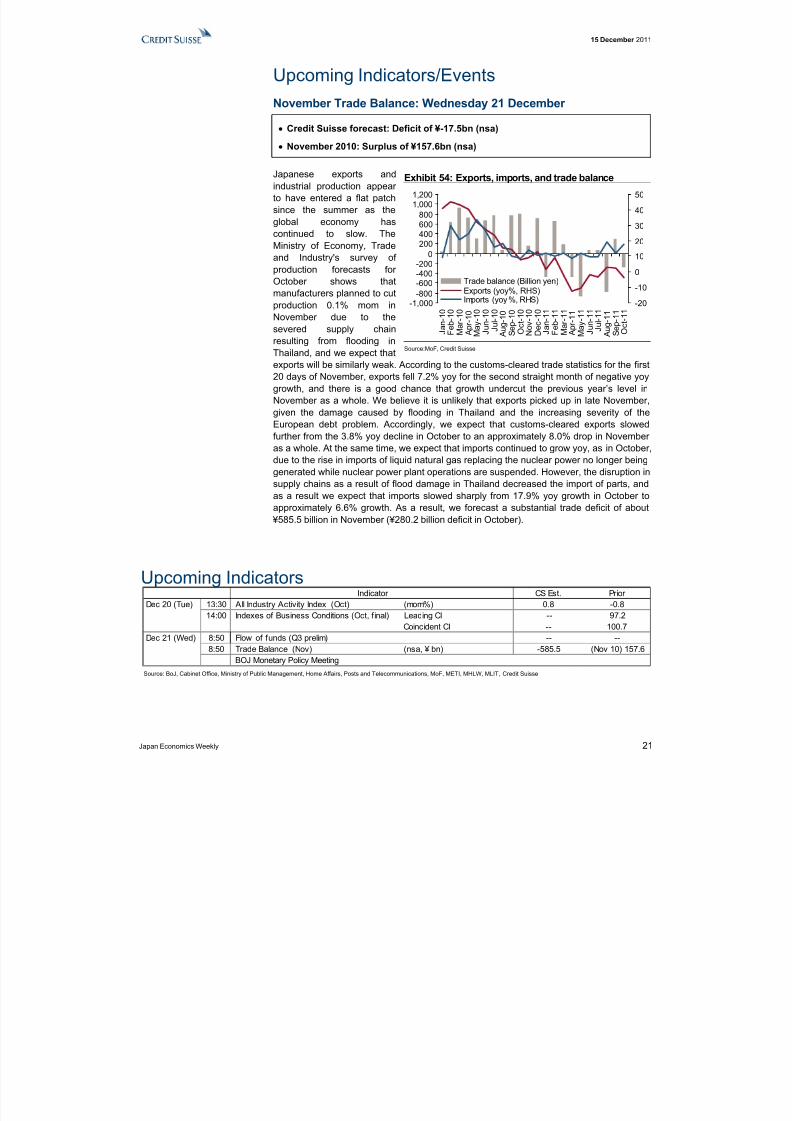
Upcoming Indicators/EventsNovember Trade Balance: Wednesday 21 December
• Credit Suisse forecast: Deficit of ¥-17.5bn (nsa)
•
November 2010: Surplus of ¥157.6bn (nsa)
Japanese exports andindustrial production appear to have entered a flat patchsince the summer as theglobal economy hascontinued to slow. TheMinistry of Economy, Tradeand Industry's survey of production forecasts for October shows thatmanufacturers planned to cutproduction 0.1% mom inNovember due to thesevered supply chainresulting from flooding inThailand, and we expect thatexports will be similarly weak. According to the customs-cleared trade statistics for the first20 days of November, exports fell 7.2% yoy for the second straight month of negative yoygrowth, and there is a good chance that growth undercut the previous year’s level inNovember as a whole. We believe it is unlikely that exports picked up in late November,given the damage caused by flooding in Thailand and the increasing severity of theEuropean debt problem. Accordingly, we expect that customs-cleared exports slowedfurther from the 3.8% yoy decline in October to an approximately 8.0% drop in November as a whole. At the same time, we expect that imports continued to grow yoy, as in October,due to the rise in imports of liquid natural gas replacing the nuclear power no longer beinggenerated while nuclear power plant operations are suspended. However, the disruption insupply chains as a result of flood damage in Thailand decreased the import of parts, andas a result we expect that imports slowed sharply from 17.9% yoy growth in October toapproximately 6.6% growth. As a result, we forecast a substantial trade deficit of about
¥585.5 billion in November (¥280.2 billion deficit in October).
Upcoming IndicatorsCS Est. Prior
Dec 20 (Tue) 13:30 All Industry Activity Index (Oct) (mom%) 0.8 -0.814:00 Indexes of Business Conditions (Oct, final) Leading CI -- 97.2
Coincident CI -- 100.7Dec 21 (Wed) 8:50 Flow of funds (Q3 prelim) -- --
8:50 Trade Balance (Nov) (nsa, ¥ bn) -585.5 (Nov 10) 157.6BOJ Monetary Policy Meeting
Indicator
Source: BoJ, Cabinet Office, Ministry of Public Management, Home Affairs, Posts and Telecommunications, MoF, METI, MHLW, MLIT, Credit Suisse
Exhibit 54: Exports, imports, and trade balance
-1,000
-800-600-400-200
0200400600800
1,0001,200
J a n - 1
0
F e b - 1
0
M a r - 1 0
A p r - 1 0
M a y - 1
0
J u n - 1
0
J u l - 1 0
A u g - 1
0
S e p - 1
0
O c t - 1 0
N o v - 1
0
D e c - 1
0
J a n - 1
1
F e b - 1
1
M a r - 1 1
A p r - 1 1
M a y - 1
1
J u n - 1
1
J u l - 1 1
A u g - 1
1
S e p - 1
1
O c t - 1 1 -20
-10
0
10
20
30
40
50
Trade balance (Billion yen)Exports (yoy%, RHS)
Imports (yoy %, RHS)
Source:MoF, Credit Suisse
8/3/2019 Japan Economics Weekly 2011 12
http://slidepdf.com/reader/full/japan-economics-weekly-2011-12 22/26
8/3/2019 Japan Economics Weekly 2011 12
http://slidepdf.com/reader/full/japan-economics-weekly-2011-12 23/26
J a p anE
c on omi c s W
e ek l y
2 3
Major Economic Data (continued)2011/03 2011/04 2011/05 2011/06 2011/07 2011/08 201
Contracted rate for condominium sTokyo metropolitan area % 79.7 76.1 79.2 79.2 76.2 69.9 7Kinki area % 74.9 70.1 77.6 74.9 75.1 68.2
PricesNationwide core CPI YoY % 0.2 -0.3 -0.2 -0.3 0.1 0.2 Tokyo core CPI YoY % -0.8 -0.5 -0.3 -0.4 0.0 -0.2
Domestic CGPI YoY % 2.0 2.6 2.2 2.5 2.8 2.6 Raw materials YoY % 20.8 19.8 18.4 20.7 22.9 22.6 Intermediate goods YoY % 2.9 3.4 3.3 3.7 4.3 4.0 Final goods YoY % 0.1 0.7 0.4 0.6 0.8 0.6
CSPI YoY % -1.1 -0.7 -0.9 -0.7 -0.3 -0.3 External dem and
Trade balance billion yen 186.3 -467.7 -857.3 67.3 67.9 -779.6 29Exports YoY % -2.3 -12.4 -10.3 -1.6 -3.4 2.8 Imports YoY % 12.0 9.0 12.4 9.8 9.9 19.2
Trade volumeExports YoY % -3.3 -11.6 -10.8 -2.7 -5.3 0.9 Imports YoY % 5.5 1.3 5.5 1.7 -2.6 6.0
Real trade balance s.a. MoM % -24.8 -35.6 11.4 48.5 -4.6 0.3 2Exports s .a. MoM % -8.1 -7.0 4.7 8.5 0.3 0.1
Imports s .a. MoM % -1.5 1.8 3.3 0.2 1.9 0.0 Balance of payments
Current account balance billion yen 1,738.6 412.4 585.9 538.9 990.2 407.5 1,584.8Current account balance s.a. billion yen 806.2 575.9 385.7 937.2 752.5 652.6 1,186.6
Trade and services billion yen 267.5 -792.1 -790.6 25.3 -182.9 -877.3 255Trade balance billion yen 236.8 -412.0 -771.3 129.9 123.3 -694.7 37Service balance billion yen 30.6 -380.1 -19.3 -104.6 -306.2 -182.6 -11
Income accounts billion yen 1,635.9 1,290.6 1,453.9 604.8 1,246.7 1,353.9 1,393.7Capital and financial balance billion yen -754.6 1,174.3 -101.3 -178.3 -753.1 3,100.5 -1,789.6
Financial account billion yen -659.3 1,190.8 -108.2 -183.3 -754.4 3,104.4 -1,783Direct investment billion yen -152.7 -614.0 -614.8 -639.1 -959.4 -511.7 -1,860Portfolio inves tment billion yen -8,125.1 9,455.2 3,598.5 -4,718.8 3,715.4 3,248.8 -6,426.0
Changes in reserve assets billion yen -1,858.0 -27.4 -217.8 -30.0 -18.2 -3,995.8 -22.2Business conditions indices
Coincident CI MoM % -9.5 -1.1 3.6 3.8 -0.1 0.1 Leading CI MoM % -3.3 -6.9 1.8 2.9 1.4 -0.6
* Contracted rate is the number of contracts sold divided by t he number of units for sale.
Source: MIAC, Department Store Assoc., Chain Store Assoc. Convenience Store Assoc., Cabinet Office, MHLW, METI, MLIT, MoF, BoJ, JREI, Credit Suisse
8/3/2019 Japan Economics Weekly 2011 12
http://slidepdf.com/reader/full/japan-economics-weekly-2011-12 24/26
8/3/2019 Japan Economics Weekly 2011 12
http://slidepdf.com/reader/full/japan-economics-weekly-2011-12 25/26
FIXED INCOME RESEARCH > ECONOMICS RESEARCH > DEVELOPED COUNTRIES
Dr. Neal Soss, Managing Director Chief Economist and Global Head of Economics
+1 212 325 3335
Eric Miller, Managing Director Global Head of Fixed Income and Economic Research
+1 212 538 6480
EURO AREA AND UK ECONOMICS
Neville Hill, Director Head of European Economics +44 20 7888 [email protected]
Christel Aranda-Hassel, Director +44 20 7888 [email protected]
Giovanni Zanni, Director European Economics – Paris+33 1 70 39 [email protected]
Violante di Canossa, Vice President+44 20 7883 [email protected]
Axel Lang, Analyst+44 20 7883 [email protected]
Steven Bryce, Analyst+44 20 7883 [email protected]
Yiagos Alexopoulos, Analyst
+44 20 7883 [email protected]
US ECONOMICS
Dr. Neal Soss, Managing Director Head of US Economics +1 212 325 [email protected]
Jonathan Basile, Director +1 212 538 1436 [email protected]
Jay Feldman, Director +1 212 325 7634 [email protected]
Dana Saporta, Director
+1 212 538 [email protected]
Jill Brown, Vice President+1 212 325 1578 [email protected]
Henry Mo, Vice President+1 212 538 [email protected]
Peggy Riordan, Assistant Vice President+1 212 325 [email protected]
ASIA
JAPAN ECONOMICS
Hiromichi Shirakawa, Managing Director +81 3 4550 [email protected]
Takashi Shiono, Associate+81 3 4550 [email protected]
NON-JAPAN ECONOMICSDong Tao, Managing Director
Head of Non-Japan Asia Economics+852 2101 [email protected]
8/3/2019 Japan Economics Weekly 2011 12
http://slidepdf.com/reader/full/japan-economics-weekly-2011-12 26/26