january 25, 2018 - jetblue | investor...
TRANSCRIPT
1
4Q 2017 EARNINGS PRESENTATIONJANUARY 25, 2018
2
SAFE HARBOR
This presentation contains forward-looking statements within the meaning of the Private Securities Litigation Reform Act of 1995, Section 27A of the
Securities Act of 1933, as amended, or the Securities Act, and Section 21E of the Securities Exchange Act of 1934, as amended, or the Exchange Act,
which represent our management's beliefs and assumptions concerning future events. When used in this document and in documents incorporated
herein by reference, the words “expects,” “plans,” “anticipates,” “indicates,” “believes,” “forecast,” “guidance,” “outlook,” “may,” “will,” “should,” “seeks,”
“targets” and similar expressions are intended to identify forward-looking statements. Forward-looking statements involve risks, uncertainties and
assumptions, and are based on information currently available to us. Actual results may differ materially from those expressed in the forward-looking
statements due to many factors, including, without limitation, our extremely competitive industry; volatility in financial and credit markets which could
affect our ability to obtain debt and/or financing or to raise funds through debt or equity issuances; volatility in fuel prices, maintenance costs and interest
rates; our ability to implement our growth strategy; our significant fixed obligations and substantial indebtedness; our ability to attract and retain qualified
personnel and maintain our culture as we grow; our reliance on high daily aircraft utilization; our dependence on the New York and Boston metropolitan
markets and the Northeast Corridor of the United States and the effect of increased congestion in these markets; our reliance on automated systems and
technology; our being subject to potential unionization, work stoppages, slowdowns and/or increased labor costs; our reliance on a limited number of
suppliers; our presence in some international emerging markets that may experience political or economic instability or may subject us to legal risk;
reputational and business risk from information security breaches or cyber-attacks; changes in or additional government regulation; changes in our
industry due to other airlines' financial condition; acts of war or terrorism; global economic conditions or economic downturns leading to a continuing or
accelerated decrease in demand for air travel; the spread of infectious diseases; adverse weather conditions or natural disasters; and external
geopolitical events and conditions. It is routine for our internal projections and expectations to change as the year or each quarter in the year progresses,
and therefore it should be clearly understood that the internal projections, beliefs and assumptions upon which we base our expectations may change
prior to the end of each quarter or year and you should not place undue reliance on these statements. Further information concerning these and other
factors is contained in the Company's Securities and Exchange Commission filings, including but not limited to, the Company's 2016 Annual Report on
Form 10-K and Quarterly Reports on Form 10-Q. In light of these risks and uncertainties, the forward-looking events discussed in this presentation might
not occur. We undertake no obligation to update any forward-looking statements to reflect events or circumstances that may arise after the date of this
presentation.
The following presentation also includes certain “non-GAAP financial measures” as defined in Regulation G under the Securities Exchange Act of 1934.
We refer you to the reconciliations made available in our Quarterly Reports on Form 10-Q and Annual Reports on Form 10-K (available on our website at
jetblue.com and at sec.gov) and in our fourth quarter earnings call (filed on January 25th, 2018), which reconcile the non-GAAP financial measures
included in the following presentation to the most directly comparable financial measures calculated and presented in accordance with U.S. GAAP.
32

4Q 2017 EARNINGS UPDATE
ROBIN HAYES
PRESIDENT & CEO
3
4
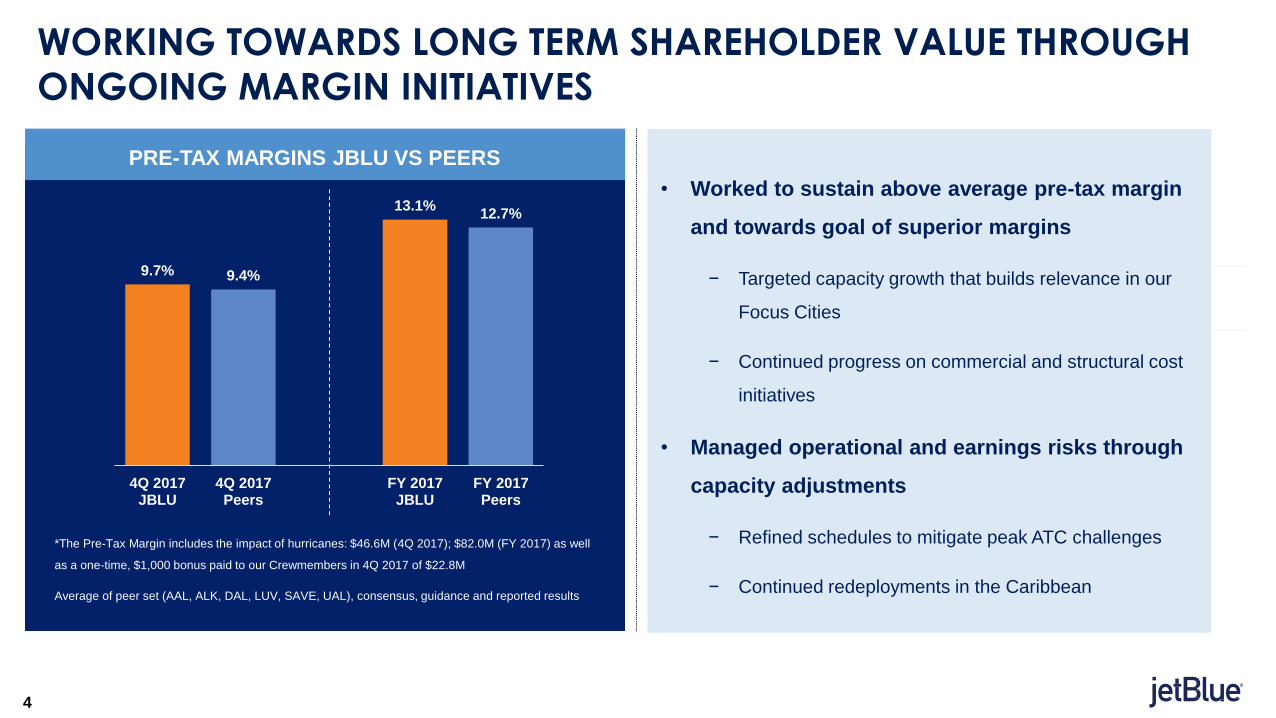
PRE-TAX MARGINS JBLU VS PEERS
Average of peer set (AAL, ALK, DAL, LUV, SAVE, UAL), consensus, guidance and reported results
9.7% 9.4%
13.1%12.7%
4Q 2017JBLU
4Q 2017Peers
FY 2017JBLU
FY 2017Peers
WORKING TOWARDS LONG TERM SHAREHOLDER VALUE THROUGH
ONGOING MARGIN INITIATIVES
*The Pre-Tax Margin includes the impact of hurricanes: $46.6M (4Q 2017); $82.0M (FY 2017) as well
as a one-time, $1,000 bonus paid to our Crewmembers in 4Q 2017 of $22.8M
• Worked to sustain above average pre-tax margin
and towards goal of superior margins
− Targeted capacity growth that builds relevance in our
Focus Cities
− Continued progress on commercial and structural cost
initiatives
• Managed operational and earnings risks through
capacity adjustments
− Refined schedules to mitigate peak ATC challenges
− Continued redeployments in the Caribbean
4
5
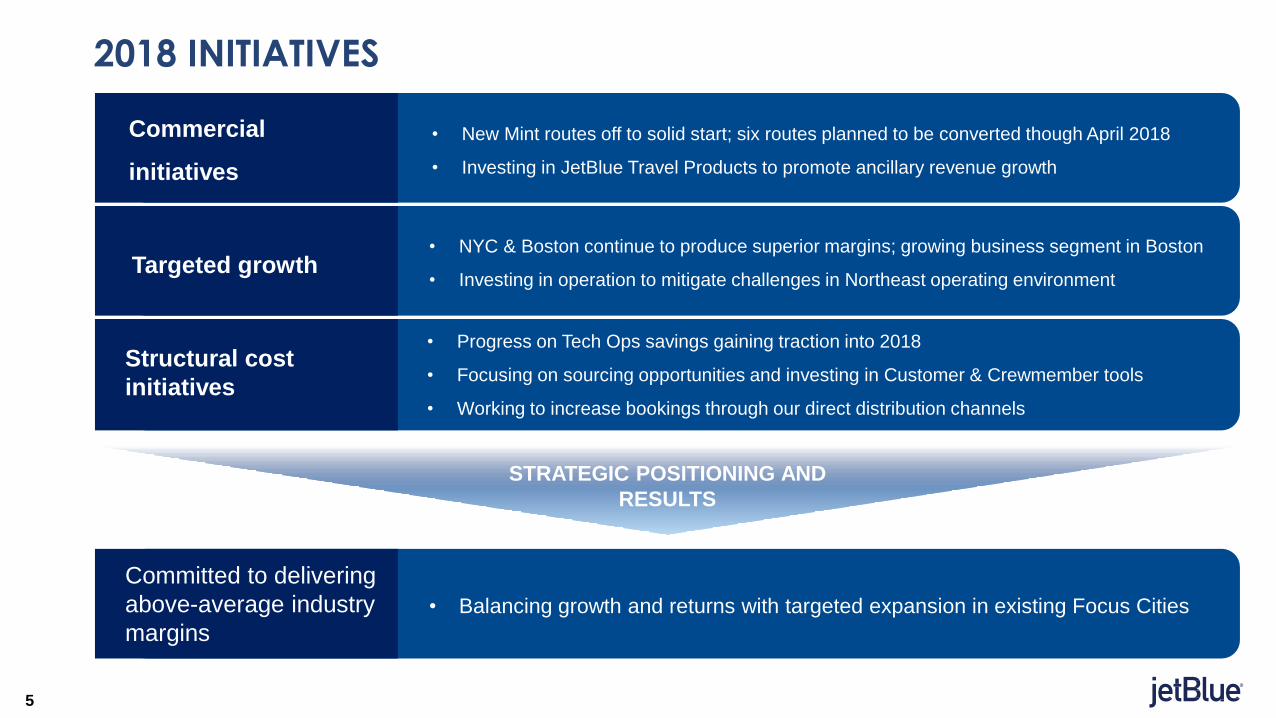
2018 INITIATIVES
Commercial
initiatives
Commercial
initiatives
Commercial
initiativesTargeted growth
• NYC & Boston continue to produce superior margins; growing business segment in Boston
• Investing in operation to mitigate challenges in Northeast operating environment
Commercial
initiatives
Structural cost
initiatives
STRATEGIC POSITIONING AND
RESULTS
Commercial
initiatives
Committed to delivering
above-average industry
margins• Balancing growth and returns with targeted expansion in existing Focus Cities
• New Mint routes off to solid start; six routes planned to be converted though April 2018
• Investing in JetBlue Travel Products to promote ancillary revenue growth
• Progress on Tech Ops savings gaining traction into 2018
• Focusing on sourcing opportunities and investing in Customer & Crewmember tools
• Working to increase bookings through our direct distribution channels
5
COMMERCIAL UPDATE & OUTLOOK
MARTY ST. GEORGE
EVP COMMERCIAL AND PLANNING
6
7
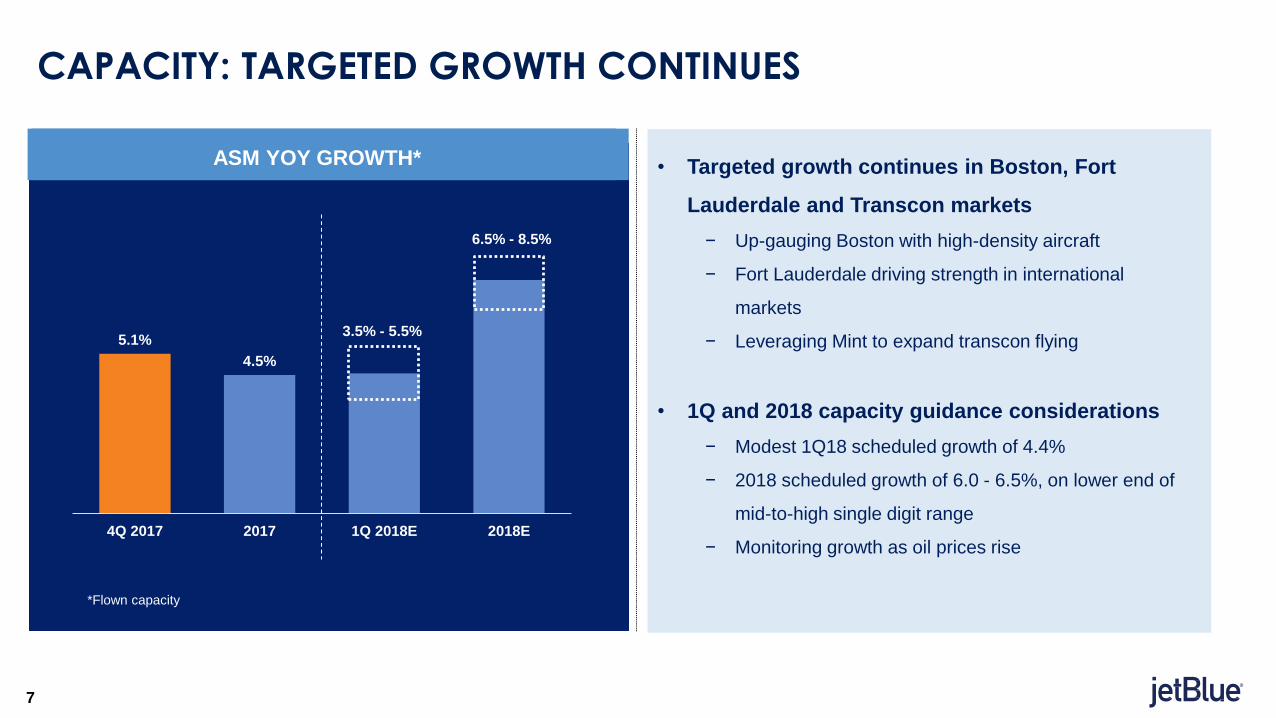
ASM YOY GROWTH
5.1%
4.5%
4Q 2017 2017 1Q 2018E 2018E
ASM YOY GROWTH*
CAPACITY: TARGETED GROWTH CONTINUES
*Flown capacity
3.5% - 5.5%
6.5% - 8.5%
• Targeted growth continues in Boston, Fort
Lauderdale and Transcon markets
− Up-gauging Boston with high-density aircraft
− Fort Lauderdale driving strength in international
markets
− Leveraging Mint to expand transcon flying
• 1Q and 2018 capacity guidance considerations
− Modest 1Q18 scheduled growth of 4.4%
− 2018 scheduled growth of 6.0 - 6.5%, on lower end of
mid-to-high single digit range
− Monitoring growth as oil prices rise
7
8
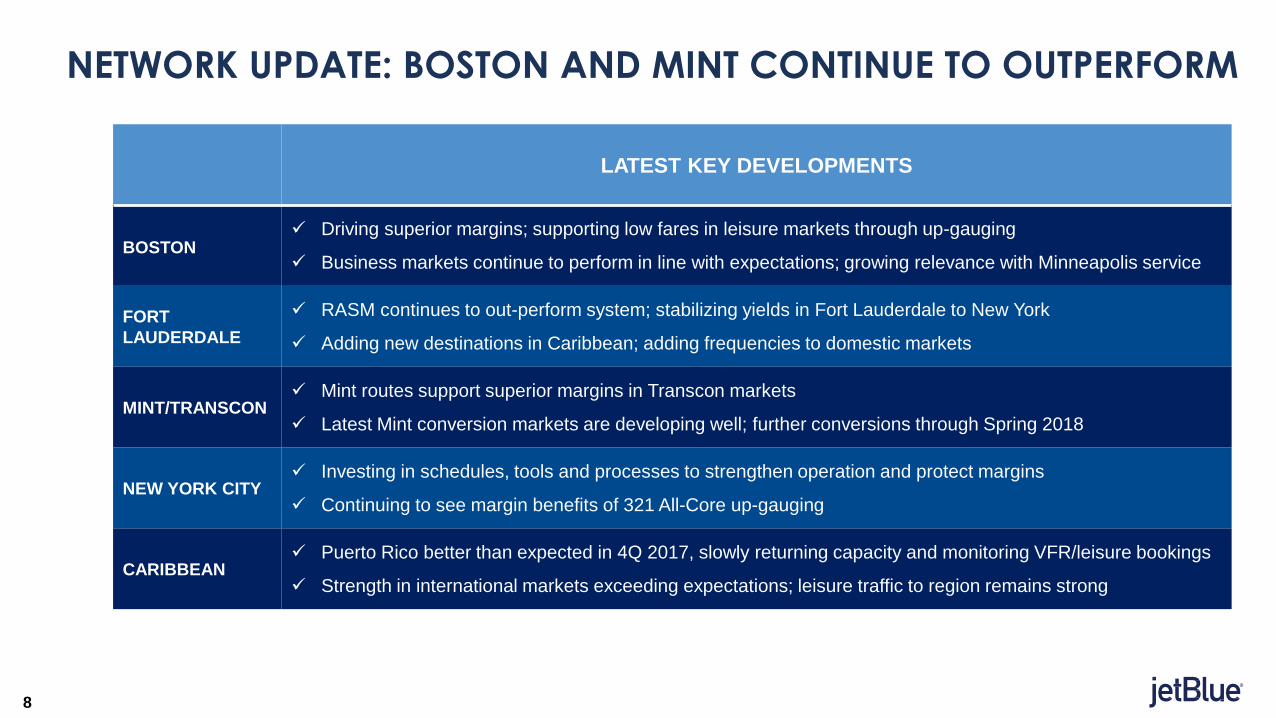
NETWORK UPDATE: BOSTON AND MINT CONTINUE TO OUTPERFORM
LATEST KEY DEVELOPMENTS
BOSTON Driving superior margins; supporting low fares in leisure markets through up-gauging
Business markets continue to perform in line with expectations; growing relevance with Minneapolis service
FORT
LAUDERDALE
RASM continues to out-perform system; stabilizing yields in Fort Lauderdale to New York
Adding new destinations in Caribbean; adding frequencies to domestic markets
MINT/TRANSCON Mint routes support superior margins in Transcon markets
Latest Mint conversion markets are developing well; further conversions through Spring 2018
NEW YORK CITY Investing in schedules, tools and processes to strengthen operation and protect margins
Continuing to see margin benefits of 321 All-Core up-gauging
CARIBBEAN Puerto Rico better than expected in 4Q 2017, slowly returning capacity and monitoring VFR/leisure bookings
Strength in international markets exceeding expectations; leisure traffic to region remains strong
8
9
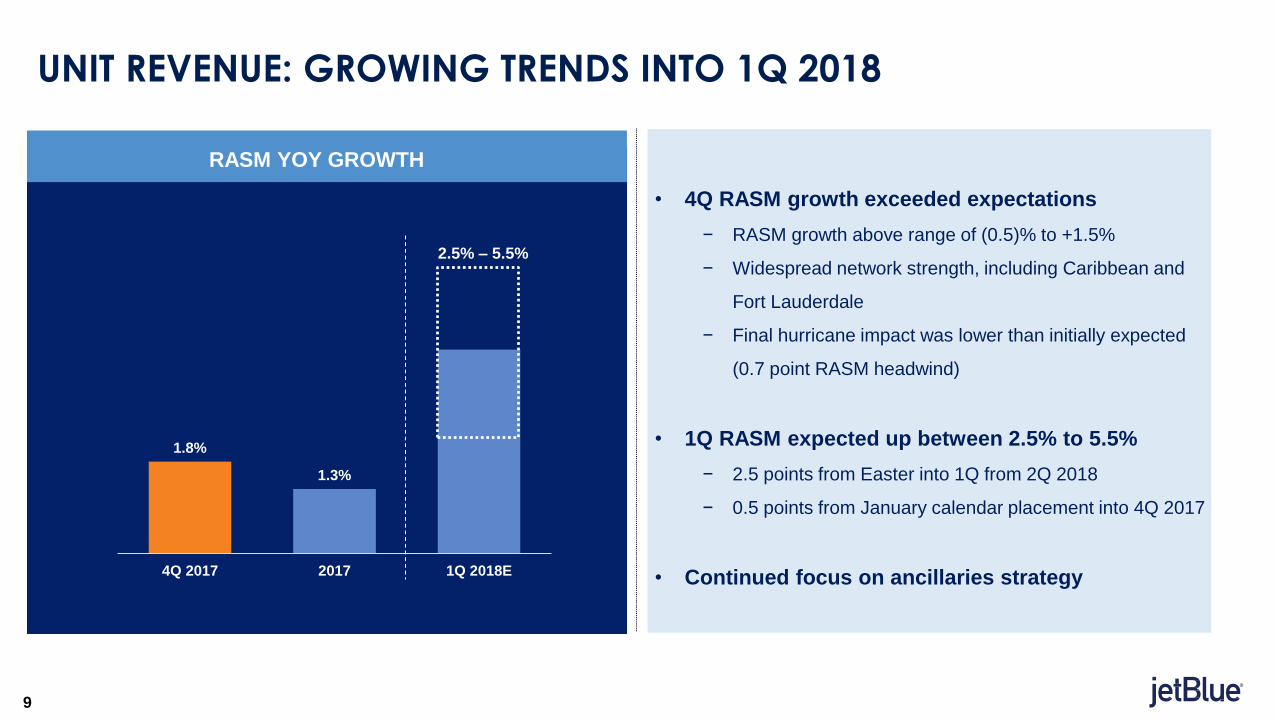
RASM YOY GROWTH
1.8%
1.3%
4Q 2017 2017 1Q 2018E
UNIT REVENUE: GROWING TRENDS INTO 1Q 2018
2.5% – 5.5%
• 4Q RASM growth exceeded expectations
− RASM growth above range of (0.5)% to +1.5%
− Widespread network strength, including Caribbean and
Fort Lauderdale
− Final hurricane impact was lower than initially expected
(0.7 point RASM headwind)
• 1Q RASM expected up between 2.5% to 5.5%
− 2.5 points from Easter into 1Q from 2Q 2018
− 0.5 points from January calendar placement into 4Q 2017
• Continued focus on ancillaries strategy
9

FINANCIAL UPDATE & OUTLOOK
STEVE PRIEST
EVP CHIEF FINANCIAL OFFICER
10
11
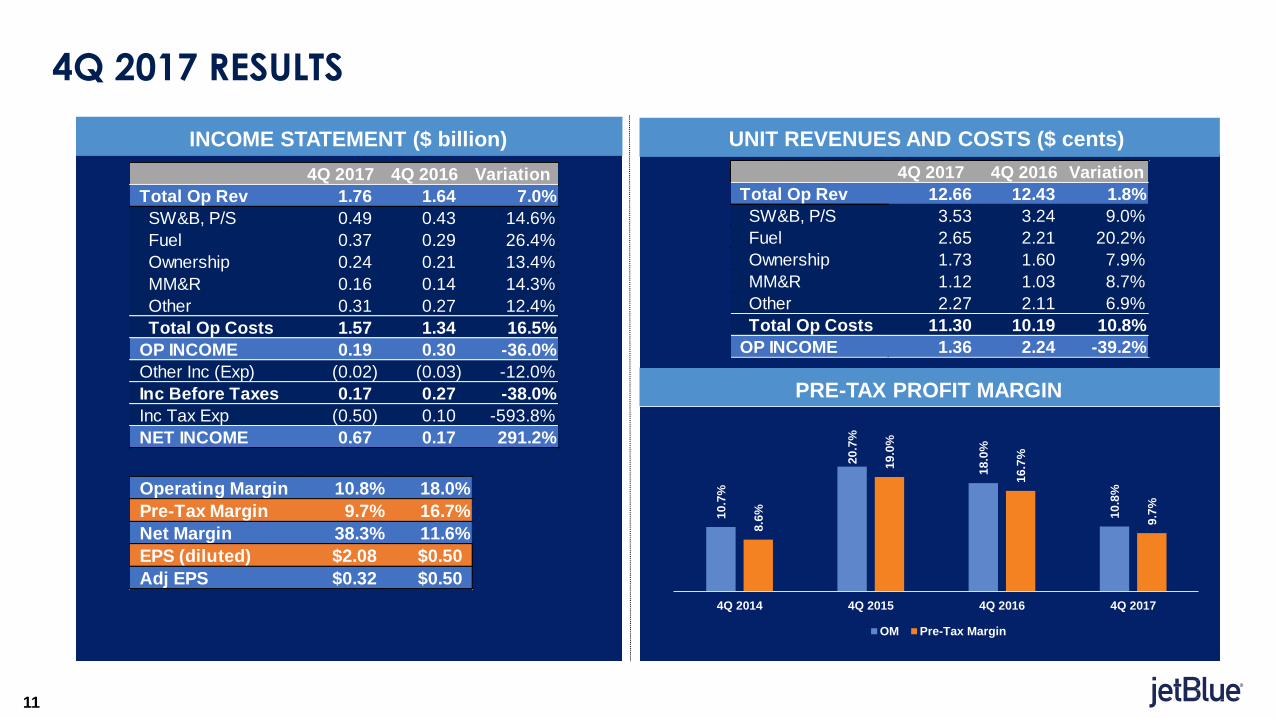
4Q 2017 RESULTS
INCOME STATEMENT ($ billion)
PRE-TAX PROFIT MARGIN
UNIT REVENUES AND COSTS ($ cents)
4Q 2017 4Q 2016 Variation
Total Op Rev 12.66 12.43 1.8%
SW&B, P/S 3.53 3.24 9.0%
Fuel 2.65 2.21 20.2%
Ownership 1.73 1.60 7.9%
MM&R 1.12 1.03 8.7%
Other 2.27 2.11 6.9%
Total Op Costs 11.30 10.19 10.8%
OP INCOME 1.36 2.24 -39.2%
Operating Margin 10.8% 18.0%
Pre-Tax Margin 9.7% 16.7%
Net Margin 38.3% 11.6%
EPS (diluted) $2.08 $0.50
Adj EPS $0.32 $0.50
11
4Q 2017 4Q 2016 Variation
Total Op Rev 1.76 1.64 7.0%
SW&B, P/S 0.49 0.43 14.6%
Fuel 0.37 0.29 26.4%
Ownership 0.24 0.21 13.4%
MM&R 0.16 0.14 14.3%
Other 0.31 0.27 12.4%
Total Op Costs 1.57 1.34 16.5%
OP INCOME 0.19 0.30 -36.0%
Other Inc (Exp) (0.02) (0.03) -12.0%
Inc Before Taxes 0.17 0.27 -38.0%
Inc Tax Exp (0.50) 0.10 -593.8%
NET INCOME 0.67 0.17 291.2%
10
.7%
20
.7%
18
.0%
10
.8%
8.6
%
19
.0%
16
.7%
9.7
%
4Q 2014 4Q 2015 4Q 2016 4Q 2017
OM Pre-Tax Margin
12
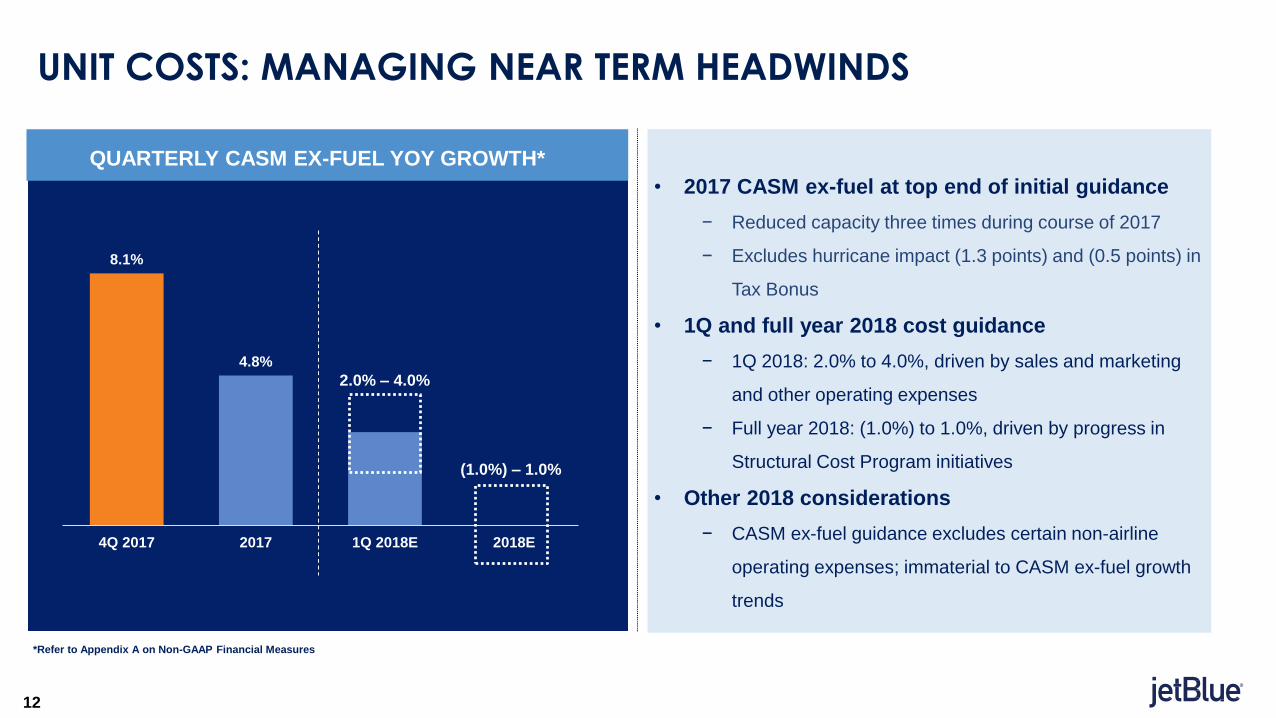
QUARTERLY CASM EX-FUEL YOY GROWTH*
8.1%
4.8%
4Q 2017 2017 1Q 2018E 2018E
UNIT COSTS: MANAGING NEAR TERM HEADWINDS
**Refer to Appendix A on Non-GAAP Financial Measures
(1.0%) – 1.0%
• 2017 CASM ex-fuel at top end of initial guidance
− Reduced capacity three times during course of 2017
− Excludes hurricane impact (1.3 points) and (0.5 points) in
Tax Bonus
• 1Q and full year 2018 cost guidance
− 1Q 2018: 2.0% to 4.0%, driven by sales and marketing
and other operating expenses
− Full year 2018: (1.0%) to 1.0%, driven by progress in
Structural Cost Program initiatives
• Other 2018 considerations
− CASM ex-fuel guidance excludes certain non-airline
operating expenses; immaterial to CASM ex-fuel growth
trends
2.0% – 4.0%
12
13
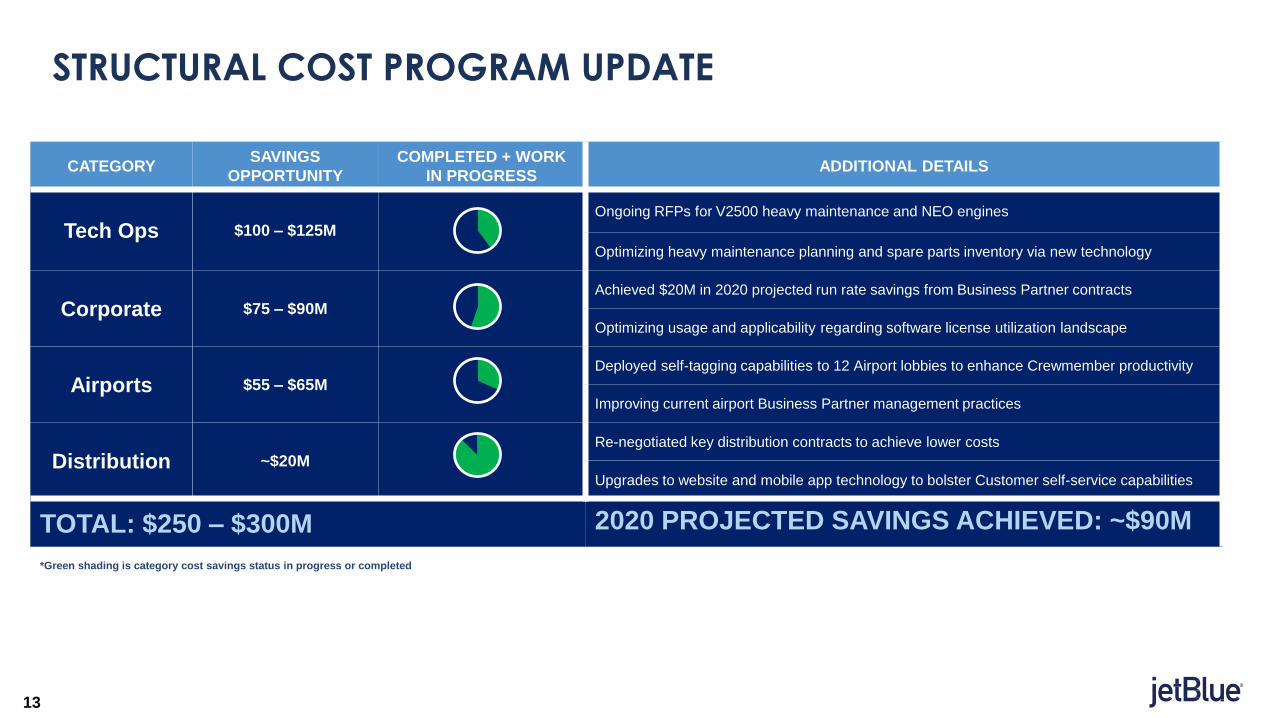
CATEGORYSAVINGS
OPPORTUNITY
COMPLETED + WORK
IN PROGRESSADDITIONAL DETAILS
Tech Ops $100 – $125M
Ongoing RFPs for V2500 heavy maintenance and NEO engines
Optimizing heavy maintenance planning and spare parts inventory via new technology
Corporate $75 – $90M
Achieved $20M in 2020 projected run rate savings from Business Partner contracts
Optimizing usage and applicability regarding software license utilization landscape
Airports $55 – $65M
Deployed self-tagging capabilities to 12 Airport lobbies to enhance Crewmember productivity
Improving current airport Business Partner management practices
Distribution ~$20M
Re-negotiated key distribution contracts to achieve lower costs
Upgrades to website and mobile app technology to bolster Customer self-service capabilities
TOTAL: $250 – $300M 2020 PROJECTED SAVINGS ACHIEVED: ~$90M
*Green shading is category cost savings status in progress or completed
STRUCTURAL COST PROGRAM UPDATE
13
1414
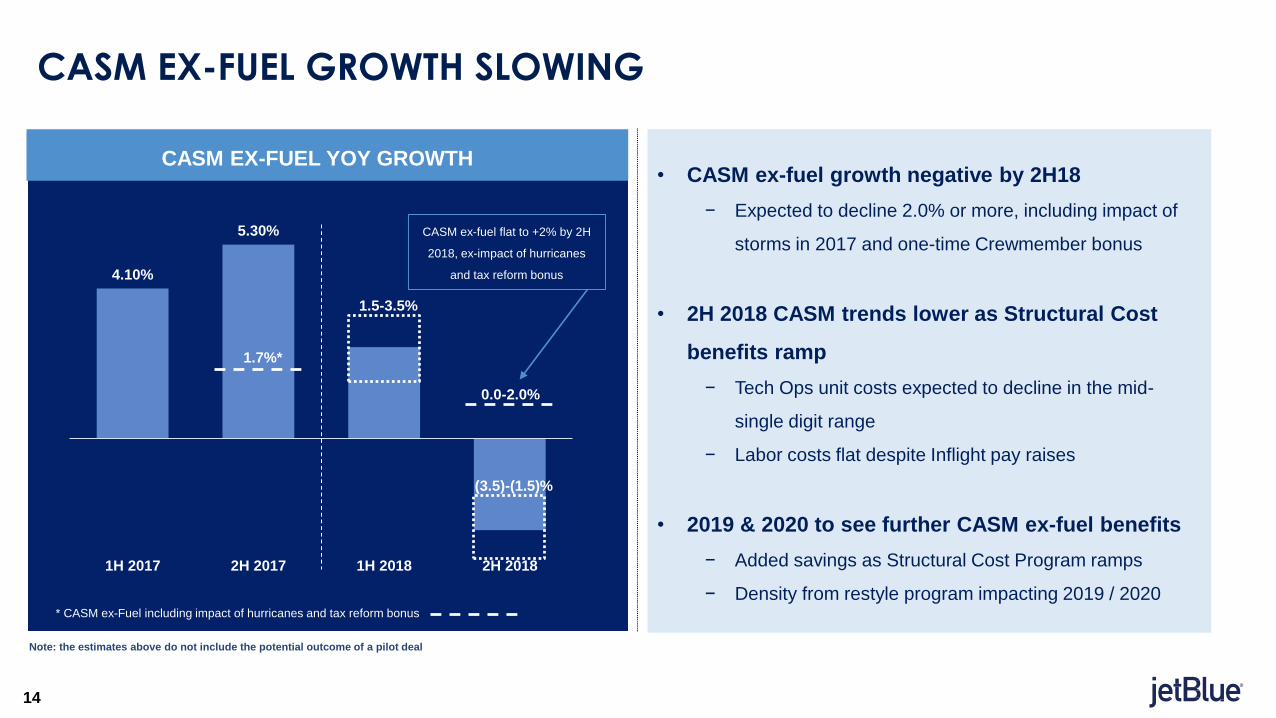
CASM EX-FUEL YOY GROWTH
4.10%
5.30%
1H 2017 2H 2017 1H 2018 2H 2018
CASM EX-FUEL GROWTH SLOWING
• CASM ex-fuel growth negative by 2H18
− Expected to decline 2.0% or more, including impact of
storms in 2017 and one-time Crewmember bonus
• 2H 2018 CASM trends lower as Structural Cost
benefits ramp
− Tech Ops unit costs expected to decline in the mid-
single digit range
− Labor costs flat despite Inflight pay raises
• 2019 & 2020 to see further CASM ex-fuel benefits
− Added savings as Structural Cost Program ramps
− Density from restyle program impacting 2019 / 2020* CASM ex-Fuel including impact of hurricanes and tax reform bonus
1.7%*
1.5-3.5%
(3.5)-(1.5)%
CASM ex-fuel flat to +2% by 2H
2018, ex-impact of hurricanes
and tax reform bonus
Note: the estimates above do not include the potential outcome of a pilot deal
14
0.0-2.0%
14
15
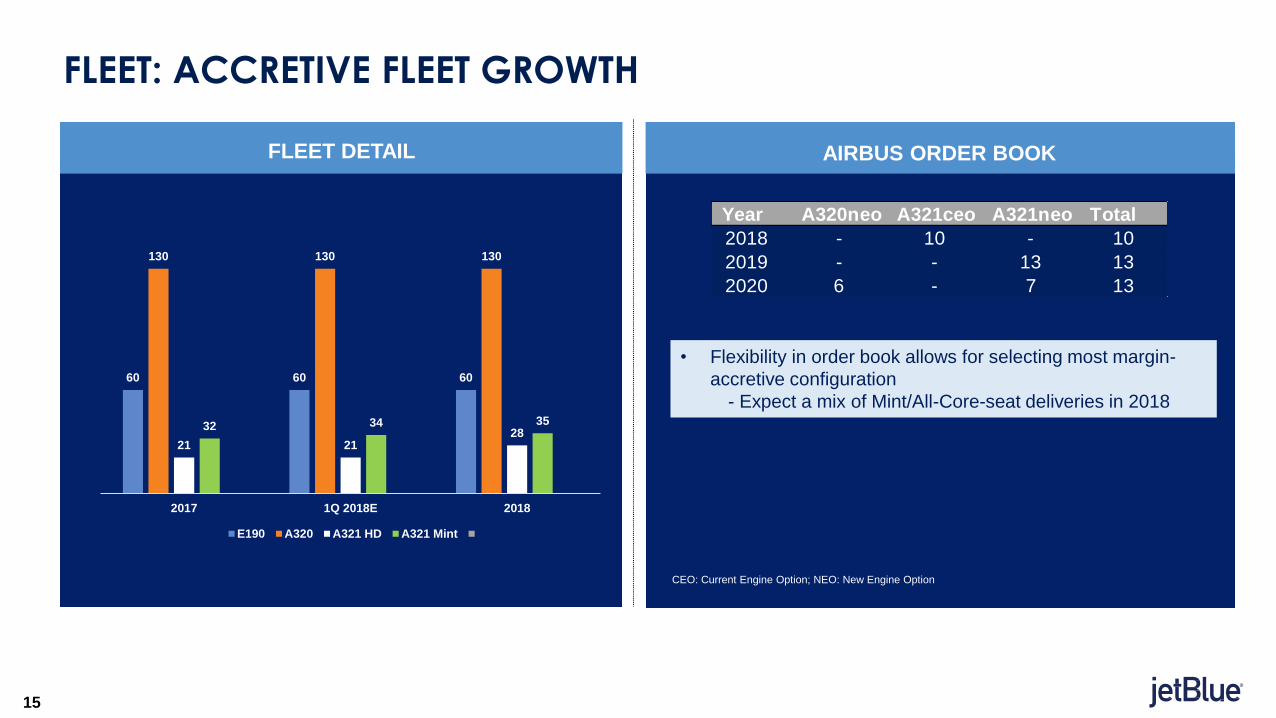
FLEET: ACCRETIVE FLEET GROWTH
AIRBUS ORDER BOOKFLEET DETAIL
CEO: Current Engine Option; NEO: New Engine Option
• Flexibility in order book allows for selecting most margin-
accretive configuration
- Expect a mix of Mint/All-Core-seat deliveries in 2018
Year A320neo A321ceo A321neo Total
2018 - 10 - 10
2019 - - 13 13
2020 6 - 7 13
60 60 60
130 130 130
21 2128
32 34 35
2017 1Q 2018E 2018
E190 A320 A321 HD A321 Mint
15
16
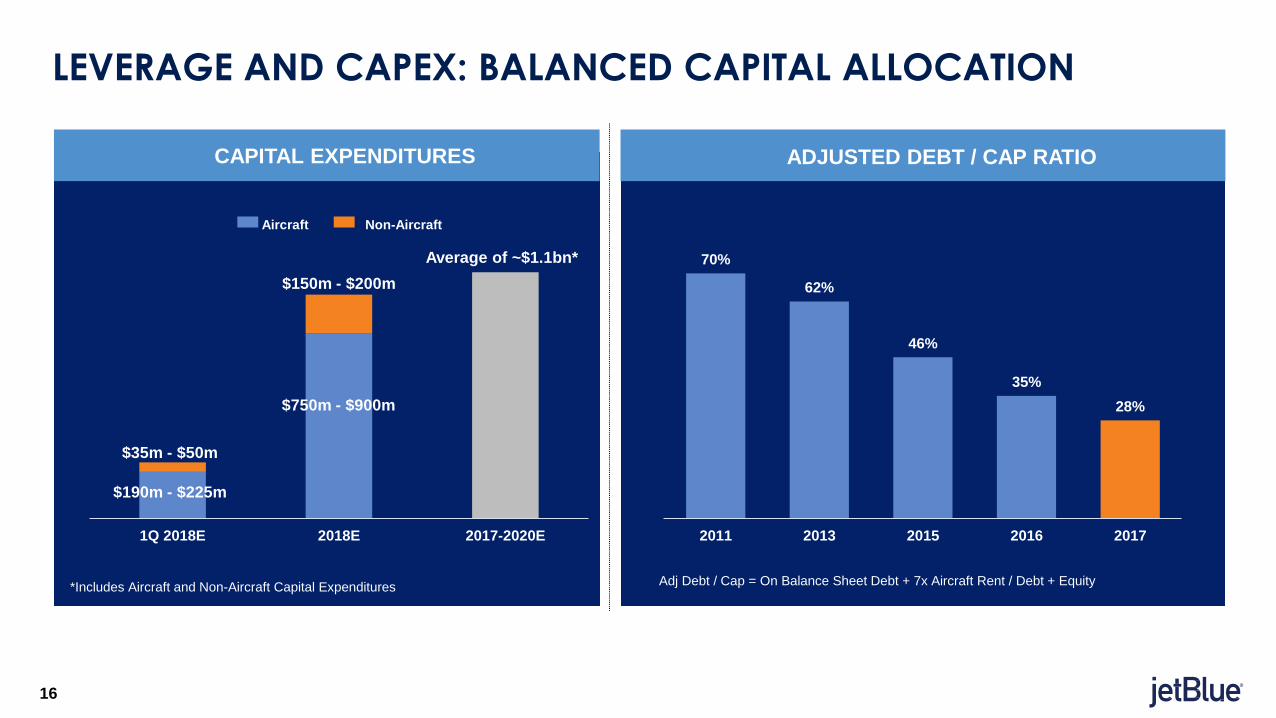
1Q 2018E 2018E 2017-2020E
LEVERAGE AND CAPEX: BALANCED CAPITAL ALLOCATION
ADJUSTED DEBT / CAP RATIO
Aircraft Non-Aircraft
Average of ~$1.1bn*
*Includes Aircraft and Non-Aircraft Capital Expenditures
$150m - $200m
$750m - $900m
$190m - $225m
$35m - $50m
CAPITAL EXPENDITURES
Adj Debt / Cap = On Balance Sheet Debt + 7x Aircraft Rent / Debt + Equity
70%
62%
46%
35%
28%
2011 2013 2015 2016 2017
16

17
2018 GUIDANCE SUMMARY
17
1Q 2018 2018
Capacity 3.5% - 5.5% 6.5% - 8.5%
RASM 2.5% to 5.5% N/A
CASM ex-Fuel 2.0% - 4.0% (1.0%) – 1.0%
All-In Fuel Price $2.16 N/A
CAPEX (Aircraft) $190 - $225 million $750 - $900 million
CAPEX (Non-Aircraft) $35 - $50 million $150 - $200 million
Other Income / (Expense) ($18) – ($23) million ($85) – ($95) million
JBTP/JTV (Expenses) ($7) – ($12) million ($35) – ($45) million

QUESTIONS
18
19
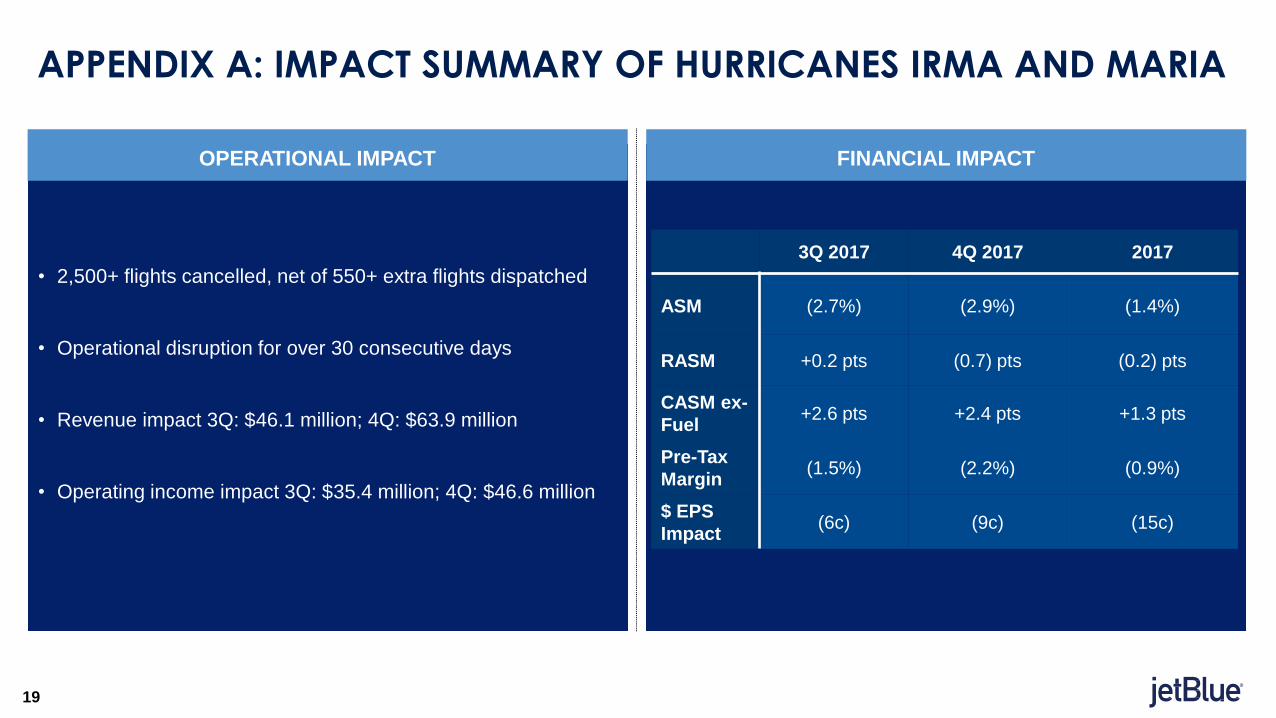
FINANCIAL IMPACT
APPENDIX A: IMPACT SUMMARY OF HURRICANES IRMA AND MARIA
OPERATIONAL IMPACT
• 2,500+ flights cancelled, net of 550+ extra flights dispatched
• Operational disruption for over 30 consecutive days
• Revenue impact 3Q: $46.1 million; 4Q: $63.9 million
• Operating income impact 3Q: $35.4 million; 4Q: $46.6 million
3Q 2017 4Q 2017 2017
ASM (2.7%) (2.9%) (1.4%)
RASM +0.2 pts (0.7) pts (0.2) pts
CASM ex-
Fuel+2.6 pts +2.4 pts +1.3 pts
Pre-Tax
Margin(1.5%) (2.2%) (0.9%)
$ EPS
Impact (6c) (9c) (15c)
19
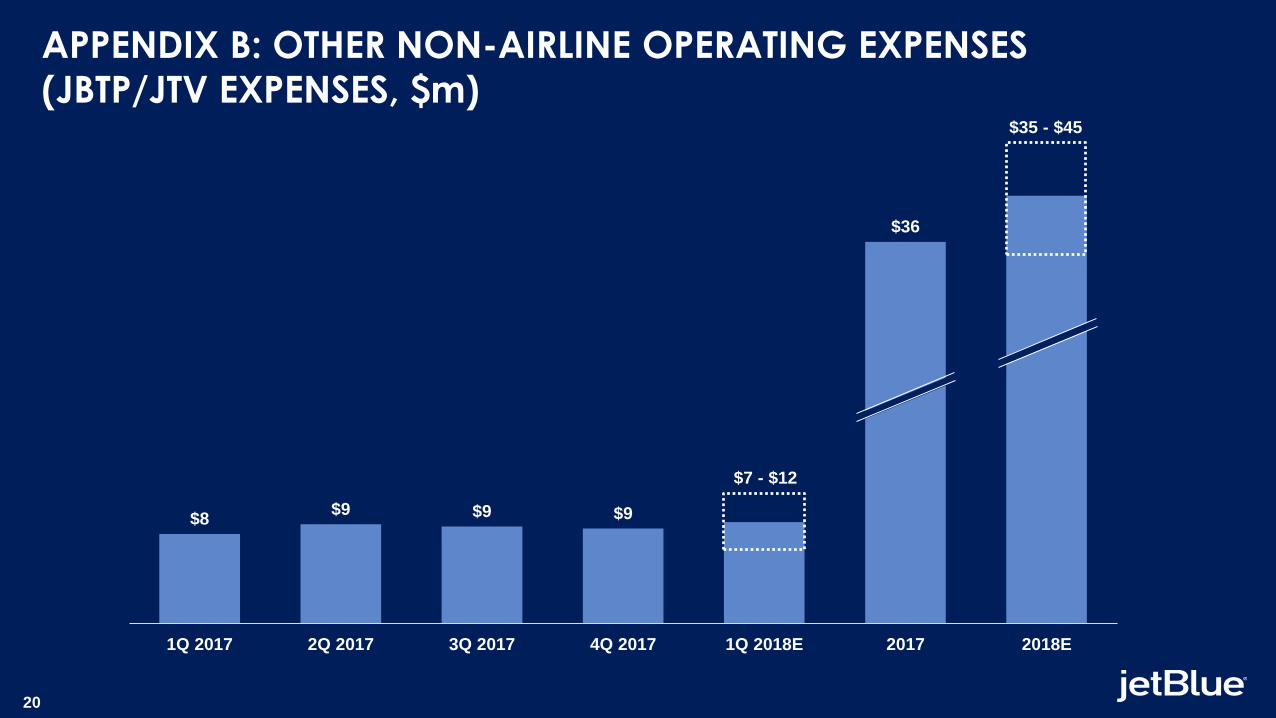
20
$8$9 $9 $9
$36
1Q 2017 2Q 2017 3Q 2017 4Q 2017 1Q 2018E 2017 2018E
APPENDIX B: OTHER NON-AIRLINE OPERATING EXPENSES
(JBTP/JTV EXPENSES, $m)
$7 - $12
$35 - $45
20
21
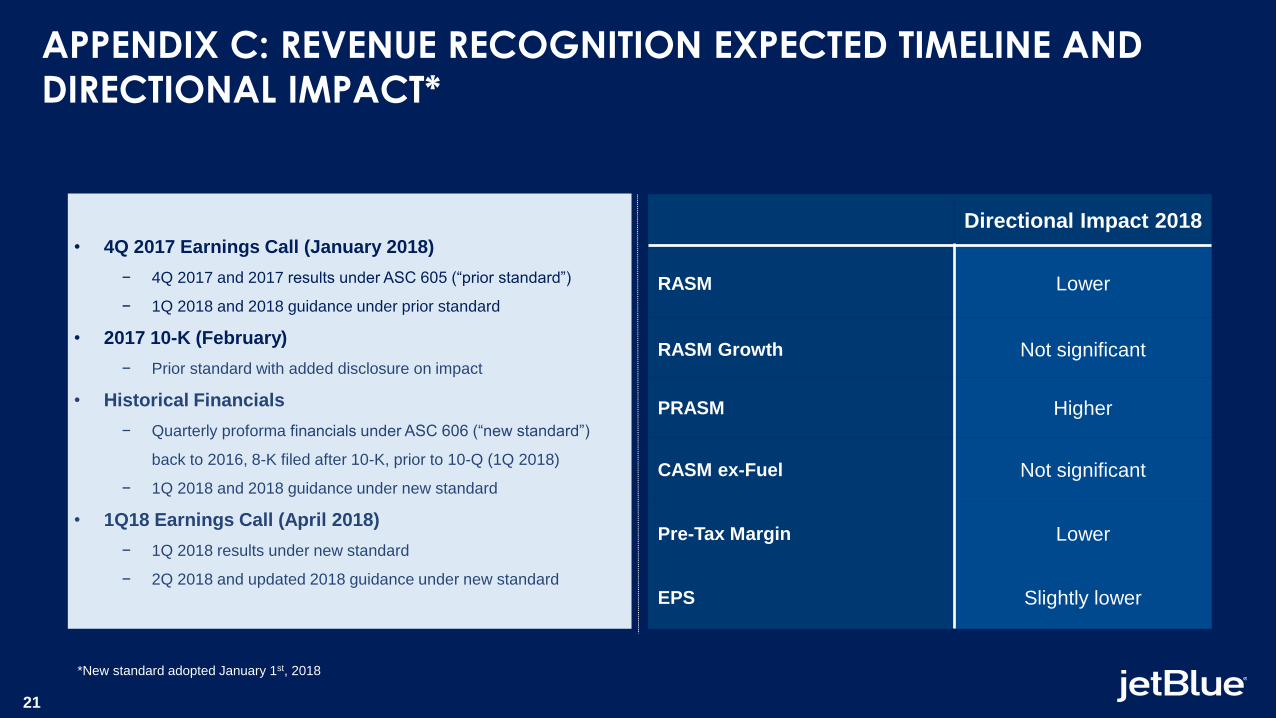
APPENDIX C: REVENUE RECOGNITION EXPECTED TIMELINE AND
DIRECTIONAL IMPACT*
Directional Impact 2018
RASM Lower
RASM Growth Not significant
PRASM Higher
CASM ex-Fuel Not significant
Pre-Tax Margin Lower
EPS Slightly lower
• 4Q 2017 Earnings Call (January 2018)
− 4Q 2017 and 2017 results under ASC 605 (“prior standard”)
− 1Q 2018 and 2018 guidance under prior standard
• 2017 10-K (February)
− Prior standard with added disclosure on impact
• Historical Financials
− Quarterly proforma financials under ASC 606 (“new standard”)
back to 2016, 8-K filed after 10-K, prior to 10-Q (1Q 2018)
− 1Q 2018 and 2018 guidance under new standard
• 1Q18 Earnings Call (April 2018)
− 1Q 2018 results under new standard
− 2Q 2018 and updated 2018 guidance under new standard
21
*New standard adopted January 1st, 2018
2222
Consolidated operating cost per available seat mile, excludes fuel and related taxes, and operating expenses
related to other non-airline expenses (CASM Ex-Fuel) is a non-GAAP financial measure that we use to
measure our core performance. Note A within our quarterly earnings release provides a reconciliation of non-
GAAP financial measures used in this presentation and provides the reasons management uses those
measures.
APPENDIX D: NOTE ON NON-GAAP FINANCIAL MEASURES