january 2017 manhattan beach real estate market trends update
TRANSCRIPT

Table of
Contents
Key Statistics for January
Sales 2017 Residential Sales Stats Year-to-Year Total Sales by Map Area Median 2017 Median Sales Stats Year-to-Year Median Sales by Map Area Listings 2017 Active Listings by Map Area 2017 Total Active Listings vs. Total Sales Year-to-Year Active Listings by Map Area Inventory 2017 Months of Inventory by Map Area Year-to-Year Months of Inventory
Summary
About Hady Chahine Contact Information
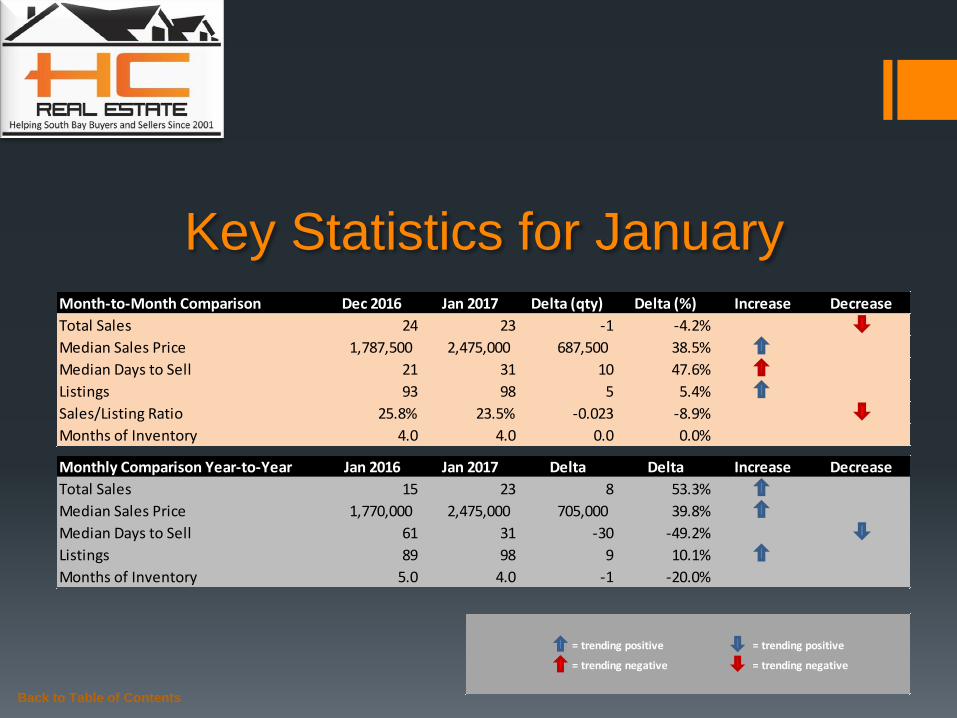
Key Statistics for January
Back to Table of Contents
= trending positive = trending positive
= trending negative = trending negative
Month-to-Month Comparison Dec 2016 Jan 2017 Delta (qty) Delta (%) Increase Decrease
Total Sales 24 23 -1 -4.2%
Median Sales Price 1,787,500 2,475,000 687,500 38.5%
Median Days to Sell 21 31 10 47.6%
Listings 93 98 5 5.4%
Sales/Listing Ratio 25.8% 23.5% -0.023 -8.9%
Months of Inventory 4.0 4.0 0.0 0.0%
Monthly Comparison Year-to-Year Jan 2016 Jan 2017 Delta Delta Increase Decrease
Total Sales 15 23 8 53.3%
Median Sales Price 1,770,000 2,475,000 705,000 39.8%
Median Days to Sell 61 31 -30 -49.2%
Listings 89 98 9 10.1%
Months of Inventory 5.0 4.0 -1 -20.0%
Back to Table of Contents
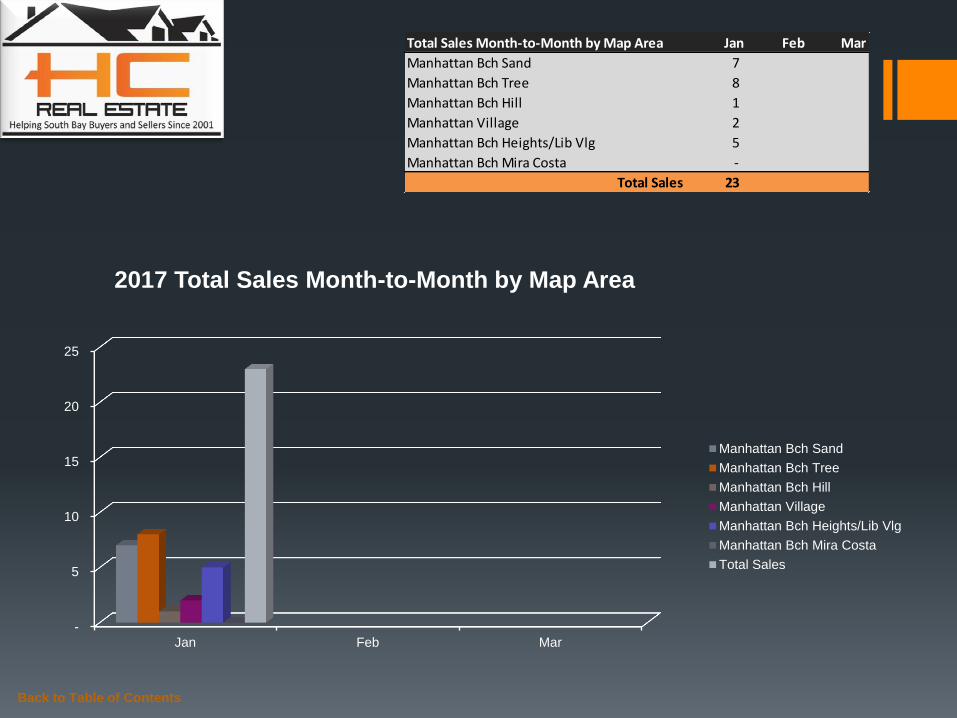
Total Sales Month-to-Month by Map Area Jan Feb Mar
Manhattan Bch Sand 7
Manhattan Bch Tree 8
Manhattan Bch Hill 1
Manhattan Village 2
Manhattan Bch Heights/Lib Vlg 5
Manhattan Bch Mira Costa -
Total Sales 23
-
5
10
15
20
25
Jan Feb Mar
2017 Total Sales Month-to-Month by Map Area
Manhattan Bch Sand
Manhattan Bch Tree
Manhattan Bch Hill
Manhattan Village
Manhattan Bch Heights/Lib Vlg
Manhattan Bch Mira Costa
Total Sales
Back to Table of Contents
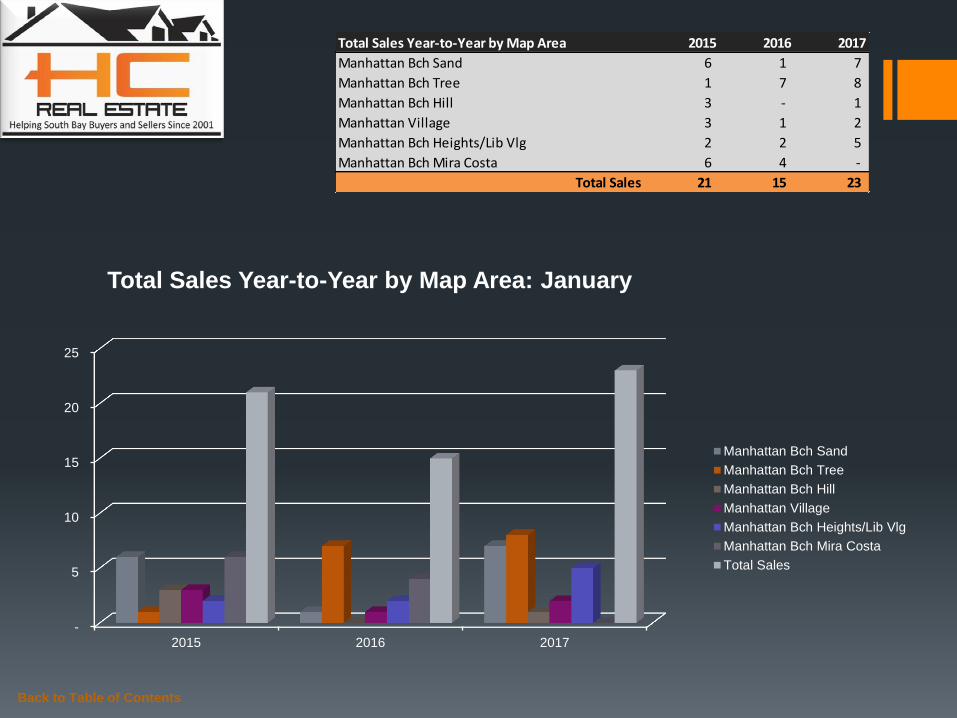
Total Sales Year-to-Year by Map Area 2015 2016 2017
Manhattan Bch Sand 6 1 7
Manhattan Bch Tree 1 7 8
Manhattan Bch Hill 3 - 1
Manhattan Village 3 1 2
Manhattan Bch Heights/Lib Vlg 2 2 5
Manhattan Bch Mira Costa 6 4 -
Total Sales 21 15 23
-
5
10
15
20
25
2015 2016 2017
Total Sales Year-to-Year by Map Area: January
Manhattan Bch Sand
Manhattan Bch Tree
Manhattan Bch Hill
Manhattan Village
Manhattan Bch Heights/Lib Vlg
Manhattan Bch Mira Costa
Total Sales
Back to Table of Contents
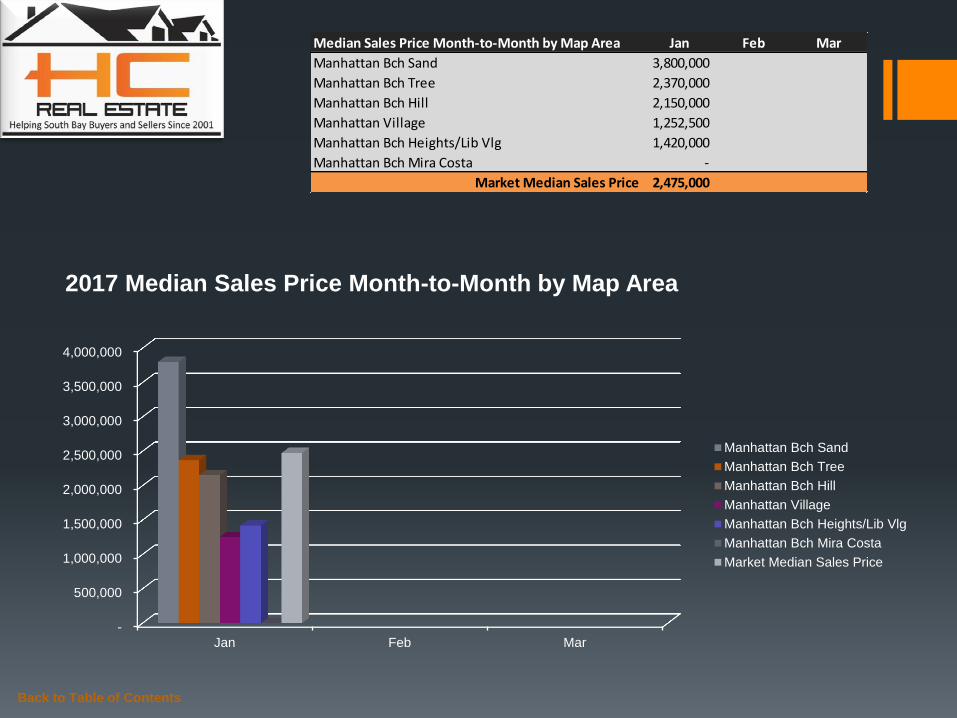
Median Sales Price Month-to-Month by Map Area Jan Feb Mar
Manhattan Bch Sand 3,800,000
Manhattan Bch Tree 2,370,000
Manhattan Bch Hill 2,150,000
Manhattan Village 1,252,500
Manhattan Bch Heights/Lib Vlg 1,420,000
Manhattan Bch Mira Costa -
Market Median Sales Price 2,475,000
-
500,000
1,000,000
1,500,000
2,000,000
2,500,000
3,000,000
3,500,000
4,000,000
Jan Feb Mar
2017 Median Sales Price Month-to-Month by Map Area
Manhattan Bch Sand
Manhattan Bch Tree
Manhattan Bch Hill
Manhattan Village
Manhattan Bch Heights/Lib Vlg
Manhattan Bch Mira Costa
Market Median Sales Price
Back to Table of Contents
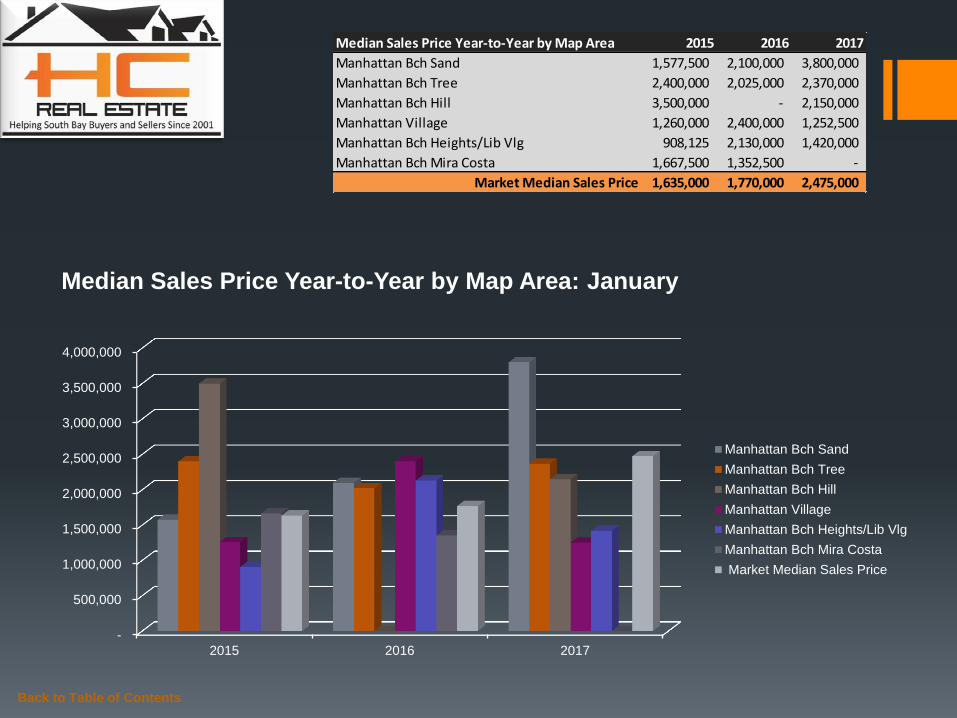
Median Sales Price Year-to-Year by Map Area 2015 2016 2017
Manhattan Bch Sand 1,577,500 2,100,000 3,800,000
Manhattan Bch Tree 2,400,000 2,025,000 2,370,000
Manhattan Bch Hill 3,500,000 - 2,150,000
Manhattan Village 1,260,000 2,400,000 1,252,500
Manhattan Bch Heights/Lib Vlg 908,125 2,130,000 1,420,000
Manhattan Bch Mira Costa 1,667,500 1,352,500 -
Market Median Sales Price 1,635,000 1,770,000 2,475,000
-
500,000
1,000,000
1,500,000
2,000,000
2,500,000
3,000,000
3,500,000
4,000,000
2015 2016 2017
Median Sales Price Year-to-Year by Map Area: January
Manhattan Bch Sand
Manhattan Bch Tree
Manhattan Bch Hill
Manhattan Village
Manhattan Bch Heights/Lib Vlg
Manhattan Bch Mira Costa
Market Median Sales Price

Back to Table of Contents
Active Listings vs. Total Sales by Map Area Jan Feb Mar Apr May Jun Jul Aug Sep Oct Nov Dec
Manhattan Bch Sand 42
Manhattan Bch Tree 16
Manhattan Bch Hill 14
Manhattan Village 3
Manhattan Bch Heights/Lib Vlg 3
Manhattan Bch Mira Costa 20
Total Active Listings 98
-
5
10
15
20
25
30
35
40
45
Jan Feb Mar Apr May Jun Jul Aug Sep Oct Nov Dec
2017 Active Listings by Map Area
Manhattan Bch Sand
Manhattan Bch Tree
Manhattan Bch Hill
Manhattan Village
Manhattan Bch Heights/Lib Vlg
Manhattan Bch Mira Costa
Back to Table of Contents
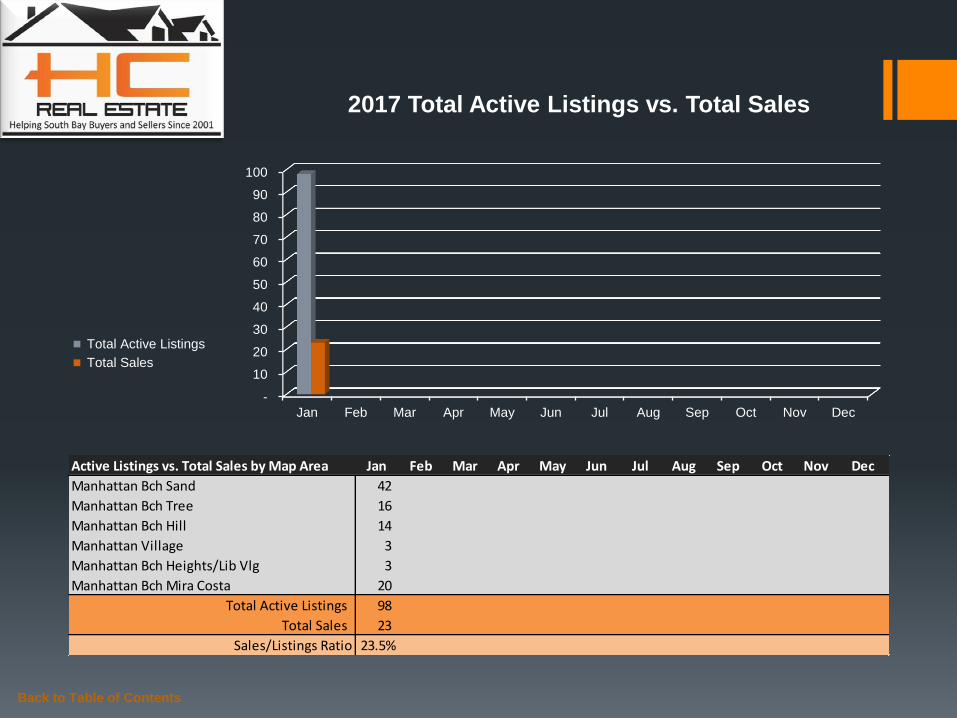
Active Listings vs. Total Sales by Map Area Jan Feb Mar Apr May Jun Jul Aug Sep Oct Nov Dec
Manhattan Bch Sand 42
Manhattan Bch Tree 16
Manhattan Bch Hill 14
Manhattan Village 3
Manhattan Bch Heights/Lib Vlg 3
Manhattan Bch Mira Costa 20
Total Active Listings 98
Total Sales 23
Sales/Listings Ratio 23.5%
-
10
20
30
40
50
60
70
80
90
100
Jan Feb Mar Apr May Jun Jul Aug Sep Oct Nov Dec
2017 Total Active Listings vs. Total Sales
Total Active Listings
Total Sales

Back to Table of Contents
Active Listings Year-to-Year by Map Area 2015 2016 2017
Manhattan Bch Sand 17 33 42
Manhattan Bch Tree 15 17 16
Manhattan Bch Hill 3 7 14
Manhattan Village 4 4 3
Manhattan Bch Heights/Lib Vlg 4 4 3
Manhattan Bch Mira Costa 12 24 20
Total Active Listings 55 89 98
-
10
20
30
40
50
60
70
80
90
100
2015 2016 2017
Active Listings Year-to-Year by Map Area: January
Manhattan Bch Sand
Manhattan Bch Tree
Manhattan Bch Hill
Manhattan Village
Manhattan Bch Heights/Lib Vlg
Manhattan Bch Mira Costa
Total Active Listings

Back to Table of Contents
Months of Inventory by Map Area Jan Feb Mar Apr May Jun Jul Aug Sep Oct Nov Dec
Manhattan Bch Sand 6.0
Manhattan Bch Tree 2.0
Manhattan Bch Hill 14.0
Manhattan Village 2.0
Manhattan Bch Heights/Lib Vlg 1.0
Manhattan Bch Mira Costa -
-
2.0
4.0
6.0
8.0
10.0
12.0
14.0
Jan Feb Mar Apr May Jun Jul Aug Sep Oct Nov Dec
2017 Months of Inventory by Map Area
Manhattan Bch Sand
Manhattan Bch Tree
Manhattan Bch Hill
Manhattan Village
Manhattan Bch Heights/Lib Vlg
Manhattan Bch Mira Costa

Back to Table of Contents
Months of Inventory Year-to-Year Jan Feb Mar Apr May Jun Jul Aug Sep Oct Nov Dec
2015 3.0 3.0 2.0 2.0 2.0 3.0 3.0 3.0 3.0 3.0 4.0 3.0
2016 5.0 5.0 4.0 4.0 3.0 4.0 5.0 3.0 3.0 3.0 3.0 4.0
2017 4.0
-
0.5
1.0
1.5
2.0
2.5
3.0
3.5
4.0
4.5
5.0
Jan Feb Mar Apr May Jun Jul Aug Sep Oct Nov Dec
Months of Inventory Year-to-Year
2015
2016
2017

Summary January real estate investment in Manhattan Beach residential properties produced 23 closed escrows, a 38.5% bump in the
median sales price, and a 5.4% increase in net listings. Unfortunately median days to sell and sales-listing ratios both moved in
negative directions, with the former spiking 47.6% while the latter dropped 8.9%. Year-over-year months of inventory data point
fell from 5.0 in 2016 to 4.0 in 2017 (or 20%).
In January, C.A.R. reported “Despite strong headwinds of tight housing supplies and an affordability squeeze throughout
much of 2016, California’s housing market ended the year on a positive note, posting a moderate sales pace and home price
increases in December.” http://www.car.org/newsstand/newsreleases/2017releases/dec2016sales?view=Standard
For listing or buying guidance, or additional statistics on market trending behavior, please do not hesitate to contact me to
schedule a time to discuss how I can be of service to you.
Back to Table of Contents
Monthly Comparison Year-to-Year Jan 2016 Jan 2017 Delta Delta Increase Decrease
Total Sales 15 23 8 53.3%
Median Sales Price 1,770,000 2,475,000 705,000 39.8%
Median Days to Sell 61 31 -30 -49.2%
Listings 89 98 9 10.1%
Months of Inventory 5.0 4.0 -1 -20.0%
Month-to-Month Comparison Dec 2016 Jan 2017 Delta (qty) Delta (%) Increase Decrease
Total Sales 24 23 -1 -4.2%
Median Sales Price 1,787,500 2,475,000 687,500 38.5%
Median Days to Sell 21 31 10 47.6%
Listings 93 98 5 5.4%
Sales/Listing Ratio 25.8% 23.5% -0.023 -8.9%
Months of Inventory 4.0 4.0 0.0 0.0%

Serving South Bay Home Buyers and Sellers Since 2001
RE/MAX Top 4 Team in California – 2012
RE/MAX 100% Club - 2011
Shorewood Realtors Top 5% in Overall Sales 2001-2006, 2008-2010
Back to Table of Contents
About
Hady Chahine…

The information being provided by CARETS (CLAW, CRISNet MLS, DAMLS, CRMLS, i-Tech MLS, and/or VCRDS) is for the visitor’s personal, non-commercial use and may not be used for
any purpose other than to identify prospective properties visitor may be interested in purchasing. Any information relating to a property referenced on this web site comes from the Internet
Data Exchange (IDX) program of CARETS. This web site may reference real estate listing(s) held by a brokerage firm other than the broker and/or agent who owns this web site. The accuracy
of all information, regardless of source, including but not limited to square footages and lot sizes, is deemed reliable but not guaranteed and should be personally verified through personal
inspection by and/or with the appropriate professionals.
Back to Table of Contents
Listings MLS BLOG Website
Hady Chahine
• 310-404-5361