january 14, 2012, flims, switzerland managing for growth
TRANSCRIPT

Managing for growth and costMichel Demaré, CFO
January 14, 2012, Flims, Switzerland

Chart 2
Safe harbor statement
This presentation includes forward-looking information and statements as well as other statements concerning the outlook for our business. These statements are based on current expectations, estimates and projections about the factors that may affect our future performance, including global economic conditions, the economic conditions of the regions and industries that are major markets for ABB Ltd. These expectations, estimates and projections are generally identifiable by statements containing words such as “aims,”“expects,” “believes,” “estimates,” “targets,” “plans” or similar expressions. However, there are many risks and uncertainties, many of which are beyond our control, that could cause our actual results to differ materially from the forward-looking information and statements made in this presentation and which could affect our ability to achieve any or all of our stated targets. The important factors that could cause such differences include, among others, business risks associated with the volatile global economic environment and political conditions, costs associated with compliance activities, raw materials availability and prices, market acceptance of new products and services, changes in governmental regulations and currency exchange rates and such other factors as may be discussed from time to time in ABB Ltd’s filings with the U.S. Securities and Exchange Commission, including its Annual Reports on Form 20-F. Although ABB Ltd believes that its expectations reflected in any such forward-looking statement are based upon reasonable assumptions, it can give no assurance that those expectations will be achieved.

Chart 3
An introduction to ABB A global leader in power and automation
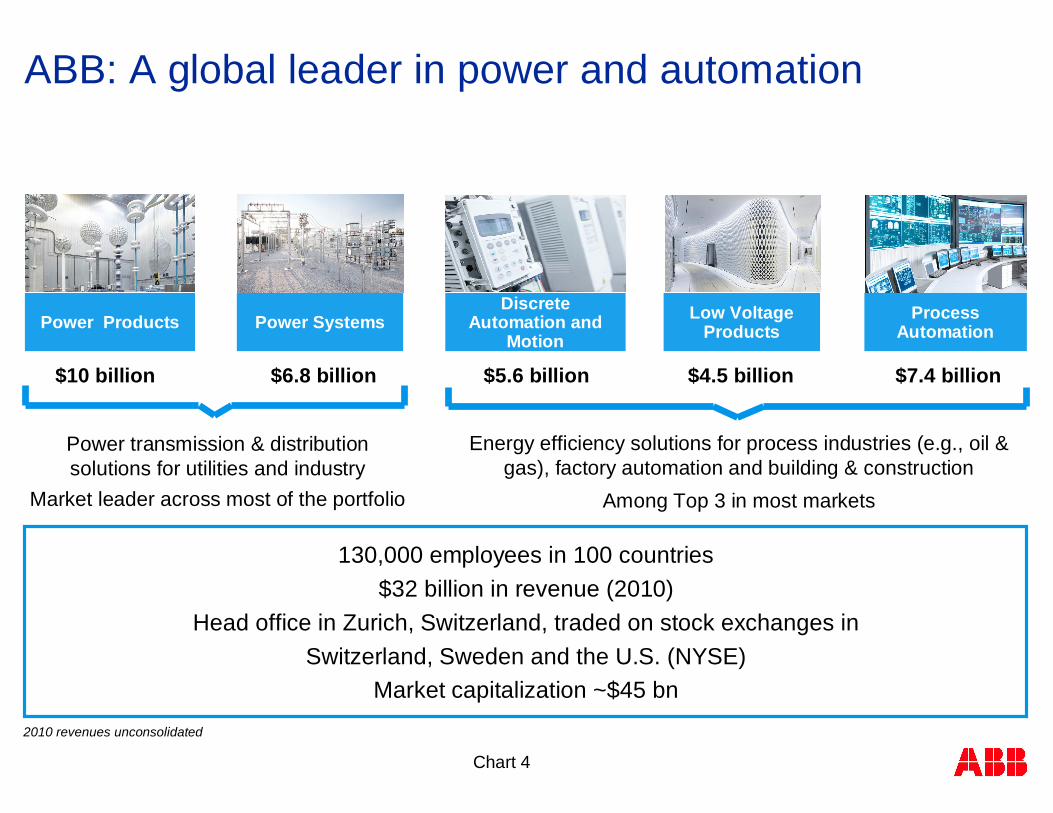
Chart 4
ABB: A global leader in power and automation
Power Products Power SystemsDiscrete
Automation and Motion
Process Automation
$10 billion $6.8 billion $5.6 billion $7.4 billion
Low Voltage Products
$4.5 billion
2010 revenues unconsolidated
130,000 employees in 100 countries$32 billion in revenue (2010)
Head office in Zurich, Switzerland, traded on stock exchanges inSwitzerland, Sweden and the U.S. (NYSE)
Market capitalization ~$45 bn
Power transmission & distribution solutions for utilities and industry
Market leader across most of the portfolio
Energy efficiency solutions for process industries (e.g., oil & gas), factory automation and building & construction
Among Top 3 in most markets

Chart 5
ABB serves a broad customer baseWith both direct and indirect sales channels
* As a percentage of total 2010 Divisional revenues; approximations
End markets served*
10%
15%
5%
10%
15%
20%
5%
5%5%10%
Power generation
Power distribution
Power transmission
Discrete mfg,automotive & transport
Buildings
Oil, gas & petrochemicals
Minerals & metals
Pulp & paper
Marine
Other
Utility customers
(mainly direct channels)
Industrial customers
(both direct and indirect channels)

Chart 6
28%
16%
21%
13%
22%
Orders by division% of total orders 2010 (non-consolidated)
Orders by region% of total orders 2010
Power Systems
Discrete Automation and Motion
Europe
Asia
Americas
Middle East and Africa
Well-balanced business and geographic portfolioCapturing growth opportunities, wherever they arise
Share of employees2010
48%
Mature markets
Emerging markets
Power Products Process
Automation
Low Voltage Products
52%
Chart 7
ABB’s recent business performance Resilience through the cycle

Chart 8
2006
$1.9
2007
$3.1
2008
$4.0
2009
$4.0
2010
$4.2
Cash Flow from Operations (CFO) and CFO to EBITDA(1)
2006
$23.3
2007
$29.2
2008
$34.9
2009
$31.8
2010
$31.6
2006
42%
58%
2007
45%
55%
2008
45%
55%
2009
48%
52%
2010
50%
50%
2010 Peers
31%
69%
Revenue ABB vs. peer group Geographic revenue mix between 2006 - 2010
Dividend development ABB vs. peer group
Nominal revenue, $ bn, index 2006
Emerging Markets
MatureMarkets
=19%
Index DPS 2006: ABB = CHF0.24, Peers = $1.79
ABB
Peers
Index= 100
150ABB
Peers
CAGR % 2006-2010
6.3%
2.7%
2006 2007 2008 2009 2010
ABB
Peers
Index= 100
200
300
60%
100%CFO to EBITDA (%)
Peer Group: Cooper, Eaton Electric, Emerson, Rockwell, Schneider Electric, Siemens
Source: Thomson Reuters
(1) Adjusted for compliance provision in 2008 and 2009
ABB performed well through previous downturn

Chart 9
0
10'000
20'000
30'000
40'000
2006 2007 2008 2009 2010 9m 11annualized
Performance against our 2007 – 2011 targetsRevenues: Close despite historic downturn
Revenues and revenue CAGR 2007 – 20111
% change year-on-year in local currencies
CAGR %
10%
15%
20%
5%
0%
Target CAGR range = 8 – 11%
Organic CAGR ~7%
incl. Baldor
excl. Baldor
1 2011 annualized using 9-months to Sept 2011
Revenues US$ millions

Chart 10
Performance against our 2007 – 2011 targetsEBIT margin: Within/above range each Q over the cycle
1 2007-08 EBIT adj. for transformer restructuring; 2008-10 adj. for cost take-out restructuring program; 2008-09 adjusted for compliance and other provisions;
2009-11 = operational EBIT
EBIT margin1 full year and by quarter 2007 – 9 months 2011% revenues
8
10
12
14
16
18
2007 2008 2009 2010 9m 11
Full year
By quarter
Target range = 11 – 16%
Reliable earnings deliveryHigh-margin businesses maintained solid performanceFast, effective cost take-outSuccessful crisis management

Chart 11
Enhancing competitiveness through cost reduction>$3.5bn savings starting in 2009
Annual impact vs. 2008US$ bn
Sourcing
Footprint
Operational Excellence
Some achievements since we started:
25% more floor space in EMsR&D resources in EMs up 4x (>1’500 people) since 2005
>400 products re-designed to costWarranty savings: >$100 mill
G&A cost
1.8
Emerging market sourcing up 40%No. global forwarders 50% lower
0.8
0.9
0.3 Shared service savings >$100 millRenegotiated IS outsourcing: $50 mill

Chart 12
6.0
11.0 11.2
14.5 15.5
16.4
1.5
5.4 5.4 7.2 6.4
1.0
2006 2007 2008 2009 2010 Sep 11
An unprecedented financial crisis ABB emerges with strongest balance sheet everTotal stockholders’ equity and net debt/cash2006 – Sep 30, 2011US$ billions
Dividends paid 2005 – 2011Swiss francs millions
Equity
Net debt/cash
248
547
1'098
1'374
1'1651'096
2005 2006 2007 2008 2009 2010 2011
Dividend policyTo pay a steadily rising, sustainable dividend
over time
1 Chart shows amount of dividends in the year paid
M&A: $7 bn spent since 2007
Dividends: CHF 5.3 bn paid

Chart 13
ABB returned to bond markets with $2.5 bn new issuesExtended bond maturity at attractive rates
New issues in 2011/12
144a/RegS US bond issues$600 million 5-year at 2.50%$650 million 10-year at 4.00%
Swiss bond issuesCHF 500 million 5-year at 1.25%CHF 350 million 10-year at 2.25%CHF 350 million long 5-year at 1.50%
Average bond maturity as of Jan 2012 = 5.4 years
Since 2007, two rating upgrades and a return to solid Single A investment grade
905
600
372
650
372531
Q2 2013 Q2 2016 Q4 2016 Q4 2018 Q2 2021 Q4 2021
US$ millions

Chart 14
An overview of the 2011-2015 strategy Managing for growth and cost competitiveness

Chart 15
Five components of ABB strategic directionStrong execution focus across key strategic areas
Drive competitiveness and stay relevant in our current markets 1Capitalize on mega trends: anticipate, participate and lead in key mega trends2Aggressively expand core business to secure next level of growth 3Disciplined M&A across products, markets and geographies 4Find and exploit disruptive opportunities in relevant markets 5

Chart 16
Drive competitivenessFocus on a range of Group-wide programs
Global footprint
Ambition Focus areas
Supply chain management
Operational excellence
“To develop, produce, source and sell optimally to match market needs, profitably growing the business while increasing levels of productivity and quality”
1
In country for country
Customer satisfaction
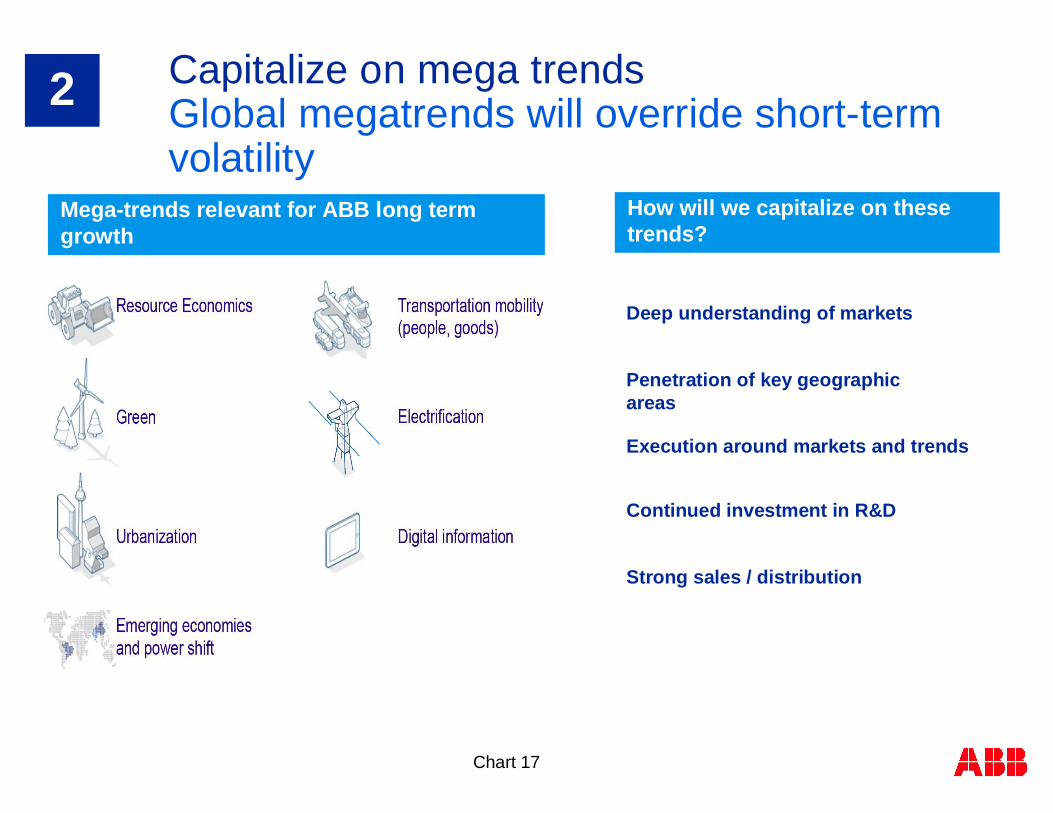
Chart 17
Capitalize on mega trendsGlobal megatrends will override short-term volatility
2
Mega-trends relevant for ABB long term growth
Deep understanding of markets
Penetration of key geographic areas
Execution around markets and trends
Continued investment in R&D
Strong sales / distribution
How will we capitalize on these trends?

Chart 18
Leverage existing market position, technology and relationships for growth
Grow service and software contribution from 16% to ~ 25% of revenues
Lead in grid expansion through HVDC and FACTS
Exploit energy savings opportunities in services, systems and products
Aggressively pursue vertical markets & services opportunities
Cultivate product opportunities: solar inverters, DCS for power generation, general purpose MV drives, discrete automation…
Aggressively expand core business to securenext level of growth3

Chart 19
Markets
Oil & gas, e.g. subsea
Smart grids
Renewables, e-mobility
Data centers
Wind, water and rail
Smart building controls
Product and Services
PLCs, solar Inverters
Industrial software
High service products
Electro mechanicals
Flow valves, measurements
Geography
NEMA motors in US
India, USA low voltage
US ANSI, NEMA Markets
South East Asia Penetration
China, relays, MV drives
Disciplined M&A to close gap areasAcquisitions as accelerators4

Chart 20
Technology and business model disruptions that position ABB for market leadership5
#1 Smart Phone
#2 Social Networking
#3 Voice Over IP
#4 LED lighting
Top technologies of the decade
(1)
(1) Institute of Electrical and Electronics Engineers , one of the world’s largest professional associations for the advancement of technology.
# 9 ABB’s Pioneer Technology - FACTs
An enabler for a “smarter grid”Increase transmission capacity – up to 50%Improve system stability/reliabilityImprove power quality
ABB Position:Pioneer and technology leaderWorld’s leading supplierDelivered >50% of world total installations
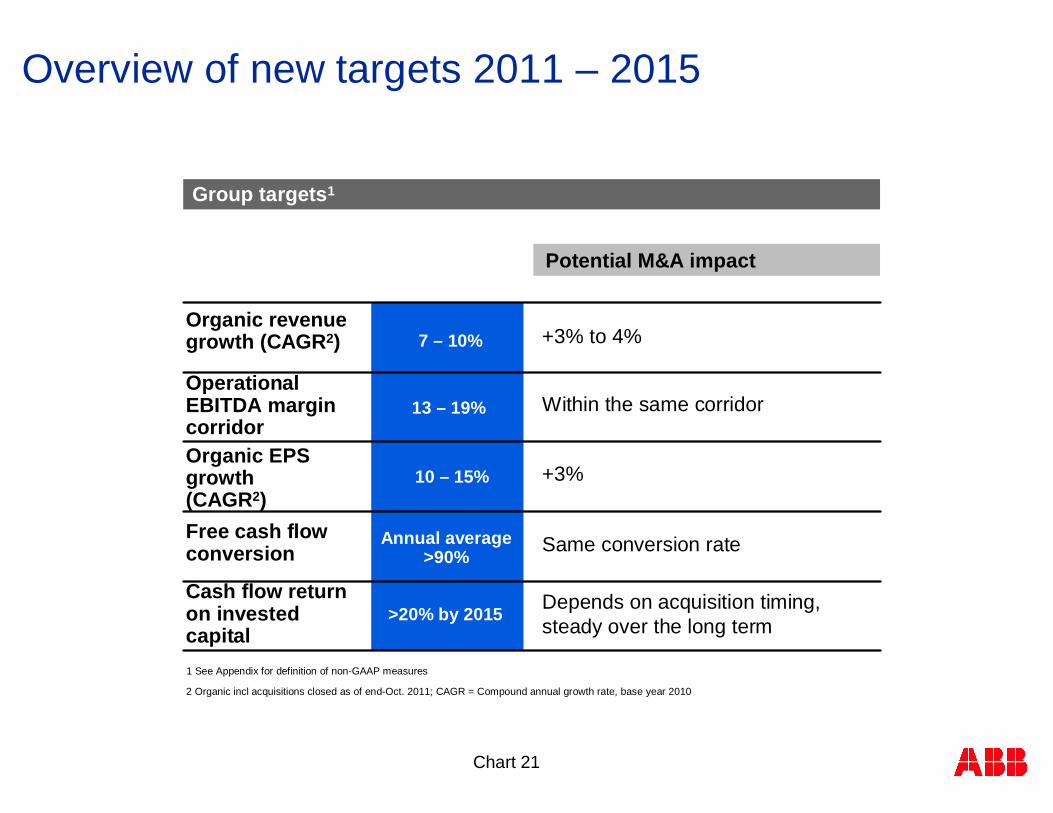
Chart 21
Overview of new targets 2011 – 2015
Potential M&A impact
2 Organic incl acquisitions closed as of end-Oct. 2011; CAGR = Compound annual growth rate, base year 2010
+3% to 4%
Within the same corridor
+3%
Same conversion rate
Depends on acquisition timing, steady over the long term
Group targets1
Organic revenue growth (CAGR2)
Operational EBITDA margin corridorOrganic EPS growth (CAGR2)Free cash flow conversion
Cash flow return on invested capital
7 – 10%
13 – 19%
10 – 15%
Annual average>90%
>20% by 2015
1 See Appendix for definition of non-GAAP measures

Chart 22
0
2
4
6
8
10
2010 2011 2012 2013 2014 2015
ABB’s organic revenue growth target (CAGR) = >2x GDP
2011 – 2015 plan assumptionsWe expect to outgrow global GDP by more than 2x
Assumptions based on a slowdown in next 18 months, not a deep recession
World GDP to grow 3–4%1 p.a., emerging market (EM) growth >2x developed markets
Global industrial capex to grow 5–6% p.a., EM capex share growing to 65% from < 60%
ABB’s markets assumed to grow 6% CAGR over the period
World GDP growth assumptions2
Real GDP growth %
1 Compound annual growth rate, base year 2010; 2 Source: Global Insight
3% CAGR
4% CAGR

Chart 23
2011 – 2015 plan assumptionsExecution to balance cost AND growth remains key
Market assumptions
Emerging markets keep commodity prices high – good for business, challenge for input costs
Plan assumes stable forex, changes compensated by hedging policy and balanced footprint
Price pressure and emerging market competition are a fact of life –continuous cost savings required to incrementally improve gross margin
Strategic parameters
Portfolio remains focused on Power and Automation – no divestments planned
M&A capacity to potentially increase top line CAGR1 by 3-4% (not included in targets)
1 Compound annual growth rate, base year 2010

Chart 24
Group Target #1Organic revenue growth 7% to 10% a year CAGR
Revenue growth CAGR1 2011 – 2015Base year = 2010
Base scenario
2010 2015
Additional 3–4%potential from M&A
Baldor, Ventyx and Mincom account for ~1.5% of7–10% organic growth – they’re in the portfolio today“Pure” organic growth is 5.5% to 8.5% CAGR
7–10% CAGR organic
Emerging market strategy: “In country, for country”
Mature economy focus: gain share in local markets
Further focus on energy efficiency, grids, renewables
Service and software growth in high teens, to reach >20% total sales
2 Source: Global Insight1 Compound annual growth rate, base year 2010
World GDP2
3%
ABB's market6%
ABB's revenues7 – 10%

Chart 25
2007 2008 2009 2010 2012 2013 2014 2015
Group Target #2Operational EBITDA margin corridor 13% to 19%
Drivers
Service and software growth expected to lift Group margins from current levelsValue-based pricing, packaged solutionsCost savings to protect gross margins – primarily sourcing, operational excellence and footprintSteady G&A to absorb more volume
Supportive
Dilutive
Continuous price pressure – emerging competitors, overcapacity in some segmentsInvestments in R&D and selling to accelerate top line growth
Potential M&A initiatives expected to deliver operational EBITDA margins within the target
range
Operational EBITDA1 margins and targets 2007–2015 % operational revenues
18% 19%
13%13%
Previous EBIT margin targets converted to operational EBITDA margins
New operational EBITDA targets
9 mo 2011
1 See Appendix for definition of non-GAAP measures

Chart 26
2005 2006 2007 2008 2009 2010 9 mo2011
2015 F
1.08
0.36
0.65
1.15
1.67
1.28 1.22
Group Target #3Organic EPS growth CAGR 10% to 15%
10 – 15% CAGR2011 – 15
Key assumptions
Unchanged number of shares over the period
Sustainable low tax rate ~27%
Immaterial impact from finance net
Normalized1 EPS and growth 2005 – 2015FUS$
1 2007 excl. gain on sale of ABB Lummus, recognition of deferred tax assets (DTA); 2008-2009 excl. impact of compliance provisions; 2008-2010 adj. for cost
take-out program; 2009-2011 adj. for mark-to-market treatment of hedging transactions and unrealized FX movements on receivables/
payables; 2011 adj. for Baldor acquisition costs, and restructuring and restructuring-related costs. See Appendix for definition of non-GAAP measures.
Potential M&A initiatives could raise EPS CAGR by 3%

Chart 27
Group target #4Average net income to free cash flow conversion >90%
Free cash flow1, and as % revenues 2000 – 2010Ambition to stay at the top of the league for cash generation
Capital expenditure expected to continue above depreciation
Higher capex partly offset by net working capital discipline (11 – 14% of revenues over the cycle)
Target annual average conversion >90% across the plan period (also including potential M&A)
-500
500
1'500
2'500
3'500
-5%
0%
5%
10%
15%
2000 20092001 2002 2003 2004 2005 2006 2007 2008
Downturn
2010
Downturn
Free cash flow as % revenues
Free cash flow (US$ millions)
1 See Appendix for definition of non-GAAP measures

Chart 28
Group Target #5Cash return on invested capital >20% by 2015
Cash Return on Invested Capital (CROI)1
Excludes accounting distortions
Focuses on cash from operations (adj for interest paid)
Capital invested = Capital employed + accumulated depreciation/amortization
Ambitious sustainable target to exceed 20% cash return by 2015 from a high capital basis
Better aligned with shareholder interest in cash returns
1 Rolling 12 months; 2 adj. as Baldor part of ABB from Feb-Sept 2011
Target >20% by 2015
17.0 17.8 20.626.9
19.0
2007 2008 2009 2010 9 mo2011
3.3 4.2 4.3 3.84.2
2007 2008 2009 2010 9 mo2011
Cash from operationsUS$ billions
Capital investedUS$ billions
CROI %
10%
15%
20%
25%
30%
2007 2008 2009 2010 2011 2012 2013 2014 2015
M&A impact
1 2
1 See Appendix for definition of non-GAAP measures

Chart 29
Conservative financial strategySolid single A rating remains our standard
Net debt/EBITDA ratio ~1.5x, gearing <40%
Debt maturities repaid out of free cash flow
Customer financing without loading ABB balance sheet
Centralized financial risk management and execution
Strict hedging policy – forex, interest rates, commodities
Acquisition financing always in line with balance sheet targets
Steadily rising, sustainable annual dividend
Additional distributions (special dividend, share buyback) only if/when M&A doesn’t require full availability of cash
1 Organic growth, R&D, and capex
2 Value-creating acquisitions
3 Paying annual dividend in line with policy
4 Returning additional cash to shareholders
Investment priorities
M&A investment criteria
1 Cash return >WACC within 3 years
2 IRR > WACC + specific hurdles
3 Financing designed to retain investment grade

Chart 30
Innovation is key to ABB’s competitive advantageLeadership built on consistent R&D investment
More than $1 billion invested annually in R&D*6,000 scientists and engineersCollaboration with 70 universities
MIT (US), Tsinghua (China), KTH Royal Institute of Technology (Sweden), Indian Institute of Science (Bangalore), ETH (Switzerland), Karlsruhe (Germany), AGH University of Science and Technology (Poland)
* Comprises non-order related R&D and order-related development
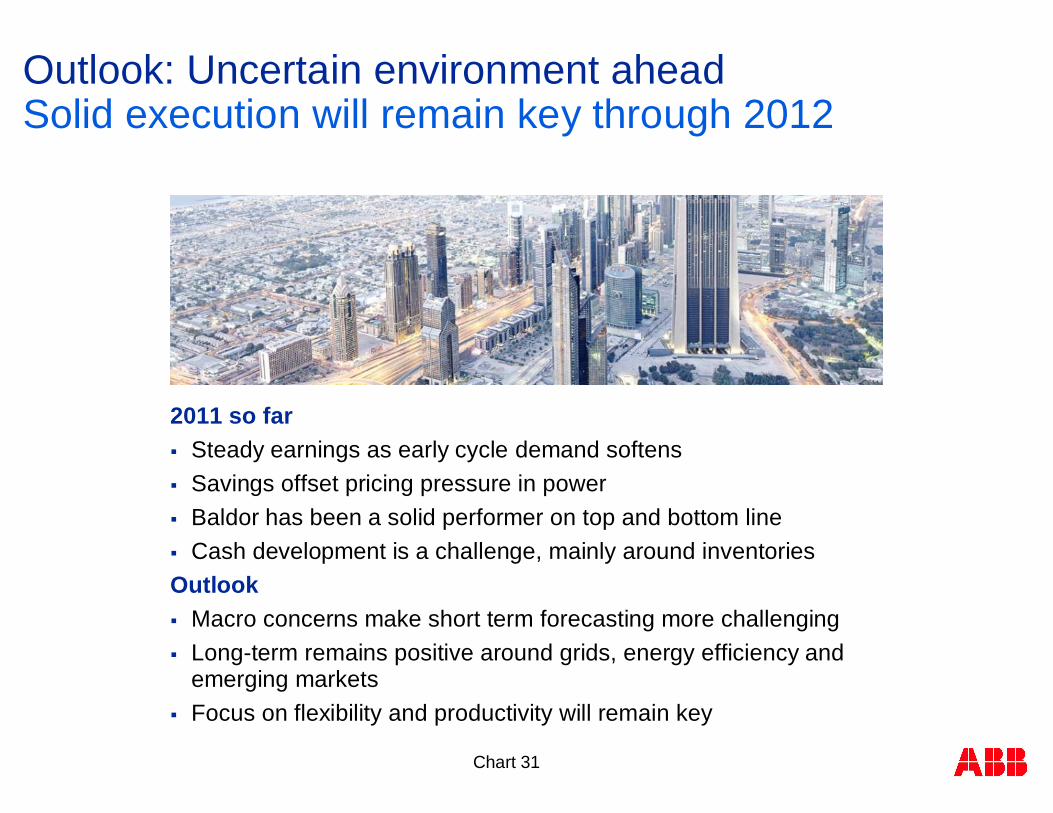
Chart 31
Outlook: Uncertain environment ahead Solid execution will remain key through 2012
2011 so farSteady earnings as early cycle demand softensSavings offset pricing pressure in power Baldor has been a solid performer on top and bottom lineCash development is a challenge, mainly around inventories
OutlookMacro concerns make short term forecasting more challengingLong-term remains positive around grids, energy efficiency and emerging marketsFocus on flexibility and productivity will remain key

Chart 32
ABB: Global leader in power and automationPower and productivity for a better world
Proven record of meeting financial targets and generating cash flow for shareholdersSolid balance sheet and flexibility to take out costs when needed
Strong commitment to R&D to stay ahead of the competition
New targets will help ABB to drive competitiveness and stay relevant in our markets
Capitalize on mega trends: anticipate, participate and lead in key mega trends
ABB uniquely positioned to drive technology and innovation
Chart 33© ABB 2011Q2 2011 Results

Chart 34
Current environment: We are preparedGrowth AND cost is now part of ABB’s DNA
-$650 mill
+$110 mill
+$630 mill
+$750 mill Enough to fund investments in selling and R&D of $240 mill …
… and generate additional op EBITDA of $700 mill ($1 bn incl. M&A)
Net positive
impact of $940 mill1
Product price
Project margins
Volume Cost savings
Operational EBITDA impacts 9-months 2011 US$ millions
Market forces(+ $90 mill) 1 Incl. forex, mix and commodity
impacts
~$1 bn cost savings expected in 2012

Chart 35© ABB Group January 16, 2012 | Slide 35
Appendix: Definitions of non-GAAP measures 1
Organic: includes acquisitions closed by October 31, 2011
Operational EBIT: Earnings before interest and taxes (EBIT) adjusted for i) unrealized gains and losses on derivatives (FX, commodities, embedded derivatives), ii) realized gains and losses on derivatives where the underlying hedged transaction has not yet been realized, iii) unrealized foreign exchange movements on receivables/payables (and related assets/liabilities), iv) restructuring and restructuring-related expenses, and v) charges related to significant acquisitions.
Operational EBITDA: Operational EBIT adjusted for depreciation and amortization
Operational revenues: Revenues adjusted for i) unrealized gains and losses on derivatives, ii) realized gains and losses on derivatives where the underlying hedged transaction has not yet been realized, and iii) unrealized foreign exchange movements on receivables (and related assets).
Operational EBIT margin: Operational EBIT as a percentage of operational revenues
Operational EBITDA margin: Operational EBITDA as a percentage of operational revenues

Chart 36© ABB Group January 16, 2012 | Slide 36
Appendix: Definitions of non-GAAP measures 2
ROCE: Return on capital employed, calculated as 12 months EBIT x (1-tax rate) divided by capital employed
Capital employed: the sum of fixed assets and net working capital
Fixed assets: the sum of property, plant and equipment (net), goodwill, other intangible assets (net) and investments in equity method companies
Net working capital (NWC): the sum of i) receivables, net, ii) inventories, net, and iii) prepaid expenses; less iv) accounts payable, trade, v) billings in excess of sales, vi) employee and other payables, vii) advances from customers, and viii) accrued expenses
Normalized earnings per share: Reported basic earnings per share (undiluted) adjusted in the relevant periods for i) the gain on the sale of ABB Lummus Global, ii) the recognition of certain deferred tax assets (DTA), iii) the impact of compliance provisions, iv) costs associated with the cost take-out program and/or restructuring and restructuring-related costs, v) the mark-to-market treatment of hedging transactions and unrealized FX movements on receivables/payables, and vi) Baldor acquisition costs

Chart 37© ABB Group January 16, 2012 | Slide 37
Appendix: Definitions of non-GAAP measures 3
Gross gearing: Total debt divided by total debt plus total stockholders’ equity (including noncontrolling interests)
Total debt: the sum of short-term debt (including current maturities of long-term debt) and long-term debt
Net cash/Net debt: Cash and equivalents plus marketable securities and short-term investments, less total debt
Free cash flow (FCF): Net cash provided by operating activities adjusted for i) changes in financing and other non-current receivables; ii) purchases of property, plant and equipment and intangible assets; and iii) proceeds from sales of property, plant and equipment
Cash conversion: Free cash flow as a percentage of net income
CROI: Cash return on capital invested, calculated as i) cash provided by operating activities plus interest paid, divided by ii) capital employed plus accumulated amortization and depreciation