j pharmacol exp ther 2003 jin 93 109
TRANSCRIPT
Modeling of Corticosteroid Pharmacogenomics in Rat LiverUsing Gene Microarrays
JIN Y. JIN, RICHARD R. ALMON, DEBRA C. DUBOIS, and WILLIAM J. JUSKO
Department of Pharmaceutical Sciences, School of Pharmacy and Pharmaceutical Sciences (J.Y.J., R.R.A., D.C.D., W.J.J.), and Department ofBiological Sciences (R.R.A., D.C.D.), State University of New York at Buffalo, Buffalo, New York
Received April 18, 2003; accepted June 3, 2003
ABSTRACTCorticosteroid (CS) pharmacogenomics was studied usinggene microarrays in rat liver. Methylprednisolone (MPL) wasadministered intravenously at 50 mg/kg. Rats were sacrificedand liver excised at 17 time points over 72 h. RNAs fromindividual livers were used to query Affymetrix GeneChips thatcontain sequences for 8000 genes. Cluster analysis revealedsix temporal patterns consisting of 197 CS-responsive probesrepresenting 143 genes. Based on our fifth-generation model ofCS pharmacokinetics/pharmacodynamics (PK/PD), mechanis-tic models were developed to describe the time pattern foreach CS-responsive gene. Two clusters showed increased ex-pression with different effect duration. PK/PD models assumingCS stimulation of mRNA synthesis were applied. Another twoclusters showed an initial decline followed by delayed increase,suggesting two mechanisms might be involved jointly. The
initial suppression was captured by CS inhibition of mRNAsynthesis or stimulation of degradation. CS may also stimulatethe production of a biosignal (transcription factors or otherhormones), which can cause secondary induction of the targetmRNA. One cluster showed a very abrupt increase in messagefollowed by rapid decrease. These genes were lymphocytic inorigin and were modeled combining the fast gene inductioneffect of CS in lymphoid cells and its direct lymphocyte traf-ficking effect. Another cluster showed reduction persisting for18 h, which was described by CS inhibition of mRNA synthesis.Our results reveal the marked diversity of genes regulated byCS via a limited array of mechanisms. These PK/PD modelsprovide quantitation of CS pharmacogenomics and new hy-potheses regarding understanding of diverse mechanisms ofCS receptor-gene mediated action.
The most potent anti-inflammatory/immunosuppressivedrugs are synthetic glucocorticoids collectively referred to ascorticosteroids. They are widely used for diseases such aslupus erythematosus, bronchial asthma, leukemia, and or-gan transplantation. Beneficial effects derived from inhibi-tion of immune system are accompanied by numerous meta-bolic side effects, including osteoporosis, muscle wasting,steroid diabetes, and others (Schimmer and Parker, 1995).
Both the therapeutic and adverse effects of CS are pro-duced by binding to the glucocorticoid receptor (GR) (Perez etal., 2001). Based on their time courses, responses can beclassified as rapid effects (cortisol suppression and cell traf-ficking) and delayed effects (gene-mediated enzyme/cytokineinduction or repression) (Jusko, 1994). Virtually all tissuescontain genes that are at least in part subject to transcrip-tional regulation by drug-activated GR. CS also influence the
activity of transcription factors, such as nuclear factor-�B,activator protein-1, and CAAT enhancer-binding protein (C/EBP), via “transcriptional cross-talk” and/or change of theirgene expressions (Gotoh et al., 1997; Gottlicher et al., 1998;Miesfeld, 2001). Alteration of a critical transcription factorcan affect expression of a battery of downstream genes.Genes affected by CS include both immunosuppressive genesfor therapeutic effects and metabolic genes for adverse ef-fects. Better understanding of CS pharmacogenomics will notonly provide more insights on their mechanism of action butalso aid in optimization of clinical therapy.
In spite of the rich literature concerning CS effects on geneexpression, most studies were done in vitro. Little informa-tion is available on the temporal pattern of mRNA changesafter in vivo treatment with CS. In the past decade, ourlaboratory has been involved in exploring the time profiles ofseveral individual genes after CS treatment in rats usingquantitative Northern hybridization (Sun et al., 1998, 1999;Almon et al., 2002; Ramakrishnan et al., 2002b). Two distincttime profiles were observed after a single-dose of MPL: de-layed induction and delayed repression.
This study was supported by Grant GM24211 from the National Institute ofHealth.
Article, publication date, and citation information can be found athttp://jpet.aspetjournals.org.
DOI: 10.1124/jpet.103.053256.
ABBREVIATIONS: GR, glucocorticoid receptor; CS, corticosteroid(s); C/EBP, CAAT enhancer-binding protein; MPL, methylprednisolone; PK/PD,pharmacokinetics/pharmacodynamics; ADX, adrenalectomized; GRE, glucocorticoid responsive element; BS, intermediate biosignal; DR, cyto-solic drug-receptor complex; DR(N), drug-receptor complex in nucleus.
0022-3565/03/3071-93–109$7.00THE JOURNAL OF PHARMACOLOGY AND EXPERIMENTAL THERAPEUTICS Vol. 307, No. 1Copyright © 2003 by The American Society for Pharmacology and Experimental Therapeutics 53256/1087907JPET 307:93–109, 2003 Printed in U.S.A.
93
by guest on May 16, 2014
jpet.aspetjournals.orgD
ownloaded from
Development of mechanistic PK/PD models for CS effects isessential for quantitative understanding of its molecular andcellular mechanisms. A series of PK/PD models have beenproposed to describe the major physiological system and therate-limiting steps for both rapid and gene-mediated effectsof CS in animals and humans (Jusko, 1994; Sun et al., 1998;Chow et al., 1999; Ferron et al., 1999; Ramakrishnan et al.,2002a). Our most current “fifth-generation model” describesthe pharmacokinetics, GR mRNA repression, receptor dy-namics, tyrosine aminotransferase mRNA induction, and itsenzyme induction in liver upon single and double doses ofMPL in adrenalectomized (ADX) rats (Ramakrishnan et al.,2002a).
However, traditional message quantification methods suchas Northern blot and reverse transcriptase-polymerase chainreaction only allow measurement of single genes. This greatlylimits the number of genes that can be well explored. Because ofthe broad nature of CS effects, indications of efficacy and toxi-city cannot be evaluated comprehensively based on a limitednumber of genomic changes. Lately, microarray-based assaytechnology enables measurements of thousands of genes in asingle experiment. The two commonly used systems are cDNAand oligonucleotide microarrays.
Recently, we used cDNA microarrays to study the changeof 5200 genes at 5.5 h in rat liver after 50 mg/kg MPL i.v.injection (Almon et al., 2002). The CS pharmacogenomicsobserved in this microarray dataset was limited by investi-gating only one time point.
In the current study, we describe the use of oligonucleotidemicroarrays (Affymetrix GeneChips; Affymetrix, Inc., SantaClara, CA) to examine the entire profile of temporal changesof 8000 genes in rat liver after a single dose of 50 mg/kg MPL.The liver was selected because of its major role in both theefficacious and adverse effects of CS. In liver, these agentsinfluence the expression of serum proteins that regulate im-mune/inflammatory responses (Morand and Leech, 1999).Expression of liver enzymes involved in metabolic effects,such as gluconeogenesis and lipid metabolism, is also altered(Berdanier, 1989; Andrews and Walker, 1999). In addition,CS modify the metabolism of many endogenous and exoge-nous substrates (Prough et al., 1996). This is possibly the firstextensive microarray dataset describing the time dependence ofin vivo responses of a tissue to any drug. We found 197 CS-responsive probes representing 143 different genes that weresorted into six clusters based on their temporal behaviors. Ourmajor goal is to develop mechanism-based PK/PD models thatcan quantitatively describe CS pharmacogenomics, provide in-sights on their mechanisms of regulation, and understand thesignaling network in this biological system. In this report, weexpand our fifth-generation model that described simple geneinduction to several pharmacogenomic models that may explainthe unique expression time patterns of all the CS-responsivegenes observed in our study.
Materials and MethodsExperimental Procedures
Liver samples were obtained from a previously performed animalstudy in our laboratory (Sun et al., 1998). In brief, 47 male ADXWistar rats weighing 225 to 250 g (Harlan, Indianapolis, IN) under-went right jugular vein cannulation under light ether anesthesia 1day before the study. Forty-three animals received a single intrave-
nous bolus dose of 50 mg/kg MPL (Solu-Medrol; The Pharmacia-Upjohn Co., Kalamazoo, MI) via cannula. Rats were sacrificed byexsanguinations under anesthesia at 0.25, 0.5, 0.75, 1, 2, 4, 5, 5.5, 6,7, 8, 12, 18, 30, 48, or 72 h after dosing. The sampling time pointswere selected based on preliminary studies describing GR dynamicsand enzyme induction in liver. Four untreated rats were sacrificed at0 h as controls. Liver was rapidly excised, flash frozen in liquidnitrogen, and stored at �80°C. Frozen liver tissues were ground intopowder using a liquid nitrogen chilled mortar and pestle.
Microarrays. Liver powder (100 mg) from each individual animalwas added to 1 ml of prechilled TRIzol Reagent (Invitrogen, Carls-bad, CA). Total RNA extractions were carried out according to man-ufacturer’s directions. Extracted RNAs were further purified by pas-sage through RNAeasy mini-columns (QIAGEN, Valencia, CA)according to manufacturer’s protocols for RNA cleanup. Final RNApreparations were resuspended in diethyl pyrocarbonate-treated wa-ter and stored at �80°C. RNAs were quantified spectrophotometri-cally and purity assessed by gel electrophoresis.
Isolated RNA from each individual liver was used to preparetarget according to manufacturer’s protocols. The biotinylatedcRNAs were hybridized to 47 individual Affymetrix GeneChips RatGenome U34A (Affymetrix, Inc.), which contained 7000 full-lengthsequences and approximately 1000 expressed sequence tag clusters.Unlike cDNA arrays used in the previous study, the high reproduc-ibility of in situ synthesis of oligonucleotide chips allows accuratecomparison of signals generated by samples hybridized to separatearrays, which is applicable to study temporal patterns.
Cluster Analysis. Affymetrix Microarray Suite 4.0 (Affymetrix,Inc.) was used for initial data acquisition and basic analysis. In thisfirst step, a “call” of Present, Absent, or Marginal was determined foreach probe set on each chip. The results were also normalized foreach chip using a distribution of all genes around the 50th percentile.The dataset was scrubbed to retain only those genes that indicated atleast four Present calls in the Affymetrix analysis. The scrubbeddataset was then used for cluster analysis.
The results from the first step were inputted to another program,GeneSpring 4.1 (Silicon Genetics, Redwood City, CA). Unlike theAffymetrix software, GeneSpring was designed to accommodate tem-poral sequence analysis. Each individual gene was normalized as aratio to the mean of the four controls, which had a distributionaround 1. Three approaches were used to define clusters of geneswith similar temporal patterns. The first approach was a supervisedmethod that allowed the dataset to be queried using a particularpattern. Based on our previous work we inputted the temporal pat-terns exhibited by two enzymes, tyrosine aminotransferase in liverand glutamine synthetase in skeletal muscle (Sun et al., 1998, 1999).The other two approaches were nonsupervised methods: self-orga-nizing maps and k-means clustering. Both tools divided genes intogroups based on expression patterns. Self-organizing maps had theadditional benefit of providing an indication of the relationship be-tween clusters. A correlation coefficient of at least 0.95 among genesin each cluster was used as criteria for the cluster analysis.
Pharmacokinetic/Pharmacodynamic/PharmacogenomicModels
Pharmacokinetics. The PK of MPL was described by a biexpo-nential equation with the parameters reported previously (Sun et al.,1998) (Table 1):
CMPL � C1 � e � �1 � t � C2 � e � �2 � t (1)
where Ci and �i are the coefficients for the intercepts and slopes andCMPL is the plasma concentration of MPL in nanograms per milliliter.
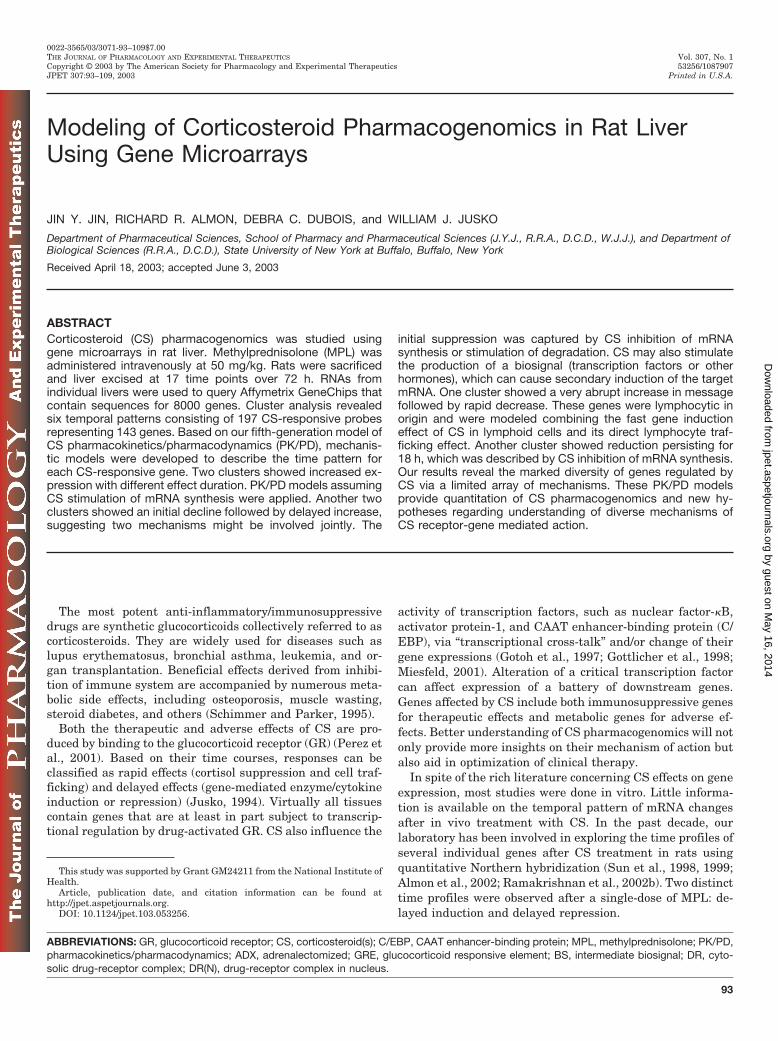
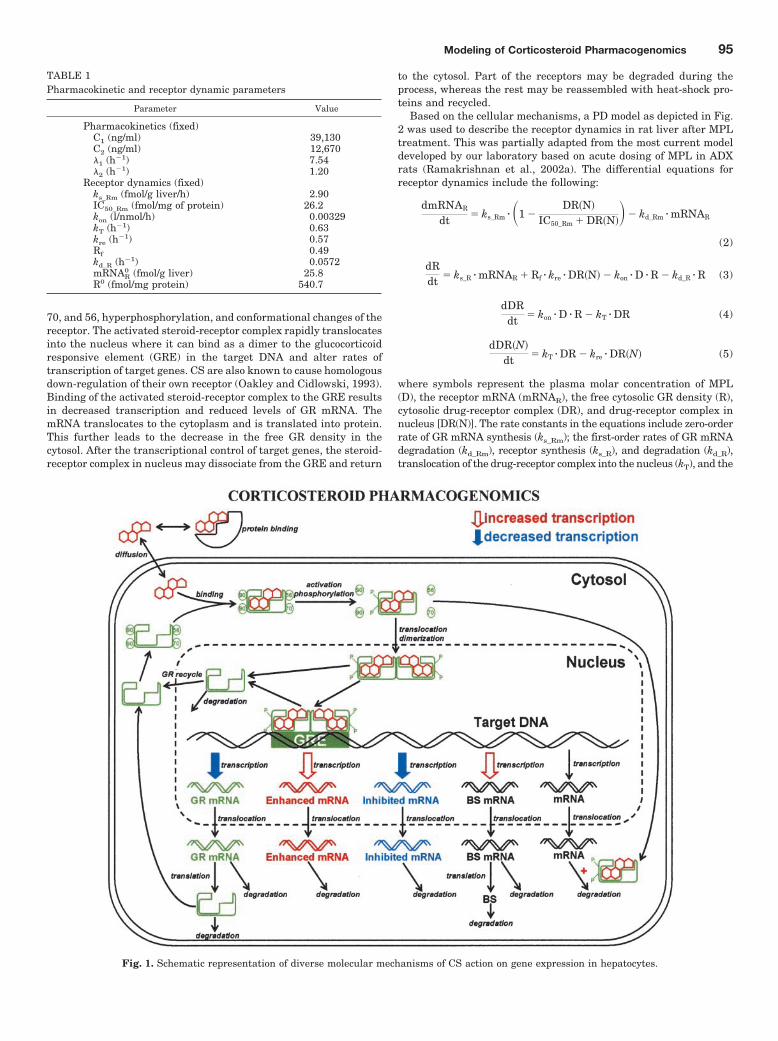
Receptor Dynamics. The cellular processes for CS pharmacog-enomics are depicted in Fig. 1. Unbound CS in blood is moderatelylipophilic and freely diffuses into the cytoplasm of liver cells. Thesesteroids quickly bind to the cytosolic GR and cause activation of thereceptor. This is accompanied by release of heat-shock proteins 90,
94 Jin et al.
70, and 56, hyperphosphorylation, and conformational changes of thereceptor. The activated steroid-receptor complex rapidly translocatesinto the nucleus where it can bind as a dimer to the glucocorticoidresponsive element (GRE) in the target DNA and alter rates oftranscription of target genes. CS are also known to cause homologousdown-regulation of their own receptor (Oakley and Cidlowski, 1993).Binding of the activated steroid-receptor complex to the GRE resultsin decreased transcription and reduced levels of GR mRNA. ThemRNA translocates to the cytoplasm and is translated into protein.This further leads to the decrease in the free GR density in thecytosol. After the transcriptional control of target genes, the steroid-receptor complex in nucleus may dissociate from the GRE and return
to the cytosol. Part of the receptors may be degraded during theprocess, whereas the rest may be reassembled with heat-shock pro-teins and recycled.
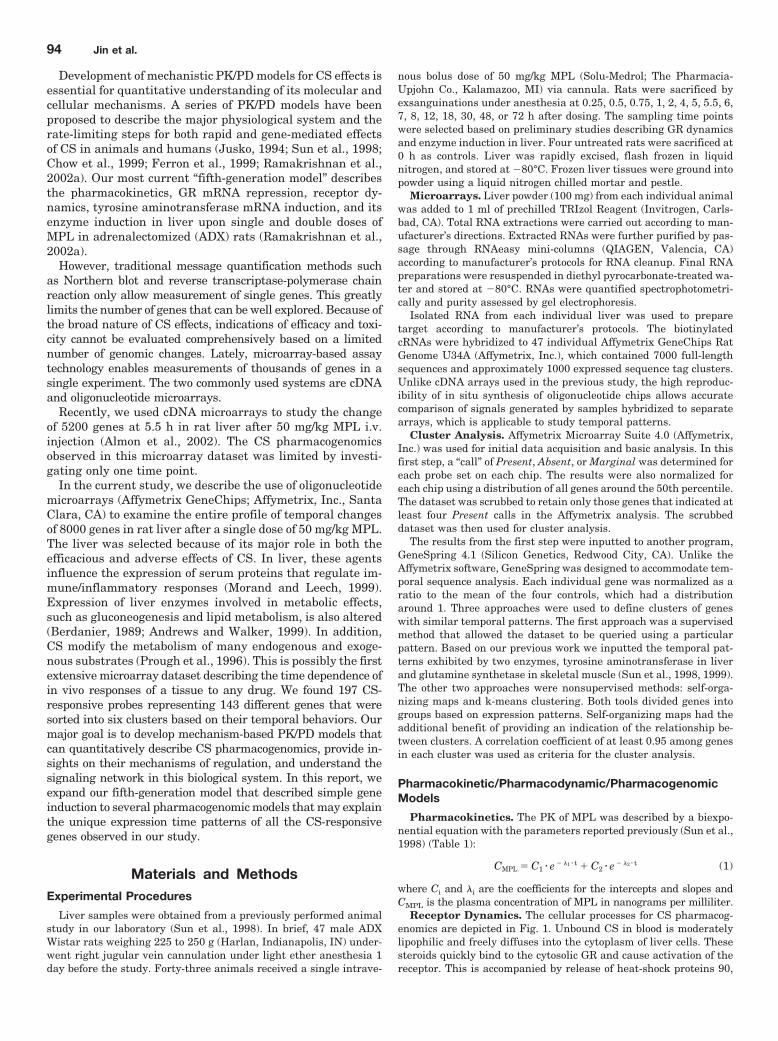
Based on the cellular mechanisms, a PD model as depicted in Fig.2 was used to describe the receptor dynamics in rat liver after MPLtreatment. This was partially adapted from the most current modeldeveloped by our laboratory based on acute dosing of MPL in ADXrats (Ramakrishnan et al., 2002a). The differential equations forreceptor dynamics include the following:
dmRNAR
dt � ks_Rm � �1 �DR�N�
IC50_Rm � DR�N��� kd_Rm � mRNAR
(2)
dRdt � ks_R � mRNAR � Rf � kre � DR�N� � kon � D � R � kd_R � R (3)
dDRdt � kon � D � R � kT � DR (4)
dDR�N�
dt � kT � DR � kre � DR�N� (5)
where symbols represent the plasma molar concentration of MPL(D), the receptor mRNA (mRNAR), the free cytosolic GR density (R),cytosolic drug-receptor complex (DR), and drug-receptor complex innucleus [DR(N)]. The rate constants in the equations include zero-orderrate of GR mRNA synthesis (ks_Rm); the first-order rates of GR mRNAdegradation (kd_Rm), receptor synthesis (ks_R), and degradation (kd_R),translocation of the drug-receptor complex into the nucleus (kT), and the
Fig. 1. Schematic representation of diverse molecular mechanisms of CS action on gene expression in hepatocytes.
TABLE 1Pharmacokinetic and receptor dynamic parameters
Parameter Value
Pharmacokinetics (fixed)C1 (ng/ml) 39,130C2 (ng/ml) 12,670�1 (h�1) 7.54�2 (h�1) 1.20
Receptor dynamics (fixed)ks_Rm (fmol/g liver/h) 2.90IC50_Rm (fmol/mg of protein) 26.2kon (l/nmol/h) 0.00329kT (h�1) 0.63kre (h�1) 0.57Rf 0.49kd_R (h�1) 0.0572mRNAR
0 (fmol/g liver) 25.8R0 (fmol/mg protein) 540.7
Modeling of Corticosteroid Pharmacogenomics 95
overall turnover of DR(N) to cytosol (kre); as well as the second-orderrate constant of drug-receptor association (kon). In addition, IC50_Rm isthe concentration of DR(N) at which the synthesis rate of receptormRNA drops to 50% of its baseline value, and Rf is the fraction of freereceptor being recycled.
The baselines were defined using the following equations:
kd_Rm �ks_Rm
mRNAR0 (6)
ks_R � � R0
mRNAR0� � kd_R (7)
where mRNAR0 and R0 are the baseline values of receptor mRNA and
free cytosolic GR density. These baseline values were fixed based onmeans of the control animals. Parameters reported in the fifth-generation model (Ramakrishnan et al., 2002a) were used for simu-lations of receptor dynamics in the present study (Table 1).
Pharmacogenomics. As depicted in Fig. 1, binding of the acti-vated steroid-receptor complex to the GRE or negative GRE in targetDNA leads to the induction or repression of several genes. Binding ofthe complex to GRE may directly interact with proteins associatedwith the proximal promoters and either enhance or repress DNAtranscription. This binding may also cause rapid and local influenceson chromatin structure, followed by conformational changes in thetranscriptosome complex. Therefore, RNA polymerase action will beaffected, causing either activated or blocked initiation of transcrip-tion. These manifest as an increased or decreased rate of transcrip-tion, resulting in changed levels of mRNA in the cell. (Miesfeld, 2001)
Furthermore, upon binding to GRE, CS may affect DNA transcrip-tion of functional biosignals/transcription factors (represented byBS), such as C/EBP, thereby causing changes in mRNA and proteinconcentrations of these regulators (Gotoh et al., 1997). Gene expres-sion controlled by these factors at transcriptional and/or post-tran-scriptional levels will thus be secondarily affected by CS.
The CS may also affect gene expression without binding to GRE inDNA. Steroid-receptor complex can directly or indirectly affectmRNA stability in cytosol. The complex may replace some bindingproteins on the mRNA, which are essential for protection of themessage from ribonucleases in cytosol (Vedeckis et al., 1989). Thisleads to an increased degradation rate of the mRNA. In addition, ithas been shown that CS can decrease ribonuclease activity in liver
(Onyezili and Goodlad, 1981). This may cause repressed degradationof certain mRNAs that are sensitive to ribonuclease activity.
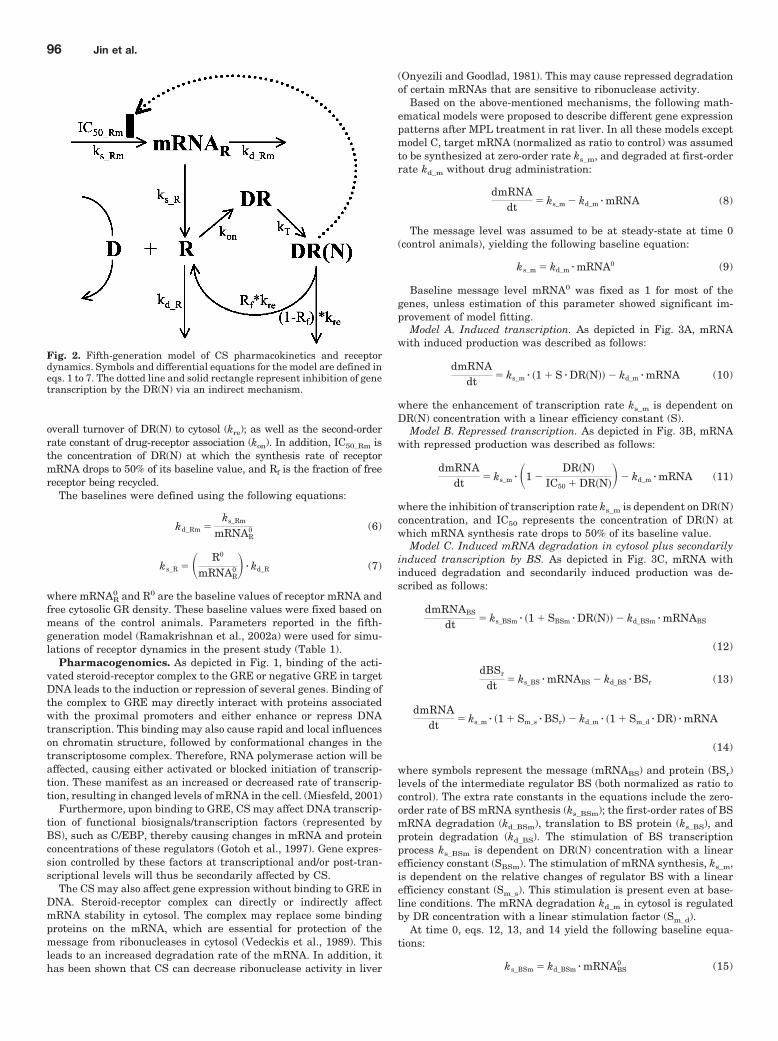
Based on the above-mentioned mechanisms, the following math-ematical models were proposed to describe different gene expressionpatterns after MPL treatment in rat liver. In all these models exceptmodel C, target mRNA (normalized as ratio to control) was assumedto be synthesized at zero-order rate ks_m, and degraded at first-orderrate kd_m without drug administration:
dmRNAdt � ks_m � kd_m � mRNA (8)
The message level was assumed to be at steady-state at time 0(control animals), yielding the following baseline equation:
ks_m � kd_m � mRNA0 (9)
Baseline message level mRNA0 was fixed as 1 for most of thegenes, unless estimation of this parameter showed significant im-provement of model fitting.
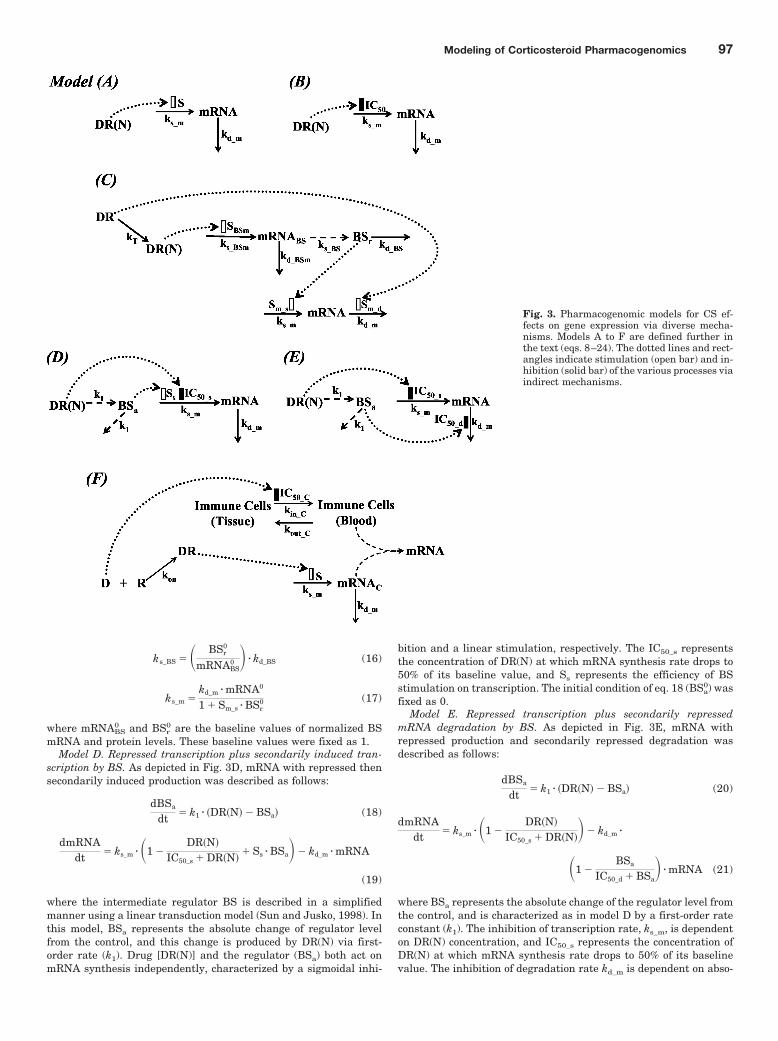
Model A. Induced transcription. As depicted in Fig. 3A, mRNAwith induced production was described as follows:
dmRNAdt � ks_m � �1 � S � DR�N�� � kd_m � mRNA (10)
where the enhancement of transcription rate ks_m is dependent onDR(N) concentration with a linear efficiency constant (S).
Model B. Repressed transcription. As depicted in Fig. 3B, mRNAwith repressed production was described as follows:
dmRNAdt � ks_m � �1 �
DR�N�
IC50 � DR�N��� kd_m � mRNA (11)
where the inhibition of transcription rate ks_m is dependent on DR(N)concentration, and IC50 represents the concentration of DR(N) atwhich mRNA synthesis rate drops to 50% of its baseline value.
Model C. Induced mRNA degradation in cytosol plus secondarilyinduced transcription by BS. As depicted in Fig. 3C, mRNA withinduced degradation and secondarily induced production was de-scribed as follows:
dmRNABS
dt � ks_BSm � �1 � SBSm � DR�N�� � kd_BSm � mRNABS
(12)
dBSr
dt � ks_BS � mRNABS � kd_BS � BSr (13)
dmRNAdt � ks_m � �1 � Sm_s � BSr� � kd_m � �1 � Sm_d � DR� � mRNA
(14)
where symbols represent the message (mRNABS) and protein (BSr)levels of the intermediate regulator BS (both normalized as ratio tocontrol). The extra rate constants in the equations include the zero-order rate of BS mRNA synthesis (ks_BSm); the first-order rates of BSmRNA degradation (kd_BSm), translation to BS protein (ks_BS), andprotein degradation (kd_BS). The stimulation of BS transcriptionprocess ks_BSm is dependent on DR(N) concentration with a linearefficiency constant (SBSm). The stimulation of mRNA synthesis, ks_m,is dependent on the relative changes of regulator BS with a linearefficiency constant (Sm_s). This stimulation is present even at base-line conditions. The mRNA degradation kd_m in cytosol is regulatedby DR concentration with a linear stimulation factor (Sm_d).
At time 0, eqs. 12, 13, and 14 yield the following baseline equa-tions:
ks_BSm � kd_BSm � mRNABS0 (15)
Fig. 2. Fifth-generation model of CS pharmacokinetics and receptordynamics. Symbols and differential equations for the model are defined ineqs. 1 to 7. The dotted line and solid rectangle represent inhibition of genetranscription by the DR(N) via an indirect mechanism.
96 Jin et al.
ks_BS � � BSr0
mRNABS0 � � kd_BS (16)
ks_m �kd_m � mRNA0
1 � Sm_s � BSr0 (17)
where mRNABS0 and BSr
0 are the baseline values of normalized BSmRNA and protein levels. These baseline values were fixed as 1.
Model D. Repressed transcription plus secondarily induced tran-scription by BS. As depicted in Fig. 3D, mRNA with repressed thensecondarily induced production was described as follows:
dBSa
dt � k1 � �DR�N� � BSa� (18)
dmRNAdt � ks_m � �1 �
DR�N�
IC50_s � DR�N�� Ss � BSa�� kd_m � mRNA
(19)
where the intermediate regulator BS is described in a simplifiedmanner using a linear transduction model (Sun and Jusko, 1998). Inthis model, BSa represents the absolute change of regulator levelfrom the control, and this change is produced by DR(N) via first-order rate (k1). Drug [DR(N)] and the regulator (BSa) both act onmRNA synthesis independently, characterized by a sigmoidal inhi-
bition and a linear stimulation, respectively. The IC50_s representsthe concentration of DR(N) at which mRNA synthesis rate drops to50% of its baseline value, and Ss represents the efficiency of BSstimulation on transcription. The initial condition of eq. 18 (BSa
0) wasfixed as 0.
Model E. Repressed transcription plus secondarily repressedmRNA degradation by BS. As depicted in Fig. 3E, mRNA withrepressed production and secondarily repressed degradation wasdescribed as follows:
dBSa
dt � k1 � �DR�N� � BSa� (20)
dmRNAdt � ks_m � �1 �
DR�N�
IC50_s � DR�N��� kd_m �
�1 �BSa
IC50_d � BSa� � mRNA (21)
where BSa represents the absolute change of the regulator level fromthe control, and is characterized as in model D by a first-order rateconstant (k1). The inhibition of transcription rate, ks_m, is dependenton DR(N) concentration, and IC50_s represents the concentration ofDR(N) at which mRNA synthesis rate drops to 50% of its baselinevalue. The inhibition of degradation rate kd_m is dependent on abso-
Fig. 3. Pharmacogenomic models for CS ef-fects on gene expression via diverse mecha-nisms. Models A to F are defined further inthe text (eqs. 8–24). The dotted lines and rect-angles indicate stimulation (open bar) and in-hibition (solid bar) of the various processes viaindirect mechanisms.
Modeling of Corticosteroid Pharmacogenomics 97
lute changes of BS, and IC50_d represents the changes of BSa atwhich mRNA degradation rate drops to 50% of its baseline value.The initial condition of eq. 20 (BSa
0) was fixed as 0.Model F. Induced transcription in immune cells. Because we are
using the whole liver to study CS pharmacogenomics, gene expres-sion detected in our current gene array study may not only comefrom liver tissues but also from blood contained in the sample. As animmunosuppressant, CS is well known to regulate immune-relatedgenes in lymphatic cells. Recent data suggest that at least in lym-phocytes there may be membrane receptors for CS that may mediatesome gene regulation effects (Watson and Gametchu, 1999; Falken-stein et al., 2000). Another aspect of CS effects is altered lymphocytetrafficking, a rapid effect causing redistribution of lymphocytes inthe body (Chow et al., 1999; Ferron et al., 1999). Specifically, CScause a decrease of lymphocyte counts in blood and concentratesthem in lymphoid tissues. Therefore, changes of immune-relatedmessage in the liver sample can result from two sources: change ofthe gene expression in lymphocytes and change of blood lymphocytenumber contained in the sample. As depicted in Fig. 3F, immune-related mRNA with induced production was described as follows:
dCellB
dt � kin_C � �1 �D
IC50_C � D�� kout_C � CellB (22)
dmRNAC
dt � ks_m � �1 � S � DR� � kd_m � mRNAC (23)
mRNA � mRNAC � CellB (24)
As reflected in eq. 22, a cell trafficking model was used to describethe change in blood lymphocyte counts. According to this model,lymphocytes from the lymphatic tissues enter into blood at a zero-order rate, kin_C, assuming the tissue compartment is very large toproduce a constant input rate. The return of lymphocytes from theblood is controlled by a first-order rate constant, kout_C. It is hypoth-esized that CS instantaneously cause a change in the affinity oflymphocytes for lymphatic tissues thus accumulating the cells intissues by inhibiting the movement of lymphocytes from tissues toblood. Therefore, an inhibition function is applied on the zero-orderentry rate kin_C where IC50_C represents the drug concentration thatinhibits kin_C by 50%. The lymphocyte counts in blood (CellB) wereexpressed as a ratio to the predose value. At time 0, the system is atsteady-state, yielding the baseline equation as kin_C � kout_C � CellB
0
where CellB0 is 1. The lymphocyte trafficking was fixed (kout_C �
0.643 h�1 and IC50_C � 6.15 ng/ml) based on literature estimates ofMPL effect in ADX rats (Ferron et al., 1999; Ramakrishnan et al.,2002b).
The immediately enhanced message level in single lymphocyte(mRNAC) is described as induced production (ks_m) by CS uponbinding to its receptor via a linear efficiency constant (S). ThemRNAC is also normalized as ratio to control (mRNAC
0 fixed as 1).The total message level in liver sample (mRNA) is represented by the
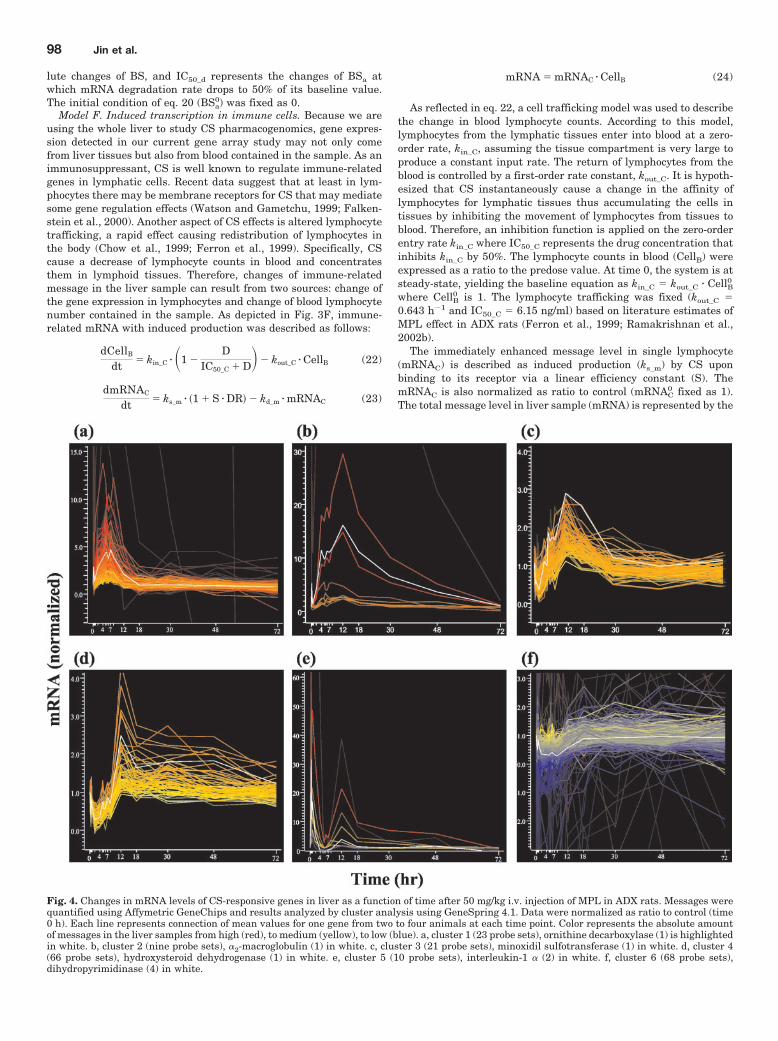
Fig. 4. Changes in mRNA levels of CS-responsive genes in liver as a function of time after 50 mg/kg i.v. injection of MPL in ADX rats. Messages werequantified using Affymetric GeneChips and results analyzed by cluster analysis using GeneSpring 4.1. Data were normalized as ratio to control (time0 h). Each line represents connection of mean values for one gene from two to four animals at each time point. Color represents the absolute amountof messages in the liver samples from high (red), to medium (yellow), to low (blue). a, cluster 1 (23 probe sets), ornithine decarboxylase (1) is highlightedin white. b, cluster 2 (nine probe sets), �2-macroglobulin (1) in white. c, cluster 3 (21 probe sets), minoxidil sulfotransferase (1) in white. d, cluster 4(66 probe sets), hydroxysteroid dehydrogenase (1) in white. e, cluster 5 (10 probe sets), interleukin-1 � (2) in white. f, cluster 6 (68 probe sets),dihydropyrimidinase (4) in white.
98 Jin et al.
combination of mRNA in a single lymphocyte and total lymphocytecounts from blood source in the sample (multiplication).
Data Analysis. Data in this study were generated from a so-called “giant rat” study in our laboratory. Animals were sacrificed toobtain serial blood and tissue samples. Each point represents themeasurement from one individual rat and data from all these differ-ent rats were pooled to obtain a time profile as though it came fromone giant rat. Mean data from two to three animals at each timepoint were used to fit the pharmacogenomic models using ADAPT IIsoftware (D’Argenio and Schumitzky, 1997). The maximum likeli-hood method was used with variance model specified as V(�,�,ti) ��1
2 � Y(�,ti)�2, where V(�,�,ti) is the variance for the ith point, Y(�,ti) is
the ith predicted value from pharmacogenomic model, � representsthe estimated structural parameters, and �1, �2 are the varianceparameters that were estimated. Proposed models were fitted andcompared for each individual gene that showed regulation by CS.Models were selected based on visual inspection of curve fitting,estimator criterion value, sum of squared residuals, Akaike informa-tion criterion, Schwartz criterion, and confidence of parameter esti-mations.
ResultsCluster Analysis
From the original 8000 genes on the Affymetrix Gene-Chips, the scrubbed dataset contained 5300 genes, whichshowed at least four Present calls in the Affymetrix analysis.Cluster analysis using GeneSpring yielded six different tem-poral patterns containing 197 CS-responsive probe sets rep-resenting 143 different genes (Fig. 4). These genes relate to avariety of processes, including immunosuppression, bloodclotting, carbohydrate metabolism, amino acid metabolism,lipid metabolism, and xenobiotic metabolism. Preliminarydescription and discussion of these clusters are presented inanother article from our laboratory (Almon et al., 2003). Inbrief, cluster 1 was found by the supervised approach asdescribed under Materials and Methods. This cluster con-tained 23 probe sets representing 21 genes. As depicted inFig. 4a, the typical pattern for this cluster showed a simpleinduction with maximum at around 5 h followed by a fastdecline to baseline after 18 h. Clusters 2 to 6 were found byself-organizing maps and k-means clustering. Both methodsdefined fundamentally the same clusters. Cluster 2 con-tained 9 probes coding for six genes. As depicted in Fig. 4b,this cluster also showed a simple induction with a maximumat around 10 h followed by a slower return to baseline as lateas 72 h, compared with the first cluster. Cluster 3 contained21 probes representing 18 genes. As depicted in Fig. 4c, thiscluster showed a more complex pattern with an initial de-cline for the first 30 min followed by a fast increase to peak at
around 12 h. This delayed induction quickly returned tobaseline at around 30 h. Cluster 4 contained 66 probes codingfor 49 genes. As depicted in Fig. 4d, this cluster showed alonger down-regulation in the first 8 h followed by even moresustained message induction almost throughout the 72-hperiod. Cluster 5 contained 10 probe sets representing fivegenes. As depicted in Fig. 4e, this cluster was a uniquecluster showing a very fast induction with peak at 30 minfollowed by an abrupt decrease to baseline by 4 h. Cluster 6contained 68 probes coding for 44 identifiable genes. Genes inthis cluster mostly had low abundance of message in liver, asillustrated by colors of blue and yellow in Fig. 4f. This was theonly cluster showing simple down-regulation, which per-sisted for about 18 h. The decline phase of this cluster wasslower compared with the down-regulation phase for cluster4. This whole dataset is available online at http://microarray.cnmcresearch.org/ (link Programs in Genomic Applications).
Pharmacokinetics and Receptor Dynamics
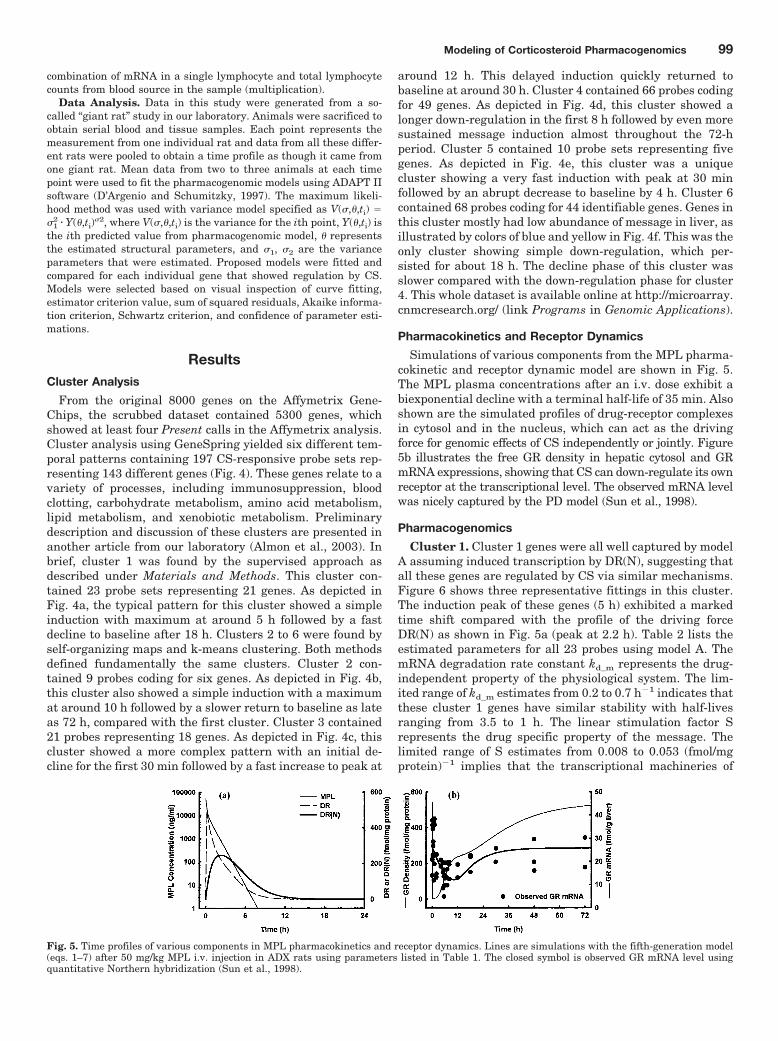
Simulations of various components from the MPL pharma-cokinetic and receptor dynamic model are shown in Fig. 5.The MPL plasma concentrations after an i.v. dose exhibit abiexponential decline with a terminal half-life of 35 min. Alsoshown are the simulated profiles of drug-receptor complexesin cytosol and in the nucleus, which can act as the drivingforce for genomic effects of CS independently or jointly. Figure5b illustrates the free GR density in hepatic cytosol and GRmRNA expressions, showing that CS can down-regulate its ownreceptor at the transcriptional level. The observed mRNA levelwas nicely captured by the PD model (Sun et al., 1998).
Pharmacogenomics
Cluster 1. Cluster 1 genes were all well captured by modelA assuming induced transcription by DR(N), suggesting thatall these genes are regulated by CS via similar mechanisms.Figure 6 shows three representative fittings in this cluster.The induction peak of these genes (5 h) exhibited a markedtime shift compared with the profile of the driving forceDR(N) as shown in Fig. 5a (peak at 2.2 h). Table 2 lists theestimated parameters for all 23 probes using model A. ThemRNA degradation rate constant kd_m represents the drug-independent property of the physiological system. The lim-ited range of kd_m estimates from 0.2 to 0.7 h�1 indicates thatthese cluster 1 genes have similar stability with half-livesranging from 3.5 to 1 h. The linear stimulation factor Srepresents the drug specific property of the message. Thelimited range of S estimates from 0.008 to 0.053 (fmol/mgprotein)�1 implies that the transcriptional machineries of
Fig. 5. Time profiles of various components in MPL pharmacokinetics and receptor dynamics. Lines are simulations with the fifth-generation model(eqs. 1–7) after 50 mg/kg MPL i.v. injection in ADX rats using parameters listed in Table 1. The closed symbol is observed GR mRNA level usingquantitative Northern hybridization (Sun et al., 1998).
Modeling of Corticosteroid Pharmacogenomics 99
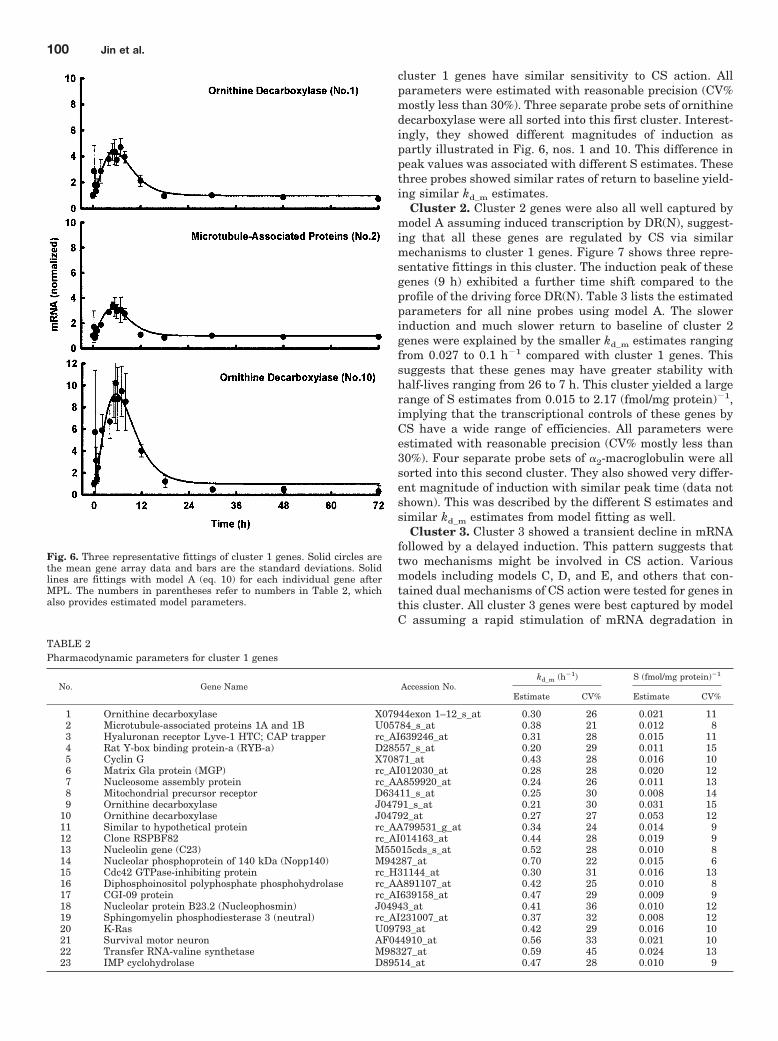
cluster 1 genes have similar sensitivity to CS action. Allparameters were estimated with reasonable precision (CV%mostly less than 30%). Three separate probe sets of ornithinedecarboxylase were all sorted into this first cluster. Interest-ingly, they showed different magnitudes of induction aspartly illustrated in Fig. 6, nos. 1 and 10. This difference inpeak values was associated with different S estimates. Thesethree probes showed similar rates of return to baseline yield-ing similar kd_m estimates.
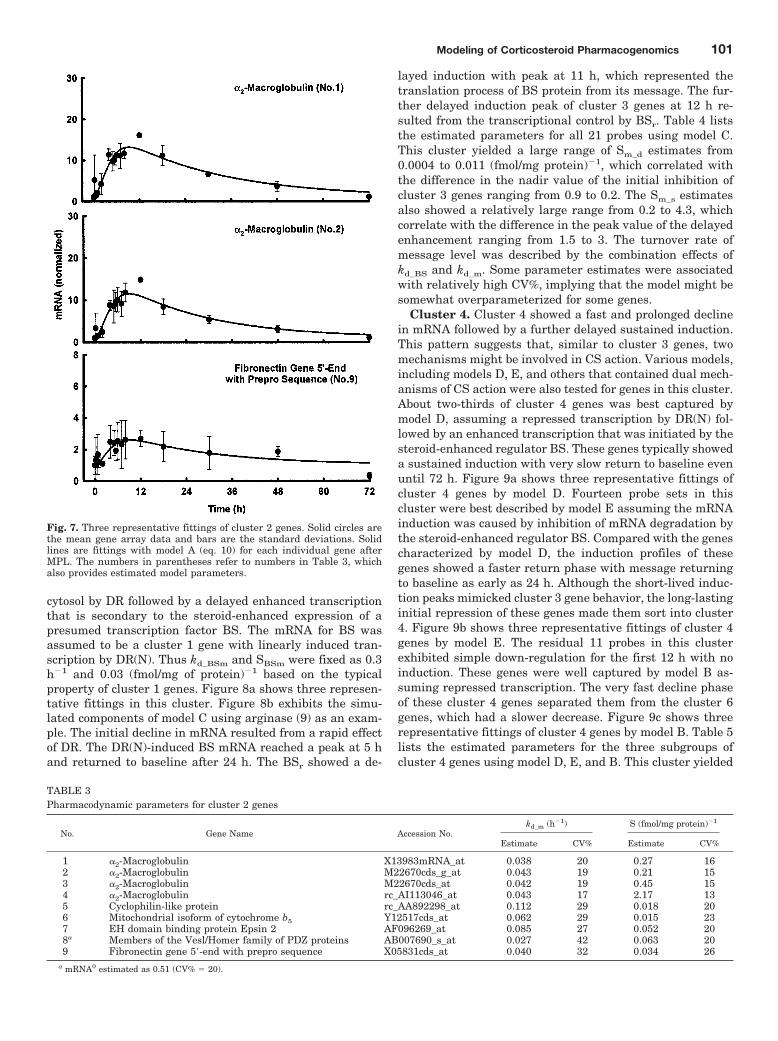
Cluster 2. Cluster 2 genes were also all well captured bymodel A assuming induced transcription by DR(N), suggest-ing that all these genes are regulated by CS via similarmechanisms to cluster 1 genes. Figure 7 shows three repre-sentative fittings in this cluster. The induction peak of thesegenes (9 h) exhibited a further time shift compared to theprofile of the driving force DR(N). Table 3 lists the estimatedparameters for all nine probes using model A. The slowerinduction and much slower return to baseline of cluster 2genes were explained by the smaller kd_m estimates rangingfrom 0.027 to 0.1 h�1 compared with cluster 1 genes. Thissuggests that these genes may have greater stability withhalf-lives ranging from 26 to 7 h. This cluster yielded a largerange of S estimates from 0.015 to 2.17 (fmol/mg protein)�1,implying that the transcriptional controls of these genes byCS have a wide range of efficiencies. All parameters wereestimated with reasonable precision (CV% mostly less than30%). Four separate probe sets of �2-macroglobulin were allsorted into this second cluster. They also showed very differ-ent magnitude of induction with similar peak time (data notshown). This was described by the different S estimates andsimilar kd_m estimates from model fitting as well.
Cluster 3. Cluster 3 showed a transient decline in mRNAfollowed by a delayed induction. This pattern suggests thattwo mechanisms might be involved in CS action. Variousmodels including models C, D, and E, and others that con-tained dual mechanisms of CS action were tested for genes inthis cluster. All cluster 3 genes were best captured by modelC assuming a rapid stimulation of mRNA degradation in
Fig. 6. Three representative fittings of cluster 1 genes. Solid circles arethe mean gene array data and bars are the standard deviations. Solidlines are fittings with model A (eq. 10) for each individual gene afterMPL. The numbers in parentheses refer to numbers in Table 2, whichalso provides estimated model parameters.
TABLE 2Pharmacodynamic parameters for cluster 1 genes
No. Gene Name Accession No.kd_m (h�1) S (fmol/mg protein)�1
Estimate CV% Estimate CV%
1 Ornithine decarboxylase X07944exon 1–12_s_at 0.30 26 0.021 112 Microtubule-associated proteins 1A and 1B U05784_s_at 0.38 21 0.012 83 Hyaluronan receptor Lyve-1 HTC; CAP trapper rc_AI639246_at 0.31 28 0.015 114 Rat Y-box binding protein-a (RYB-a) D28557_s_at 0.20 29 0.011 155 Cyclin G X70871_at 0.43 28 0.016 106 Matrix Gla protein (MGP) rc_AI012030_at 0.28 28 0.020 127 Nucleosome assembly protein rc_AA859920_at 0.24 26 0.011 138 Mitochondrial precursor receptor D63411_s_at 0.25 30 0.008 149 Ornithine decarboxylase J04791_s_at 0.21 30 0.031 15
10 Ornithine decarboxylase J04792_at 0.27 27 0.053 1211 Similar to hypothetical protein rc_AA799531_g_at 0.34 24 0.014 912 Clone RSPBF82 rc_AI014163_at 0.44 28 0.019 913 Nucleolin gene (C23) M55015cds_s_at 0.52 28 0.010 814 Nucleolar phosphoprotein of 140 kDa (Nopp140) M94287_at 0.70 22 0.015 615 Cdc42 GTPase-inhibiting protein rc_H31144_at 0.30 31 0.016 1316 Diphosphoinositol polyphosphate phosphohydrolase rc_AA891107_at 0.42 25 0.010 817 CGI-09 protein rc_AI639158_at 0.47 29 0.009 918 Nucleolar protein B23.2 (Nucleophosmin) J04943_at 0.41 36 0.010 1219 Sphingomyelin phosphodiesterase 3 (neutral) rc_AI231007_at 0.37 32 0.008 1220 K-Ras U09793_at 0.42 29 0.016 1021 Survival motor neuron AF044910_at 0.56 33 0.021 1022 Transfer RNA-valine synthetase M98327_at 0.59 45 0.024 1323 IMP cyclohydrolase D89514_at 0.47 28 0.010 9
100 Jin et al.
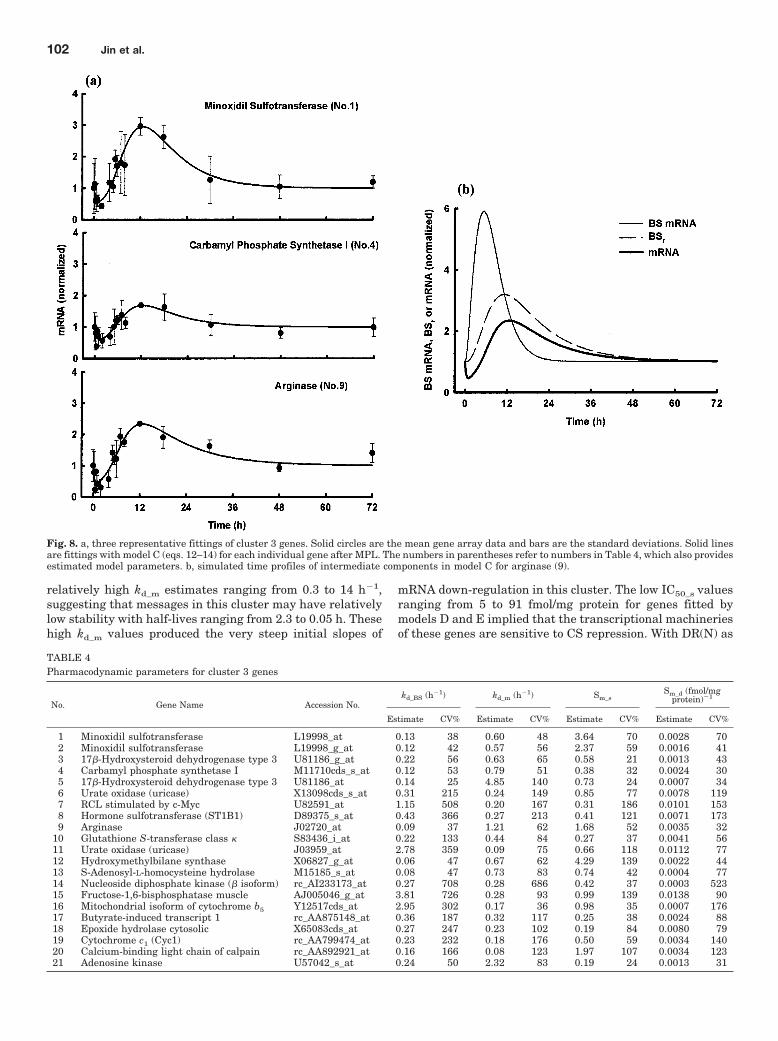
cytosol by DR followed by a delayed enhanced transcriptionthat is secondary to the steroid-enhanced expression of apresumed transcription factor BS. The mRNA for BS wasassumed to be a cluster 1 gene with linearly induced tran-scription by DR(N). Thus kd_BSm and SBSm were fixed as 0.3h�1 and 0.03 (fmol/mg of protein)�1 based on the typicalproperty of cluster 1 genes. Figure 8a shows three represen-tative fittings in this cluster. Figure 8b exhibits the simu-lated components of model C using arginase (9) as an exam-ple. The initial decline in mRNA resulted from a rapid effectof DR. The DR(N)-induced BS mRNA reached a peak at 5 hand returned to baseline after 24 h. The BSr showed a de-
layed induction with peak at 11 h, which represented thetranslation process of BS protein from its message. The fur-ther delayed induction peak of cluster 3 genes at 12 h re-sulted from the transcriptional control by BSr. Table 4 liststhe estimated parameters for all 21 probes using model C.This cluster yielded a large range of Sm_d estimates from0.0004 to 0.011 (fmol/mg protein)�1, which correlated withthe difference in the nadir value of the initial inhibition ofcluster 3 genes ranging from 0.9 to 0.2. The Sm_s estimatesalso showed a relatively large range from 0.2 to 4.3, whichcorrelate with the difference in the peak value of the delayedenhancement ranging from 1.5 to 3. The turnover rate ofmessage level was described by the combination effects ofkd_BS and kd_m. Some parameter estimates were associatedwith relatively high CV%, implying that the model might besomewhat overparameterized for some genes.
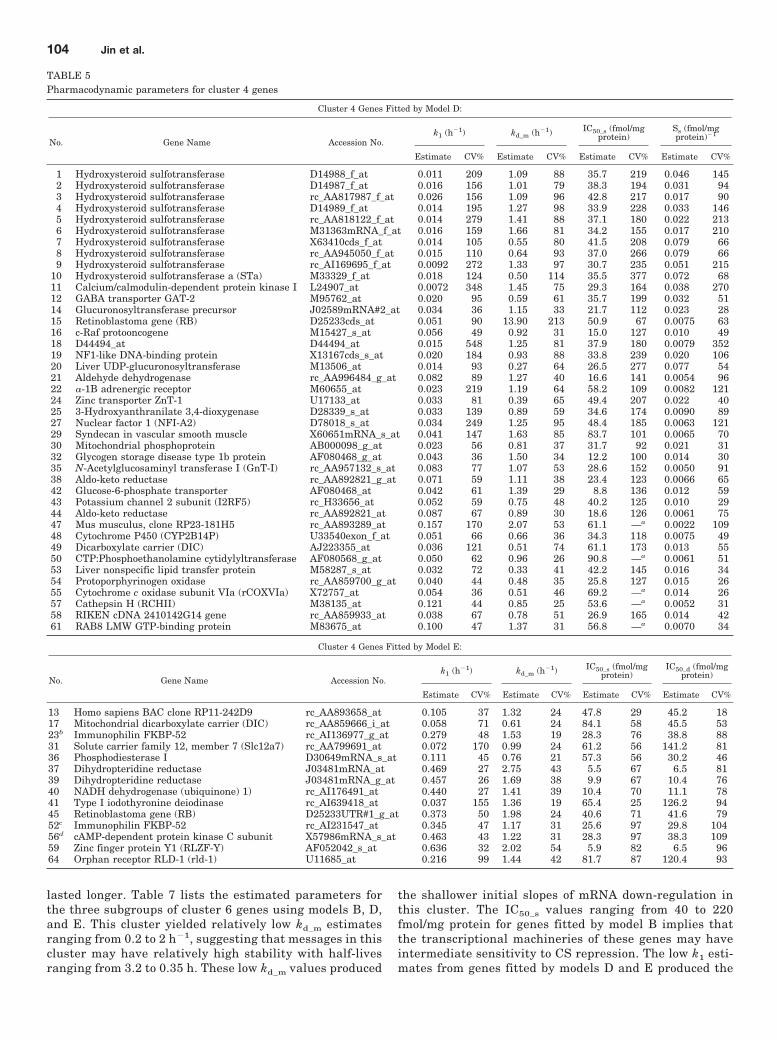
Cluster 4. Cluster 4 showed a fast and prolonged declinein mRNA followed by a further delayed sustained induction.This pattern suggests that, similar to cluster 3 genes, twomechanisms might be involved in CS action. Various models,including models D, E, and others that contained dual mech-anisms of CS action were also tested for genes in this cluster.About two-thirds of cluster 4 genes was best captured bymodel D, assuming a repressed transcription by DR(N) fol-lowed by an enhanced transcription that was initiated by thesteroid-enhanced regulator BS. These genes typically showeda sustained induction with very slow return to baseline evenuntil 72 h. Figure 9a shows three representative fittings ofcluster 4 genes by model D. Fourteen probe sets in thiscluster were best described by model E assuming the mRNAinduction was caused by inhibition of mRNA degradation bythe steroid-enhanced regulator BS. Compared with the genescharacterized by model D, the induction profiles of thesegenes showed a faster return phase with message returningto baseline as early as 24 h. Although the short-lived induc-tion peaks mimicked cluster 3 gene behavior, the long-lastinginitial repression of these genes made them sort into cluster4. Figure 9b shows three representative fittings of cluster 4genes by model E. The residual 11 probes in this clusterexhibited simple down-regulation for the first 12 h with noinduction. These genes were well captured by model B as-suming repressed transcription. The very fast decline phaseof these cluster 4 genes separated them from the cluster 6genes, which had a slower decrease. Figure 9c shows threerepresentative fittings of cluster 4 genes by model B. Table 5lists the estimated parameters for the three subgroups ofcluster 4 genes using model D, E, and B. This cluster yielded
Fig. 7. Three representative fittings of cluster 2 genes. Solid circles arethe mean gene array data and bars are the standard deviations. Solidlines are fittings with model A (eq. 10) for each individual gene afterMPL. The numbers in parentheses refer to numbers in Table 3, whichalso provides estimated model parameters.
TABLE 3Pharmacodynamic parameters for cluster 2 genes
No. Gene Name Accession No.kd_m (h�1) S (fmol/mg protein)�1
Estimate CV% Estimate CV%
1 �2-Macroglobulin X13983mRNA_at 0.038 20 0.27 162 �2-Macroglobulin M22670cds_g_at 0.043 19 0.21 153 �2-Macroglobulin M22670cds_at 0.042 19 0.45 154 �2-Macroglobulin rc_AI113046_at 0.043 17 2.17 135 Cyclophilin-like protein rc_AA892298_at 0.112 29 0.018 206 Mitochondrial isoform of cytochrome b5 Y12517cds_at 0.062 29 0.015 237 EH domain binding protein Epsin 2 AF096269_at 0.085 27 0.052 208a Members of the Vesl/Homer family of PDZ proteins AB007690_s_at 0.027 42 0.063 209 Fibronectin gene 5�-end with prepro sequence X05831cds_at 0.040 32 0.034 26
a mRNA0 estimated as 0.51 (CV% � 20).
Modeling of Corticosteroid Pharmacogenomics 101
relatively high kd_m estimates ranging from 0.3 to 14 h�1,suggesting that messages in this cluster may have relativelylow stability with half-lives ranging from 2.3 to 0.05 h. Thesehigh kd_m values produced the very steep initial slopes of
mRNA down-regulation in this cluster. The low IC50_s valuesranging from 5 to 91 fmol/mg protein for genes fitted bymodels D and E implied that the transcriptional machineriesof these genes are sensitive to CS repression. With DR(N) as
TABLE 4Pharmacodynamic parameters for cluster 3 genes
No. Gene Name Accession No.kd_BS (h�1) kd_m (h�1) Sm_s
Sm_d (fmol/mgprotein)�1
Estimate CV% Estimate CV% Estimate CV% Estimate CV%
1 Minoxidil sulfotransferase L19998_at 0.13 38 0.60 48 3.64 70 0.0028 702 Minoxidil sulfotransferase L19998_g_at 0.12 42 0.57 56 2.37 59 0.0016 413 17-Hydroxysteroid dehydrogenase type 3 U81186_g_at 0.22 56 0.63 65 0.58 21 0.0013 434 Carbamyl phosphate synthetase I M11710cds_s_at 0.12 53 0.79 51 0.38 32 0.0024 305 17-Hydroxysteroid dehydrogenase type 3 U81186_at 0.14 25 4.85 140 0.73 24 0.0007 346 Urate oxidase (uricase) X13098cds_s_at 0.31 215 0.24 149 0.85 77 0.0078 1197 RCL stimulated by c-Myc U82591_at 1.15 508 0.20 167 0.31 186 0.0101 1538 Hormone sulfotransferase (ST1B1) D89375_s_at 0.43 366 0.27 213 0.41 121 0.0071 1739 Arginase J02720_at 0.09 37 1.21 62 1.68 52 0.0035 32
10 Glutathione S-transferase class � S83436_i_at 0.22 133 0.44 84 0.27 37 0.0041 5611 Urate oxidase (uricase) J03959_at 2.78 359 0.09 75 0.66 118 0.0112 7712 Hydroxymethylbilane synthase X06827_g_at 0.06 47 0.67 62 4.29 139 0.0022 4413 S-Adenosyl-L-homocysteine hydrolase M15185_s_at 0.08 47 0.73 83 0.74 42 0.0004 7714 Nucleoside diphosphate kinase ( isoform) rc_AI233173_at 0.27 708 0.28 686 0.42 37 0.0003 52315 Fructose-1,6-bisphosphatase muscle AJ005046_g_at 3.81 726 0.28 93 0.99 139 0.0138 9016 Mitochondrial isoform of cytochrome b5 Y12517cds_at 2.95 302 0.17 36 0.98 35 0.0007 17617 Butyrate-induced transcript 1 rc_AA875148_at 0.36 187 0.32 117 0.25 38 0.0024 8818 Epoxide hydrolase cytosolic X65083cds_at 0.27 247 0.23 102 0.19 84 0.0080 7919 Cytochrome c1 (Cyc1) rc_AA799474_at 0.23 232 0.18 176 0.50 59 0.0034 14020 Calcium-binding light chain of calpain rc_AA892921_at 0.16 166 0.08 123 1.97 107 0.0034 12321 Adenosine kinase U57042_s_at 0.24 50 2.32 83 0.19 24 0.0013 31
Fig. 8. a, three representative fittings of cluster 3 genes. Solid circles are the mean gene array data and bars are the standard deviations. Solid linesare fittings with model C (eqs. 12–14) for each individual gene after MPL. The numbers in parentheses refer to numbers in Table 4, which also providesestimated model parameters. b, simulated time profiles of intermediate components in model C for arginase (9).
102 Jin et al.
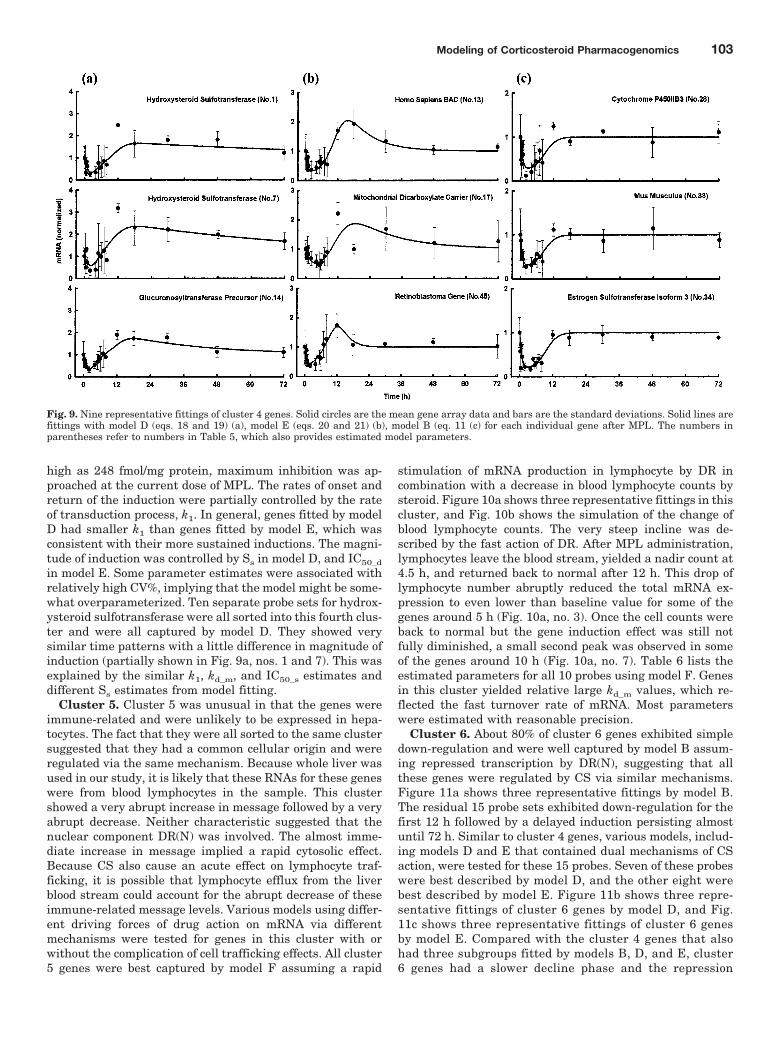
high as 248 fmol/mg protein, maximum inhibition was ap-proached at the current dose of MPL. The rates of onset andreturn of the induction were partially controlled by the rateof transduction process, k1. In general, genes fitted by modelD had smaller k1 than genes fitted by model E, which wasconsistent with their more sustained inductions. The magni-tude of induction was controlled by Ss in model D, and IC50_d
in model E. Some parameter estimates were associated withrelatively high CV%, implying that the model might be some-what overparameterized. Ten separate probe sets for hydrox-ysteroid sulfotransferase were all sorted into this fourth clus-ter and were all captured by model D. They showed verysimilar time patterns with a little difference in magnitude ofinduction (partially shown in Fig. 9a, nos. 1 and 7). This wasexplained by the similar k1, kd_m, and IC50_s estimates anddifferent Ss estimates from model fitting.
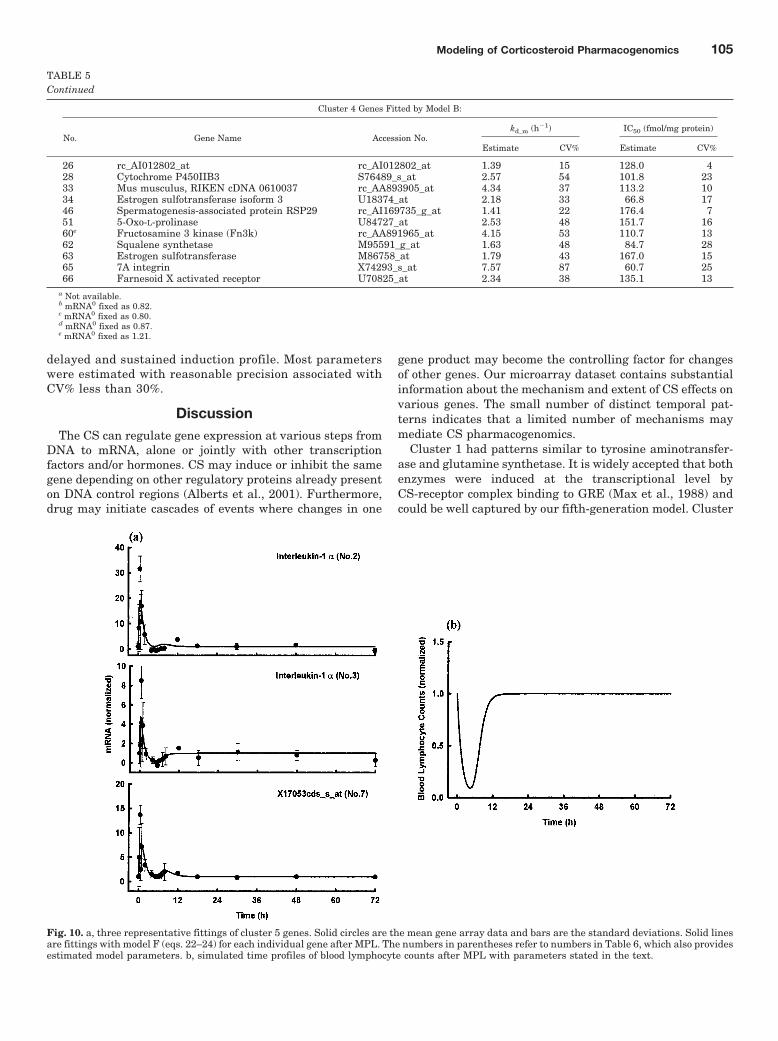
Cluster 5. Cluster 5 was unusual in that the genes wereimmune-related and were unlikely to be expressed in hepa-tocytes. The fact that they were all sorted to the same clustersuggested that they had a common cellular origin and wereregulated via the same mechanism. Because whole liver wasused in our study, it is likely that these RNAs for these geneswere from blood lymphocytes in the sample. This clustershowed a very abrupt increase in message followed by a veryabrupt decrease. Neither characteristic suggested that thenuclear component DR(N) was involved. The almost imme-diate increase in message implied a rapid cytosolic effect.Because CS also cause an acute effect on lymphocyte traf-ficking, it is possible that lymphocyte efflux from the liverblood stream could account for the abrupt decrease of theseimmune-related message levels. Various models using differ-ent driving forces of drug action on mRNA via differentmechanisms were tested for genes in this cluster with orwithout the complication of cell trafficking effects. All cluster5 genes were best captured by model F assuming a rapid
stimulation of mRNA production in lymphocyte by DR incombination with a decrease in blood lymphocyte counts bysteroid. Figure 10a shows three representative fittings in thiscluster, and Fig. 10b shows the simulation of the change ofblood lymphocyte counts. The very steep incline was de-scribed by the fast action of DR. After MPL administration,lymphocytes leave the blood stream, yielded a nadir count at4.5 h, and returned back to normal after 12 h. This drop oflymphocyte number abruptly reduced the total mRNA ex-pression to even lower than baseline value for some of thegenes around 5 h (Fig. 10a, no. 3). Once the cell counts wereback to normal but the gene induction effect was still notfully diminished, a small second peak was observed in someof the genes around 10 h (Fig. 10a, no. 7). Table 6 lists theestimated parameters for all 10 probes using model F. Genesin this cluster yielded relative large kd_m values, which re-flected the fast turnover rate of mRNA. Most parameterswere estimated with reasonable precision.
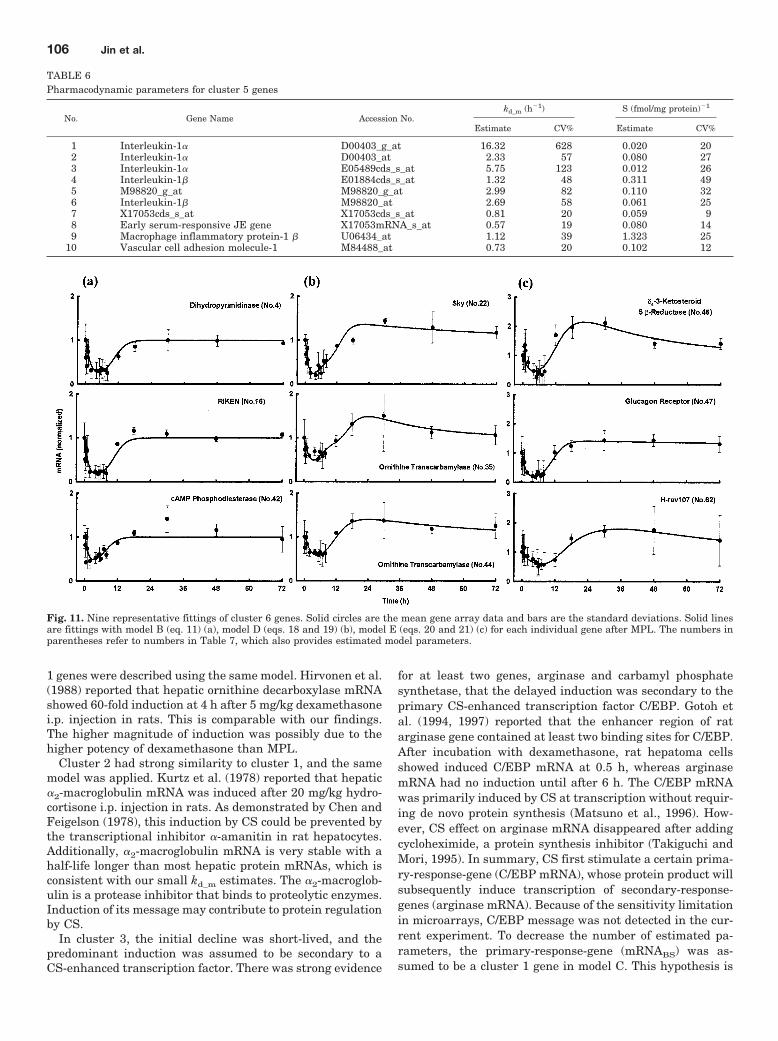
Cluster 6. About 80% of cluster 6 genes exhibited simpledown-regulation and were well captured by model B assum-ing repressed transcription by DR(N), suggesting that allthese genes were regulated by CS via similar mechanisms.Figure 11a shows three representative fittings by model B.The residual 15 probe sets exhibited down-regulation for thefirst 12 h followed by a delayed induction persisting almostuntil 72 h. Similar to cluster 4 genes, various models, includ-ing models D and E that contained dual mechanisms of CSaction, were tested for these 15 probes. Seven of these probeswere best described by model D, and the other eight werebest described by model E. Figure 11b shows three repre-sentative fittings of cluster 6 genes by model D, and Fig.11c shows three representative fittings of cluster 6 genesby model E. Compared with the cluster 4 genes that alsohad three subgroups fitted by models B, D, and E, cluster6 genes had a slower decline phase and the repression
Fig. 9. Nine representative fittings of cluster 4 genes. Solid circles are the mean gene array data and bars are the standard deviations. Solid lines arefittings with model D (eqs. 18 and 19) (a), model E (eqs. 20 and 21) (b), model B (eq. 11 (c) for each individual gene after MPL. The numbers inparentheses refer to numbers in Table 5, which also provides estimated model parameters.
Modeling of Corticosteroid Pharmacogenomics 103
lasted longer. Table 7 lists the estimated parameters forthe three subgroups of cluster 6 genes using models B, D,and E. This cluster yielded relatively low kd_m estimatesranging from 0.2 to 2 h�1, suggesting that messages in thiscluster may have relatively high stability with half-livesranging from 3.2 to 0.35 h. These low kd_m values produced
the shallower initial slopes of mRNA down-regulation inthis cluster. The IC50_s values ranging from 40 to 220fmol/mg protein for genes fitted by model B implies thatthe transcriptional machineries of these genes may haveintermediate sensitivity to CS repression. The low k1 esti-mates from genes fitted by models D and E produced the
TABLE 5Pharmacodynamic parameters for cluster 4 genes
Cluster 4 Genes Fitted by Model D:
No. Gene Name Accession No.k1 (h�1) kd_m (h�1) IC50_s (fmol/mg
protein)Ss (fmol/mgprotein)�1
Estimate CV% Estimate CV% Estimate CV% Estimate CV%
1 Hydroxysteroid sulfotransferase D14988_f_at 0.011 209 1.09 88 35.7 219 0.046 1452 Hydroxysteroid sulfotransferase D14987_f_at 0.016 156 1.01 79 38.3 194 0.031 943 Hydroxysteroid sulfotransferase rc_AA817987_f_at 0.026 156 1.09 96 42.8 217 0.017 904 Hydroxysteroid sulfotransferase D14989_f_at 0.014 195 1.27 98 33.9 228 0.033 1465 Hydroxysteroid sulfotransferase rc_AA818122_f_at 0.014 279 1.41 88 37.1 180 0.022 2136 Hydroxysteroid sulfotransferase M31363mRNA_f_at 0.016 159 1.66 81 34.2 155 0.017 2107 Hydroxysteroid sulfotransferase X63410cds_f_at 0.014 105 0.55 80 41.5 208 0.079 668 Hydroxysteroid sulfotransferase rc_AA945050_f_at 0.015 110 0.64 93 37.0 266 0.079 669 Hydroxysteroid sulfotransferase rc_AI169695_f_at 0.0092 272 1.33 97 30.7 235 0.051 215
10 Hydroxysteroid sulfotransferase a (STa) M33329_f_at 0.018 124 0.50 114 35.5 377 0.072 6811 Calcium/calmodulin-dependent protein kinase I L24907_at 0.0072 348 1.45 75 29.3 164 0.038 27012 GABA transporter GAT-2 M95762_at 0.020 95 0.59 61 35.7 199 0.032 5114 Glucuronosyltransferase precursor J02589mRNA#2_at 0.034 36 1.15 33 21.7 112 0.023 2815 Retinoblastoma gene (RB) D25233cds_at 0.051 90 13.90 213 50.9 67 0.0075 6316 c-Raf protooncogene M15427_s_at 0.056 49 0.92 31 15.0 127 0.010 4918 D44494_at D44494_at 0.015 548 1.25 81 37.9 180 0.0079 35219 NF1-like DNA-binding protein X13167cds_s_at 0.020 184 0.93 88 33.8 239 0.020 10620 Liver UDP-glucuronosyltransferase M13506_at 0.014 93 0.27 64 26.5 277 0.077 5421 Aldehyde dehydrogenase rc_AA996484_g_at 0.082 89 1.27 40 16.6 141 0.0054 9622 �-1B adrenergic receptor M60655_at 0.023 219 1.19 64 58.2 109 0.0082 12124 Zinc transporter ZnT-1 U17133_at 0.033 81 0.39 65 49.4 207 0.022 4025 3-Hydroxyanthranilate 3,4-dioxygenase D28339_s_at 0.033 139 0.89 59 34.6 174 0.0090 8927 Nuclear factor 1 (NFI-A2) D78018_s_at 0.034 249 1.25 95 48.4 185 0.0063 12129 Syndecan in vascular smooth muscle X60651mRNA_s_at 0.041 147 1.63 85 83.7 101 0.0065 7030 Mitochondrial phosphoprotein AB000098_g_at 0.023 56 0.81 37 31.7 92 0.021 3132 Glycogen storage disease type 1b protein AF080468_g_at 0.043 36 1.50 34 12.2 100 0.014 3035 N-Acetylglucosaminyl transferase I (GnT-I) rc_AA957132_s_at 0.083 77 1.07 53 28.6 152 0.0050 9138 Aldo-keto reductase rc_AA892821_g_at 0.071 59 1.11 38 23.4 123 0.0066 6542 Glucose-6-phosphate transporter AF080468_at 0.042 61 1.39 29 8.8 136 0.012 5943 Potassium channel 2 subunit (I2RF5) rc_H33656_at 0.052 59 0.75 48 40.2 125 0.010 2944 Aldo-keto reductase rc_AA892821_at 0.087 67 0.89 30 18.6 126 0.0061 7547 Mus musculus, clone RP23-181H5 rc_AA893289_at 0.157 170 2.07 53 61.1 —a 0.0022 10948 Cytochrome P450 (CYP2B14P) U33540exon_f_at 0.051 66 0.66 36 34.3 118 0.0075 4949 Dicarboxylate carrier (DIC) AJ223355_at 0.036 121 0.51 74 61.1 173 0.013 5550 CTP:Phosphoethanolamine cytidylyltransferase AF080568_g_at 0.050 62 0.96 26 90.8 —a 0.0061 5153 Liver nonspecific lipid transfer protein M58287_s_at 0.032 72 0.33 41 42.2 145 0.016 3454 Protoporphyrinogen oxidase rc_AA859700_g_at 0.040 44 0.48 35 25.8 127 0.015 2655 Cytochrome c oxidase subunit VIa (rCOXVIa) X72757_at 0.054 36 0.51 46 69.2 —a 0.014 2657 Cathepsin H (RCHII) M38135_at 0.121 44 0.85 25 53.6 —a 0.0052 3158 RIKEN cDNA 2410142G14 gene rc_AA859933_at 0.038 67 0.78 51 26.9 165 0.014 4261 RAB8 LMW GTP-binding protein M83675_at 0.100 47 1.37 31 56.8 —a 0.0070 34
Cluster 4 Genes Fitted by Model E:
No. Gene Name Accession No.k1 (h�1) kd_m (h�1) IC50_s (fmol/mg
protein)IC50_d (fmol/mg
protein)
Estimate CV% Estimate CV% Estimate CV% Estimate CV%
13 Homo sapiens BAC clone RP11-242D9 rc_AA893658_at 0.105 37 1.32 24 47.8 29 45.2 1817 Mitochondrial dicarboxylate carrier (DIC) rc_AA859666_i_at 0.058 71 0.61 24 84.1 58 45.5 5323b Immunophilin FKBP-52 rc_AI136977_g_at 0.279 48 1.53 19 28.3 76 38.8 8831 Solute carrier family 12, member 7 (Slc12a7) rc_AA799691_at 0.072 170 0.99 24 61.2 56 141.2 8136 Phosphodiesterase I D30649mRNA_s_at 0.111 45 0.76 21 57.3 56 30.2 4637 Dihydropteridine reductase J03481mRNA_at 0.469 27 2.75 43 5.5 67 6.5 8139 Dihydropteridine reductase J03481mRNA_g_at 0.457 26 1.69 38 9.9 67 10.4 7640 NADH dehydrogenase (ubiquinone) 1) rc_AI176491_at 0.440 27 1.41 39 10.4 70 11.1 7841 Type I iodothyronine deiodinase rc_AI639418_at 0.037 155 1.36 19 65.4 25 126.2 9445 Retinoblastoma gene (RB) D25233UTR#1_g_at 0.373 50 1.98 24 40.6 71 41.6 7952c Immunophilin FKBP-52 rc_AI231547_at 0.345 47 1.17 31 25.6 97 29.8 10456d cAMP-dependent protein kinase C subunit X57986mRNA_s_at 0.463 43 1.22 31 28.3 97 38.3 10959 Zinc finger protein Y1 (RLZF-Y) AF052042_s_at 0.636 32 2.02 54 5.9 82 6.5 9664 Orphan receptor RLD-1 (rld-1) U11685_at 0.216 99 1.44 42 81.7 87 120.4 93
104 Jin et al.
delayed and sustained induction profile. Most parameterswere estimated with reasonable precision associated withCV% less than 30%.
DiscussionThe CS can regulate gene expression at various steps from
DNA to mRNA, alone or jointly with other transcriptionfactors and/or hormones. CS may induce or inhibit the samegene depending on other regulatory proteins already presenton DNA control regions (Alberts et al., 2001). Furthermore,drug may initiate cascades of events where changes in one
gene product may become the controlling factor for changesof other genes. Our microarray dataset contains substantialinformation about the mechanism and extent of CS effects onvarious genes. The small number of distinct temporal pat-terns indicates that a limited number of mechanisms maymediate CS pharmacogenomics.
Cluster 1 had patterns similar to tyrosine aminotransfer-ase and glutamine synthetase. It is widely accepted that bothenzymes were induced at the transcriptional level byCS-receptor complex binding to GRE (Max et al., 1988) andcould be well captured by our fifth-generation model. Cluster
Fig. 10. a, three representative fittings of cluster 5 genes. Solid circles are the mean gene array data and bars are the standard deviations. Solid linesare fittings with model F (eqs. 22–24) for each individual gene after MPL. The numbers in parentheses refer to numbers in Table 6, which also providesestimated model parameters. b, simulated time profiles of blood lymphocyte counts after MPL with parameters stated in the text.
TABLE 5Continued
Cluster 4 Genes Fitted by Model B:
No. Gene Name Accession No.kd_m (h�1) IC50 (fmol/mg protein)
Estimate CV% Estimate CV%
26 rc_AI012802_at rc_AI012802_at 1.39 15 128.0 428 Cytochrome P450IIB3 S76489_s_at 2.57 54 101.8 2333 Mus musculus, RIKEN cDNA 0610037 rc_AA893905_at 4.34 37 113.2 1034 Estrogen sulfotransferase isoform 3 U18374_at 2.18 33 66.8 1746 Spermatogenesis-associated protein RSP29 rc_AI169735_g_at 1.41 22 176.4 751 5-Oxo-L-prolinase U84727_at 2.53 48 151.7 1660e Fructosamine 3 kinase (Fn3k) rc_AA891965_at 4.15 53 110.7 1362 Squalene synthetase M95591_g_at 1.63 48 84.7 2863 Estrogen sulfotransferase M86758_at 1.79 43 167.0 1565 7A integrin X74293_s_at 7.57 87 60.7 2566 Farnesoid X activated receptor U70825_at 2.34 38 135.1 13
a Not available.b mRNA0 fixed as 0.82.c mRNA0 fixed as 0.80.d mRNA0 fixed as 0.87.e mRNA0 fixed as 1.21.
Modeling of Corticosteroid Pharmacogenomics 105
1 genes were described using the same model. Hirvonen et al.(1988) reported that hepatic ornithine decarboxylase mRNAshowed 60-fold induction at 4 h after 5 mg/kg dexamethasonei.p. injection in rats. This is comparable with our findings.The higher magnitude of induction was possibly due to thehigher potency of dexamethasone than MPL.
Cluster 2 had strong similarity to cluster 1, and the samemodel was applied. Kurtz et al. (1978) reported that hepatic�2-macroglobulin mRNA was induced after 20 mg/kg hydro-cortisone i.p. injection in rats. As demonstrated by Chen andFeigelson (1978), this induction by CS could be prevented bythe transcriptional inhibitor �-amanitin in rat hepatocytes.Additionally, �2-macroglobulin mRNA is very stable with ahalf-life longer than most hepatic protein mRNAs, which isconsistent with our small kd_m estimates. The �2-macroglob-ulin is a protease inhibitor that binds to proteolytic enzymes.Induction of its message may contribute to protein regulationby CS.
In cluster 3, the initial decline was short-lived, and thepredominant induction was assumed to be secondary to aCS-enhanced transcription factor. There was strong evidence
for at least two genes, arginase and carbamyl phosphatesynthetase, that the delayed induction was secondary to theprimary CS-enhanced transcription factor C/EBP. Gotoh etal. (1994, 1997) reported that the enhancer region of ratarginase gene contained at least two binding sites for C/EBP.After incubation with dexamethasone, rat hepatoma cellsshowed induced C/EBP mRNA at 0.5 h, whereas arginasemRNA had no induction until after 6 h. The C/EBP mRNAwas primarily induced by CS at transcription without requir-ing de novo protein synthesis (Matsuno et al., 1996). How-ever, CS effect on arginase mRNA disappeared after addingcycloheximide, a protein synthesis inhibitor (Takiguchi andMori, 1995). In summary, CS first stimulate a certain prima-ry-response-gene (C/EBP mRNA), whose protein product willsubsequently induce transcription of secondary-response-genes (arginase mRNA). Because of the sensitivity limitationin microarrays, C/EBP message was not detected in the cur-rent experiment. To decrease the number of estimated pa-rameters, the primary-response-gene (mRNABS) was as-sumed to be a cluster 1 gene in model C. This hypothesis is
TABLE 6Pharmacodynamic parameters for cluster 5 genes
No. Gene Name Accession No.kd_m (h�1) S (fmol/mg protein)�1
Estimate CV% Estimate CV%
1 Interleukin-1� D00403_g_at 16.32 628 0.020 202 Interleukin-1� D00403_at 2.33 57 0.080 273 Interleukin-1� E05489cds_s_at 5.75 123 0.012 264 Interleukin-1 E01884cds_s_at 1.32 48 0.311 495 M98820_g_at M98820_g_at 2.99 82 0.110 326 Interleukin-1 M98820_at 2.69 58 0.061 257 X17053cds_s_at X17053cds_s_at 0.81 20 0.059 98 Early serum-responsive JE gene X17053mRNA_s_at 0.57 19 0.080 149 Macrophage inflammatory protein-1 U06434_at 1.12 39 1.323 25
10 Vascular cell adhesion molecule-1 M84488_at 0.73 20 0.102 12
Fig. 11. Nine representative fittings of cluster 6 genes. Solid circles are the mean gene array data and bars are the standard deviations. Solid linesare fittings with model B (eq. 11) (a), model D (eqs. 18 and 19) (b), model E (eqs. 20 and 21) (c) for each individual gene after MPL. The numbers inparentheses refer to numbers in Table 7, which also provides estimated model parameters.
106 Jin et al.
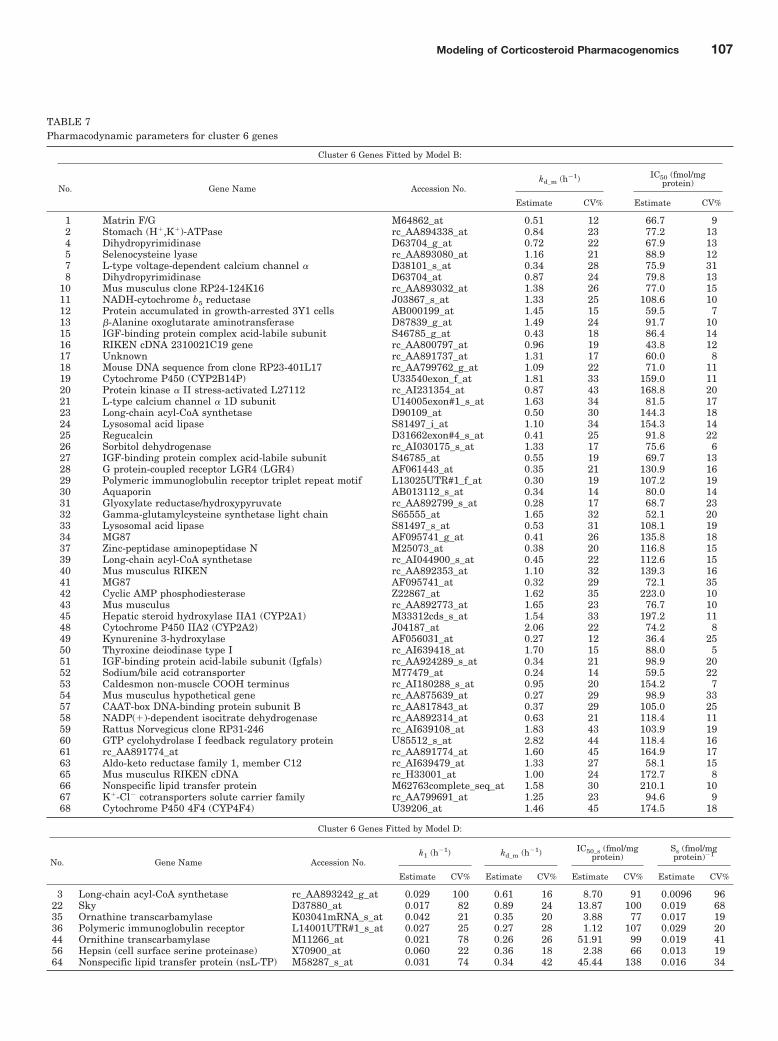
TABLE 7Pharmacodynamic parameters for cluster 6 genes
Cluster 6 Genes Fitted by Model B:
No. Gene Name Accession No.kd_m (h�1) IC50 (fmol/mg
protein)
Estimate CV% Estimate CV%
1 Matrin F/G M64862_at 0.51 12 66.7 92 Stomach (H�,K�)-ATPase rc_AA894338_at 0.84 23 77.2 134 Dihydropyrimidinase D63704_g_at 0.72 22 67.9 135 Selenocysteine lyase rc_AA893080_at 1.16 21 88.9 127 L-type voltage-dependent calcium channel � D38101_s_at 0.34 28 75.9 318 Dihydropyrimidinase D63704_at 0.87 24 79.8 13
10 Mus musculus clone RP24-124K16 rc_AA893032_at 1.38 26 77.0 1511 NADH-cytochrome b5 reductase J03867_s_at 1.33 25 108.6 1012 Protein accumulated in growth-arrested 3Y1 cells AB000199_at 1.45 15 59.5 713 -Alanine oxoglutarate aminotransferase D87839_g_at 1.49 24 91.7 1015 IGF-binding protein complex acid-labile subunit S46785_g_at 0.43 18 86.4 1416 RIKEN cDNA 2310021C19 gene rc_AA800797_at 0.96 19 43.8 1217 Unknown rc_AA891737_at 1.31 17 60.0 818 Mouse DNA sequence from clone RP23-401L17 rc_AA799762_g_at 1.09 22 71.0 1119 Cytochrome P450 (CYP2B14P) U33540exon_f_at 1.81 33 159.0 1120 Protein kinase � II stress-activated L27112 rc_AI231354_at 0.87 43 168.8 2021 L-type calcium channel � 1D subunit U14005exon#1_s_at 1.63 34 81.5 1723 Long-chain acyl-CoA synthetase D90109_at 0.50 30 144.3 1824 Lysosomal acid lipase S81497_i_at 1.10 34 154.3 1425 Regucalcin D31662exon#4_s_at 0.41 25 91.8 2226 Sorbitol dehydrogenase rc_AI030175_s_at 1.33 17 75.6 627 IGF-binding protein complex acid-labile subunit S46785_at 0.55 19 69.7 1328 G protein-coupled receptor LGR4 (LGR4) AF061443_at 0.35 21 130.9 1629 Polymeric immunoglobulin receptor triplet repeat motif L13025UTR#1_f_at 0.30 19 107.2 1930 Aquaporin AB013112_s_at 0.34 14 80.0 1431 Glyoxylate reductase/hydroxypyruvate rc_AA892799_s_at 0.28 17 68.7 2332 Gamma-glutamylcysteine synthetase light chain S65555_at 1.65 32 52.1 2033 Lysosomal acid lipase S81497_s_at 0.53 31 108.1 1934 MG87 AF095741_g_at 0.41 26 135.8 1837 Zinc-peptidase aminopeptidase N M25073_at 0.38 20 116.8 1539 Long-chain acyl-CoA synthetase rc_AI044900_s_at 0.45 22 112.6 1540 Mus musculus RIKEN rc_AA892353_at 1.10 32 139.3 1641 MG87 AF095741_at 0.32 29 72.1 3542 Cyclic AMP phosphodiesterase Z22867_at 1.62 35 223.0 1043 Mus musculus rc_AA892773_at 1.65 23 76.7 1045 Hepatic steroid hydroxylase IIA1 (CYP2A1) M33312cds_s_at 1.54 33 197.2 1148 Cytochrome P450 IIA2 (CYP2A2) J04187_at 2.06 22 74.2 849 Kynurenine 3-hydroxylase AF056031_at 0.27 12 36.4 2550 Thyroxine deiodinase type I rc_AI639418_at 1.70 15 88.0 551 IGF-binding protein acid-labile subunit (Igfals) rc_AA924289_s_at 0.34 21 98.9 2052 Sodium/bile acid cotransporter M77479_at 0.24 14 59.5 2253 Caldesmon non-muscle COOH terminus rc_AI180288_s_at 0.95 20 154.2 754 Mus musculus hypothetical gene rc_AA875639_at 0.27 29 98.9 3357 CAAT-box DNA-binding protein subunit B rc_AA817843_at 0.37 29 105.0 2558 NADP(�)-dependent isocitrate dehydrogenase rc_AA892314_at 0.63 21 118.4 1159 Rattus Norvegicus clone RP31-246 rc_AI639108_at 1.83 43 103.9 1960 GTP cyclohydrolase I feedback regulatory protein U85512_s_at 2.82 44 118.4 1661 rc_AA891774_at rc_AA891774_at 1.60 45 164.9 1763 Aldo-keto reductase family 1, member C12 rc_AI639479_at 1.33 27 58.1 1565 Mus musculus RIKEN cDNA rc_H33001_at 1.00 24 172.7 866 Nonspecific lipid transfer protein M62763complete_seq_at 1.58 30 210.1 1067 K�-Cl� cotransporters solute carrier family rc_AA799691_at 1.25 23 94.6 968 Cytochrome P450 4F4 (CYP4F4) U39206_at 1.46 45 174.5 18
Cluster 6 Genes Fitted by Model D:
No. Gene Name Accession No.k1 (h�1) kd_m (h�1) IC50_s (fmol/mg
protein)Ss (fmol/mgprotein)�1
Estimate CV% Estimate CV% Estimate CV% Estimate CV%
3 Long-chain acyl-CoA synthetase rc_AA893242_g_at 0.029 100 0.61 16 8.70 91 0.0096 9622 Sky D37880_at 0.017 82 0.89 24 13.87 100 0.019 6835 Ornathine transcarbamylase K03041mRNA_s_at 0.042 21 0.35 20 3.88 77 0.017 1936 Polymeric immunoglobulin receptor L14001UTR#1_s_at 0.027 25 0.27 28 1.12 107 0.029 2044 Ornithine transcarbamylase M11266_at 0.021 78 0.26 26 51.91 99 0.019 4156 Hepsin (cell surface serine proteinase) X70900_at 0.060 22 0.36 18 2.38 66 0.013 1964 Nonspecific lipid transfer protein (nsL-TP) M58287_s_at 0.031 74 0.34 42 45.44 138 0.016 34
Modeling of Corticosteroid Pharmacogenomics 107

testable by measuring C/EBP mRNA using real-time reversetranscription-polymerase chain reaction.
Most cluster 4 genes also showed dual regulation by CS withlonger suppression. This suggests that instead of rapid influ-ence on mRNA stability in cytosol, these genes may be down-regulated by CS-receptor binding to negative GRE on DNA. Thesecondary induction may be caused by a CS-enhanced biosignalsimilar to cluster 3, as described in model D. This biosignal mayexhibit a delayed and prolonged message induction, similar tocluster 2 genes. Xiao et al. (1995) reported that aldehyde dehy-drogenase expression was inhibited by 1 M dexamethasone inrat hepatocytes. Moreover, arylhydrocarbon receptor acts as atranscription factor by binding to aldehyde dehydrogenaseDNA and facilitates its transactivation. In hepatoma cells, aryl-hydrocarbon receptor could be induced 2.5-fold by dexametha-sone (Wiebel and Cikryt, 1990). This evidence supports ourmodel assumptions. Some cluster 4 genes were best fitted bymodel E assuming secondary inhibition of mRNA degradation.Hepatic ribonuclease activity was suppressed in rats receiving10 mg/kg prednisolone i.p. injection (Onyezili and Goodlad,1981). This may serve as general mechanism for stabilizinggenes that are sensitive to ribonuclease degradation. The hypo-thetical compartment (BSa) in models D and E was the simpli-fied form of the primary-response-product (BSr) in model C.This simplification allowed illustration of the underlying trans-duction process without assuming BSr mRNA behavior.
Cluster 5 contained immune-related genes that may orig-inate from blood lymphocytes. The almost immediate mes-sage increase was unlikely to be GRE-mediated. One possi-bility was inhibition of cytosolic mRNA degradation.However, the very abrupt increase would yield unrealisti-cally high estimation of mRNA synthesis (data not shown).Some recent literature focused on rapid membrane-initiatedsteroid effects (Watson and Gametchu, 1999; Falkenstein etal., 2000). This pathway involves specific steroid membranereceptors, intracellular second messengers, and effectors onplasma membrane. The intracellular signaling may contrib-ute to genomic modulation of steroid. This information sup-ported model F. The dramatic mRNA decrease might resultfrom removal of blood lymphocytes, as discussed before. Thishypothesis is testable by counting lymphocytes in whole liverafter in vivo treatment. Normally, 45% of blood lymphocytesmigrate to spleen, and 42% move into lymph nodes. Onlyabout 10% distribute to tertiary extralymphoid tissues suchas liver (Goldsby et al., 2000). Although hepatic interstitialfluid might contain few, if any, lymphocytes, their numberwas considered to be ignorable.
Cluster 6 was similar to cluster 4, but with a slower initialdecrease. Most of the genes showed simple down-regulationpresumably at transcription. For instance, cAMP phosphodi-esterase showed message suppression in rat hepatocytesupon adding 0.1 M dexamethasone (Hermsdorf et al., 1999).Inhibition of phosphodiesterase, the cAMP degradation en-zyme, may lead to enhanced cAMP, which is essential forcontrolling numerous genes/proteins. In one of our studies,single injection of MPL increased hepatic cAMP 1.5-fold for10 h (data not shown). Ornithine carbamoyltransferase was acluster 6 gene with dual regulation by CS and captured bymodel D. Rats receiving 50 g of hydrocortisone i.p. injectionshowed ornithine carbamoyltransferase suppression, and50-g dibutyryl-cAMP administration could induce this en-zyme (Gautier et al., 1985). Therefore, CS-induced cAMPmay act as BSa causing the delayed induction. In addition,CS can affect several endocrine factors. Insulin will be in-duced secondary to the gluconeogenic effect of CS. Genomicchanges may involve regulation by several hormones.
Although the literature confirms that CS alter expression ofmany genes that we observed, it is sometimes difficult to com-pare our results with previous work quantitatively or evenqualitatively, especially for cluster 3, 4, and 6 genes that arefound to be regulated differently at different times. Questions ofdrug, dose, time, in vitro/in vivo differences, and message quan-tification methods arise. Of special note, several genes such ashydroxysteroid sulfotransferase (Table 5) and ornithine decar-boxylase (Table 2) were monitored using different probes. Rea-sonable concordance in profiles and dynamic parameters indi-cated a degree of reproducibility in use of microarray probes.
Proper analysis and understanding of microarray resultshave been challenging since the technology evolved. Clusteranalysis will group genes with high correlation coefficientsassuming they share similar regulation mechanism. By per-forming mechanism-based PD modeling for each individualgene, we found some interesting results. Most genes in thesame cluster were successfully described by the same math-ematical model. However, cluster 4 and 6 each had threesubgroups that were modeled differently, implying that thestatistical approach was not sensitive enough to identifydissimilarity. Overall, six models were used to capture allCS-responsive genes. Although clusters 1 and 2 had statisti-cally different patterns, they could be captured by the samemodel, implying that the difference was not caused by differ-ent mechanism but by different sensitivity of mRNA to en-dogenous/exogenous regulators. Clusters 4 and 6 also sharedthe same general models. At present, we analyzed genes
TABLE 7Continued
Cluster 6 Genes Fitted by Model E:
No. Gene Name Accession No.k1 (h�1) kd_m (h�1) IC50_s (fmol/mg
protein)IC50_d (fmol/mg
protein)
Estimate CV% Estimate CV% Estimate CV% Estimate CV%
6 BC017139 Mus musculus, RIKEN cDNA rc_AA859663_at 0.026 145 0.36 13 39.32 50 71.14 789 NADH-cytochrome b5 reductase D00636Poly_A_Site#1_s_at 0.040 115 0.81 26 45.24 39 85.48 56
14 �4-3 Ketosteroid 5--reductase D17309_at 0.076 94 0.48 19 45.33 64 99.63 5438 Monoamine oxidase B M23601_at 0.111 59 0.66 16 36.45 56 66.02 4846 �4-3-Ketosteroid 5--reductase S80431_s_at 0.030 48 0.55 33 60.91 38 23.64 2047 Glucagon receptor M96674_at 0.004 202 0.90 16 41.13 16 14.03 17455 3-Hydroxyanthranilate 3,4-dioxygenase D28339_s_at 0.058 95 1.17 32 67.11 36 98.22 4162 H-rev107 X76453_at 0.022 53 0.19 15 36.52 53 21.89 20
108 Jin et al.
individually. Further integrated models incorporating multi-ple gene inter-regulations will provide additional insightsinto signaling networks at molecular, cellular, and systemiclevels. The present models serve to provide hypotheses onhow mRNA turnover is controlled by direct and secondaryfactors. These models sometimes confirm known mechanismsand sometimes are only possibilities that will need furtherexploration with specific studies (Hargrove, 1993).
This study was limited by technical factors such as genesavailable on the commercial chip, limited assay sensitivityespecially for low abundance messages, and clustering sen-sitivity especially for suppressed genes. Our pharmaco-genomic dataset was generated from whole liver that con-tains various cell types. This may mimic the real biologicalsituation, but extra complexities such as with cluster 5 wereintroduced. Only one dose level was studied, which obligedthe use of the linear stimulation coefficient S that limitedprediction capability. Chronic dosing conditions are expectedto cause additional complications (Ramakrishnan et al., 2002b).The rats were adrenalectomized to eliminate endogenous corti-costerone effects, but this might have distorted the natural CSresponse owing to the disturbed endocrine system.
In summary, we used microarray technology to identify timepatterns of diverse CS-responsive genes to evaluate pharma-cogenomic processes and develop generalized mathematicalmodels for receptor-gene-transduction dynamics. This facili-tates the understanding of the global picture of CS actions andprovides new insights for microarray data analysis.
Acknowledgments
We thank Ms. Sukyung Woo for technical assistance in data analysis.
ReferencesAlberts B, Johnson A, Lewis J, Raff M, Roberts K, and Walter P (2001) Molecular
Biology of the Cell, 4th ed. Garland Science, Washington, DC.Almon RR, DuBois DC, Brandenburg EH, Shi W, Zhang S, Straubinger RM, and
Jusko WJ (2002) Pharmacodynamics and pharmacogenomics of diverse receptor-mediated effects of methylprednisolone in rats using microarray analysis. J Phar-macokinet Pharmacodyn 29:103–129.
Almon RR, DuBois DC, Pearson KE, Stephan DA, and Jusko WJ (2003) Genetemporal patterns of drug response: corticosteroid effects on rat liver. Funct IntegrGenomics, in press.
Andrews RC and Walker BR (1999) Glucocorticoids and insulin resistance: oldhormones, new targets. Clin Sci 96:513–523.
Berdanier CD (1989) Role of glucocorticoids in the regulation of lipogenesis. FASEBJ 3:2179–2183.
Chen CL and Feigelson P (1978) Glucocorticoid induction of alpha2u-globulin proteinsynthesis and its mRNA in rat hepatocytes in vitro. J Biol Chem 253:7880–7885.
Chow FS, Sharma A, and Jusko WJ (1999) Modeling interactions between adrenalsuppression and T-helper lymphocyte trafficking during multiple dosing of meth-ylprednisolone. J Pharmacokinet Biopharm 27:559–575.
D’Argenio DZ and Schumitzky A (1997) ADAPT II User’s Guide: Pharmacokinetic/pharmacodynamic Systems Analysis Software. BioMedical Simulations Resource,Los Angeles.
Falkenstein E, Tillmann HC, Christ M, Feuring M, and Wehling M (2000) Multipleactions of steroid hormones: a focus on rapid, nongenomic effects. Pharmacol Rev52:513–556.
Ferron GM, Pyszczynski NA, and Jusko WJ (1999) Pharmacokinetic and pharma-coimmunodynamic interactions between prednisolone and sirolimus in adrenalec-tomized rats. J Pharmacokinet Biopharm 27:1–21.
Gautier C, Habechi Z, Belbekouche M, and Vaillant R (1985) Effects of corticoste-roids and pancreatic hormones on carbamyl phosphate synthetase-I and ornithinetranscarbamylase activities in fetal rat liver. Biol Neonate 48:285–291.
Goldsby RA, Kindt TJ, and Osborne BA (2000) Kuby Immunology, 4th ed. W. H.Freeman and Company, New York.
Gotoh T, Chowdhury S, Takiguchi M, and Mori M (1997) The glucocorticoid-responsive gene cascade. Activation of the rat arginase gene through induction ofC/EBPbeta. J Biol Chem 272:3694–3698.
Gotoh T, Haraguchi Y, Takiguchi M, and Mori M (1994) The delayed glucocorticoid-responsive and hepatoma cell-selective enhancer of the rat arginase gene is locatedaround intron 7. J Biochem 115:778–788.
Gottlicher M, Heck S, and Herrlich P (1998) Transcriptional cross-talk, the secondmode of steroid hormone receptor action. J Mol Med 76:480–489.
Hargrove JL (1993) Microcomputer-assisted kinetic modeling of mammalian geneexpression. FASEB J 7:1163–1170.
Hermsdorf T, Richter W, and Dettmer D (1999) Effects of dexamethasone andglucagon after long-term exposure on cyclic AMP phosphodiesterase 4 in culturedrat hepatocytes. Cell Signal 11:685–690.
Hirvonen A, Immonen T, Leinonen P, Alhonen-Hongisto L, Janne OA, and Janne J(1988) Effect of dexamethasone on the activity and expression of ornithine decar-boxylase in rat liver and thymus. Biochim Biophys Acta 950:229–233.
Jusko WJ (1994) Receptor-mediated pharmacodynamics of corticosteroids. Prog ClinBiol Res 387:261–270.
Kurtz DT, Chan KM, and Feigelson P (1978) Glucocorticoid induction of hepaticalpha2u-globulin synthesis and messenger RNA level in castrated male rats invivo. J Biol Chem 253:7886–7890.
Matsuno F, Chowdhury S, Gotoh T, Iwase K, Matsuzaki H, Takatsuki K, Mori M,and Takiguchi M (1996) Induction of the C/EBP beta gene by dexamethasone andglucagon in primary-cultured rat hepatocytes. J Biochem 119:524–532.
Max SR, Mill J, Mearow K, Konagaya M, Konagaya Y, Thomas JW, Banner C, andVitkovic L (1988) Dexamethasone regulates glutamine synthetase expression inrat skeletal muscles. Am J Physiol 255:E397–E402.
Miesfeld RL (2001) Glucocorticoid action: biochemistry, in Endocrinology, 4th ed.(DeGroot LJ and Jameson JL eds) pp 1647–1654, W. B. Saunders Company,Philadelphia.
Morand EF and Leech M (1999) Glucocorticoid regulation of inflammation: the plotthickens. Inflamm Res 48:557–560.
Oakley RH and Cidlowski JA (1993) Homologous down regulation of the glucocorti-coid receptor: the molecular machinery. Crit Rev Eukaryot Gene Expr 3:63–88.
Onyezili FN and Goodlad GA (1981) RNA polymerase and ribonuclease activities inskeletal muscle of prednisolone-treated rats. Enzyme 26:211–214.
Perez P, Page A, Bravo A, Del Rio M, Gimenez-Conti I, Budunova I, Slaga TJ, andJorcano JL (2001) Altered skin development and impaired proliferative and in-flammatory responses in transgenic mice overexpressing the glucocorticoid recep-tor. FASEB J 15:2030–2032.
Prough RA, Linder MW, Pinaire JA, Xiao GH, and Falkner KC (1996) Hormonalregulation of hepatic enzymes involved in foreign compound metabolism. FASEBJ 10:1369–1377.
Ramakrishnan R, DuBois DC, Almon RR, Pyszczynski NA, and Jusko WJ (2002a)Fifth-generation model for corticosteroid pharmacodynamics: application tosteady-state receptor down-regulation and enzyme induction patterns during sev-en-day continuous infusion of methylprednisolone in rats. J Pharmacokinet Phar-macodyn 29:1–24.
Ramakrishnan R, DuBois DC, Almon RR, Pyszczynski NA, and Jusko WJ (2002b)Pharmacodynamics and pharmacogenomics of methylprednisolone during 7-dayinfusions in rats. J Pharmacol Exp Ther 300:245–256.
Schimmer BP and Parker KL (1995) Adrenocorticotropic hormone; adrenocorticalsteroids and their synthetic analogs; inhibitors of the synthesis and actions ofadrenocortical hormones., in Goodman & Gilman’s The Pharmacological Basis ofTherapeutics, 9th ed. (Hardman JG, Limbird LE, Molinoff PB, Ruddon RW, andGilman AG eds) pp 1459–1485, McGraw-Hill Company, New York.
Sun YN, DuBois DC, Almon RR, and Jusko WJ (1998) Fourth-generation model forcorticosteroid pharmacodynamics: a model for methylprednisolone effects on re-ceptor/gene-mediated glucocorticoid receptor down-regulation and tyrosine amino-transferase induction in rat liver. J Pharmacokinet Biopharm 26:289–317.
Sun YN and Jusko WJ (1998) Transit compartments versus gamma distributionfunction to model signal transduction processes in pharmacodynamics. J PharmSci 87:732–737.
Sun YN, McKay LI, DuBois DC, Jusko WJ, and Almon RR (1999) Pharmacokinetic/pharmacodynamic models for corticosteroid receptor down-regulation and glu-tamine synthetase induction in rat skeletal muscle by a receptor/gene-mediatedmechanism. J Pharmacol Exp Ther 288:720–728.
Takiguchi M and Mori M (1995) Transcriptional regulation of genes for ornithinecycle enzymes. Biochem J 312:649–659.
Vedeckis WV, Ali M, and Allen HR (1989) Regulation of glucocorticoid receptorprotein and mRNA levels. Cancer Res 49:2295s–2302s.
Watson CS and Gametchu B (1999) Membrane-initiated steroid actions and theproteins that mediate them. Proc Soc Exp Biol Med 220:9–19.
Wiebel FJ and Cikryt P (1990) Dexamethasone-mediated potentiation of P450IA1induction in H4IIEC3/T hepatoma cells is dependent on a time-consuming processand associated with induction of the Ah receptor. Chem Biol Interact 76:307–320.
Xiao GH, Pinaire JA, Rodrigues AD, and Prough RA (1995) Regulation of the Ah genebattery via Ah receptor-dependent and independent processes in cultured adult rathepatocytes. Drug Metab Dispos 23:642–650.
Address correspondence to: Dr. William J. Jusko, Department of Pharma-ceutical Sciences, School of Pharmacy and Pharmaceutical Sciences, 565 Hoch-stetter Hall, State University of New York at Buffalo, Buffalo, NY 14260.E-mail: [email protected]
Modeling of Corticosteroid Pharmacogenomics 109