j cape of university - connecting repositories the growth model was developed in collaboration with...
TRANSCRIPT

Univers
ity of
Cap
e Tow
n
t
l I
TIMBER GROWTH AND SUCCESSION· IN THE MIXED I
EVERGREEN FORESTS OF THE SOUTHERN CAPE l
by
J C VAN DAALEN
Thesis Presented for the Degree of
DOCTO~ OF PHILOSOPHY
in the
Department of Botany
Faculty of Science
UNIVERSITY OF CAPE TOWN
1993

The copyright of this thesis vests in the author. No quotation from it or information derived from it is to be published without full acknowledgement of the source. The thesis is to be used for private study or non-commercial research purposes only.
Published by the University of Cape Town (UCT) in terms of the non-exclusive license granted to UCT by the author.
Univers
ity of
Cap
e Tow
n

Univers
ity of
Cap
e Tow
n
ii
DECLARATION
I hereby declare that the thesis is my own work, both in concept and execu
tion, and that apart from 1 imi ted guidance from my supervisors, I have
received no assistance except as stated below:
* The published papers were refereed by unidentified people. Many of
their comments, as well as those by my colleagues, were incorporated in
the text. Not one of the referees suggested any major changes in
research.approach, data analyses or text.
* The growth model was developed in collaboration with Dr Hank Shugart of
the USA. ~e, together with some colleagues, developed the KIAMBRAM
model. that was used as the basis for the OUTENIQUA model. I spent
three weeks with him, during which he explained his modelling approach
to me and answered numerous quest ions. The KIAMBRAM mode 1 was written
in FORTRAN IV and designed to run on a mainframe computer. Back in
South Africa I altered the FORTRAN IV code to FORTRAN V and rearranged
the entire model outlay to fit on an old-fashioned 16 bit Data General
minicomputer with only 64 Kb memory available to each user. I did all
the simulations, constructed the graphs and histograms and wrote the
original draft paper.
* I initiated, designed and executed the tree dating study. Dr JC Vogel
of the Division of Earth, Marine and Atmospheric Science and Technol
ogy, CSIR, assisted by Miss A Fuls, did the C14 dating of the wood
samples. Dr Frans Malan of the CSIR Division of Forest Science and
Technology did the radiation densitometric measurements, al though I did

Univers
ity of
Cap
e Tow
n
i i i
most of the sample preparation. I did all the data analyses, prepared
the draft paper and incorporated the co-authors' comments into the
final draft paper.
J C van Daalen

Univers
ity of
Cap
e Tow
n
ABSTRACT
ACKNOWLEOOEMENTS
SECTION 1:
iv
CONTENTS
INTRODUCTION
Forest ecology and landuse Southern Cape forests Study approach Modelling forest grQwth Succession Competition among trees Growth indicators Dating of trees
SECTION 2: RESEARCH FINDil'«JS ·
CHAPfER 1: t«>DELLIOO FOREST SUCCESSION
vii
x
2 3 4 6
10 10 11 12
OlITENIQUA - A computer model to simulate succession in the mixed evergreen forests of the southern Cape, South Africa.
Introduction The forest of the southern cape The model Model parameter estimation Model testing Discussion Acknowledgements References
CHAPTER 2: FOREST GROWI'H
Forest growth: A 35-year southern Cape case study.
Introduction Study area Methods Results Discussion Conclusions Acknowledgements References
15 16 17 21 22 25 26 26
29 30 31 32 35 36 37 37

Univers
ity of
Cap
e Tow
n
v
CHAPTER 3: CXM?ETITIOO IN 1lIE FOREST
The effect of competition on timber growth in a mixed evergreen forest stand.
Introduction Study area · Methods Results Discussion Acknowledgements References
CHAPTER 4: TREE GROWI'H INDICATORS
40 42 43 47 50 53 54
(a) The value of crown position and form as growth indicators in mixed evergreen forest.
Introduction Study area Methods Results Discussion Acknowledgements References
59 61 63 67 67 69 69
(b) cambial electrical resistance as an indicator of tree growth in the southern cape indigenous forests.
Introduction Technical description of the Shigometer Methods Results Discussion Conclusions Acknowledgements References
CHAPTER 5: DAT!~ OF TREES
Dating of Pterocarpus angolensis trees.
Introduction Methods Results Conclusions Acknowledgements References
70 70 72 73 73 75 76 76
78 79 80 82 84 84

Univers
ity of
Cap
e Tow
n
SECTION 3:
vi
EVALUATION AND CONCLUSI~S
Modelling forest succession Forest growth and succession Competition among trees Tree growth indicators Dating of trees Concluding remarks
REFERF.NCES for Abstract, Section 1 and Section 3
86 88 91 93 94 95
100

Univers
ity of
Cap
e Tow
n
vii
ABSTRACT
A deterministic distance-independent individual tree model, called OUfENIQUA,
was developed for a 44 ha southern Cape mixed evergreen forest compartment
where the DBH's of all trees have been measured over a 15 year period. The
central growth equation from another mode 1 for mixed forest was used and
parameters adjusted to cater for the southern Cape forests. The developed
model was then used to highlight research needs.
questions were addressed in this study.
Some of these research
Tree growth, mortality and recruitment rates were determined for the period
1972 to 1987 on the same forest stand as was used for the model development.
Mean basal area for all species together changed from 32.7 m2 /ha in 1972, to
34.1 m2 /ha in 1978 and 35.3 m2/ha in 1987. Net growth rates since 1942 have
declined from 1.63 3 per annum for the period 1942 to 1953 to only 0.35 3 per
annum for the period 1978 to 1987. Mortality rates of most species increased
and for some species exceeded their recruitment rates. ·Gross volume growth
rate for the stand since 1972 was very similar to that for unlogged tropical
forests elsewhere in the world, i.e. about 2 m3/ha per annum. Despite this
relatively slow growth, recovery from disturbances was, nevertheless,
relatively fast. Many aspects of the observed growth and mortality rates
could be explained in terms of the development phases of the forest. The
model of biomass accumulation by Bornmann and Likens (1979) was used as a
vehicle for unravel 1 ing the development stage of the forest and it was
concluded that it is in a late successional stage, close to its maximum timber
carrying capacity.
Competition among trees was determined by locating the exact position (to the
nearest 5 cm) of all trees on a 2.86 ha forest stand (i.e. 3970 trees),
calculating all the distances among them by means of the Arcinfo Geographic
Information System and correlating the distance between two neighbouring trees
with the growth of the smaller one of the pair. Both inter- and intraspecif ic
competition was evident between most of the chosen species combinations. The
apparent more pioneer-I ike species, such as Olea capensis subsp. macrocarpa,
Ocotea bullata and Apodytes dimidiata, showed weaker competitive abilities
than later successional species such as Podocarpus lat ifol ius, CUrtisia
dentata and Pterocelastrus tricuspidatus. Most of the southern cape forest
Univers
ity of
Cap
e Tow
n
viii
trees are shade-tolerant and can grow in close proximity to other trees, but
the growth rate of various species is retarded by competition. It was
concluded that the harvesting of the weaker competitors strictly according to
the numerical proportions by which they occur in the forest is unnecessary,
that the more valuable timber species profit from the advanced development
stage of the forest in that they are better late-successional competitors,
that the role of the dominant forest tree, Olea capensis subsp. macrocarpa,
is not fully understood and that the present management approach of harvesting
trees that most likely die, is sound.
Diameter increment over a 13 year period for a range of forest tree species
on the same 2.86 ha compartment was correlated with their crown position and
form. It was found that both crown variables are useful for the selection of
harvest trees of those species that occur in or above the canopy. The growth
of subcanopy species was, in general, not related to the crowns' positions in
the canopy. Crown form was, however, significantly correlated with growth of
some subcanopy species. For all the tree species (mainly canopy species) for
which increment was significantly correlated with both crown position and
crown form, the crown position and form scores were significantly related.
This confirmed the results of the competition study that the growth of these
trees were influenced by competition.
The use of cambial electrical resistance readings for distinguishing trees
with high from those with low growth rates, to detect trees with a reduced
growth rate as a result of pathogen infection or to compare the vigour of
indigenous versus alien trees proved to be of little value. Significant
correlation coefficients between resistance readings and growth rates were
obtained, but standard deviations were too high to be useful for indigenous
management purposes.
Theoretically tree age is one of the more reliable methods for determining and
predicting growth rates. In southern African hardwoods it is often very
difficult, if at al 1 possible, to determine this by tree ring counting.
Different tree dating techniques were tested on Pterocarpus angolensis, a
savanna hardwood. These were (a) C14 dating, (b) visual tree ring counting,
(c) counting of rings on X-ray photographs taken from the transverse surfaces
of samples cut from tree boles and (d) by using radiation densitometry. C14

Univers
ity of
Cap
e Tow
n
ix
dating of some southern Cape forest trees of known ages provided accurate
results. · Therefore, the ages of the Ptcrocarpus trees determined in this way
were accepted as correct. Visual ring counting and counting of rings on X-ray
photographs is subjective and requires considerable experience to obtain
reliable age estimates in these ways. C14 dating of trees is expensive and
takes a few months to complete, but is the most reliable method for dating
tropical trees where growth rings are absent or indistinct. For those tree
species where the denser areas on the transverse surfaces of the wood samples
correspond to annual growth, gamma ray densitometric measurements provide
reliable age estimates. In the case of Pterocarpus angolensis the radiation
densitometric system yielded poor results despite the fact that the wood of
this species is semi-ring-porous and contains terminal parenchyma. However,
alterations such as the use of the Fe 55 isotopic source, which emits softer
gamma rays that are better absorbed by wood, the use of thinner sections and
measurements over smaller areas and intervals could improve the results
considerably.
The model 1 ing and fol low-up approach fol lowed in this study proved to be
useful. It provided a framework for a systematic and logic sequence of
studies on forest growth and succession, an approach that can be followed
advantageously for research planning and motivations for funding. I
recommended that the model should be rewritten using more modern software.
The same modelling principles as were used for this study should be applied
during the rewriting and improvement of the model. The incorporation of the
results of this study can improve the model considerably and make it a useful
management tool.
Research on the germination and establishment of forest tree seedlings and
their development into saplings should receive priority. Little is known
about this development stage of the forest and it is, in general, neglected
by southern Cape forest managers.

Univers
ity of
Cap
e Tow
n
x
ACKNOWLEDGEMENTS
Usually by the time a thesis is completed, one is so relieved and tired of the
subject studied that the last thing one wants to do is to rewrite a conven
tional one-volume thesis into a number of papers suitable for publication.
For this reason, and to save work, I prepared each chapter as a separate
publication (in one instance as two shorter publications). A number of these
have been published already and others are in the process of publication.
I want to thank Prof Eugene Moll, my original promoter, for allowing me to use
this thesis format. His successor, Prof William Bond, kindly accepted this
format. His input is much appreciated. Part of this study was funded by the
Department of Water Affairs and Forestry (Forestry Branch). The final part
of the study was done under contract with FORESTEK, CSJR. Both institutions
are thanked for their support.
Finally, I am indebted to my wife, Bennie, and the children for their support
and patience, especially during· the final stages of the study and the thesis
preparation. They had to forfeit many a family outing and other privileges
because of me sittlng in front of my computer.
Hans van Daalen.

Univers
ity of
Cap
e Tow
n
SECTION 1
INTRODUCTION

Univers
ity of
Cap
e Tow
n
INTRODUCTION
FOREST ECOUXiY AND LANDUSE
"It often is difficult to extract from the apparent tranquil 1 i ty of a forest
a sense of the actual dynamism of trees struggling over centuries to gain
landscape for their species. To the human eye, a forest is a slowly changing
ecosystem that superficially looks alike from one year to the next. Yet, this
seeming quiet is, in fact, a balance between the tremendous proregenerative
potential of trees and an equally tremendous mortality rate. A single tree
can produce tens of mi 11 ions and On some species) hundreds of mi 11 ions of
potential offspring over its lifetime. This reproductive potential by far
outstrips the reproductive rates of the vast majority of animals, and its
makes the mul t ipl icat ive powers of organisms such as rabbi ts and lemmings pale
by comparison. When one couples a tree's reproductive potential with the fact
that trees can grow to the most massive organisms on earth, then a notion of
the ecological potential of trees begins to emerge." (Shugart, 1984).
These massive forces of increase must be counterbalanced by the forces of
decrease, mortality and predation. The understanding of these forces,
especially in the 1 ight of the longevity of trees, is very difficult. It is
virtually impossible to collect complete data sets on the dynamics of natural
forests. Typically one has bits of data from different points in time on
certain aspects of forest dynamics. These bits of data are then put together
1 ike pieces of a huge jigsaw puzzle, and more than of ten many pieces are
missing. To obtain additional pieces might take a lifetime of observations,
but often one has no assurance that the new pieces will fit the old (Shugart,
1984).
Ecology, and in this case forest ecology, is more than a mere collection of
facts. It is a way of assembling these facts into a logical whole (Oliver and
Larson, 1990), and in many cases facts based on scientific inference. Because
of this reliance on inference, mathematical simulations of forest dynamics
offer verifiable expressions of the mechanisms that we think might be of
importance in forest succession.
Seen in a broader context, mathematical models can be useful tools in deve-

Univers
ity of
Cap
e Tow
n
3
loping rational land use pol_icies that wi 11 result in a sensible balance
between the transfer of land to other uses and its retention as forested land
in perpetuity. At the end of 1980 the FAO estimated the total area of natural
woody vegetation in the tropical regions of the war Id at 2. 96 x 109 ha of
which 1.2 x 10⁹ ha was closed forest. It was estimated that 7.5 million ha
of closed forest ·would be cleared per year between 1981 and 1985 for agricul
tural settlement, shifting agriculture, logging and other forms of landuse.
Of this, shifting cultivation accounted for 45 %. An estimated 3.8 million
ha of open tree formations in the tropical regions were also expected to be
cleared each year. Thus the total area of forested land being cleared
annually was estimated to be 11.3 million ha. This is an expected rate of
clearing of 1.14 % per year. An additional 4. 4 mi 11 ion ha of closed forests
are logged every year but not cleared while considerable areas are being
degraded because of repeated burning and overgrazing (particularly the open
woodland)~ and excessive exploitation, especially for fuelwood (Lanly, 1983;
Shepherd and Richter, 1985). In the light of such rapid loss and degradation
of forest and woodland, the tools for proper resource management are of vital
importance. With mathematical forest growth mode ls long-term effects of
certain management activities, such as the effect of a certain harvesting
practice or the clearing of a forest patch, can be simulated and the impl ica
tions assessed. Without modelling it might take 50 years and longer to obtain
an answer.
SOUI'HERN CAPE FORESTS
The southern Cape forests, also known as .the Knysna forests (Phi 11 ips, 1931;
Acocks 1953), form the largest forest complex in southern Africa (Anonymous,
1987). Forest type ranges from high to scrub forest ( 3 m to > 20 m in
height). Both in composition and growth forms it resembles the Australian
rain forests (Phillips, 1931; Von Breitenbach, 1974; Webb, 1978). It has a
fragmented distribution on the seaward side of the coastal mountain ranges.
The forests are evergreen and exhibit features typical for tropical
oligotrophic ecosystems (Janzen, 1974; McKey et al., 1978), such as
sclerophylly, phenolic compounds in leaves, synchronised fruiting of trees at
intervals of more than one year, and dense root mats on and in the surface
soil layer (Van Daalen, 1984). ·

Univers
ity of
Cap
e Tow
n
4
Since its discovery by European settlers during the middle of the 18thcentury
it has been almost continuously and intensively utilised for timber (Phillips,
1963; Geldenhuys, 1982). Acocks (1953) suggested that much of the forested
area from the cape Peninsula to Port Elizabeth have been cleared since the
arrival of European settlers to the cape in 1652. The period of uncontrolled
exploitation was followed by various harvest control systems, which finally
resulted in the implementation of a single tree selection system in 1966
(Laughton 1937; Von Breitenbach, 1968; Geldenhuys, 1987). Since then the
forest management system, or parts of it, have been modified and improved
periodically (Geldenhuys, 1982; Seydack, 1982; Seydack et al., 1982; Van Dijk, .
1987; Seydack et al., 1990). At present the forests are divided into five
management classes. These are (percentage of forest area involved in
parentheses) timber production (19.7 %), protection (55.8 %), nature reserves
(23.0 %), recreation (0.4 %) and research (1.1 3) (Seydack et al., 1990).
High quality and much sought-after timber (Ocotea bullata (Burch.) E. Mey. is
one of the world's most expensive timbers) is produced and despite the limited
forest area used for timber production, it supports a well-known local furni
ture manufacturing industry.
The management pol icy for the southern cape forests aims at sustained multiple
resource ut i 1 isat ion, but subject to conservation constraints ( Seydack et al.,
1982). Silvicultural treatments to increase timber production per se are,
therefore, not allowed. Timber is seen as one of the many assets of the
forests and harvested in such a way as to simulate natural mortality as far
as possible and to minimise the impact of harvesting. Under these conditions
only the net timber volume growth can be realised. Thus the question arises:
"Exactly how much timber can we harvest?" Under-utilisation of timber
resources violates the principles of multipurpose management, which ensures
maximum overall benefit. over-utilisation, on the other hand, contradicts
conservation aims and negates the principles of sustenance.
STUDY APPROAClf
This study was aimed at providing the manager with a framework for determining
and selecting the trees to be harvested. Such a framework should be general
enough to be used under different management policies (for these can change

Univers
ity of
Cap
e Tow
n
5
overnight), but detailed enough to allow him to apply it to specific forest
compartments.. The research reported on here is, therefore, essentially
applied.
The mathematical model that was developed served as a focal point of this
study. In chapter 1 the model is described. During the model development
certain assumptions on the growth rates of tree species and on the succession
of the southern Cape forests were made. Logically, a study to validate or
reject these assumptions received priority. Chapter 2 is about a forest
growth case study on the same forest stand that was used for the mode 1
development. Chapter 3 discusses the effect of intra- and interspeci f ic
competition on timber growth. This study was conducted in a forest compart
ment adjoining the one used for the above-mentioned studies. The management
system for the southern Cape forests requires that individual trees are
selected for harvesting. Therefore, the management system is only as good as
the accuracy with which these trees can be identified and selected in the
forest. In the forest, frequently a suppressed tree cannot easily be
distinguished from a tree with high vigour. For this reason variables that
could serve as growth indicators were tested. These are discussed in chapter
4. Tree age should theoretically be one of the best growth indicators.
Typically a tree reaches its fas test growth rate after establishment, when it
reaches the crown, and before growth is retarded during the senility phase.
Furthermore, individual trees can vary greatly in their growth rates due to
factors such as competition, genetic variation, underlying soil and water
availability. Conventional free aging techniques. such as tree ring counting,
are very difficult or impossible to apply to most southern African hardwoods
(Van Daalen et al., 1992). Possible alternatives are discussed in chapter 5.
The techniques were tested on Pterocarpus angolensis DC., a savanna woodland
tree occurring in northern and eastern Transvaal, but results can be applied
equally to the southern Cape forest trees.

Univers
ity of
Cap
e Tow
n
6
t«>DELLJNG FOREST GROWili
Due to the variety of species composition, floristic structure, ecological ,
situations and silvicultural practices possible in mixed forests a whole range
of model 1 ing strategies are possible. Four groups of models wi 11 be discussed
briefly:
(1) Static yield functions.
Synnott (1980) cal ls this method "time-of-passage" calculations. This
includes
( i) the calculation of average annual increments for each species and size
class, and
(ii) the determination of growth of each tree through successive classes
using average growth rates to predict sizes for a future date.
The principle feature of static functions is that time is included in the
model as a total elapsed time from some reference point. This reference point
can, for example, be the last harvesting operation or the last inventory
(Alder, 1980).
As with other models site factors are included. In mixed forests environ
mental parameters form part of an effective model. In this way a type of site
index is obtained (Alder, 1980).
Various methods can be used to predict variables, e.g. principal components
analysis, multiple regression and others. However, a priori selection of
selector variables in a relatively simple equation is generally preferable.
This can be combined with a careful graphical analysis of residuals and
preferably some commonsense relationship between the form of the function and
the reality of the biological situation predicted (Alder, 1980).
Although these models are relatively straightforward to construct, three kinds
of problems can be experienced (Alder, 1980):
( i) Implicitly the historical sequence of events to which the data
set has been subjected, are part of the constructed model.

Univers
ity of
Cap
e Tow
n
7
(ii) There is a problem of compatibility. If the volume is predicted,
e.g. in three categories, viz. valuable, merchantable and useless
species, the total of these three volumes does not equal the
total volume, either from actual data or from a fourth function
fitted directly to the volume.
(iii) Where only light selection fellings are carried out (as in the
southern Cape forests) and the forest is a complex mixture of
niany species and ecological types, there may be no direct
relationship discernible over time between yield, basal area and
site class. In such cases growth prediction with a simple yield
model is not possible.
(2) Transition matrix models
Where forecasts with transition matrix models are done, Markov chain
transition probabilities are bften used (Lloyd, 1974). This includes the
following (Synnott, 1980):
(i) Calculate growth rates from each size class to the next larger.
(ii)
(iii)
Calculate the probability of any tree moving from one class to
the next in a given time.
Apply these probabilities to each tree for successive intervals
to predict size class distribution.
When a transit ion matrix is constructed from size class data only the
following must be assumed (Alder, 1980):
(i) All ingrowth occurs into the lowest size class.
(ii) Outgrowth from one class can only occur into the next higher
class.
(iii) The number of harvested stems in each class is known from an
independent source or deduced from the treatment prescription.
To make the transition model for mixed forests workable, firstly, species must
be grouped and separate matrices constructed for each .group. The number of
groups should not be too large, otherwise one may have too little data for
many transitions. Secondly, data should be grouped into basal area classes
for different forests to allow a different transition matrix to be used for
different stand densities (Alder, 1980).

Univers
ity of
Cap
e Tow
n
8
Markov models can display various features that are directly interpretable in
terms of succession. For example, an extension of a Markov model will even
tually lead to a stable state, analogous to the climax. Similarly, these
models can display continuous succession and sequences similar to Connell and
Slatyer's (1977) facilitation and tolerance pathways (Noble and Slatyer,
1981).
These models are suitable for fitting purposes (Lloyd, 1974) and can, there
fore, be used for limited predictions and for testing ideas, like Horn (1975)
has done. It is, however, only a fitting exercise. For prediction, transi
tion matrices have various disadvantages (Alder, 1980; Synnott, 1980):
(i) It requires little insight in the mechanisms of dynamic vegeta
tion changes and results are obtained exclusively by means of
extrapolation of the data used to construct the model. Rare
species often result in poor estimates of the transition probabi-
(ii)
(iii)
(iv)
. lities with resulting poor extrapolations.
It is difficult and tedious to represent dynamic interactions.
For each level of the controlling variable a separate. interaction
must be constructed.
The precision of a transition model is limited by the need to
work with broadly defined classes (e.g. size classes), otherwise
too many undefined transitions occur or the matrices become too
large for easy computation.
Transition models are insufficient in terms of the number of
parameters required to define a growth process. For example, a
9 x 9 matrix (81 parameters) might only correspond to a single
variable growth equation. , The addition of a second variable
could increase the matrix size fourfold (18 x 18 matrix).
(3) Distance-independent individual tree models
A distance-independent individual tree model is one in which each tree in a
stand is individually represented by a set of variables, e.g. tree species,
DBH (diameter at breast height), height and crown condition. Tree position
is not represented (Alder, 1980).
Mainly two types of models have been used:

Univers
ity of
Cap
e Tow
n
( i)
( ii)
9
Models that do not necessarily require recurrent measurements:
These are based on information of individual species characteris
tics such as maximum age, height, DBH, relationships of photosyn
thesis with 1 ight regime, climate and moisture, and data on
environmental factors such as the influence of seed- and
seedling-eaters, topography and climate. Examples of these
models are FORET for north-eastern USA (Botkin et al., 1972;
Shugart and West, 1977), FOREST (Ek and Monserud, 1979) and
KIAMBRAM (Shugart et Bl., 1980).
Models that require recurrent measurements of trees on permanent
sample plots: Here growth is correlated with size and other
measured variables for each tree, for each species or group of
species. A regression is derived from all the trees and is then
applied to each tree individually to predict its increment from
its size and status. Inevitably, the competitive status of each
tree changes with time and its growth is influenced by different
factors which cannot always be measured. A random element is,
therefore, included in the model to allow for apparently random
elements of growth such as the often poor correlation between
growth rate and size, and the lack of measurements of status.
This is a so-called stochastic model. Synnott's (1980) GROWI'H
model and the GROPE model of Alder et al. ( 1977) are examples of
this approach.
With these distance-independent models competition can be represented in the
form of stand density. The latter can be represented in a number of ways,
e.g. as an absolute measure such as number of trees over a certain size limit,
or as a relative measur.e such as basal area divided by the maximum basal area
possible on that site, or it can be measured as total leaf biomass on a given
area (Alder, 1980).
(4) Distance-dependent individual tree models
Although distance-independent models are generally much more economical in
terms of computer resources than distance-dependent models, they g~ve a less
realistic and detailed represent at ion of intertree competitive processes
(Alder, 1980). For the distance-dependent models the growing space or

Univers
ity of
Cap
e Tow
n
10
competitive status of each tree can be defined from the sizes and distances
from neighbours. This improves the value of stand projections and of the
analyses of the effects of treatments on growth rates and production. When
parameters such as tree heights and crown measurements are included increased
definition of competition can be obtained (Synnott, 1977).
The deterministic distance-independent modelling approach was followed for
this study because it allowed the use of an·alreadyderived growth equation,
and it does not require the long term empirical growth data necessary for the
stochastic model or the heavy database required for the distance-dependent
modelling approach. Consequently it could be developed in much shortertime
than would be needed for the other approaches.
FOREST GROWI11 AND SUCCESSION
For the.model developed in this study (called OUTENIQUA) many of the values
. of the underlying parameters of forest growth were assumed or estimated. For
instance, does the central general growth function of the model reflect the
growth rate of southern Cape forests accurately? Does succession happen as
was assumed by this reductionistic model? Are the assumed phenological
patterns correct? These were the type of questions asked after the model
developing phase. Some of them are addressed in this study, others initiated
other studies.
During 1972 the DBH's of a large number of trees in a compartment in the
forest north of Knysna were measured, the points of measurement marked
accurately and each tree was numbered with a unique number. over the next 15
years all trees were remeasured twice, providing a growth data base of more
than 26 000 trees. These data were used for a study on the growth, mortality
and recruitment rates of southern cape forest trees.
COMPETITION AK>NCJ TREES
Odum (1971) described two broad types of ecosystem interaction, positive and
negative. Positive interactions include mutual ism (interaction favourable for

Univers
ity of
Cap
e Tow
n
11
both popu 1 ations and· obligatory), protocooperat ion (interact ion favourable for
both but not obligatory) and commensalism (population one, the commcnsal,
benefits while two, the host, is not affected). Negative interact ions include
parasitism, predation, amensalism (one population inhibited and the other one
not affected) and competition. In the broadest sense competition refers to
the interaction of two organisms striving for the same thing. This could
manifest I firstly' as COmpet it ion for reSOUrCeS SUCh as nutrients l water I
space and sun 1 ight (interference competition) (the use of the term competition
is sometimes restricted to this meaning (Whittaker, 1975)) and, secondly, as
the consumption or elimination of a resource item by one individual, making
it unavailable for others (exploitation competition) (Miles, 1979; Murray,
1986; Rice, 1974).
With regard to inter- and intraspecific competition in the forest Botkin
( 1981) assumed that trees compete primarily for 1 ight, al though some species
grow much better in bright light than others, and the ones that grow well in
bright 1 ight grow poorly in dim light. This distinct ion between shade
tolerant and shade-intolerant species was the primary mover in the interaction
among species in the ear 1 ier versions of his JAPIJWA succession model. In a
later version he added competition for soil nitrogen.
The purpose of the competition study reported in chapter 3 was to investigate
the role of both inter- and intraspecific cornpet it ion between trees in a
mature southern Cape forest stand.
GROWilI INDICATORS
If size is not an indicator of the age and vigour of a tree, other criteria
should be used, if available and practical. In the southern Cape senility
indices, such as stern rotting, dying, damage and "agony" shoots (i.e shoots
growing out of the main bole when the tree is under stress) are used to select
trees for harvesting (Seydack et al., 1990; Kobrie Vermeulen, personal
communication, 1992). In this way an attempt is made to harvest as many as
possible of the trees that will die in the period to the next harvest, i.e.
mortality is as far possible pre-empted.
Univers
ity of
Cap
e Tow
n
12
Apart from the senility indices, the position of the tree's crown in relation
to the overal 1 forest canopy and in rel at ion to its neighbours' crowns
(Synnott, 1979), the form of the crown (Dawkins, 1963 ex Synnott, 1979), crown
size (Oliver and Larson, 1990) and the cambial electrical resistance (Davis
et al., 1981) have been used as indications of growth rates and vigour. Of
these, crown size is the only parameter which is too difficult to determine
in the forest to be of practical use (chapter 4). Crowns intermingle to such
an extent that the distinction of a specific crown is difficult, let alone
measuring its dimensions.
DATI~ OF TREES
Theoretically tree age remains one of the more re I iable methods for predicting
growth rates. In southern African hardwoods, however, it is often impossible
to determine this in the conventional way, i.e. with tree ring counting.
Lilly ( 1977) rated a large number of indigenous trees according to their
dendrochronological potential. Only a few species, such as .the Podocarpus
species; obtained high ratings.
Four dating methods were compared, viz. visual growth ring counting, C14
dating, counting of rings on X-ray photographs taken from the transverse
surfaces of samples cut from tree boles, and counting rings by using radiation
densitometry (chapter 5). The study was done on a savanna timber tree,
Pterocarpus angolensis. Samples from three southern Cape forest trees of
knoWn age were sent for C14 dating. This method provided accurate results.
Therefore, the ages of the Pterocarpus trees determined in this way were
accepted as correct. Results from the other dating techniques were compared
with the C14 dating results.

Univers
ity of
Cap
e Tow
n
SECTION 2
RESEARCH FINDINGS

Univers
ity of
Cap
e Tow
n
CHAPTER 1
:K>DELLING FOREST SUCCESSION
Univers
ity of
Cap
e Tow
n
15
landscape Ecology vol. 2 no. 4 pp 255-26 7 ( 1989) SPB Academic Publi~hing h'. The Hague
OUTENIQUA - A computer model to simulate succession in the mixed evergreen fores ts of the southern Cape, South Africa·
J.C. van Daalen 1 and H.H. Shugart2
I South African Forestry Research Institute, Saasveld Forestry Research Centre, Private Ba~ X6515, 6530 George, South Africa; 2Department of Environmental Sciences, University of Virginia, Charlottesville, VA 22903, U.S.A.
Keywords: South Africa, mixed evergreen forests, succession, simulation model, landscape ecology
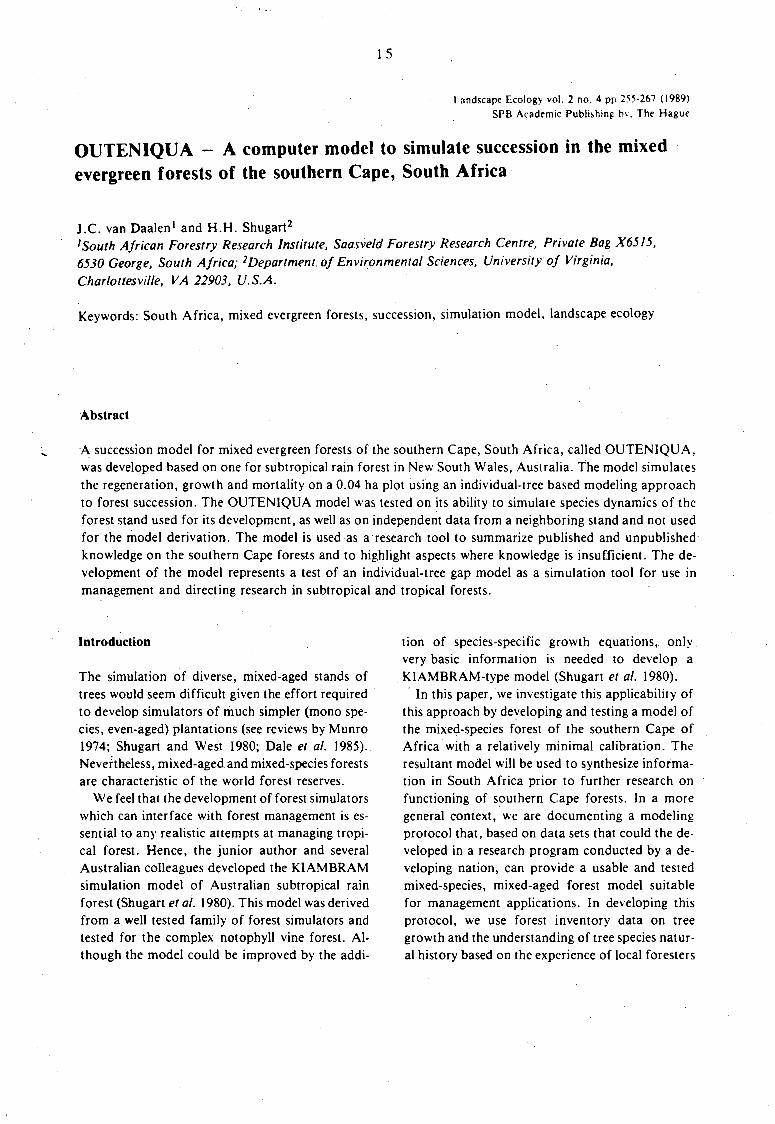
Abstract
A succession model for mixed evergreen forests of the southern Cape, South Africa, called OUTENIQUA, was developed based on one for subtropical rain forest in New South Wales, Australia. The model simulates the regeneration, growth and mortality on a 0.04 ha plot using an individual-tree based modeling approach to forest succession. The OUTENIQUA model was tested on its ability to simulate species dynamics of the forest stand used for its development, as well as on independent data from a neighboring stand and not used for the model derivation. The model is used as a research tool to summarize published and unpublished knowledge on the southern Cape forests and to highlight aspects where knowledge is insufficient. The development of the model represents a test of an individual-tree gap model as a simulation tool for use in management and directing research in subtropical and tropical forests.
Introduction
The simulation of diverse, mixed-aged stands of trees would seem difficult given the effort required to develop simulators of much simpler (mono species, even-aged) plantations (see reviews by Munro 1974; Shugart and West 1980; Dale et al. 1985). Nevertheless, mixed-aged and mixed-species forests are characteristic of the world forest reserves.
We feel that the development of forest simulators which can interface with forest management is essential to any realistic attempts at managing tropical forest. Hence, the junior author and several Australian colleagues developed the KIAMBRAM simulation model of Australian subtropical rain forest (Shugart et al. 1980). This model was derived from a well tested family of forest simulators and tested for the complex notophyll vine forest. Although the model could be improved by the addi-
tion of species-specific growth equations, only. very basic information is needed to develop a KIAMBRAM-type model (Shugart et al. 1980). · In this paper, we investigate this applicability of
this approach by developing and testing a model of the mixed-species forest of the southern Cape of Africa with a relatively minimal calibration. The resultant model will be used to synthesize information in South Africa prior to further research on functioning of southern Cape forests. In a more general context, we are documenting a modeling protocol that, based on data sets that could the developed in a research program conducted by a developing nation, can provide a usable and tested mixed-species, mixed-aged forest model suitable for management applications. In developing this protocol, we use forest inventory data on tree growth and the understanding of tree species natural history based on the experience of local foresters

Univers
ity of
Cap
e Tow
n
256
I N
.,., l!.' \ ..
INDIAN OCEAN
16
Location of study area and distribution of forests (bla·
STUDY "RI"
\ M
Sc• .. : 0
Fig. I. Location of the study site. a. Location of the study area on the African continent. b. Location of the study are·a on the southern
Cape. Dark areas are forested. c. Map of the study area showing trails and the Olifants River. Survey sites north of the Olifants River
are used for model verification; those south of the river are used for model validtion.
to implement a modified version of the KIAMBRAM model. We then test the reliability of the resultant model against independent data.
Th,e forest of the southern Cape
The southern Cape forests occur as an archipelago in a narrow belt 16 to 32 km wide between the Indian Ocean on the south and the Outeniqua Moun-
tains on the north (Fig. l ). The geological formations affect the type of forest growing on it, but do not affect the distribution of forests. Soils are nutritionally poor, with phosphate being very deficient (Van Daalen 1984). Distinguishing features of the forest species are evergreenness, a high occurrence of sclerophylly, high levels of phenolics and other secondar:- compounds, fruiting intervals of more than one year and dense root mats on and in the surface soil layer (Van Daalen 1984).

Univers
ity of
Cap
e Tow
n
Based on species compos1llon, the forests are
subdidived into three major types: I. The wet mountain forests are typically Afro
montane forests (White 1978). Canopy height
ranges from 12 to 30 m. Cunonia capensis and Ocotea bullata form the main canopy. The tree fern
Cyathea capensis is characteristic.
2. The forests of the coastal escarpment or the steep slopes of river valleys are generally scrub or dry forest with high species richness, including
many Tongaland-Pongoland forest (i.e., the north
eastern forests of South Africa) species (Moll and White 1978). Canopy height varies between 9 and
18 m. Most of the species of the coastal platform forest also occur in these forests.
1 7
3. The coastal platform forest, for which this
computer model was developed, include mostly Afromontane and transgressor species, the latter occurring with abundance in both the Afromontane
and the Tongaland-Pondoland forests. Canopy height varies between 16 and 30 m. The main cano
py species are Olea capensis, subsp. macrocarpa, Podocarpus latifolis, P. falcatus, Pterocelastrus tricuspidatus, Apodytes dimidiate, Curtisia dent ata, Rapanea melanophloeos, Canthium obovatum, Nuxia f/oribunda and Olinia venlosa (Geldenhuys
1987). Due to their basically tropical features (Phillips
1931; Webb 1959; Dawson 1962; Donald and Theron 1983), their floristic richness (119 tree and
woody shrub species, Geldenhuys 1979), multistoried structure, and similarity to forests used to develop the Australian model (Shugart et al. 1980), the southern Cape forests represent a logical extension as a subject for testing the general utility of the existing KIAMBRAM model for subtropical rain forests in Australia.
The model
The KIAMBRAM model developed by Shugart et al. ( 1980) for the subtropical rain forest at Wiangaree State Forest, New South Wales, was chosen as the basis for the present model, which we will call the OUTENIQUA model. Outeniqua refers to the mountain range that forms the northern boundary
257
of the narrow belt of indigenous forests in the
southern Cape. These mountains cause the oro
graphic rain and mist that enable the forests to grow
and survive. The model is implemented as FOR
TRAN V code that has been modified where appropriate to run on a 16 bit Data General minicomputer with 64 K byte memory available to each user.
OUTENIQUA retains the stochastic features of
the KIAMBRAM succession model. Essentially, it
simulates the birth, diameter growth and death of
each tree in a forest gap created by the death of a
large tree or by clearing. This gap is assumed to be
within an intact forest. All species are assumed to
have an adequate seed source. The model simulates
the tree populations on a 0.04 ha plot, the standard plot size used in the southern Cape for forest surveys (Geldenhuys 1982) and within a recommended plot size (Mueller-Dombois and Ellenberg 1974). In
the present model, the LUMBER subroutine of KIAMBRAM has been excluded. Similarly, provisions for strangler figs (Ficus sp.) from the KIAM
BRAM model are omitted since this life form does not occur in the southern Cape.
Model parameters were obtained from tree
growth studies on a 45 ha forest compartment (Fig. I), a study of Geldenhuys (1975) on Podocarpus falcatus, and unpublished information and experience of local researchers. Estimated values must eventually be verified, but the best estimates
of experienced forest researchers was essential to make the model a useful synthesis of knowledge of these forests, much of which is unpublished. Model parameters derived from expert opinion deal with the silvicultural attributes of the species and are be identified explicitly below.
The growth function used (Botkin et al. 1972; Shugart and West 1977; Shugart el al. 1980) reflects the currently debated reductionists view of succession (Finigan 1982; Innis 1976; Levins and Lewontin 1982). The OUTENIQUA model and related models are useful for testing the different hypotheses about tree growth and succession. For management purposes, the model should be useful for examining the long-term effects of human activities on stand development (Dale and Hemstrom 1984).
The OUTENIQUA model includes the 28 tree species encountered on the study area (Table I).

Univers
ity of
Cap
e Tow
n
18
258
Tobie /. Specie~ list and spccie~ specific parameter~ used in thc OUTENIQUA model.
Podocorpus folcotus
(Thunb ) R.Br ex Mirb.
Podocorpus lotifolius
(Thunb.) R.Br ex Mirb.
Ocotoo bulloto (Burch.)
E.Mey.
Plotylophw 1rdol101us
(L.f.) D.Don
Lochnosn·/i.< h1na (L.f.)
Muell. Arg.
/lex mi1is CL.) Radlk.
Moy1enus peduncularis
(Sond.) Loes.
Pteroceloslrus 1ricuspido1es
(Lam.) Sond.
Cossine eucl(formis (Eckl.
& Zeyh.) Kunze
Cossine peraquo L.
. Cassine ptipillosa (Hechst.)
Kuntze
Apody1es dimidiota E.
Mey. ex Arn
Rhamnus prinoides L'Herit
Ochna arborea Burch ex
DC
Kiggelaria africano L.
Curtisia den1a1a (Burm.f.)
C.A. Sm
Rapaneo melanophloes (L.)
Mez
Diospyros dichrophylla
(Sand.) De Wint.
Diospyros .,·hyteana (Hiern)
F. White
Chionanthus fo,·eolatus
(E. Mey.) Stearn
Olea capensis subs p.
L. macrocarpa
(C.N. Wr.) \'erd
Olea capensis subsp.
L. capensis
Nuxia floribunda Benth.
Conioma komassi E. Mey.
Halleria lucido L.
Burchellia bubolina (L.F.)
Sim;
Canihium mundianum
Cham & Schlech1d.
Canihium obol'Olum
Klotzsch
82 83 AGE (MX) HMAX G TOL Pl P2 FELL SPRT DEC SEED
29 .09 .048 1463
44.84 . 149 437
67.26 .336 289
71.5 7 .447 252
!05 .02 I. I 67 295
56.05 .234 . 403
71.57 .447 40 I
81.80 .584 243
94.52 .945 244
94.52 .945 349
72. 71 .559 264
84.07 .525 395
136.30 3.407 139
60.58 .673 619
95 .43 . 795 297
96.09 .686 250
96.09 .686 299
93.15 1.164 201
82.80 .920 223
105.02 1.167 296
56.05 .234 186
72. 71 .559 340
71.57 .447 161
82.80 .920 271
85.93 .781 46'
109.04 2.181 425
93.15 1.164 207
84.07 .525 335
4500
3500
3500
3000
2'500
3500
3000
3000
2500 2500
2500
3500
1500
1500
3000
3500
3500
2000
2000
2500
3500
2500
3000
2000
2500
1500
2000
3500
27 2
70
106
!04 2
74
76 2
65 2
108 2
89
63 2
84
77 2 94 3
22
88
121 2
101
88
80
73 2
165
65
163
6:' 2
47
31 2
85 3
91 2
2 4 2
2 2
2 2
2 2
2 1 2 2 2 2
2 2
2 2
4
2 2
2
2 3 3
2 3 2
2 4 .
2 3
2 4 2
2 4 2
2 4
2 4
1 4 2
2 1 2
1 2 2
2 2 2
2
2
2
2
2
2
2
2
2
2
3
2
2
2
2
2
2
2
1
2
3
2
3
2
2
2
2
2
2
2
Switches
123456
TFTFTF
TFTFTF
TFTFFF
FTFFFT
FTFFTF
TFTTFF
TFTFFF
TFTFFF
TFTFFF
Tl-TT FF
TFTTFF
TFTTFF
TFTTTF
TFTFFF
TFTTTF
TFTTFF
TFTTFF
TFTTTF
TFTTTF
TFTTFF
T F T T
TFTTFF
FTFFFF
FTFFFF
TFTTFF
TFTTFF
TFTTFF
TFTTFF

Univers
ity of
Cap
e Tow
n
MAIN PROGRAM
INPUT
PLO TIN
I t~IT .. I RN~OM -i ---~ ; CHABLI ;,
! KltL:
lsPR9uT :.___ \
i ;·~RR I :
rr.ab ,71 I I/ Cif§Ej, _J_ ! 'BIRTH'.
I
/OUTPUT!
.----1-.___ <:fisT YEAR·~-_,_--~ -
NO
- controls model
- re1ds control card• and S(>eCieS parameters
- reads in plot cond1t1ona wt.er; 1imllfat1ng a plot that was vegetated m year zero
- open data Illes hrs! time •PLOTIN. 11 called
- remit1hze arrays when rephc1ting a sunulat1ng plo1 that wu vegetaled in yeilr zero
- pseudo-random n~r generator
- allows tree tall 10 kill tree5
- ehmmales trees as a furichon of diameter and growth rate
- allows resprouters lo sorout
- mdicetes an erro~ when there Sre more than 400 trees oer plot
- grows trees as a function of Hee $lZe, leaf area and crowding from other trees
- introduces new tree5 with a DBH of 1.0 cm
- outputs desired mlonnation
19
Fig. 2. Flow diagram for calls to subroutines in the OUTENl
QUA model.
B2 and B3 are form factors derived from AGE
(MX) (in years) and Hmax (in meters) and used to calculate the height of trees (Shugart et al. 1980. AGE(MX) is the age that a tree under optimal conditions should attain the maximum height. G is a growth form parameter calculated from the maximum known annual increment for the species. TOL is shade-tolerance (I = shade-tolerant; 2 = intermediate; 3 = shade-intolerant). PI is the seed phenology (I = regular; 2 = irregular). P2 is the seed longevity (I for > 6 weeks but < 3 months; 3 for > 3 months but < I year; 4 for > I year). FELL is the species' resprouting ability when felled, and SPRT its resprouting ability when the tree has fallen over (I = strong resprouter; 2 = intermediate; 3 = does not resprout). DEC indicates deciduousness (I = evergreen; 2 = semi-deciduous, 3 = deciduous). SEED is the amount of viable seed
259
produced (I = small amounts; 2 = medium
amounts; 3 = large amounts). SWITCHES I to 6
are categories of dispersal and germination site re
quirements of each species. A simplified flow diagram is given in Fig. 2. Annu
al model projections can start from a bare or vege
tated plot. Normally a vegetated plot would be the
starting point since completely devegetated gaps of
size 0,04 ha seldom occur in the southern Cape
forests. For each year of simulation trees can die, regeneration and stump resprouting can occur, and trees can grow.
Oldeman (1978) refers to 'fall of a tree, its impact on the forest, the fallen tree itself, and the resulting
destruction all together' as a 'chablis' or a negative sylvigenesis (Oldeman 1978). Two parts of chablis are simulated:
I. The crown gap that consists of the area that is directly under a fallen canopy tree. This area has
relatively little physical destruction, but has an increased ambient light level due to the removal of the fallen tree's crown.
2. The site at which the crown of the tree falls. At this site, there may be a larger number of trees killed, the mineral soil may be exposed, and the fallen branches may provide shade and protection for regeneration against browsing by bushbuck.
The first part of the chablis is simulated by act ually computing light levels as a function of leaf
area. Thus when a canopy tree dies, the forest floor light level is increased. The second part of the chablis is simulated by a stochastic decision with a probability of 0.006 (as opposed to 0.003 for the Australian forests where tree fall gaps are common) whether or not a canopy crown from an adjacent plot has fallen onto the simulated plot during a given year. In a year in which there is such a crown fall, each tree on the plot has an increased probability of mortality as might be associated with the impact of the fall. In computing the effects of the chablis, the direction of fall is not taken into account. This feature might be important in plots on steep slopes. However, no quantitative data on this
effect is available at this time. In the current version of the OUTENIQUA
model, only trees are included. However, ·an understory shrub, Trichoc/adus crinirus, locally called

Univers
ity of
Cap
e Tow
n
260
'onderbos' is abundant in the southern Cape forests. These onderbos stems probably compete directly with tree regeneration. To simulate this competition 2.750Jo of all stems below 5 cm are eliminated each year before trees are subjected to
other sources of mortality. The probability of mortality of each individual
tree is determined as a stochastic function. Each tree is assumed to have an intrinsic mortality rate such that, under normal conditions, I OJo of the individuals in a cohort could be expected to live long enough (AGEMX, Table I) to attain their maxi
mum height and diameter (Hmax and Dmax• respectively; Table l ). Thus the probability of ,mortality
1s:
Pm = l - exp ( - 4.605/ AGEMX),
where Pm is the intrinsic probability of mortality, and AGEMX is the age at which one would expect 111/o of a cohort to be alive and, by assumption, the age at which one might expect an individual to reach its maximum size.
The growth rates of the southern Cape forest trees are relatively slow (the greatest diameter increment measured on the study site was 2.26 mm/yr). Therefore, trees with a minimum diameter increment of only 0.25 mm/yr (compared to l mm for KIAMBRAM) are subjected to additional mortality,
PS = 0.368,
where P5
is the probability of survival of a suppressed (due to shade or other factors) individual. This has the effect of allowing only l OJo of a suppressed cohort to survive 10 years.
In the event of a chablis, each tree is subjected to a probability of mortality. Each tree is then checked for its resprouting ability (Table l). When it belongs to a strong resprouting species, the tree is eliminated, but the resprout is tallied. When it belongs to an intermediate resprouter, only half the resprouts are tallied. In the case of a non-sprouting species, the tree is simply eliminated.
OUTENIQUA simulates the resprouting of trees. Sprouts grow on stumps with established root systems and tend to grow faster than seedlings, at least initially. Therefore, they eIBer the plot with an
20
average DBH of 2.0 cm, as compared with 1.0 cm for seedlings. Computationally, this gives them a competitive advantage over seedlings. Sprouts are planted with a DBH of 2 cm plu or minus a small error term designed to give the sprout a unique size.
The central assumption in formulating the dia
meter increment equation is that growth in trees is the consequence of two opposite processes. The
positive part of rate of volume accumulation is as
sumed under optimal conditions to increase as a positive linear function of the leaf area of the tree
(presumably the realization of the net photosynthesis rate). There is a counter-balancing negative rate that is associated with respiration and other energy
losses. This latter term is proportional to the volume of living tissue. As a tree increases in size, the respiration costs increase, and the rate of growth of the tree slows and stops.
The following equation is solved for each tree for each year of the simulation using annual calculation steps:
dD G.D(l - D.H/Dmax Hmax> • S(BAR) · r(AL)
dt (274 + 3b2D - 4b3D2)
where:
D
H
S(BAR)
r(AL)
G
=
=
diameter of tree (Dmax = maximum possible diameter)
height of tree (Hmax = maximum pos-sible height) ·
stand basal area affecting nutrient competition reduction of photosynthetic rate due to shading growth parameter derived from maximum known increment for species (Table 1).
For a derivation of this general growth equation, see Botkin et al. 1972 and Shugart 1984.
All species are assumed to have an adequate seed source. The success of these seeds establishing on the plot is modified as follows:
1. Seed phenology: Some tree species produce seed regularly; others do not. Species with irregular seed set are allowed to have a seed source every 2.5 years.

Univers
ity of
Cap
e Tow
n
2. Seed longevity: Each species' seed is classified according to its longevity (Table I), which is used to compute the proportion of time a mature tree might provide seed to a site. Ignoring seed predation, the longevity of seeds with similar phenology should be an index of the probability of a species having a viable supply of seeds when conditions
favor germination.
21
3. Amount of viable seed produced: The number of seeds produced is classified as: small, medium and large (Table I). In the case of small amounts, the number of saplings eligible for establishing on a plot is hal\'ed, whereas a large numbers of seed doubles the number of eligible saplings.
When a species is eligible to germinate at a site,· its dispersal mechanisms and germination site requirements are (Table 1) used to check whether a species' establishment requirements are met at the site during particular year.
When the species is bird- or bat-dispersed, the probability of seeds establishing on a plot is increased by 500Jo. Birds tend to use specific perches, concentrating seed in their dr'oppings. In the case of wind-dispersed species, both the phenology and longevity restrictions are lifted. Wind-dispersed species are assumed to be able to establish on any plot whenever the seed is produced in the forest. Gravity dispersed species drop all their seed below the parent. Therefore, the establishment probability is doubled. Mammals that distribute seed sometimes have a slight tendency to concentrate seed. Therefore, the probability of seed establishment is increased 200Jo for mammal-dispersed species. When the species is dioecious, establishment probability is halved. Dioecious trees on average need two trees to produce seed. Those speCies requiring mineral soil for germination can only establish after a chablis, when the simulation starts with a bare plot, or when the total leaf area is Jess than 1.0 m11m2.
After 'filtering' (sensu Harper 1977) the species regeneration requirements against the site conditions and computing the outcome of the probabilistic factos mentioned above, species selected to be planted in a given model year are determined. A species is selected at random from this list of possible species and between I and IO individuals are
261
planted under normal forest conditions (between I and 46 when the total leaf area is Jess than 1.0
m 2 /m 1). This process is repeated between I and 32 times per year (according to a selected uniform random number). All saplings have a DBH of at least 1.0 cm when planted. These stochastic levels of regeneration were found to approximate the pat
terns of regeneration noted in the southern Cape
forests. The model simulates seedling establishment as a
stochastic process (or set of processes) with mild de
terministic constraints on the total spectrum of possibilities that might occur in any year's regeneration at any given site. This reflects the concept of Webb
et al. (1972) that rain forest regeneration of this spatial scale consists of a series of patches composed of species which occur probabilistically. According to Webb et al. (1972), the species composition of plots
such as those simulated by the OUTENIQUA model should vary in space and time, and if the trees on such a plot are destroyed or become overmature, they would probably be replaced by a new mixture of species out of many possible configurations. Others have also noted this stochastic pattern in species composition which is a recurrent theme in discussions of rain forest regeneration beginning with the classic papers of Aubreville (1933, 1938).
Model parameter estimation
The parameter estimation procedures used in this implementation of the OUTENJQUA model pro~ide insight as to how useful the gap modeling.approach might be in applications to forests in which the species silvics are reasonably well known (even if this knowledge is not codified into publications) and in which there is some information on the growth rates. This is a minimal set of information that would be necessary to develop any individualtree-based, forest-growth simulator. Parameters in the OUTEN I QUA model are either species specific parameters (e.g., growth rates, life history attributes) or system level parameters (e.g., rate of light extinction through the canopy). System level parameters in the OUTENQUA model are unchanged from the KIAMBRAM model (Shugart
! r
'I I
1!
..
Univers
ity of
Cap
e Tow
n
262
et al. 19~0) or indicated in the section above. With the exception of the 'G' parameter~. species level
parameters (Table I) were estimated from a study of Gcldenhuys ( 1975) on· Podocarpus falcatus, and unpublished information and experience of local
researchers and the senior author. These parameters were all estimated a priori to the develop
ment and implementation of the OUTENIQUA model. The parameters encode the major silvicultural features of the species and are essentially free of modification (e.g., if a species is bat-dispersed, it is inappropriate to declare it otherwise; the maxi
mum diameter of a species does not take on arbitrary values.).
The 'G' parameter for the growth equation is directly related to the maximum increment of a species (see Botkin et al. (1972) for the derivation of
this relationship). We estimated the 'G' parameter for all species (Table I) by determining the magnitude of the 95th percentile of increments recorded for trees of each species from the study plot north of the Olifants River (fig. I). This· automated the
parameter estimation procedure and hopefully eliminated possible bias from arbitrary parameter fitting. The 95th percentile was used to protect the parameter estimation. procec:lure from statistical outliers in the remeasurement data set.
Model testing
It is desirable to conduct model tests under conditions in which the parameters are estimated a priori and in which the parameters in the model are realis-. tic (Shugart 1984). Both the model structure and the emphasis on species natural history in gap models make it appropriate to have a high level of realism in the model parameters. Mankin et al. (1977) and Shugart (1984) divide model testing into verification and validation, and see model application as a measure of a model's usefulness. The model verified on its consistancy with some set of observac
tions. The OUTENIQUA model is verified by its ability to capture the broad compositional patterns of the subject forest and to reproduce the observed changes in DBH distributions (both for the entire forest and for the populations of tree species
22
100
90 ,, 80
w 70 > j: 60 < ..J 50 :::> :Ji 40 :::> u 30
20
10
0
100
90
,, 80
w 70 > j: 80 < 50 ..J :::> :Ji 40 :::> u 30
20
10
0
(a)
0 10
(b)
I
0 10
CUMULATIVE DBH DISTRIBUTION
I I
I
20 30 40 50 60 70 80
DBH CLASSES
I
I I
I I
~- MEASURED DATA ----SIMULATED DATA
20 30 40 50 60
DBH CLASSES
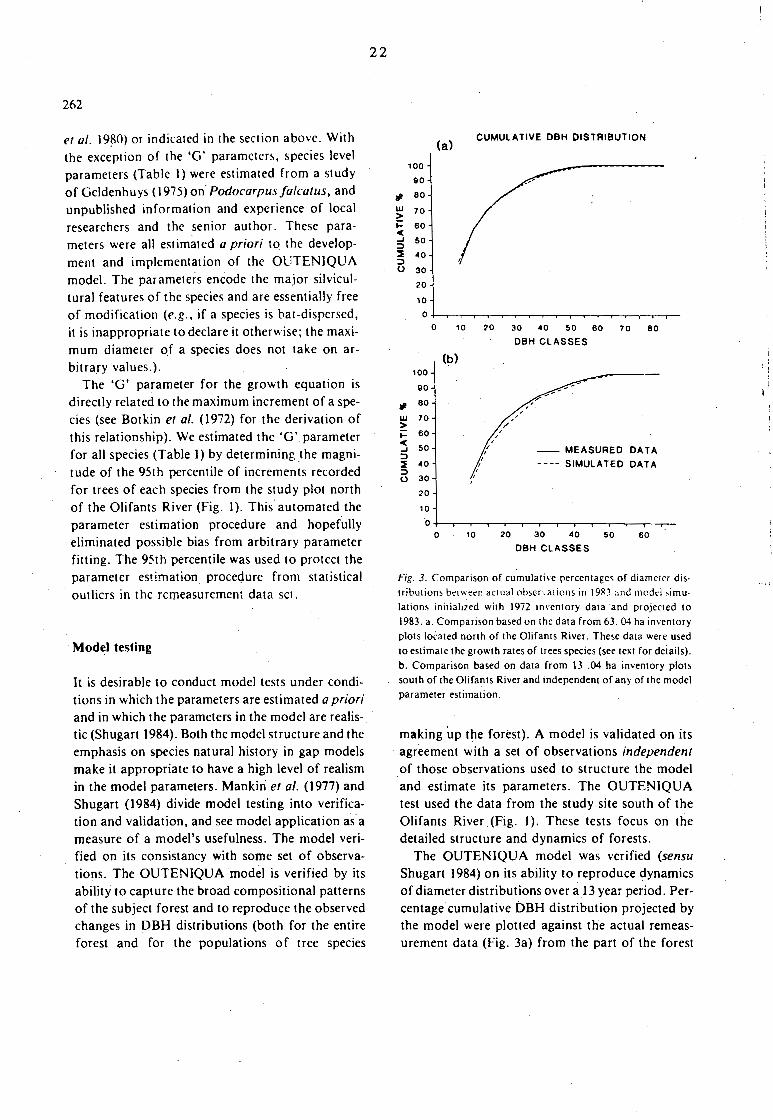
Fig. 3. Comparison of cumulative percentage' of diamc:cr dis·
tributiom between actual ohser·.ations in 19R:1 ~nd modd ,imu
lation' initialized with 1972 inventory data and projected to
1983. a. Comparison based on the data from 63. 04 ha inventory
plots located north of the Olifants River. These data were used
to estimate the growth rates of trees species (see text for deiails).
b. Comparison based on data from 13 .04 ha inventory plots
south of the Olifants River and independent of any of the model
parameter estimation.
making up the forest). A model is validated on its agreement with a set of observations independent of those observations used to structure the model and estimate its parameters. The OUTENIQUA test used the data from the study site south of the Olifants River (Fig. I). These tests focus on the detailed structure and dynamics of forests.
The OUTENIQUA model was verified (sensu Shugart 1984) on its ability to reproduce dynamics of diameter distributions over a I 3 year period. Percentage cumulative DBH distribution projected by the model were plotted· against the actual remeasurement data (Fig. 3a) from the part of the forest
I
I:

Univers
ity of
Cap
e Tow
n
a: w m :I ~ z
10
eo-
&O-
40-
30-
20-
10-
(a) OLEA CAPENSIS SUBSP MACROCARPA
I " ~~ 0-+--.............. ~~_,. ........ !"'f'"l"-...-,-,~•~f~~.~·--.--,~
10
60
50
a: w 40 m ~ 30 z
0 10 20 30 40 50 60 10 60 110 100
DBH CLASSES
(c) PODOCARPUS LAT/FOL/US
0 10 20 30 40 50 60 70 80 90 100
DBH CLASSES
23
10
80
50
a:: w 40 m ~ 30 z
20
10
70
60
50
a: w 40 m ~ 30 z
20
(b) CANTHIUM MUNDIANUM
o .10 20 30 40 50 eo 10 80 90 100
DBH CLASSES
(d) CASS/NE PAPILLOSA
o SIMULATED DATA a MEASURED DATA
0 10 20 30 40 50 60 10 80 90 100
DBH CLASSES
26~
Fig. 4. Comparisom between number> of ~terns in 5 cm diameter inten·al' mca;ured on 63 0.04 ha in,·entory plot> (in 1983) from th(' pan of the study area north of the Olifant> River and the results obtained by initializing the model with data from ·1972 and projecting
the stand dynamic' forward for 11 year>. a. Olea capensis sub>p. macrornrpa. b. Can1hium mundianum. c. Podocarpus /a1((0/i11.1. d.
Cassine papillosa.
north of the Olifants River (Fig. I) (i.e., the stand used for the model development). This comparison (Fig. 3a) is based on the mean of 63 simulated plots, initialized with the plot data collected at the time of first detailed measurement ( 1972) and compared with the last remeasurement 11 years later (1983). As is indicated in Fig. 3; a high level of agreement between the actual forest and the simulation results was obtained. The model was not 'fitted' to match the diameter distribution (Fig. 3). The nature of the dependency between the model and data was in the use of the data to obtain the 95% confidence limit on diameter increment.
Species-level and more detailed model verifications involved using the model to develop histograms of the frequency of trees per DBH class, totaled over all 63 plots for each species. This latter
procedure is more sensitive to differences between the remeasurement data and the values simulated by the model. For example, larger diameter classes oi Olea capensis subsp. macrocarpa, the most abundant tree of the southern Cape forests are underestimated (Fig. 4a). Canthium mundianum, a reasonably rare species on the study area is closely simulated (Fig. 4b). The larger diameter classes of Podocarpus latifolius (Fig. 4c) are slightly underes
timated, while those of Cassine papi/losa (Fig. 4d) are slightly overestimated.
A similar graph (Fig. 3b) and similar histograms were developed for the 13 plots south of the Olifants River for the validation (sensu Shugart 1984) of the model. Although a slight underestimate in the percentage cumultive DBH .curve (Fig. 3b) is apparent, the simulation appears satis-

Univers
ity of
Cap
e Tow
n
264
... a: .. w m ::E " :::> •• z
, ..
a: •• w .. m ::E :::> •• z
' J
I
( c)
OLEA CAPENSIS SUBSP MACROCARPA
DBH CLASSES
PODOCARPUS LAT/FOL/US
. ~ 1 l Oi-n~.rDQJ.rrtJ~rn ...... : ................ .
DBH CLASSES
24
a: w m ·• ::E " :::> z
a: ., w •• m ::E :::> " z "
. ..
I <bl 1 PTEROCELASTRUS J TRICUSPIDA TUS J
~ j
J
J I
j .......,..,~ ru~~i-<'!+. ~ dJ~. rfJ+.-<. ·~ ..J..:_.J· ~~- ------
J ( d)
J j J J J
DB H cl A s·s Es
CURTIS/A DENTATA
D Sl .. ULATED DATA
j 0 "EA SURED DATA
j
~ ! . m rn rn Ff1 "' =p [l p
DBH CLASSES
Fig. 5. Compari~ons between numbers of stems in 5 cm diameter intervals measured on 63 0.04 ha inventory plots (in 1983) from the
part of the study area south of the Olifants River and the results obtained by initializing the model with data from 1972 and project in~ the stand dynamics forward for I I years. a. Olea capensis subsp. macrocarpa. b. Pterocelastrus tricuspidatus. c. Podocarpus latifoliu.1.
d. Curtisia dentata.
factory. Explanations of the slight deterioration of the model's ability to duplicate these independent diameter frequency distri~utions include the change in sample size (allowing for more variability) and slight differences in soils and topography between plots· used to calibrate a_nd validate the model. Nevertheless, the agreement between the two curves (Fig. 3b) is within the range of variation one would expect in replicate samples of the same forest. Similarly, histograms of individual species diameter distributions are within the range of variation shown in the verification case (Figs 4 and 5).
The forests have been logged prior to 1955, which might have affected the diameter distributions of some species. Data are being collected in a virgin forest in the southern Cape, to eventually test the
degree to which management has affected diameter distributions.
Tjle aqvantage of using comparisons between subsequent cumulative diameter curves such as Fig. 3 is that birth, growth and death rates are tested simultaneously across all species. The modeled curves can differ from the observed due to several causes. If the model simulates too little regeneration, the initial size classes will be too low. If there is too much regeneration, they will be too high. Errors in simulated tree growth rates can distort the rate at which the curve changes, as can errors in the simulated mortality rates. Slow growth and/or high mortality can cause the diameter curve to drop away too rapidly in the larger diameter classes. The effect of growth suppression associated with high
I I
! \
\

Univers
ity of
Cap
e Tow
n
< ~
"' ~ < w a: < -' < (/)
< ID.
60
so
40
30
20
10
0
0
SIMULATION BASAL AREA/HA AFTER 11 YEARS
REPEATED 50 TIMES
io i5 20 2s Jo 35 40 45 so
SIMULATION NUMBER
25
Fig. 6. Variation in total basal area in replicate simulations initialized with a single in,entory plot aild simulated 11 years for 50 cases using different random number sequences in each case.
mortality shapes the parts of the curve associated with the smallest and largest diameter classes. This is because diameter growth is slower in large trees
and because the likelihood of competition causing
growth suppression is highest in small trees. Thus
verifications of models such as these can be used to develop specific hypotheses about the species silvies
that can be used to guide future studies. A vegetated plot was simulated with 50 replicates
for 11 years to determine repeatability. The total
basal area on the plot (in m 2 /ha) at the end of each simulation is plotted in Fig. 6. Mean simulated
basal was 32.3 m=/ha (compared to 33 m'/ha meas
ured) with a 95% confidence interval of ± 1,5
m=/ha. The simulation varied between 26 and 36
ni2 /ha, except where a chablis occurred. In the gap resulting from this chablis, the basal.area dropped ·to 3 m'/ha. For management purposes, the mean simulation would provide a fair representation of
the growth that could be expected in the plot.
Discussion
The OUTENIQUA model is presently a research rool directed to summarizing existing information
and identifying inadequacies. Research on the indigenous forest in the southern Cape is aimed at
better understanding system dynamics to ease rhe solution of management problems. A succession model can be \·ery useiul for exploring the long-
265
term effects of certain management activities such
as the effect of a certain harvesting practice which
may only be apparent in 50 years time.
The model has been used to identify future
research topics and to provide a context for studies
on the forest biology of the southern Cape forests.
Quantitative information is needed, for example,
on mortality rates of different species, the influence
of Trichocladus crinitus on regeneration, the in
fluence of the method and time of seed production
and distribution on the establishment of species,
·and the influence of mature trees on the establish
ment of different species (competition, allelopathy
etc.). It is also important to know when diameter
growth of different species decreases, and the in
fluence of site on growth. As this information be
comes available, it can be incorporated in the
model. Functions used can be refined, or be re
placed by more empirically-derived functions.
The reductionist approach to succession, which this model reflects, seems to represent the forest dy
namics reasonably well, although this approach has certain shortcomings of its own (Finigan 1984). The
model can be modified to reflect another succession
theory, and results can be compared with observed data. In this way, the model can be useful vehicle
in the present succession debate. It is important to remember that this, or any
other type of succession model, can only represent
a limited pan of the processes and dynamics of a
forest. Referring to a Markov model for the Princeton Forest, Horn ( 1981) cautioned that 'even _where the model works, it is intended only to be sufficient as a caricature of reality, rather than necessary as
a mechanistic explanation'. This caution is equally true for other types of succession models as well. In the case of the present study, the KIAMBRAM model was moved to simulate forests on a different
continent from that on which it was developed. This was accomplished by parameterizing and in some cases reformulating the model as indicated by the silvics of the individual species, and estimating the growth parameters of the model in an automat
ed fashion from standard inventory data. The relative success in using the model to predict growth of the forest over I I-year periods and the utility of the model in identifying future studies indicate that this

Univers
ity of
Cap
e Tow
n
266
modeling approach appears effecti\'e in applications involving subtropical and tropical forest mvestigations and management.
Acknowledgments
This research forms part of the conservation research program of the Forestry Branch, Department of Environment Affairs in South Africa. Part of the work was funded by the \)nited States National Science Foundation grant BSR 8510099 to the University of Virginia. We want to express our gratitude to both institutions. Thanks are due to Mr. C.J. Geldenhuys of the Saasveld Forestry Research Centre at George, South Africa, for making available much unpublished information on the southern Cape forests, to personnel of the Planning Section of the Directorate of Forestry in Knysna, South Africa, for constructive discussions, to Mrs. Peggy Gilbert of Science Applications, Inc. of Oak Ridge, Tennessee, who did much of the FORTRAN progra:nmiog, and to J .F. Franklin of the University of Washington on his very helpful comments on an earlier draft of this manuscript.
References
Aubmille, A. 1933. La foret de la Cote d'Ivoire. Bull. Comm.
Afr. Occid. Franc. 15: 205-261.
Aubre,ille, A. 1938. La foret colonial: Les fon~ts de l'Afrique
occidentale f ran~aise. Ann. Acad. Sci. Colon. Paris 9: 1-245.
Botkin. D.B., Janak, J.F. and Wallis, J .R. l.9n. Some ecological consequences of a computer model of forest growth: J.
Ecol. 60: 849-872.
Brown. W.H. and Mathews, D.M. 1914. Phillippine diptero
carp iorests. Philipp. J. Sci. (Sect. A) 9: 413-561.
Dale. \'.l-l. and Hemstrom, M. 1984. CLl\1ACS. A computer modei of forest stand development for Western Oregon and
Washington. U.S.D.A. Forest Service. Research Paper.
PN\\'-32i.
Dale, \'.H .. Doyle. T.W. and Shugart, H.H. 1985. A compari
son of tree growth models. Ecol. Model!. :29: 145-169.
Dawso;i. J. \\'. 1962. The New Zealand lo"' iand podocarp
fore;t. Is it subtropical? Tuatara. Wellingtcn 9: 98-116. Donald. D.G.\1. and Theron. J.\·I. 1983. Temperate evergreen
bro:' . .i-lea"(C fc·~~-ts of Africa south oi the Sahara. Jn Tem
per2:e Broad-Leaved Evergreen Forests. pp. i 3:--168. Edited
L,:-· .1. D. Ovington. Elsevier. Amsterdam.
Finigan. B. 1%-l. Forest succession. Nature \'oi. 312: 109-11-l.
26
Geldenhuys, C.J. 1975. Die autekologie van Podocarpus falco
tus. :"-.1.Sc. Thesis, University of Stellenbosch (unpublished).
Geldenhuys, C. J. 1979. Voorlopige soonelys vir die Suid-Kaap
woude. File 23/ I /3- I /03iOl /02/0 I, Forestry Branch, Dept.
of Environment Affairs (unpublished).
Geldenhuys, C.J. 1982. The management or the southern Cape
forests. S.A. Forestry Journal 121: 4-10.
Geldenhuys, C.J. 1987. Distribution and classification of the in
digenous e,·ergreen forest and deciduous woodland in South
Africa·. Jn Forestry Handbook. pp. 443-453. Edited by K. von Gadow, D,W. van der Zel, A. van Laar, A.P.G.
Schonau, H.\V. Kassier, P.W. Warkotsch, H.F. Vermaas,
D.L. Owen and J.V. Jordaan. V & R Printers, Prewria.
Horn, H .S. 1981. Some causes of variety in patterns of secon
dary succession. In Forest Succession: Concepts and Applica
tion. pp. 2~-35. Edited by D.C. West, H.H. Shugart and
D.B. Botkin. Springer-Verlag, New York.
Innis, G.S. 1976. Reductionist vs whole system approaches 10
ecosystem studies. Jn Ecological Theory and Ecosystem
Models. pp. 31-36. Edited by S.A. Levin. Institute of Ecol
ogy, Indianapolis.
Kasanga, H. and Mensi, M. 1954. On the light-transmission of
leaves, and its meaning for the production of matter in plant
communities. Jap. J. Bot. 14: 304-312.
Ker, J. W. and Smith, J. H .G. 1955. Advantages of the parabolic
expression of height-diameter relationships. For. Chron. 31:
235-246.
Kira, T. 1978. Community architecture and organic matter dy
namics in tropical lowland rainforests of Southeast Asia with
special reference to Pasch Forest, West Malaysia. Jn Tropical
Trees as Li,·ing Systems. pp. 561-590. Edited by O.B. Tom
linson and \l.H. Zimmerman. Cambrid~e University Press.
Cambridge.
Kramer, P.J. and Kozlowski, T.T. 1960. Physiology of trees.
McGraw-Hill, New York.
Levins, R. I. and Lewomin, R. 1982. Dialectics and reductionism
in ecology. In Conceptual Issues in Ecology. pp. 107-138.
Edited by E. Saarinen. Reidal. Utrecht.
Loomis, R.S., \Villiams, W.A. and Duncan, W.G. 196i. Com
munity architecture and the 'productivity of terrestrial plant
communities. in Harvesting the Sun. pp. 291-308. Edited by
A. San Pietro, F.A. Greer and T.J. Army. Academic Press, New York.
\1ankin, J.B .. O'Neill, R.V., Shugart, H.H. and Rust. B.W.
1977. The importance of validation in ecosystem analysis. Jn
New Directions in the Analysis of Ecological Systems. Part i.
pp. 63- ii. Edited by G.S. Innis. Simulation Councils of
America. LaJolla, California.
Moll, E.J. and White, F. 1978. The Indian Ocean coastal belt. Jn Biogeography and Ecology of Southern Africa. pp.
561-598. Edited by M.J.A. Werger. Dr\\'. Junk Publishers.
The Hague.
\lue!ler-Dombois, D. and Ellenberg. H. 1974. Aims and
methods oi vegetation ecology. J. Wilev & Sons. i':ew York.
\lunro. D.D. 1974. Forest growth models. A prognosis. Jn
Growth \lode ls for Stand and Tree Simulation. pp. 7-2 I.

Univers
ity of
Cap
e Tow
n
27
Edited by J. Fries. Department or Forest Yield Research.
Royal College of Forestry, Stockholm. Res. Notes 30.
Nicholson, D.I. 1965. A study or virgin forest near Sandakan ..
North Borneo. In Proc. Symp. on Ecological Research into
Humid Tropics Vegetation·. Kuching: UNESCO.
Oldeman, R.A.A. 1978. Architecture and energy exchange of
dicotyledonous trees in the forest. In Tropical Trees as Living
Systems. pp. 535-560. Edited by P.B. Tomlinson and M.H.
Zimmermann. Cambridge University Pres~. Cambridge.
Perry, T.O., Sellers, H.E. and Blanchard, C.O. 1969. Estima
tion of photosynthetically active radiation under a forest
canopy with chlorophyll extracts and from basal area meas
urements. Ecology 50: 39-44. Phillips, J .F. V. 1931. Forest-succession and ecology in the
Knysna region. Botanical Survey of South Africa, Memoire
No. 14. Government Printer, Pretoria.
Robbins, R.G. 1962. The podocarp-broadlcaf forests of New
Zealand. Trans. Roy. N.Z. l: 33-75. Shugart, H.H. 1984. A theory of forest dynamics: Ecological
implications of forest succession models. Springer-Verlag,
New York.
Shugart, H.H., Hopkins, ~l.S., Burgess, J.P. and Mortlock,
A.T. 1980. The development of a succession model for sub
tropical rain forest and its application to assess the effects of
timber harvest at Wiangaree State Forest, New South Wales.
J. Environ. ~1anage. II: 243-265. Shugart, H.H. and West, D.C. 1977. Development of an Ap-
267
palachian dec.iduous forest succession model and its applica
tion to assessment of the impact of the chestnut blight. J. Environ. Manage. 5: 161-179.
Shugart, H.H. and West, D.C. 1980. Forest succession models.
BioScience 30: 308-313.
Shugart, H.H. and West, D.C. 1981. Long-term dynamics of
forest ecosystems. Am. Sci. 69: 647-652. Shugart, H.H., \\'est, D.C. and Emanuel, W.R. 1981. Patterns
and dynamics of forests: An application of simulation
models. In Forest Succession: Concepts and Application. pp.
74-94. Edited by D.C. West, H .H. Shugart and D.B. Botkin.
Springer-Verlag, New York.
Van Daalen, J.C. 1984. Distinguishing features of forest species
in nutrient-poor soils in the southern Cape. Bothalia 15(1&2): 229-239.
Watson, J .G. 1977. Age-class representation in virgin forest.
Malay For. 9: 146-147.
Webb, L.J. 1959. A physiognomic classification of Australian
rainforests. J. Ecol. 47: 551-602. Webb, L.J., Tracey, J.G. and Williams, W.T. 1972. Regenera
tion and pa11ern in ·the subtropical rainforest. J. Ecol. 60: 675-695.
\\'hite, F. 1978. The Afromontane region. In Biogeography and
Ecology of Southern Africa. pp. 463-513. Edited by M.J.A.
Werger. Dr W. Junk Publishers, The Hague.
Whitmore, T.C. 1975. Tropical rain forests of the far east.
Clarendon Press, Oxford.

Univers
ity of
Cap
e Tow
n
CHAPTER 2
FOREST GROWfH
--

Univers
ity of
Cap
e Tow
n
29 Scientific paper
Forest Growth: A 35-Year Southern Cape Case Study
J.C. van Daalen
P.O. Box 4715 6539 George East
SYNOPSIS
1. Tree growth. mortality and recruitment rates were determined on a 44 ha evergreen mixed fcm:st stand in the southern Cape. South Africa. for the period 1972 to 1987. All trees with a DBH > 10 cm on the study area were marked and the DBHs measured in 1972. 1978 and 1987.
2. Cp to 1954 experimental thinnings were executed. Since then (i.e. more than 30 years) no timh1..r lias becll extracted.
3. !\1ean basal area for all species together changed from 32.7 m2/ha in 1972. to 34,1 m2/ha in 197~ and 35J m~/ ha in 1987. Net growth rates since 1942 have declined from 1.63 % per annum for 1942 to 1953 to only OJ5 ~,. per annum for the period 1978 to.1987. Mortality rates of most species increased. and for some spl..'.cies exceeded their recruitment rates.
4. Gross volume growth rate for the stand since 1972 is very similar to that for unlogged tropical forests elsewhere in the world. i.e. about 2 m3/ha per annum. Recovery from disturbances was. nevertheless relatively fast.
5. Many aspects of the observed growth and mortality rates could be explained in terms of the den·lopment phases of the forest. It was concluded that the forest could be close to its maximum timber carryin~ capacit;..
INTRODUCTION tion approximately equalling annual gross primary production··.
The processes of growth, mortality and recruitment in forests are influenced by disturbances, which can operate on a wide variety of temporal and spatial sc.ales (White and Pickett. 1985). The death of a single canopy tree will have a very local and relatively brief influence on the forest dynamics. A lightning fire can burn for several weeks and destroy considerable parts of the forest (CJ. Geldenhuys. personal communication. 1984)
· which will take many years to regrow. Bormann and Likens ( 1979) distinguished between endogenous and exogenous disturbances. the former being a disturbance that occurs within the scope of normal plant succession (for example the death of a canopy tree). and the latter being one that will deflect the autogenic pattern (for example in the case of a lightning fire destroying a considerable part of a forest).
Many forests are subjected to relatiYely frequent large-scale exogenous disturbances. such as fires and cyclonic winds (Loucks. 1970: Frissell. 1973: Heinselman. 1973: Henrv and Swan. 1974 ). Others. such as the northern hardwood forests of the White Mountains of New England in the north-eastern United States of America, are seldom subjected to large-scale disturbances (Bormann and Likens. 1979) where severe logging and shifting culti\"ation is practised. Where ecosystems are sufficiently free of exogenous disturbances. progression to a steady state would be possible. Woodwill and Sparrow (1965. in Bormann and Likens. 1979) defined the steady state as ""a condition in which there is no net change in total biomass over time. with annual ecosystem respira-
Suid-Afrikaanse Bosboutydskrif - nr. 159, Desember 1991
REORGAN!SA TIOH PHASE
SECOND-GROWTH I AGCRAOATION FOREST PHASE
T
~ ,. L
TIME ---
TRANSITION PHASE
STE>.OY -ST ATE PHASE
F!GL'RE 1. Bormann and Likt'11.1 ·.1 1JC/!lJ1 mod,,/ of biomas~ accumulation. The mud cl de//11«t1ic.1 _tour pliiocs of biomass decline and reco\'ery. with a slwrp drop in the reorganisarion phase and maximum acc1111111/atio11 of biomass occurring prior to the steady sra1c.
Bormann and Likens (1979) proposed a theoretical biomass accumulation model for ecosystem development (Figure 1). They hypothesised that a se,c:re disturbance of a forest would be followed by a reorganisation phase of biomass decline. an aggradation phase of bio-mass build-up. a transition phase of erratic hiomass decline and finally a steady-state phase. A stabilisation in the
1

Univers
ity of
Cap
e Tow
n
30
amount of living biomass could be achieved only several centuries after the severe disturbance. When the disturbance is less severe the actual shape of the curve will differ. and the steady-state achieved in a shorter period. The steady-state concept should, however. be considered at best approximate. "In a strict sense there can be no absolute steady state but only a system undergoing slow long-term changes'' (Bormann and Likens. 1979).
After a severe disturbance, such as clear-cutting. numerous small trees, each with relatively small living biomass. grow up together with short-lived herbs and shrubs. During the reorganisation phase the short-lived plants die off, decreasing the total biomass. The aggradation phase is characterised by a steady increase in biomass and an even-aged condition is imposed on the ecosystem. As time passes thinning occurs and fewer larger dominants occur. At the end of this phase maximum liv' ing biomass for the entire developmental sequence is attained. Forest structure at this stage might be considered similar to a plantation where spacing has been adjusted to maximise living biomass accumulation. This biomass peak is followed by a period of biomass decline (the transition phase) which results as even-aged dominants die out and are replaced by patches of young vegetation. This results in a drop of total living biomass of the forest. The steady state is achieved after the progressive elimination of these even-aged dominants and with the development of dominants of all ages. Although the total Jiving biomass for the whole forest will remain more or Jess
0
INDIAN OCEAN
Location of study area and distribution ot forests (black areaal
constant v.ith time, the fall of a large tree may create a gap where the living biomass will he locally reduced. In thi~ way a mosaic of locally varying biomasses is created. This dynamic but relatively unchanging condition is termed the shifting-mosaic steady state (Bormann and Likens. 1979).
Diameter increment rates of the southern Cape forest trees have been measured since the early thirties (Phillips. 1931: Laughton. 1938). but no data on mortality or recruitment rates were available. In this paper I report on the observed diameter increment. mortality and recruitment rates of trees on a 44 ha study area. The following questions are addressed:
] . How do the observed rates relate to the developmental phases of the forest?
2. How do the obser\'ed rates in the southern Cape forests compare to those in tropical forests elsewhere in the world?
STUDY AREA
The study was carried out in a forest stand on the Diepwalle State Forest (33''56'S. 23c 09'E). 20 km north of Knysna. in the mixed evergreen subtropical (Phillips. 1931: Webb. 1959) Afromontane (White. 1978) forests of the southern Cape (Figure 2). It is representatiYe of the stands from which timber is extracted (Von Breitenbach. 1974: Van Dijk. 1987 ). The main canopy is 18 to 22
STUDY AR!~
)
w .. " ··· ...
\ l ti \
Q ·· ............ ·3~0 "' ....... ··
FIG URE 2. Location and map of the 44,4 ha forest stand on the Diepwalle State Forest used for this study.
South African Forestry Journal - l\·o. 159. December 1991

Univers
ity of
Cap
e Tow
n
m high. A dense shrub layer, composed mainly of Trichocladus crinitus (Thunh.) Pers., grows up to 4 m tall. Ground vegetation is rrlat ively abundant.
The climate is warm temperate suhhumid to humid (Poynton. 1971: Schultze and McGee, 1978). Mean annual rainfall is about 1 200 mm with a more or Jess even distribution throughout the year (Weather Bureau, 1986).
Most of the study area faces south to south-west, except for the lower portion south of the Olifants River, which is a level floodplain continuing into a moderate northern slope. Soils are heavy, with a gravelly (silcrete) or stony subsoil. On the small floodplain deep, moist alluvial soils are present. The whole area is underlain hy fine to coarse-grained brownish sandstone of the Goudini formation (former Tchando formation) (Toerien. J979J of the Table Mountain group (SACS. 1980).
The area has been used for testing an experimental management system since 1937. The whole area was divided into 27 parallel plots each some 1.5 to 2.5 ha in size. Plots were allocated at random to three different thinning treatments. In 1954 all treatments were terminated. The effect of the treatments are today still detectable in so far as there is a significant difference in the present standing timber stock among the plots subjected to different treatments. ·
METHODS
In 1972 the DBH (diameter at breast height. i.e. 1.3 m above ground level) of all trees with a DBH > 10 cm was measured. A unique number was painted on each tree and the exact point of measurement was marked. In
31
1978 and 1987 the measurements were repeated. In this way the individual growth rates of more than 26 000 trees were determined. Dead trees, or trees recorded in 1972 and absent in 1987. were recorded as mortality. Trees with a DBH of between 10 and 20 cm added to the record in 1987 were taken as recruitment. In 1983 the 27 plots. as indicated on old maps and marked in the forest, were mapped in detail and the area of each plot determined accurately.
I calculated Pearson product-moment correlation coefficients (SAS Institute Inc., 1985) for the mean rate of increment and total basal area of the standing stock in 1972 (i.e. the stock at the beginning of the study period, the base line data) for the recruitment rate and total basal area. and for the mortality rate and total basal area. This I did for individual species and for all species together. Basal area of a tree is ihe area of a disc cut from the tree hole at the same point at which the DBH measurement was taken. This is used as an indication of timber volume without having to measure all the variables needed for volume calculation.
For comparison of mortality rates of different species (Table 1) .I calculated the number of stems that died during a particular period as a percentage of the number of living stems at the he ginning of that period. This I did for 10 cm size classes (Figures 6 and 9) and for all trees of a species. regardless of size (Figure 8).
1 chose to use timber volume instead of basal area for the comparison of growth rates with those of tropical forests elsewhere in the world. Normally canopy height and implicitly bole length. remains fairly constant within a particular forest. This allows one to use basal area as a volume indication. However. owing to the differences in
TABLE l. Percelltage mortality and the change in number of stems for seleoed species on the Diepwalle study site for the period 1972 to 198 7
! 1972 Change I ' Species % Mortality % Change ! Stock 1972 -1987 I ' I I I I
! Olinia i·entosa 20.4 63 +2 I +3,17
I I Ocotea bullata 14.0 553 -14 -0,03 i
Olea capemis 12.3 6 985 -263 -377 :
subsp. macrocarpa
Apodytes dimidiata 10.2 I ..., 243 -58 -0,03 -
! Curcisia delltata I I
8.5 2 744 I +168 +6,12 I ' ' : Gonioma kamassi 8.S 3 133 +479 +15,29
P1erocelascrus triwspidatus 7.0 2 767 +347 +12,54
Cassine papillosa 5.5 1 099 +217 +19,75 -
Podocarpus /ar(folius 5.1 4 315 +281 +6,51
' All species together 110.6 29 049 +1 459 I +5,02 i I I
S11id-Afri/.:aanse Bosboun·dskrif- nr. 159. Desemher 1991 3

Univers
ity of
Cap
e Tow
n
llA!IAl AMA OISTIUSVTION
•.e
- 1D72 81ul •'•• / J\I - t078 lhul area I ha ····- 1087 !lual aru I"•
o.e
OBH CLASS
FIGURE 3. Total basal area distributions for 1972, 1978 and 1987 on the Diepwalle study site.
32
canopy height among forests of the world. basal area figures are not comparable. Volumes were calculated using. separate regression equations for different species based on the following function (Van Laar and Geldenhuys. 1975 ):
Jog Volume (in dm~) + bo + b1 X log DBH (over bark. in cm)
where bo and h 1 are empirically defined partial regression coefficients.
For comparison. species were selected to cover the assumed spectrum of successional tree species. Included were Olinia \·emosa ( L.) Cuf od., being one of the most light demanding (i.e. pioneer) species and Podocarpus latifolius (Thunb.) R. Br. ex Mirb., one of the shade tolerant later successional species. as well as emergents (Olea capensis L. subsp. macrocarpa (C.H. Wr.) \1 erdoorn ). subcanopy species (Gonioma kamassi E. Mey.) and the most valuable timber species in the forest ( Ocoten bullatn E. Mey.) (Tables 1 and 2).
RESLiLTS
Increment, recruitment and mortalitl rates
The mean basal area for the total growing stock (all species together) on the study area increased from 32.703 m:/ha in 1972 to 34.105 m2/ha in 1978 and 35.251 m 2/ha in 1987. i.e. 0.234 m~/ha per annum from 1972 to 1978 and 0.127 m2:ba per annum for 1978 to 1987. In 1987. however. the growing. stock for the size classes 20 to 35 cm DBHwas below that of 1972 and 1978 (Figure 3 ).
~et basal area growth rates (allowing for recruitment and mortality l since 1942 are available for 12 of the 27 plots on the study area (C.J. Geldenhuys. unpublished data). For the period 1942 to 1953 the mean annual rate was 1.63 % . This dropped to 1.42 % between 1954 and 1972. to 0.55 % for the six years between 1972 and 1978. and to only 0.35 % between 1978 and 1987.
Th .. : number of stems of Olinia ventosa. Ocotea bllllata. Olea capensis subsp. macrocarpa and Apodytes dimidiaw E. Mey. ex Arn. decreased or increased at a lower rate than the 5.02 % increase for the total number of stems ( Tahle 1 ).
Increment and mortality rates for all the species together were positively correlated with the total basal area of the 1972 standing stock. This was not true for individual species.
Mean mortality of all species for the 15-year period 1972 to 1987 amounted to 10,6 % of the 1972 standing stock (Table 1). Olinea ventosa. Ocotea bullata, Olea capensis subsp. macrocarpa and Apodytes dimidiata had mean mortality rates higher than the overall mean for all species. Recruitment was insufficient to make up for the high mortality rates of these species. Even the increase of 3.17 % of the number of stems of Olinia ventosa means a relative decrease when compared to an overall increase of 5.02 % in the standing stock since 1972. The reduction in stems was limited largely to the 15 to 30 cm DBH classes (Figure 4). Species with below average mortalitv increased their number of stems across all size classes (Figure 5).
The mortality rates of most of the species listed in Table 1 and 2 increased more or kss constantly from 1972 to 1987 (Figure 6 ). However. for Ocotea bullata the rate of increase was much higher for the period 1978 to 1987 than for 1972 to 1978. For Cassine papillosa (Hochst.) Kuntze the mortality rate remained constant. The order of mortality rates was very similar to the order of diameter growth rates in an artificially re-established forest stand on the Diepwalle State Forest (Figure 7).
\1ortalit\' rates for both Olinia i·cntosa and Ocotea bullata have a decreasing tendency from the smaller to the larger size classes (Figure 8). This is not true for Curtisia de111ata (Burm.f.) C.A. Sm .. Podocarpus latifolius and for the mean mortality rate of all trees. regardless of species.
When the mortality rate per size class for all species together is simulated by fitting a polynomial (Figure 9). a C-shaped trend becomes apparent.
TABLE 2. Timber rnlume groH·th for selected tree species on the Diep1rnl/e study site for the period 1972 to 1987
Specie•
Olinia t·emoso
Ocotea bu!li11a
Oieu capen5t5
~u~~r. nwrrocnrpn
Apudy1c.\ dumdwrn
Curtl.\IG demata
Gnnioma kamnssi
Pterncelasrrus rricuspidatus
c GS.II/IC pap1/losa
Podocarpio larifo/111.1
All spede~ together
True groK"th I }Vet gro.,.·rh <m3!ha pa annum) (m3!ha per annum)
(l.(IJ" 0.014
o.o:;~ -0.011
li.i>-l" 0.360
O.i ;- 0.0-lQ
0.1:1 O.Q78
O.U50 0.071
o.:::; 0.194
(J.\J:'3 0.03U
0.41 J U.274
2.065 1.124
So1ah African Forestry Journal - No. 159. December 1991
I I
I I

Univers
ity of
Cap
e Tow
n
12
\ 10
• I
2
Ollnlo ventoso
200 300 .00 soo 100 700 800 900
DBH class (mm)
Olea capensis subsp mocrocorpa
1200
1000
800
200
o'--~.L-~"--~"--~..._~..L--=::s-...._..._..._
100 200 300 .oo 500 600 100 900
DBH class (mm)
1972 Frequencies
33
Ocotea bullata
80
IO
20
OL-~-"-~-'-~--'~~-'--l-....l.;;: ...... '-"-~--' 100 200 300 700 800
DBH class (mm)
Apodytes dtmtdtata
IOO
300
200
100
o'--~...1-~--'~~-'--=~--.._.._....._-+-...J
100 200 300 ,00 soo 600 700
DBH class (mm)
•••· + •·•· 1987 Frequencies
FIGURE 4. 1972 and 1987.frequency distributions for selected species with mortality rares higher than that for all tree species rogether.
Suid-Afrikaanse Bosboim·dskrff- nr. 159. Desember 1991 5

Univers
ity of
Cap
e Tow
n
Curttsta dentata
F'r•quencles t200 . -
tOOO
IOO
!500
DBH class {mm)
Pterocelostrus trtcusptdatus
tOOO
IOO
200
01-.~-L-~-'-~--l'--~.x::!! ...... ~-+-~.....J
100 200 300 400 500 600 700
DBH class (mm)
34
1972 Frequencies
Gontoma kamasst
2000
t500
tOOO
5oo
oL-~~L-~~L-~~ ..... --~1--~--+ 100 150 200 250 300
DBH class (mm)
Podocarpus lotifolius
t.00 Frequencies
1200
1000
800
600
'°° 200
·· ... 0 100 200 .500 '°° 500 800 700 800
DBH class (mm)
···· + •··· 1987 Frequencies
FIGURE 5. 1972 and 1987 frequency distribwions for selected species with mortality rates lower than that for all tree species together.
6 South African Forestrv Journal - No. 159, December 1991

Univers
ity of
Cap
e Tow
n
Rates of volume gro~1h
The gross annual timber volume increment (Table 2) for all species together amounted to 2.0h.5 m3fha for the period 1972 to 1987. whereas the net increment (after accounting for recruitment and mortality) was only half of that, i.e. l,124 m3fha.
DISCUSSION
Increment, recruitment and mortalit~· rates
Both the net basal area growth rate for the total area since 1972 and the net growth rate for 12 plots since 1942 show a considerable decline over time. This. together with the positive correlation between both the increment and mortality rates and the total standing stock. indicates stagnation and suggests that trees are competing for space and other resources (Franklin et al .. 1987). At present. this competition manifests itself in the smaller size classes of some species (Figures 3, 4 and 5). These are the species that experienced a relative reduction in their number of stems (Table 1). With time. the competition might become apparent in the larger size classes. Only 30 years has elapsed since the cessation of timber extraction from the area. and assuming that smaller trees do not compete with larger trees (Connell et al .. 1984 ). the competitiw effect of recruitment since then will only become visible among the larger size classes at a later stage.
Geldenhuys (1975) regarded Cassine papillosa. Podocarpus latif olius and Olea capensis subsp. macrocarpa as more slow-growing and shade-tolerant (less pioneer-like) than some other species. such as Cunonia capensis L. and Olinia 1·entosa. The faster growing. more pioneer-like species had higher mortality rates (compare the observed mortality rates in Figure 6 with dia-
FIGURE 6. Mean morraliry rares of selected species for the period 1972 10 1978 and 1978 to 1987.
meter growth rates reported by Geldenhuys (1975) (Figure 7)). The only exception is Ocotea bullata. This species coppices, especially after being cut, and the high mortality rate from 1978 to 1987 could be partly due to severe competition among coppice shoots. which were recorded as separate stems during the surveys.
Franklin er al. (1987) came to the conclusion that mortalitv rates in coniferous forests of the Pacific Northwest region of the United States of America decline as succession proceeds. This is contradictory to the patterns
Suid-Afrikaanse Boshnwydskri(- nr. 159, Desemher 1991
35
Hj 32
I 28'
24
J A
20
~ 18
12
e
' 10 3 i9e3 19se ,~ 3
VEAR
. FIGURE 7. Mean DBHs of an anifi«1a/11 e.1wbfi.,Jied forest stand on the Diepwalle Stare Fore:,t (nr the period 1935 to 1973. (Geldenhuys 1975. rcprod11ced 11 ith permission from author.)
observed for the hardwood forest on the study area (Figure 7). The only species for which the munality rate stabilised was Ca.ssine papillosa. accordin~ to Geldenhuys (1975) one of the least pioneer-Ji he '.'-r.:cies. As~uming that mortality rates will eventuall~ decline as for coniferous forests. this suggests that the fore~t is ~till in a Jevelopmental phase.
According to Bormann and Likens·s ( 1979) model of biomass accumulation. the southern Cape forest stand would be near the end of the aggradation phase or the start of the transition phase. Biomass (i.e. standing stock) increased at a declining rate during the study period. whereas mortality rates for the light-dem:mding pioneer-like species increased consider<.1hly. but stabiii~.:d for the tolerant. less pioneer-like species.
Van Valen (197.5) suggested that a denea<:.ing risk of death with increasing size (or age J is the most comml1n pattern among all organisms. This seems to he true f,1r Olinia venwsa a,nd Ocotea bu/Iara (Figure i"). The former is a shade~olerant species. implying that competition for light would be fierce among small trees. Once they reach the canopy. and often emerge abo\·e it. this competition decreases among the fe\\ remaining individuals. For even-aged stands a simple n1linotonic decline in death rate with increasing diameter might be expected (Goff and West. 1975). In these stands the \·enical structure and interaction bet\\ een o\ erstore\· and understorey are not causing Yariation in grcm th and mortality as is the case in all-aged foresb. In the latter a U-shaped mortality curve could he expected. In these stands vigorous overstorey trees should experience IO\\ -
er mortality than young competing trees and old trees which become more vulnerable to mvrtality factors such as disease and windthrow. This U-shapeJ cun·e is commonly applied in models predicting mortality (Lorimer. 1983: Shugart. 1984 ). Both Cunisiu de111aw and Podocarpus latifolius have a more or less constant mortality rate for diameters of 10 cm and more (Figure B). The mortality rate for all species together cxhihi1s the U-shaped curve (Figure 9). One can expect tl) find high-

Univers
ity of
Cap
e Tow
n
36
0 100 200 300 400 500 600 700
DBH class (mm)
-+- O.v..,toeo O.buftoto - All apedes
C.dentalo ..._
P.lotlfollue
P-1'iOQn Indicate cho119e In no of llemt.
FIG URE 8. Mortality rares per size classes for selected species for the period 1972 to 1987. The X-axis denotes the 1972 size class distribution. The curve of "all species·· include the data for all the species found on the study sire. It is not the total of the data for the four species illustrated in the figure.
Mortality rate 0.17 ~--'--------------~0.17
0.1E 0.16
0.15 0.15
o.u 0.1,
0.13 0.13
0.12 0.12
0.11 0.11
0.1 0.1
0.09 0.09
o.os ...__ _ __,_ __ ......__.___,_ __ ~ _ _.._ __ ..__ _ _._ o.oe 1 oo 200 300 400 500 600 100 eoo
DBH class (mm)
FIGURE 9. Total mortality rate for all cree species for the period 1972 to 1987. The X-axis denotes the 1972 size class distribution.
er mortality rates for the size classes below 10 cm DBH (Lieberman et al .. 1985). These will then change the horizontal lines for Curtisia dentara and Podocarpus latff olius into the negative exponential mortality curve described by Van Valen (1975).
Rates of volume gro"M1h
I concluded above that in terms of Bormann and Likens's (1979) model of biomass accumulation the forest stand on the study area is dose to its maximum biomass
8
carrying capacity. Therefore. the gross volume gro\\1h for all species together could be compared to the grov.1h of unlogged forest!> elsewhere in the world.
WyatFSmith (1987) stated that tropical moist forests yield up to 2 m3/ha per annum. Maiirc I 1987) reported that unlogged tropical forests in tht J\ory Coast produced 0.7 to 1 .8 m3/ha per annum utilisahle timber. whereas logged forests yielded about 2.5 m3/ha per annum. Leslie (1987) wrote that the mean annual increment of 3 m3/ha that he used for an economic feasibility study of natural management of tropical forests is near the upper volume growth limit for dipterocarps and well above the average reported for tropical forests. Thus. a yield of 2 m3/ha per annum, which is similar to the volume growth for the study area. seems to be the universal timber production potential for unlogged mixed evergreen tropical and subtropical forests. Selective thinninf, treatments can. however. increase this figure up to 6 m· I ha per annum (Wyatt-Smith. 1987 ).
CONCLUSIONS
Although the forest growth obserYed in the southern Cape is slow compared to for example that of Pinus radiata D. Don plantations (with a mean annual increment of about 15 m3/ha) in the same area. the gross rate of 2 m:;/ha per annum is comparable to those of tropical and subtropical forests elsewhere in the world. Despite this slow growth, recovery from the disturbances up to 1955 was relativeiy fast. The thinnings executed at the time were described as "disturbingly heavy" and "clearfelling'· (letters on file R3790/219 B:2 of the then Department of Forestry). Thirty-two years later the same stand is close to its maximum timber-carrying capacity.
In the southern Cape the management policy excludes silvicultural treatments~ such as selecti"e thinnings. to increase timber production per se. Seydack et al. (1982) wrote: "The realisation of this policy entails the optimal utilisation of resources with overriding regard to the maintenance of natural diversity and the protective and aesthetic value of the indigenous forests.··
· Timber is seen as one of many assets of the forests and is harvested in such a way as to simulate natural mortality as far as possible and to minimise the impact of harvesting. Under these conditions only the net timber volume growth can be realised.
The high mortality rate of Ocotea bullata (Figure 6) is notable. The reason could be competition between coppice shoots with a DBH of 15 to 35 cm (Figure 6). although Liibbe (1989) did not detect such a phenomenon in his autecological study of Ococea bullata. He did find group die-back of Ocorea bullata on areas that are poorly drained and temporarily waterlogged. These diebacks are often associated with the presence of the root pathogen Phytopthora cinnamomi Rands. which seem to attack trees that are under stress (Von Broembson et al., 1986). The development of this species on the study area should be observed closely and the hypothesis of competition among shoots tested.
Many aspects of the observed growth and mortality rates could be explained in terms of the developmental
South African Forestry Journal - ·"'o. 159. December 1991

Univers
ity of
Cap
e Tow
n
phases of the forest as described by Bormann and Likens's (1979) model of biomass accumulation. Growth rates are declining and mortality rates are increasing. indicating competition for space and other resources. Some species, such as Curtisia dentata. Gonioma kamass1. Pterocelastrus tricuspidatus (Lam.) Sond., Podocarpus latifolius and Cassine papillosa, are favoured by this situation and are increasing their numbers relative to other species, whereas recruitment rates of Olinia ventosa, Ocotea bu/lata, Olea capensis subsp. macrocarpa and Apodytes dimidiata are less than their mortality rates (Table 1).
Some species exhibit a U-shaped curve (although often only slightly) described by Van Valen (1975) for allaged forests. Olinia ventosa and Ocotea bullata showed a simple monotonic decline in death rate with increasing diameter typical of even-aged forests.
Data on volume growth rates for tropical and subtropical mixed. all-aged forests are very scanty. If. however. it could be proved that growth rates for these forests are globally fairly constant, as seem to be indicated by the little data available. it could be a unique opportunity for the refinement and standardisation of forest succession models, such as the KIAMBRAM model developed by Shugart et al. (1980) and the OUTENIQUA model for the southern Cape forests (Van Daalen and Shugart, 1989). These models can then be applied on a much wider scale with much Jess laborious and timeconsuming calibration than at present.
ACKNOWLEDGEMEJ'iffS
Initially the study formed part of the conservation research programme of the Directorate of Forestry. Department of Environment Affairs now the Department of Water Affairs and Forestry. It was completed under the Ecosystems Management Programme of the Division of Forest Science and Technology. CSIR. Thanks are due to Dr. CJ. Geldenhuys of the Saasveld Forestry Research Centre. He initiated the 100 % surveys of the study site in 1972 and 1978 and gave me permission to use the data and continue the study. Many stimulating discussions with him and others, such as Dr. J.J. Midgley of Saasveld F.R.C. and Dr. A.H.W. Seydack of the Regional Forestry Office in Knysna, are gratefully acknowledged. The 1987 survey was done entirely by Planning personnel from Knysna as part of a joined planning and research exercise. Their co-operation is highly appreciated.
REFERENCES
BORMANN. F.H .. and LIKENS. G.E .. 1979. Catastrophic disturbance and the steady state northern hardwood forests. American Science 67: 660- 669.
CONNELL. J .H .. TRACEY. J .G .. and WEBB, L.J.. 1984. Compensatory recruitment. growth. and mortality as factors maintaining rain forest tree diversity. Ecological Monographs 54(2): 141 - 164.
FRANKLIN. J.F.. SCHUGART. H.H .. and HARMON. M.E.. 1987. Tree death as an ecological process. Bioscience 37(8): 550 - 556.
FRISSELL. S.S. Jr., 1973. The importance of fire as a natural ecological factor in Itasca State Park. Minnesota. Quaternary Research 3(3): 397 - 407.
GELDENHUYS. C.J., 1975. Die kunsmatige vestiging van inheemse bos in die Suid-Kaap. Forestry in South Africa 16: 45 - 53.
Suid-Afrikaanse Bosboutydskrif- nr. 159. Desember 1991
37
GOFF. F.G .. and WESl. D .. 1<175 Canopy-undcrstory interaction effects on forest population structure. Forest Science 21(2): 98 - 108.
HARCOMBE. P.A.. 1987. Trtt hie tabb. Bioscience 37(8): 557 -508.
HElNSELMAN. M.L. l9D. Fnc •'·!he virgin forest~ of the Bound· ary Waters Canoe Area. Mmne,n!a. Quaternary Rnearch 3(3 ): 329 - 382.
HENRY. J.D .. and SWAN. J.M.A .. 1974. Reconstructing forest hi~tory from live and dead plant maierial: An approach to the study of forest succession in southwest ~e11. Hampshire. Ecolog1· 55: 77'2 -783.
LAUGHTON. F.S .. 1938. Hou11relt van die lnheemse Bn.uc 1·a11 die Unie van Suid-Afrika, met special verwysing na die howho.ue van die Knysna·streek. Governmcnr Prinrer. Pretoria.
LESLIE. A.J .. 1987. The economic feasibility of natural management of tropical forests. Jn:
MERGEN. F .. and VJNCE!"l. J.R. (ed.) Natural ,\1a11ageme111 of Tropical Forests. Silviculwral and ma11agemet1t prospects of .wstained utilization. Yale Um"ersily. New Ha\'en. pp. 177 - 198.
LIEBERMAN. D .. LIEBER'.IA~. M .. PERAL TE. R.. and HARTSHORN. G.S.. 1985. Murtalit\ patterns and stand turnover rail'> in a wet tropical forest in Costa Rica. Jou ma/ uf En•/,·.~." 7'3-: 91 <. - 4:4.
LORIMER, C.G .. 1983. A teq of the accuracy of shade· tolerant cla'sification based on physiognomicand rt>producti1·e trait~. Canad11111 Jnurnal of Botanr 61: J59'i- 1"98.
LOUCKS. 0.L.. 1970. Evolution of diversity. efficie1i-·, and cummunity stability. American Znofr.i;ist J 0: 17 - 25.
LOB BE. W.A .. 1989. Some a~pects of the autecology of Oco1e11 h11/lata (Burch.) Baillon (Lauraceae) with emphasis on rcsponst: Ill cntain stress factors. MSc. thesis. Cniversity of Stellcnhosch.
MAITRE. H.F .. 1987. l"atural forest management in Cc11<: d'h\1irc. /..:nasr!l'a 1571158 Vol 39. 53 - 60.
PHILLIPS. J.F.V., 1931. Forcs1-Succes.'ion and Ecoloi:.• 111 Iii« J\.111s11a Region. Government Printer. Pretoria.
POYNTON, R.J., 1971. Silsivultural map of Southern Africa. So111h African Journal of Science 6i: 58 - 60.
SACS. 1980. Stratigraphy of South Africa. Part I. Lithostratigraphy of the Republic of South Africa. South-West Africa::-O:amibia. and the Republics of Bophuthatswana. Transkei and Venda. S0111h African Geological Survey Handbook ~o. 8.
SAS INSTITUTE INC.. 1985. S . .\S user"s guide: Basics. Version 5 Edition. Cary. NC.
SCHCLZE. R.E .. and \1CGEE. O.S.. 1978. Climate indice< and cla<sifications in relation to th.: h1ogeography of S,•uthcrn Africa. Jn: Werger. M.J.A. (ed.) Biogruphr and Ernlng1 uf Sou;/1<'111 Afriw. Dr. W. Junk b.1'. Puhlishers. The Hague. pp. 19 - ~=
SEYDACK. A.H.W .. GREWAR. S.G .. and VA~ DUK. D .. 19/C. Proposals for a, management system for the indigenom forests of the Southern Cape and Tsitsikamma. UnpuhJi-,hed rl<mning 1eport. Directorate of Forestry. Department of En1 ironment Affairs. South Africa.
SEYDACK, A.H.W., VA!\ DAALE~. J.C.. VA~ DJJK D .. REYNELL. D., HEYNS. H .. JOOSTE. A .. FERGCSO~. M .. PITCHFORD. W .. DURRHEIM. G .. and WILLEMS. D .. 1990. Yield regulation in the Knysna forests. So111h African Fortc.11n Joumal 152: 50- 61.
SHUGART, H.H .. 1984. A Theory of Fores1 Dynamio The Ernlogical Implications of Forest S11ccessinn Modt'ls. Springer· Verlag. New York.
SHUGART. H.H. HOPKJ;-.;S. M.S .. BURGESS. J.P .. and '.10RTLOCK. A.T .. J 980. The de1elopment of a succession model for sub-tropical rain forest and its application to a;,sess the· dfc~t< of timber harvest at Wiangarec State Forest. :New South Wale'· Journal of Environmemal Managemenr 11: 24~ - 26:"-
TOERIEN. D.K .. 1979. The Geology of the Oudsth<,orn Arrn. (ju\
ernment Printer. Pretoria. VAN DAALEN. J.C.. and SHL'GART. H.H .. 1989. Outeniqua - A
computer model to simulate succession in the mixed e' crgreen forests of the southern Cape. South Africa. Landscape Ecolui:.1· 2: 225 -267.
VAN DUK. D., 1987. Management of indigenous el'ergreen high forests. In: Von Gadow. K .. Van der Zel, D.W .. Van Laar. A.. Schonau. A.P.G .. Kassier. H.\\'.. Warkotsch. P.W .. Vermaas. H.F.. Owen. D.L.. and Jordaan. J.\". (eds). Fores1n- Hf11,dfln,,k. South African Institute for Forestry. Pretoria. pp. 454 - 46-l.
9
Univers
ity of
Cap
e Tow
n
38
VANLAAR. A .. and GELDENHUYS. CJ .. 1975. Tariff tahlc~ for indigenous tree species in the Southern Cape Province. Forestry in South Af rico 17: 29 - 36.
VAN VALEN. L., 1975. Life. death and energy of a tree. Biotropira 7: 260- 269.
VON BREITENBACH. F .. 1974. Southern Cope Forests and Tree.1. Government Printer. Pretoria.
VON BROEMBSON. SJ .. LDBBE. W.A.. and GELDENHUYS. CJ., 1986. Phytophthoro cinnamomi associated with decline in stin~wood (Ocotea bullata) in southern Cape indigenous forests. Phyto/actica 18: 44.
WEATHER BUREAU, 1986. Climate Data of South Africa. Climate Statistics up to 1984. Government Printer. Pretoria.
JO
WEBB. L.J.. 1959. A phy~iognomic classification of the Austr<shan rainforests. Journal of Ecology 47: 551 - 602.
WHITE. F .. 1978. The Afromontanc region. Jn: Werger, M.J.A. (ed) Biof;copnphy and Eco/ogv of Southern Africa. Dr. W. Junk h.\. Puhli~IH"T\. The Hague. pp. 464 - SD.
WHITE. I'S .. and PICKETI. S.T.A . 1985. Natural disturhancc and patch dynamics: An introduction. In: Pickett, S.T.A .. and White. P.S. (ed~). The Ecologv of Natural Disturbance and Patch Dmamics. Academic Press. Inc .. Orlando. pp. 3 - 13.
WY A TI-SMITH. L 1987. The management of tropical moist forest for the sustained production of timber: Some issues. JUCJ\'il/£D T;opical Forest Policy Paper No 4.
South African Foresrry Journal - No. 159, December 1991

Univers
ity of
Cap
e Tow
n
CHAPTER 3
COMPETITION IN THE FOREST

Univers
ity of
Cap
e Tow
n
THE EFFECT OF COMPETITION ON TIMBER GROWTH IN A
MIXED EVERGREEN FOREST STAND
J C van Daalen1
Division of Forest Science and Technology
CSIR, P 0 Box 395
Pretoria 0001
SYNOPSIS
Competition among trees of the southern Cape forests was determined by calculating the distances among all trees on a 2.86 ha forest stand and correlating the distance between two neighbouring trees with the growth rate of the smaller one of the pair. Both inter- and intraspecific competition was evident between most of the chosen species combinations. The apparent more pioneer-like species, such as Olea capensis subsp. macrocarpa, Ocotea bullata and Apodytes dimidiata, showed,weaker competitive abilities than later successional species such as Podocarpus latifolius, Curtisia dentata and Pterocelastrus tricuspidatus. Most of the southern Cape forest trees are shade-tolerant and can grow in close proximity to other trees, but the growth rate of various species is retarded by competition. It was concluded that the harvesting of the weaker competitors strictly according to the numerical proportions by which they occur in the forest is unnecessary, that the more valuable timber species profit from the advanced development stage of the forest in that they are better late-successional competitors, that the role of the dominant forest tree,· Olea capensis subsp. macrocarpa, is not fully understood and that the present management approach of harvesting trees. that will most likely die, is sound.
IN'fRODUCTION
Competition as such was seldom, if ever, mentioned as a factor to consider
during the management of the southern cape mixed, evergreen indigenous
forests. In their management proposals Seydack et al. (1982) mentioned that
during the marking of the trees to be harvested the operator should
concentrate on dying and diseased trees or those prone to wincithrow. This
1 Present address: P 0 Box 4715
GEORGE EAST 6539 South Africa

Univers
ity of
Cap
e Tow
n
41
implies that they select the competitively inferior trees. In subsequent
alterations to the management system (Seydack et al., 1990; Kobrie Vermeulen,
personal communication, 1992) emphasis has been placed increasingly on
selecting trees according to certain seni 1 ity criteria. Competition, however,
remains an underlying controlling factor.
During the past decade the role of competition has been controversial.
Despite various extensive reviews (e.g. those by Connel, 1983, Schoener, 1983
and Strong et al., 1984), the matter is still far from resolved. Competition
for resources such as nutrients, water, space and sunlight may involve
outright fighting (interference competition), or could be the consumption of
a resource item by one individual, making that i tern unavailable for others
(exploitation competition) (Murray, 1986). The consequences of failing to
find and obtain adequate resources would be increased probabilities of dying,
decreased probabilities of breeding, or both. Therefore, in forests, any tree
that starts at a competitive disadvantage will almost certainly die (Peet & . .
Christensen, 1987). For example, a tree seed that falls and germinates in the
immediate vicinity of a larger tree, occupying the soi 1 around it by its root
system, wi 11 barely have a chance of survival. Generally, competitive
exclusion will proceed faster where the available resource base is greater
(Huston, 1979). Thus, the resource base, or factors affecting the resource
base, such as mycorrhiza, will influence the outcome of competition.
Zeide (1972 & 1975, ex Franco & Harper, 1988; 1985) studying natural forests
in the U.S.S.R. observed that a dominant tree is usually surrounded by a ring
of suppressed trees. In turn, trees in the next concentric ring act as
dominants and so on. The overall effect is one of a 'density wave' that damps
down with distance, propagating in all directions from dominant trees. The
strength of the symmetrical wave propagation is obscured by waves from other
dominants, resulting in asymmetrical waves. The asymmetry of the waves makes
the unambiguous demonstration of especially interspecific competition very
difficult, as has been shown by Connell 's (1983) survey. For this reason the
use of observations on species distributions and abundances, which are
essentially static observations, to infer information about the dynamic
processes of competition in natural communities is often not very successful
(Hastings, 1987; Strong et al., 1984). Furthermore, the suppression of trees
might vary among different forest types. In the southern Cape large trees are

Univers
ity of
Cap
e Tow
n
42
often surrounded by a ring of young trees as a result of seed dispersal by
birds, dropping the seed in the vicinity of the source tree after eating the
softer outer parts of the fruit. Much more successful is the use of experi
mental manipulations to detect competition (Hastings, 1987; Schoener, 1983).
Where this is not possible, as in the case of the southern Cape forests, the
use of distance dependent competition indices often provide a satisfactory
alternative. In the forestry environment the measurement of the proximity of
competitors and their size (or change in size over time, such as diameter
increment) have been shown to have high predictive value (Daniels, 1976;
Lorimer, 1983; Monserud, 1976; Smith & Goodman, 1986; Weiner, 1984).
Nearest-neighbour data is relatively easy to obtain and to analyse. It must,
however, be remembered that although the plant's performance is considered as
a function of the conditions of its neighbours (Weiner, 1984),. the period over
which this performance is measured in the case of trees, is normally short
relative to the tree's life-span. The performance is, therefore, apart from
being a function of the proximity of the trees' neighbours, related to the
successional stage of the forest stand.
The purposes of this study was to investigate the role of inter- and intra
specific competition between trees in a mature southern Cape forest stand and
to provide guidelines for harvest selection. Competition was defined as the
negative influence of one tree on another's diameter growth. The stand is
representative of forest us.ed for harvesting furniture timbers. The following
null hypotheses were tested:
(1) Interspecific competition does not affect tree growth in the
southern Cape indigenous forests.
(2) Intraspecific competition plays no significant role in these
forests.
(3) Spacing of trees need not be considered during the selection of
trees for felling.
STUDY AREA
The study was done in a forest stand on the Diepwalle State Forest (33°56'S,

Univers
ity of
Cap
e Tow
n
43
23°09'E), 20 km north of Knysna, in mixed evergreen subtropical (Phillips,
1931; Webb, 1959) Afromontane (White, 1978) forests of the southern Cape
(Figure 1). It is representative of the stands from which timber is extracted
(Von Breitenbach, 1974; Van Dijk, 1987). The main canopy is 18 to 22·m high.
A dense shrub layer, composed mainly of Trichocladus crinitus (Thunb.) Pers.
grows up to 4 m tall. Ground vegetation is relatively abundant.
The climate is warm temperate subhumid to humid (Poynton, 1971; Schultze &
McGee, 1978). Mean annual rainfall is about 1200 mm with a more or less even
distribution throughout the year (Weather Bureau, 1986).
The study area forms part of a larger compartment lying partly on a gentle
northern and partly on a gentle southern slope. The compartment, together
with other adjoining compartments, has been used for testing experimental
management systems since 1937. The whole compartment was divided into 48
oblong plots, 0.8 to 1.4 ha in size (Figure 1). In 1954 all treatments were
terminated.
The specific area used for this study is more or less level. Soils are heavy,
with a gravelly (silcrete) subsoil. The area is underlain by fine to coarse
grained brownish sandstone of the GOudini format ion (former Tehan.do format ion)
(Toerien, 1979) of the Table Mountain group (SACS, 1980).
METIIODS
In 1974 the DBH (diameter at breast height, i.e. 1.3 m above ground level) of
all trees on the whole compartment with a DBH ~ 10 cm were measured. A unique
number was painted on each tree and the exact point of measurement was marked ..
In 1987, three adjacent plots, totalling 2.86 ha and lying in a homogenous
part of the compartment were selected for remeasurement (Figure 1). These
selected plots (called main plot from now onwards) included 3970 trees with
a DBH ~ 10 cm. The main plot was subdivided into 286 lOxlO m subplots, and
each subplot was further subdivided into 25 2x2 m sub-subplots. The
boundaries of the latter were demarcated with white nylon rope and the
position of each tree within these sub-subplots estimated to the nearest 5 cm.
At the same time the DBH of each tree was measured on the exact same point as

Univers
ity of
Cap
e Tow
n
(al
(bl
t N
-•fl
all
fcl
-L
0 i
-1 ~
AB
CD
EF
GH
I
J K
Stu
dy
Are
a •
f'
' ~ :,,
.. ~.
•"' •
I "
.; ~
.. ,,,
l~'
\ ...
(dl
I ~-,
:::- t_
[.';
; C::
.: :::: '...
__
..... , §
'...._
'...
._
" .....
. :--
......_
t:: :::_
---
IND
IAN
O
CE
AN
FIG
UR
E
1.
Lo
cati
on
of
the
stu
dy
area
in
th
e so
uth
ern
Cap
e m
ixed
eve
rgre
en
fore
st
(bla
ck a
rea
s)
Sout
h A
fric
a
(a
& b
).
The
stu
dy
sit
e
(c),
.
whi
ch
was
su
bd
ivid
ed i
nto
10
x
10 m
su
bp
lots
, fo
rmed
p
art
of
a
larg
er f
ore
st g
row
th s
tud
y a
rea
(d
).
I I I l I I \
', \ \
\ I I
'. I
\ I
I : I
:I
25 :re 2'
2r
ti
20. " II 17
11
15
14
13
12
11
111 ' '
\ \ \
~ ~

Univers
ity of
Cap
e Tow
n
45
was done in 1974. The data were recorded for the 10x10 m subplots, not for
the sub-subplots. The purpose of the sub-subplots was purely to facilitate
the determination of the trees' relative co-ordinates.
The relative tree co-ordinates were used to calculate al 1 the intertree
distances using the Arc info Geographic Info.rmat ion System. These distances
were then correlated with the measured growth for the period 1974 to 1987 for
selected species and selected trees within species. The Arcinfo output files
tend to be very large and to some extent the size of files that could be
handled on the available computer hardware influenced the choice of the
species combinations chosen for correlation analysis.
In line with the approach followed by Connell et al. (1984) I considered a
tree a neighbour that will influence a specific tree's growth only if it was
equal or greater in size than the tree under consideration. Lorimer (1983),
studying .35 to 50 year old shade-tolerant hardwoods whose growth potential is
probably not strongly affected by competition from dominant trees, obtained
higher correlations when competitors were defined as trees of equal or higher
height classes than the subject tree, than when he considered all trees as
competitors. However, Mugasha (1989), found that for predicting competition
between Pi nus banksiana Lamb. (jack pine) and Populus tremuloides Michs ..
(trembling aspen) in Ontario, Canada, better results were obtained when all
trees were considered competitors. In this case the jack pine was only eight
years old, the stands were pure jack pine/trembling aspen mixtures and only
dominant or codominant subject trees were selected. The forest type
considered here bares closer resemblance to those studied by Connell et al.
and Lorimer than the plantation studied by Mugasha. The former two authors'
·approach has therefore been adopted.
The non-parametric Spearman correlation coefficient was used for the corre
lation analysis. Various authors (e.g: Lorimer, 1983; Mugasha, 1988; Weldon
et al., 1988) used regression analysis for the detection and prediction of
competition among trees and shrubs. Others (such as Smith & Goodman, 1986)
concentrated on correlation analysis. Weldon et al. (1988) found that
although competition among trees and shrubs in the semi-arid Colorado was
present, the intensity (i.e. the regression slope) of competition within
different· species· combinations did not differ significantly. I was more

Univers
ity of
Cap
e Tow
n
46
interested in the detect ion of compct it ion than in the predict ion of the
extent of competition and decided on correlation analysis.
When using the nearest-neighbour method, many of the distance values are
duplicates, since paired neighbours (which have each other as nearest
neighbours) make up a significant portion (up to 623) of the total population
(Clark & Evans, 1955; Hamming & Gilbert, 1954, ex Cottam & Curtis, 1956).
This problem was avoided by the restriction that competitors could only be
trees of equal or greater size than the subject (smaller) tree.
When the subject tree is close to the plot boundary there is always a degree
of uncertainty about the nearest neighbour's position (Connell et al., 1984).
The real nearest-neighbour could be outside the plot, but because it does not
form part of the dataset it will not be known. This edge effect was limited
by eliminating from the dataset the subject trees occurring in the outer row
of subplots. This meant that subject trees were at least 10 m away from the
boundary of the main plot.
I adopted Connel l's (1983) operational definition in deciding whether compe
tition was affecting a species. "If there was a statistically significant
response in the opposite direction in the species being studied, ... compe
tition was judged to be occurring". In other words, if the distances between
neighbours were positively correlated with diameter growth (i.e. the greater
the distance the faster the growth rate) competition was considered to be
limiting tree growth.
For each species combination frequency tables of the number of smaller nearest
trees according to 5 m distance classes away from the larger trees (which were
divided into 5 cm DBH classes) were calculated. For example, fo.r the Olea
ca.pens is L. subsp. macrocarpa (C.H. Wr.) Verdoorn trees within the 20 to 25 cm
DBH class the number of smaller nearest CUrtisia dentata (Burm.f.) C.A. Sm.
trees were listed according to 5 m distance classes away from the Olea (Table
la). For this specific example smaller CUrtisia occurred 22 times within 5
m from an Olea with a DBH of 20 to 25 cm, 18 times between 5 and 10 m away
from an Olea in this size class, 16 times between 10 and 15 m and so on. The
information for each of these DBH classes of the larger trees was then further

Univers
ity of
Cap
e Tow
n
47
subdivided into tables of the number of smaller trees in 5 cm DBH classes at
5 m di stance classes from the larger tree (Table lb). In this way the
distribution of smaller trees around a larger tree for a specific species
combination could be assessed.
RESULTS
The results are summarised in· Table 2. Interspeci fie competition was present
between al 1 chosen species combinations except for the mutual influence
between Pteiocelastrus tricuspidatus (Lam.) Sond. on Apodytes dimidiata E.
Mey. ex Arn. and for the influence of Olea capensis subsp, macrocarpa on
Ocotea bul lata E. Mey. The influence of larger Curtisia dentata on smaller
Podocarpus falcatus (Thunb.) R.Br. ex Mirb. became significant only when the
latter was surrounded by four or more trees. The influence of Curtisia
dentata on Pterocelastrus tricuspidatus was very weak too. The more larger
Curtisia trees surrounded smaller Pterocelastrus trees, the weaker the
influence became.
Intraspeci f ic competition was evident for Curt isia den ta ta and Apodytes
dimidiata, but not for Ocotea bul lata. For Ocotea the presence of other
larger trees of the same species enhanced the growth of the subject tree.
From the frequency tables (e.g. Table la) the relative close proximity of
trees to each other becomes apparent (Table. 2). Of the species combinations
studied between 293 and 1003 (on average 713) of the trees occurred within 15
m from each other. The subdivisions of the frequency tables (e.g Table lb}
just showed the obvious, i.e. that the closest trees of a subject species to
a larger (competing) tree of another or the same species were the smallest
trees. Larger trees were, with a few exceptions, spaced further apart than
the smaller trees. No difference in pattern between competing and non-
competing species could be detected.

Univers
ity of
Cap
e Tow
n
_j I i
I·
48
TABLE la. Number of smaller Curt isia dent a ta (in body of table) per 5 m distances away from larger Olea capensis subsp. macrocarpa trees, divided into 5 cm DBH classes.
Distance class -> O to 5 to 10 to 15 to 20 to 25 t 0 Jota1 < 5 m < 1 O m < 15 m ( 20 Ill · < 25 m < 30 Ill
Size class
1 O to < 15 cm ·3s 45 38 1 5 2 m 15 to < 20 cm 24 34 24 5 2 1 9(1
20 to < 2 5 cm 22 18 16 3 1 2 6Z
25 to < 30 cm 23 24 9 5 1 2 64
30 to < 35 cm 15 20 7 0 2 0 44
35 to < 40 cm 16 12 10 2 0 0 40
40 to < 45 cm 18 17 6 3 0 0 44
45 to < 50 cin 9 11 3 1 1 0 25
50 to < 55 cm 8 10 4 2 0 0 24
55 to < 60 cm . 8 9 5 0 0 0 22
60 to < 65 cm 4 6 2 0 0 0 12
6 5 to < 70 cm 2 3 0 0 0 0 5
75 to < 80 cm 1 0 0 0 0 0 1
iota l 186 209 124 28 12 7 566
TABLE lb. Number· of smaller CUrtisia dentat8 trees (divided into 5 cm DBH classes) per 5 m distance classes away from Olea capensis subsp. macrocarp8 trees with a DBH of 20 to less than 25 cm.
Size class -> 5 to < 10 to < 15 to < 20 to < 25 to < 30 to < 35 to < Total 10 cm 15 Cll 20 cm 25 Cll ·30 cm 35 cm 40 cm
Distance ciass
O to < 5 11 12 5 5 0 0 0 0 22
5 to < 10 11 11 3 3 1 0 0 0 18
toto<t5m 11 5 0 0 0 0 0 16
i 5 to < 20 m 1 0 2 0 0 0 0 3
20 to· < 25 m 1 0 0 0 0 0 0 1
25 t 0 < 30 11 1 0 1 0 0 0 0 2
Total 37 13 11 1 0 0 0 62
---------·---·---------···-·- --~--· - ----·
_J

Univers
ity of
Cap
e Tow
n
51
the stronger competitors in terms of diameter growth under the present circum
stances.
Despite the evidence that Olea capensis subsp., macrocarpa is one of the weaker
competitors, that its mortality rate is relatively high (Van Daalen 1991) and
that it is a weak "gap-filler" (Cameron, in preparation) it is by far the most
abundant tree in the forest, both in areas that have been harvested and in
unharvested areas (Cameron, in preparation; Geldenhuys, 1980). The reasons
for this contradiction are not clear. There must be other trades which
enables it to maintain.dominance. Possibly one should measure competition in
terms of crown size and/or volume, and one could look at its seed dispersal
pattern and its growth development during the sapling stage.
Van Daalen ( 1991) suggested that there might be strong competition among
coppice shoots of Ocotea bullata. The stump of this species often coppices
prolifically after the felling of the bole. Of these shoots only a few
surv~ve. With a few exceptions all the Ocotea trees measured on the study
site were single-stemmed trees and Van Daalen' s suggest ion could not be
tested. It is, however, clear that the close proximity of other trees of this
species (883 of the trees occurred within 15 m from each other despite the
fact that there were only 60 on the whole study site - see Table 2) is
beneficial to the tree. Exactly why is not clear. The species does tend to
occur in clumps (LUbbe, 1989) .. If intraspecific competition within this
species was prevalent, clumping would probably not have occurred.
Until recently harvesting of different tree species from the forests was done
strictly according to the relative proportion of each species in the forest
(Seydack et al. 1982; 1990). Even when a species was not utilisable, the same
proportion of the growing stock of that species was removed from ·a product ion
compartment as was removed from the utilisable species' stock. With the
latest adjustment to the management system this requirement has effectively
been dropped (Kobrie Vermeulen, personal communication, 1992). For the weak
competitors this proportionality during harvesting would not have been
necessary. These species' numbers would have been kept down by competition
from the strong competitors.
To a certain extent the close proximity of the smaller trees to the larger
Univers
ity of
Cap
e Tow
n
52
ones is an artifact of the abundance of smaller trees of several species on
the study site (Table 2). This is confirmed· by a significant Spearman
correlation ~efficient (P = 0.024) for the number of smaller trees within 15
m from the larger trees for each species combination.
The similarity of the average distances between competing and non-competing
species could be the result of the stocking density of the forest. Most of
the trees in the southern Cape forests are shade-tolerant and can grow in
close proximity to other trees, despite the fact that the growth rat~ of
various species is retarded by competition. This could in part explain why
trees of equal size in natural forests can have vastly different ages.
In the light of the above, spacing of trees (hypothesis 3) must be taken into
account for those species that are influenced by competition. This implies
that the forest manager must know which species combinations will influence
each others growth. For example, Ocotea bul la.ta can grow in the immediate
proximity of Olea capensis subsp. macrocarpa without any effect on its growth
rate, but both Podocarpus species' growth will be hampered by a larger Olea.
close by. On the other hand, a smaller Olea tree wi 11 not affect a Podocarpus
tree's growth significantly. The opposite would rather happen.
In summary, the following practical conclusions for the forest manager can be
made:
* There is no danger of decreasing the numbers of the Podocarpus species
during normal harvesting levels. To the contrary, these species seem
to have the abi Ii ty to increase their numbers.
* There is no evidence that Olea capensis subsp. macrocarpa affects the
growth of Ocotea bull a ta and they need not be "freed" from Olea trees.
* The more pioneer-like species appear to be the weaker competitors in
the present successional stage of the forest. This confirms Van
Daalen's (1991) conclusion that the southern Cape forests are in an
advanced successional stage. To increase the growth rates of selected
more pioneer-I ike tree species the standing stock wil 1 have to be
reduced substantially to push the forest into an earlier successional
t t ' !
Univers
ity of
Cap
e Tow
n
53
stage favourable for the growth and development of these species.
Although the principle of substantial growth stock reduction to
accelerate growth is/has been applied in various tropical forests of
the world (Mai tre, 1987) the present pol icy for. the southern cape
forests does not al low this (Seydack et al., 1982). Furthermore, the
results of this study and those reported by Van Daalen (1991) suggest
that such a stock reduction will be detrimental to the growth rate of
the two most ·Valuable species, viz Ocotea bullata and Podocarpus
la ti folius.
* The role of Olea capensis subsp. macrocarpa is not yet fully understood
and should be the subject of further study. Why is it so abundant?
How does it maintain its abundance in the light of the results of this
and Cameron's (in preparation) studies? What will be the effect of the
removal of dominants of this species out of a compartment used for har
vesting timber?
* The emphasis placed on mortality pre-emption during the harvest
selection in the forest appears to be sound. Suppressed trees will have
a greater chance of dying than healthy trees with enough growing space.
These suppressed trees will be those selected for felling first,
provided the select ion criteria accurately reflect signs of suppres
sion.
ACKNO'WLEOOEMENTS
Initially the study formed part of the conservation research programme of the
Directorate of Forestry, Department of Environment Affairs, now the Department
of Water Affairs and Forestry. It was completed under the Programme for Eco
system Management Services of the Division for Forest Science and Technology
(FORESTEK). Dr CJ Geldenhuys, now of FORESTEK, did the original survey of
the study site in 1974. He is thanked for allowing me to continue the study
and for commenting on the draft paper. Dr Derek Ber 1 iner of FORESTEK provided
useful comments too.
r '

Univers
ity of
Cap
e Tow
n
•
54
REFERENCES
CAMERON, M.J., in preparation. Treefal l gaps and forest dynamics. A
comparative analysis of harvested and unharvested forests in the
Southern Cape forests. M.Sc. Thesis, University of Cape Town.
CLARK, P.J. & EVANS, F.C., 1955. On some aspects of spatial pattern in
biologieal populations. Science 121:445-453.
CONNELL, J. 1983. On the prevalence and relative importance of interspecific
competition: evidence from field experiments.
108:207-228.
American Naturalist
CONNELL, J.H., TRACEY, J.G. & WEBB, L.J. 1984. Compensatory recruitment,
growth, and mortality as factors maintaining rain forest tree
diversity. Ecological Monographs 54(2):141-164.
COTTAM, G. & CURTIS, J. T., 1956. The use of distance measures in
phytosociological sampling. Ecology 37(3):451-460.
DANIELS, R. F. 1983. Simple competition indices and their correlation with
annual loblolly pine growth. Forest Science 22:454-456.
FRANCO, M. & HARPER, J.L. 1988. Competition and the formation of spatial
pattern in spacing gradients: an example using Kochia scoparia.
Journal of Ecology 76:959-974.
GELDENIIDYS, C.J. 1975. Die kunsmatige vestiging van inheemse bos in die Suid
Kaap. Forestry in South Africa 16:45-53.
GELDENIIDYS, C.J., 1980. The effect of timber production on floristics and
growing stock in the southern Cape indigenous forests. South African
Forestry Journal 113:6-15.
HASTINGS, A. 1987. Can competition be detected using species co-occurrence
data? Ecology 68(1):117-123 .

Univers
ity of
Cap
e Tow
n
55
HUSTON, M.S. 1979. A general hypothesis of species diversity. American
Naturalist 113:81-101.
LORIMER, C.G. 1983. Tests of age-independent competition indices for
individual trees in natural hardwood stands. Forest Ecology and
Management 6:343-360.
LtiBBE, W.A., 1989. Some aspects of the autecology of Ocotea bullata (Burch.)
Baillon (Lauraceae) with emphasis on response to certain stress
factors. M.Sc. thesis, University of Stellenbosch.
MAITRE, H.F., 1987. Natural forest management in Cote d'Ivoire. Unasylva
157/158 Vol 39:53-60.
MONSERUD, R.A. 1976. Simulation of forest tree mortality. Forest Science
22:438-444.
MUGASHA, A.G. 1989. Evaluation of simple competition indices for the
prediction of volume increment of young jack pine and trembling aspen
trees. Forest Ecology and Management 26:227-235.
MURRAY, B.G., Jr. 1986. The structure of theory, and the role of competition
in community dynamics. Oikos 46:145-158.
PEET, R.K & CHRISTENSEN, N.L. 1987. Competition and tree death. Bioscience
Vol. 37 No. -8:586-595.
PHILLIPS, J.F.V. 1931. Forest-succession and ecology in the Knysna region.
Government Printer, Pretoria.
POYNTON, R. J. 1971. Si lvicul tural maps of southern Africa. South African
Journal of Science 67:58-60.
SACS, 1980. Stratigraphy of South Africa. Part 1. Lithostratigraphy of the
Republic of South Africa, South-West Africa/Namibia, and the Republics
of Bophuthatswana, Transkei and Venda. South African geological survey
handbook No. 8.

Univers
ity of
Cap
e Tow
n
56
SCHOENER, T. 1983. Field experiments on interspecific competition. American
Naturalist 122:240-285 .
. SCHULZE, R.E. & McGEE, O.S., 1978. Climate indices and classifications in
relation to the biogeography of southern Africa. In: Werger, M.J.A.
(ed.) Biogeogra.phy and ecology in southern Africa. Dr W. Junk b.v.
Publishers, The Hague. pp. 19-52.
SEYDACK, A.H.W., GREWAR, S.G. & VAN DIJK, D. 1982. Proposals for a management
system for the indigenous forests of the southern Cape and Tsitsikamma.
Dept. of Environment Affairs, ~npublished report.
SEYDACK, A.H.W., VAN DAALEN, J.C., VAN DIJK, D., REYNELL, D., HEYNS, H.,
JOOSTE, A., FERGUSON, M., PITCHFORD, W., DURHEIM, G. & WILLEMS, D. 1990.
Yield regulation in the Knysna forests. South African Forestry Journal
No. 152:50-61.
SMITH, T.M. & GOODMAN, P.S. 1986. The effect of competition on the structure
and dynamics of Acacia savannas in southern Africa. Journal of Ecology
74:1031-1044.
STRONG, D.R., SIMBERLOFF, D., ABELE, L.G. & THISTLE, A.B. (eds) 1984.
Ecological communities: conceptual issues and the evidence. Princeton
University Press, Princeton, New Jersey, USA.
TOERIEN, D.K., 1979. The geology of the oudtshoorn area. Government Printer,
Pretoria.
VAN DAALEN, J.C. 1991. Forest growth: A 35-year southern cape case study.
South African Forestry Journal 159: 1-10.
VAN DIJK, D. 1987. Management of indigenous high forests. In: Von Gadow, K.,
Van der Zel, D.W., Van Laar, A., Schonau, A.P.G., Kassier, H.W.,
Warkotsch, P.W., Vermaas. H.F., Owen, D.L. & Jordaan, J.V. (eds).
Forestry Handbook. South African Institute for Forestry, Pretoria .. pp.
454-464.

Univers
ity of
Cap
e Tow
n
57
VON BREITENBACH, F. 1974. Southern Cape forests and trees. Government
Printer, Pretoria.
WEBB, L.J. 1959. A physiognomic classification of the Australian rainforests.
Journal of Ecology 47:551-602.
WEINER, J. 1984. Neighborhood interference amongst Pinus rigida individuals.
Journal of Ecology 72:183~195.
WEATIIER BUREAU, 1986. Climate data of South Africa. Climate statistics up
to 1984. Government Printer, Pretoria.
WELDEN, C.W., .SLAUSON, W.L. &WARD, R.T., 1988. Competition and abiotic
stress among trees and shrubs . in northwest Colorado. Ecology
69(5}: 1566-1577.
WHITE, F. 1978. The Afromontane region. In: Werger, M.J .A. (ed.) Biogeography
and ecology in southern Africa. Dr W. Junk b. v. Publishers, The Hague.
pp. 464-513.
ZEIDE, B. 1985. Distance to point-sampled trees and their diameters. Forest
Ecology and Management 11:131-137.

Univers
ity of
Cap
e Tow
n
· CHAPTER 4
TREE GROWnI INDICATORS

Univers
ity of
Cap
e Tow
n
THE VALUE OF CROWN POSITION AND FORM AS GROWTH
INDICATORS IN MIXED EVERGREEN FOREST
J C van Daalen1
Division of Forest Science and Technology
CSJR, P 0 Box 395
Pretoria 0001
SYNOPSIS
Diameter increment over a 13 year period was correlated with crown posit ion and crown form scores for a range of southern cape forest tree species. It was found that both crown position and form are useful variables for the selection of harvest trees of the canopy species. The growth of subcanopy species was, in general, not related to the crowns' positions in the canopy. Crown form was, however, significantly correlated with the growth of some subcanopy species. For all the tree species (mainly canopy species) for which increment was significantly correlated with both crown position and crown form, the crown position and crown form scores were significantly related.· This indicates that the exposed crowns had bette·r forms, implying that competition does have a significant influence on the growth of these trees.
INTRODUCTION
· The management of the mixed evergreen southern cape forests is based on a
system where single trees are selected for harvesting. These trees are
selected in such a way that mortality is as far as possible pre-empted. For
this purpose senility indices, such as stem rotting, dying, damage and agony
shoots, are used (Seydack et al., 1990; Kobrie Vermeulen, personal communi
cation, 1992). However, frequently a suppressed tree cannot be distinguished
from a tree with high vigour on the basis of the above-mentioned senility
criteria and further indicators are needed.
The posit ion of a tree's crown in the canopy and in re lat ion to its
neighbours' crowns, irrespective of the size of its bole, can serve as an
1 Present address: P 0 Box 4715 GEORGE EAST 6539 South Africa

Univers
ity of
Cap
e Tow
n
. 60
index of dominance, competitive status or canopy exposure. Studies in
plantations and homogeneous natural stands have shown that subdominant or
concealed (overshadowed by larger trees) trees generally are growing more
slowly than exposed or dominant trees. A similar correlation between a tree's
crown position and the rate of increment can be expected in mixed forests.
An index of crown position is regardedasmost important for reliable timber
growth mode ls (Synnott, 1979) ,· Dawkins (1963, ex Synnott, 1979) found that
crown posit ion scores were better correlated with increment than other
measures of the environment and was the only significant environmental
variable in his regression equations.
Trees growing in the shade of others will react in various ways, such as
reduced height growth (Oliver and Larson, 1990), altered crown architecture
(Halle, 1976; Waring and Schlesinger, 1985) and crown volumes (Brunig, 1983),
the development of asymmetric crowns (Young and Hubbell, 1991) and in extreme
cases of suppression, the loss of conducting tissue, little taper in tree
stems, reduced root growth, red~ced seed production, low carbohydrate reserves
and a resultant susceptibility to wind and· snow damage (Waring, 1987).
Height growth can be reduced significantly. Various authors have shown that
understorey trees often exhibit periodic slowdowns and accelerations of height
growth as they are released by thinnings and later suppressed again by the
reclosing overstorey (Jaeck et al. 1984; Oliver and Larson, 1990). In
(sub)tropical forests reduced height growth of trees will result in their
shading by others, which in turn wi 11 affect their crown shapes. Shade on the
side of a crown affects the growth of the shaded branches (01 iver and Larson,
1990). Each branch must photosynthesize enough to maintain its growth and
survive. Where shade limits photosynthesis on a side of a crown, lateral
shoot growth is reduced (Cochrane and Ford, 1978) and the symmetry of the
crown affected. Trees tend to lean away from the shade. This could be the
result of the trees actually growing towards the sunlight or the heavier
portion of the crown on the more sunny side of the tree pulling it away from
the shade (Oliver and Larson, 1990). Young and Hubbell (1991) have shown that
crown asymmetry affects the direction and frequency of treefalls in the Barro
Colorado tropical forest in Panama. They suggested that by incorporating
crown asymmetry and the neighbourhood relations that cause it, treefalls will
become more predictable. Dawkins (1963, ex Synnott, 1979) described his crown
I ! l
Univers
ity of
Cap
e Tow
n
61
form score "as an index of quality, its value being dependent on past history
and perhaps indicating future potential".
Crown size is often proportional to tree height, especially in trees with
strong epinast ic control, as is usually the case with conifers. , In trees
growing without competition height is, therefore, correlated with foliage area
and total tree volume increment. This explains why the height of dominant
trees in even-aged stands is an expression of site index (Oliver and Larson,
1990). Epinastic control· in tropical forest trees is often weak, and the
relation between crown size and height growth can be expected to be weaker
than in the case of conifers. However, the shading of trees will no doubt
affect the crown size and height growth of suppressed trees.
Crown size is very difficult and time consuming to measure in the mixed
(sub)tropical forests, such as the southern Cape forests. Crowns intermingle
to such an extent that the distinction of a specific crown is difficult, let
alone measuring its dimensions.
Crown position and crown form are quick and easy to assess, and the value of
these two parameters as growth indicators were evaluated in this study. The
following hypotheses were tested for a mixed evergreen subtropical (Phillips,
1931; Webb, 1959) Afromontane (White, 1978) forest stand in the southern Cape:
1. Diameter increment of trees growing in full sunlight is faster
than trees growing in the shade of others.
2. Diameter increment and crown form are positively related, i.e.
the closer the crown conforms to a complete circle, the better
diameter growth can be expected.
In addition, the relation between crown position and crown form of a tree was
tested.
STIJDY AREA
The study was done in forest stand on the Diepwalle State Forest (33°56'S,

Univers
ity of
Cap
e Tow
n
62
23°09'E), 20 km north of Knysna (Figure 1). It is representative of the
stands from whjch timber is extracted (Von Breitenbach, 1974; Van Dijk, 1987).
The main canopy is 18 to 22 m high. A dense shrub layer, composed mainly of
Trichocladus crini tus (Thunb.) Pers. grows up to 4 m tal I. Ground vegetation
is relatively abundant. Since 1954 no timber was extracted from this stand.
FIGURE 1.
Study Area
r N •• f ~~ .. t. ,,. , ,
".;. .,,, \~' ' ...
INDIAN OCEAN
Location of study area within the mixed evergreen forest (black areas) north of Knysna, South Africa.

Univers
ity of
Cap
e Tow
n
63
The climate is warm temperate subhumid to humid (Poynton, 1971; Schultze &
McGee, 1978; Walter, 1979). Mean annual rainfall is about 1200 mm with a more
or less even distribution throughout the year (Weather Bureau, 1986).
The specific area used for this study is more or less level. Soils are heavy,
with a gravelly (silcrete) subsoil. The area is underlain by fine to coarse
grained brownish sandstone of the Goudini format ion (former Tchando format ion)
(Toerien, 1979) of the Table Mountain group (SACS, 1980).
METIIODS
In 1974 the DBH (diameter at breast height, i.e. 1. 3 m above ground level) of
all trees on the whole forest compartment with a DBH ~ 10 cm were measured.
A unique number was painted on each tree and the exact point of measurement
was marked. In 1987 a 2.86 ha plot was selected and the DBH's remeasured on
the marked points. At the same time the crown posit ion and crown form of each
tree was assessed according to Dawkins' scores as reproduced in Synnott ( 1979)
(Figures 2a & 2b) .
The measured diameter increment for each tree species with ten or more speci
mens on the plot was correlated with its crown position and crown form scores
by means of the non-parametric Spearman rank correlation coefficients. The
same method was used to calculate the correlation between each species' crown
. position and form scores (Table 1).

Univers
ity of
Cap
e Tow
n
64
TABLE 1. Spearman correlation coefficients between DBH increment and crown position, DBH incr~ment and crown form, and between crown position and crown form. The correlation coefficients are indicated by "r"., "P" indicates probabi l'ity > /r/ under H0:p=O and "n" represents the sample size. The median and range values are for the crown position and crown form scores. The probabilities for significant correlation coefficients are shaded. For significance level of 1% or Jess the probabilities are printed in bold. The species are arranged in descending order ·according the median crown position and crown form values.
01 inia ventosa
Olea capensis subsp. macrocarpa
n
16
585
Increment x crown position
r p Median (range)
Increment x crown form
r p Median (range)
0.1.115 0.6647 3 (2-5)
Crown position x crown form
p
Podocarpus 316 O. 2092 [~i~P.'2~~::~'.:' 3 ( 1-5) O. 3116 ;::11i~°i:}: 3 ( 1-5) O. 1 8 7 3 :_;_·_,_:.:_~,f.~.'.;_:_( __ :_~_-_;:·'.~_.·.:.~_.'.',i •. _:_·,· •.. :.'_0o_.·.··.,_,_;_'.~.-,•.i·:',·._:•1_.-~_.?,.'. .. _'..:,· ._.'.'.~_] 1t--1s_t_1_·,_0_1_iu_s ________ +------+--------·..,~ ••. ·.'_,',,.-_•_.-7.·.-•_·,·_.:, •• _·~:_:_:_•_~_·-·:~•-.:_.••.-:·:.~_'_i_?_~_·.--.~-~_'o•_~,,_;_··;':··.~.;_.·.·_.-.· .. • •. • •. .._-------+--------+~•0~0-!~~-!-~-~*;--------+-------~·~:-.~~--,.....,,.4
Psydrax obovata 51 03872 ·.v _,.. . 3 (1-5) 03785 1Mi~~i..: 3 (1-5) o.3925 1~~~(i:"0~~-~:.'.r Ocotea bu11ata
Apodytes dimidiata
Curtiss dents.ta
27
98
174
0.2327 0.2428 3 (1-5)
n-P_,:'_1_'::_a_~_:':: __ s ________ +-__ 19 __ -+-_o_._8_0_91 __ ~f~~ .... ~f(N'~""~x~4
4" __ 2 __ c_1-_5_>--1--o-._5_45-o~~'~~t~~~'~l~~~~~!+-3--<_2_-5 __ >-+--o-._5_1_4_5--+~~1~~r~~-~~~-~~~~-~""~ Canthium mundianum
Cassine papi11oss
Nuxia f1oribunds
Pteroce7sstrus tricuspidatus
Cassine euc1eiformis
Gonioma kamassi
32
114
33
. 92
13
269
0.2872 0.1109
0.0702 o. 4577
0.2649 0.1362
0.2069
-0.4261 0.1466
0.0976 0.1104
2 (1-4)
2 (1-5)
1.5 ( 1-4)
1 (1-2)
1 · ( 1-4)
0.2346 0.1961 3 (1-4}
0.2006 0.0552 2 (1-5)
0.4309 0.1416 4 (1-5)
0.2794 0.1215
0.2386
0.2669
0. 2841 I ...... 'i
.· •• >
0.0441 0.8861
0.1072
0.3014 a-0-wh...:i~-t-:-~-~-~s---------+-----+-------+-------+-----__,.._o_._3_1_1_0_ ~tl~liiii,i _3 __ <_1_-_4_> ..,... ______ _ 47 0.2212 0.1351 (1-4)
Lachnosty7 is hirts
Haytsnus peduncu1sris
Ochna arbores
07ea cspensis subsp. cspensis
Burche11is buba1ina
46
56
50
21
18
-0.1334 0.3769
0.1554 0.2529
-0.3005
-0.0308 0.8946
0.2464 0.3244
1 (1-4) 0.4194 2 (1-4} 0.3163
(1-5) 0.3575
(1-4) 0.2150 0.1339 2 (1-4} -0.0182 0.9002
(1-4) 0.0302 0.8965 2 (1-3) 0.3032 0.1816
(1-2) 0.2056 0.4130 2 (1-4} 0.6708

Univers
ity of
Cap
e Tow
n
r
65
,.
FIGURE 2a. Crown position scores (reproduced from Synnott, 1979).

Univers
ity of
Cap
e Tow
n IRREGULAR CIRCLE
HALF-CROWN
~{) '(_J
LESS THAN HALF CROWN
[\1 ~·
ONE OR FEW BRANCHES
66
PERFECT
TOLERABLE
·l
VERY POOR
FIGURE 2b. Crown form scores (reproduced from Synnott, 1979).
T i
Univers
ity of
Cap
e Tow
n
67
RESULTS
Significant correlation coefficients were more common among the species with
the higher crown position and crown form scores. For the majority of species
the crown position and crown form scores were significantly correlated. Note
that for all the species with significant correlation coefficients for
increment x crown position the upper limit of the crown position score was 5,
i.e. emergents in terms of the scores used (Figure 2a). The only exceptions
were Pterocelastrus tricuspidatus (Lam.) Send. and Ochna arborea Burch. ex oc. Despite the occurrence of scores of 5, the majority of crown position scores
were very low for these two species (median values of 1. 5 and 1 respectively).
The same tendency can be observed for the crown form scores, although not as
conspicuous as for the crown posit ion scores. Al 1 the species with signi
ficant correlation coefficients for increment x crown form had upper crown
form scores of 4 or 5.
DISCUSSION
Both crown posit ion and crown form seem to be factors control ling the diameter
growth rate of a variety of forest tree species in the southern Cape. This
confirms Van Daalen's (in preparation) results of the significant roles of
inter- and intraspecific competition in the forest. Although many of the
species can survive shading for considerable periods' release into full
sunlight accelerate the growth rates. Due to the positive relation between
crown position and crown form such a release will probably improve the crown
form too.
The lack of any relation between DBH increment and crown position for Ocotea
bullata (Burch.) E. Mey. emphasizes its ability to grow beneath other trees
(Van Daalen, in preparation). Although it does reach the canopy or can grow
in the open (the maximum crown position score was 5), it is not dependent on
ful I sunlight for its growth. · For this reason it cannot be classified as a
true subcanopy tree, as can be done with species such as Cassine eucleiformis
(Eckl. & Zeyh.) Kuntze, Gonioma kamassi E. Mey., Diospyros whyteana (Hiern)
F. White, Lachnostylis hirta (L.f.) Muell. Arg., Ochna arborea Burch. ex OC.,
O 1 ea capens is L. subsp. capens is and Burche 11 i a buba Jina ( I. f. ) Si ms . A 11 the
1

Univers
ity of
Cap
e Tow
n
68
subcanopy species have median crown scores of 1 and no significant correlation
between DBH increment and crown position, except for Ochna arborea. This
latter species' growth was actually enhanced by shading (the significant
correlation was negative). Several of these subcanopy species had, however,
significant positive correlation coefficients between increment and crown form
scores. This indicates that, al though the tree can grow in the shade of
others, it still needs a good crown form, and implicitly enough foliage, to
grow wel 1. ·
The hypotheses of dependence of diameter growth on crown position and crown
form must be accepted for the canopy emergents. Except ions are OJ inia ventosa
(L.) CUfod. and Ocotea bullata. Olinia ventosa is the fastest growing, shade
intolerant, pioneer-like species (Van Daalen, 1991) for which full sunlight
is of utmost importance for its growth and survival. For Ocotea bullata a
good crown form and enough foliage are much more important than its position
in the canopy.
For the ·subcanopy species the first hypothesis (of a positive re lat ion between
increment and crown position) can, in general, be rejected. The second hypo
thesis (of a positive relation between increment and crown form) can be
accepted for certain subcanopy species and rejected for others.
Thus, crown position and crown form can be used during the harvest selection
process for those species that are normally part of the main canopy, keeping
in mind the special cases of Olinia ventosa and Ocotea bullata. There is no
single criterion for select ion and the better the manager knows the dynamics
of the forest under his control, the better he will be able to manage.
In the light of the abOve the selective opening of the canopy (e.g. during
selective harvesting of trees) will be beneficial for the canopy species,
except for Ocotea bul lata. This confirms Van Daalen' s (in preparation)
conclusion that Ocotea bul lata need not be "freed" from Olea capensis L.
subsp. macrocarpa (C.H. Wr.) Verdoorn. The latter species tends to form heavy
crowns and due to its abundance in the forest (Geldenhuys, 1980) often
dominates the crown. Therefore, the "freeing" of the more valuable (in terms
of timber) canopy species could increase production without disturbing the
forest ecology, provided it is done in a conservative way. Stock reduction

Univers
ity of
Cap
e Tow
n
69
to the point where the growth of pioneer-I ike species such as OJ inia ventosa
L. (CUfod.) is enhanced wi 11 be detrimental to the growth of some of the
valuable timber species such as Podocarpus Jatifolius (Thunb.) R. Br. ex Mirb.
(Van Daalen, in preparation).
ACKNQWLEOOB.IBNTS
The study formed part of the activities of the Programme for Ecosystem
Management Services of the CSIR Division of Forest Science and Technology
(FORESTEK, formerly the South African Forestry Research Institute). It was
funded by the Department of Water Affairs and Forestry (Forestry Branch).
Dr C J Geldenhuys of FORESTEK is thanked for commenting on the draft paper.
REFERENCES
BRUNIG, E.F. 1983. Vegetation structure and growth. In: Golley, F .B. (ed.).
Ecosystems of the world 14A: Tropical rain forest ecosystems. Structure
and function. Elsevier Scientific Publishing Company, Amsterdam.
COCHRANE, L.A. AND FORD, E.D. 1978. Growth of a sitka spruce plantation:
Analysis and stochastic description of the development of the branching
structure. Journal· of Applied Ecology 15: 227-244.
GELDENHUYS, C.J. 1980. The effect of timber production on floristics and
growing stock in the southern cape forests.
Journal 113:6-15.
South African Forest~v
HALLE, F. 1976. Architectural variation at the specific level in tropical
trees. In: Tomlinson, P.B. and Zimmermann, M.H. (eds). Tropical trees
as Jiving systems. Cambridge University Press, Cambridge. pp 209-221.
JAECK, L.L., OLIVER, C.D. and DEBELL, D.S. 1984. Young stand development in
coastal western hemlock as influenced by three harvesting regimes.
Forest Science 30:117-124.

Univers
ity of
Cap
e Tow
n
69a
OLIVER, C.D. and LARSON, B.C. 1990. Forest stand dynamics. McGraw-Hi 11, New
York.
SEYDACK, A.H. W. , VAN DAALEN, J.C. , VAN D IJK, D. , REYNELL, D. , HEYNS, H. ,
JOOSTE, A., FERGUSON, M., PITCHFORD, W., DURRHEIM, G. and WILLEMS, D. 1990. - .
Yield regulation in the Knysna forests. South African Forestry Journal
152:50-61.
PHILLIPS, J .F. V. 1931. Forest-succession and ecology in the Knysna region.
Government Printer, Pretoria.
POYNTON, R.J. 1971. Silvicultural maps of southern Africa. South African
Journal of Science 67:58-60.
SACS, 1980. Stratigraphy of South Africa. Part 1. Lithostratigraphy of the
Republic of South Africa, South-West Africa/Namibia, and the Republics
of Bophuthatswana, Transkei and Venda. South African geological survey
handbook No. 8.
SCHULZE, R.E. & McGEE, O.S., 1978. Climate indices and classifications in
relation to the biogeography of southern Africa. In: Werger, M.J.A.
(ed.) Biogeography and ecology in southern Africa. Dr W. Junk b.v.
Publishers, The Hague. pp. 19-52.
SYNNOTT, T.J. 1979. A manual of permanent plot procedures for tropical
rainforests. C.F.I. Tropical Forestry Papers No. 14.
TOERIEN, D.K., 1979. The geology of the Oudtshoorn area. Government Printer,
· Pretoria.
V~ DAALEN, J.C. In preparation. The effect of competition on timber growth
in a mixed evergreen forest stand. South African Forestry Journal.
VAi~ DAALEN, J.C. 1991. Forest growth: A 35-year southern cape case study.
South African Forestry Journal 159:1-9.

Univers
ity of
Cap
e Tow
n
69b
VAN DIJK, D. 1987. Management of indigenous high forests. In: Von Gadow, K.,
. Van der Zel. D.W., Van Laar, A., Schonau, A.P.G., Kassier, H.W.,
Warkotsch, P.W., Vermaas, H.F., OWen, D.L. & Jordaan, J.V. (eds). Forestry
Handbook. South African Institute for Forestry, Pretoria. pp. 454-464.
VON BREITENBACH, F. 1974. Southern Cape forests and trees. Government
Printer, Pretoria.
WALTER, H. 1979. Vegetation of the earth and ecological systems of the geo
biosphere, Second edition. Springer-Verlag, New York.
WARING, R.H. 1987. Characteristics of trees predisposed to die. Bioscience
37(8):569-574.
WARING, R.H. and SCHLESINGER, W.H. 1985. Forest ecosystems: concepts and
management. Academic Press, Orlando.
WEBB, L.J. 1959. A physiognomic classification of the Australian rainforests.
Journal of Ecology 47:551-602.
WEATIIER. BUREAU, 1986. Climate data of South Africa. Climate statistics up
to 1984. Government Printer, Pretoria.
WHITE, F. 1978. The Afromontane region. In: Werger, M.J.A. (ed.) Biogeography
and ecology in southern Africa. Dr W. Junk b.v. Publishers, The Hague.
pp. 464-513.
WHITE, F. 1978. The Afromontane region. In: Werger, M.J.A. (ed.) Biogeography
and ecology in southern Africa. Dr W. Junk b.v. Publishers, The Hague.
pp. 464-513.
YOUNG, T. P. and HUBBELL, S. P. 1991. Crown asymrne try, tree fa 11 s, and repeat
disturbance of broad-leaved forest gaps. Ecology 72(4):1464-1471.

Univers
ity of
Cap
e Tow
n
70
Research note
Cambial Electrical Resistance as an Indicator of Tree Growth in the Southern Cape Indigenous Forests
J.C. van Daalen
South African Forestry Research Institute SaaSl'eld Forestry Research Centre
Private Bag X6515 George 6530
SYNOPSIS
The usefulness of cambial electrical resistance readings, measured with a Shigometer, to indicate growth rates of indigenous forest trees, to detect trees with a reduced growth rate as a result of pathogen infection, and to compare tree vigour of indigenous and alien trees was tested. Although significant correlation coefficients between resistance readings and growth rates were obtained. standard deviations were too high to be useful for indigenous forest management purposes.
INTRODUCTION
Owing to the multiple use and limited area of indigenous forests in South Africa, over-exploitation of timber can cause untold damage to these forests. Underutilisation, on the other hand, will result in loss of the limited and extremely valuable indigenous timber. The backbone of the intensive management of those indigenous forests in the southern Cape used for timber production (Seydeck et al., 1982) is the proper marking of trees for removal. No matter how good a managei:nent system is, if the marking process fails the whole system fails.
Frequently, a suppressed tree in the indigenous forest cannot be distinguished from a tree with high growth vigour. Therefore, during forest management for timber production, trees are marked for removal according to their size and, where possible, according to other silvicultural criteria, like apparent competition, health condition etc.
In order to try to quantify the selection of trees, an instrument to measure the cambial resistance of trees, called a Shigometer (after Dr Alex Shigo. its inventor) was tested*.
Fungal pathogens can affect a tree's vigour in the same way as when it is suppressed. Therefore. electrical resistances of healthy and Phytophthora cinnamomi affected Ocotea bullata trees were measured to determine whether the affected trees could be separated from healthy trees on this basis.
In the eastern Cape resistance readings on Rapanea
*For the purpose of the study a Shigometer was provided by the local agents, Holley Marketing (Pty) Ltd, Pietermaritz burg.
44
melanophloeos under alien trees were compared with readings on R. melanophloeos trees in forest. Resistance readings on two alien species growing together were also compared.
Analyses indicated high standard deviations for resistance readings for different rates of diameter growth. In an attempt to explain this, experimental errors for increment measurements were determined.
In summary then, the following was tested:
1. Do cambial electrical resistance readings (measured with a Shigometer) indicate growth rates of forest trees reliably?
2. Can reduced vigour in pathogen affected forest trees be detected with a Shigometer?
3. Assuming (1) above to be true, how do alien trees ciffect tree vigour of indigenous trees?
4. Does the vigour of two (related) alien tree species growing on the same site differ?
5. Are relationships (if any) between resistance readings and tree increment rates affected significantly by errors in tree diameter and resistance measurements?
TECHNICAL DESCRIPTION OF THE SHIGO METER
The following is a summary of an information sheet on the Shigometer by OSMOSE, the manufacturers in the United States of America:
"The Shigometer is a battery powered, portable field instrument that delivers a pulsed current through a probe to wood tissues and measures the resistance of the tissues to the current. The condition of the wood at the tip of the probe is deter-
South African Forestry Journal- No. 146, September 1988

Univers
ity of
Cap
e Tow
n
mined by the pattern of measurement displayed on the digital meter. In sound wood only slight changes occur as the probe is inserted. When the probe tip passes from sound wood to discolored or decayed tissue, . . . an abrupt change occurs in the digital reading. The magnitude of change in the readings indicate the degree of tissue deterioration."
"The principle ... revolves around the cations ... that concentrate in decayed wood and the decreased resistance that results. To measure these changes a probe of two twisted copper wires is inserted into holes drilled in the wood. The probe, attached to the Shigometer by a length of flexible cable, is entirely insulated except for the tips, which are curved into a bell shape. When the exposed probe tips enter the drill hole their sides press against the walls of the
IRREGULAR CIRCLE
HALF-CROWN
~[) \_J
LESS THAN HALF CROWN
() ONE OR FEW BRANCHES
71
hole, so that the pulsed current is passed from the meter through one wire into decayed or healthy wood. The current then returns to the meter through the other wire. Readings are made in 1 000-ohms."
"The primary use of the Shigometer is to locate decay accurately in standing utility poles and piling by using the patented twisted wire probes in the groundline area."
"Using the needle probe in the cambial zone trees with relatively high vitality can be separated from trees with relatively low vitality. Trees are accurately selected for thinning, and forest stands can be indexed for growth rate. In addition, mortality can be predicted using the needle probe." This aspect was tested and will be reported on.
PERFECT
TOLERABLE
1
YERY POOR
FIGURE 1. Crown form scores (reproduced from Synnott, 1979).
Suid-Afrikaanse Bosboutydskrif- nr. 146, September 1988 45

Univers
ity of
Cap
e Tow
n
72
SOME OVERHEAD LIGHT
I I o
~~;
)99 <_,...- LOWER CANOPY
NO DIRECT
1!fil!!
!
FIGURE 2. Crown position scores (reproduced from Synnott, 1979).
METHODS
On an increment study site at the Diepwalle State Forest, north of Knysna, detailed increment measurements were made in 1972, 1978 and 1983. Tree diameter was measured at marked {l ,3 m high) points on 76 permanent sample plots and each tree numbered permanently. Four species, Podocarpus latifolius, Ocotea bullata, Apodytes dimidiata and Olea capensis subsp. macrocarpa were selected for testing the Shigometer. Of each species, trees were selected to cover the complete range of increments. Four measurements of the cambial resistance (in the four wind directions) at the point at which the diameter measurements were taken, were made.
46
These readings were correlated (data were tested for normality and a Pearson correlation was used) with
1. the mean diameter increment from 1972 to 1983 and 1978 to 1983; and
2. mean tree basal area increment from 1972 to 1983 and 1978 to 1983;
Spearman rank correlations were used (data included categorical variables) to determine the relationship between resistance readings and crown form (Figure J), crown position (Figure 2) and diameter.
South African Forestry Journal- No. 146, September 1988
·'

Univers
ity of
Cap
e Tow
n
Four cambial resistance measurements (in the four wind directions) were made on 295 Ocotea bu/Iara trees on a study site at the Witelsbos State Forest in the Tsitsikamma: 202 trees in a forest stand infested with the root pathogen Phytophthora cinnamomi and 93 trees in a control, apparently pathogen free, stand. The diameter and crown form of these trees were known (subproject 1/03/02/06/04). The crown position of each tree was estimated according to the scale in Figure 2. Spearman rank correlations were calculated between resistance readings and the different measured and estimated variables. The difference between the mean resistance readings for the P. cinnamomi infested and the control stand was tested by means of analysis of variance.
At Hogsback, in the eastern Cape. cambial resistance readings were made on Rapanea melanophloeos trees in the forest and under alien trees, mainly Acacia meamsii and Rachospermac melanoxylon ( = Acacia melanoxylon), and on A. mearnsii and R. melanoxylon trees growing together. Resistance readings were plotted against measured diameters and estimated crown positions.
To determine the sampling error in increment measurements in indigenous forest the diameter of five trees of each of four species mentioned above. representing three bark types, were measured 25 times at a marked point. To avoid bias a group of oeople were used to measure the trees. Care was taken not to let the same person measure the same trees in any fixed order. Variances were determined and sample sizes calculated using the following equation (Snedecor and Cochran, 1974):
N.05 = 4d!L2 where
73
RESULTS
The correlations between the cambial electrical resistance a11J the increment figures, and their levels of significance arc listed in Table 1. With the exception of those for Apndytes dimidiata, all the correlations were significant. However, standard deviations were very high, up to 100 % of the mean.
The Spearman rank correlation coefficients between the resistance readings and diameter, crown form and crown position for trees at the Diepwalle and Witelsbos study sites are given in Table 2. The correlations between resistance and crown condition were much weaker (half of them were insignificant) than those between resistance and diameter. and between resistance and crown position. Although the mean resistance readings for the control area at Witelsbos was slightly lower than that for the infested area (15.09 and 17.26 Kohm respectively). the difference was insignificant.
Results from the resistance measurements on Rapanea melanophloeos, Acacia mearnsii and Raclwspermae me/anoxylon are illustrated in Figures 3 to 6.
DISCUSSION
Although many of the correlation coefficients between cambial electrical resistance and increment (Table 1) were highly significant, the standard deviations were too high to use the relationships for predictive . and management purposes.
Possible reasons for the unreliable" relationships. whereas workers elsewhere obtained much better results (Davis et al., 1981; Shigo and Shigo, 1974 ), are the following:
N05 = sample size needed for a (P s 0.05) required level of accuracy
1. Increment is measured over a long period, whereas the resistance reading is taken at one point in time. Trees with relatively high increment rates might have lost their vigour shortly before measurement and vice versa. d =variance
L =maximum allowable sampling error (one direc- 2. tion).
Mean annual diz.meter increment rates for forests in the Knysna area range from 0,3 mm to 2,2 mm (J.C.
TABLE 1. Pearson correlation coefficients between cambial electrical resistance and basal area and diameter increment
Species Sample size
Podocarpus Latif olius 74 Ocotea bullata 25 Apodytes dimidiata 55 Olea capensis subsp. macrocarpa 104
• significant at 5 per cent level of probability ** significant at I per cent level of probability
DBH increment 1972~ 1983
-0,569** -0,383 -0,076
-0,555**
Suid-Afrikaanse Bosboutydskr~f- nr. 146, September 1988
Cambial electrical resistance versus
DBH Basal area Basal area increment increment increment 1972-1983 1972-1983 1972-1983
-0,567** -0,540** -0,541 ** -0,406* -0,492* -0,453* -0,054 -0,410* -0,211
-0,385** -0.583** -0,503**
47

Univers
ity of
Cap
e Tow
n
74
TABLE 2. Spearman rank correlation coefficients between cambial electrical resistance and diameter, crown form and crown position of trees at the Dicpll'a//e and Witelsbos State Forests. The latter site was divided into a forest stand infested with the root 11athogen. Phytophthora cinnamomi, and a control, apparently pathogen free, stand
Cambial electrical resistance versus
Species Location DBH
Podocarpus latif olius -0.473** (74)
Ocotea bullata Diepwalle -0,807** State (25)
Apodytes dimidiata Forest -0.822** (55)
Olea capensis subsp. -0.655*" macrocarpa (104)
0. bullata - control -0.935** area Witelshos (93)
0. hullara - infested State -0.925** area Forest
• significant at 5 per cent level of probability ** significant at 1 per cent level of probability
Numbers in brackets are sample sizes.
van Daalen, unpublished data). These slow growth rates can result in large sampling errors in diameter measurements (causing large standard deviations). This is shown in Table 3. On average 21 measurements are necessary to obtain a 1 mm accuracy (significant at 5 per cent level of probability) for diameter measurements. The normal way to overcome this problem is to measure a large number of trees, making mean values reliable. Howe\'er. the predictive values for individual trees will remain low. Contrary to the above the negative relationships between resistance readings and DBH and betw.een resistance and crown position. both at Diepwalle and Witelsbos, were highly significant and reliable (Table 2). DBH readings are several orders larger than increment readings and are much less affected by sampling errors. The negative relationships indi-
(202)
Crown Crown form position
-0,483** -0.600'"' (73) (73)
-0,239 -0.547** (25) (25)
-0.221 -0.506** (55) (55)
-0.565** -0.605*. (103) (103)
0.212* -0.801"* (93) (93)
0.116 -0.843** (202) (202)
cate that taller trees with more exposed crowns yield lower resistance readings than smaller trees with sheltered crowns. indicating faster growth of taller trees (Davis et al., 1981). This does not indicate the decreasing growth of old (senescing) trees (Phillips. 1931: Laughton. 1938: J.C. van Daalen. unpublished data), but the reason is not clear.
It was not possible to separate the apparent pathogen infested Ocotea bu/Iara trees at Witelsbos from the healthy ones on the basis of the resistance readings. The slightly higher mean resistance for the infested trees can be attributed to chance. The difference is too small to attribute it to assumed slower growth of infested trees. No independent measure of the health of the trees besides the area in which they were growing. was available. Therefore. vigorous trees in the pathogen infested stand could obscure differences in mean resistance readings that
TABLE 3. Sample sizes needed for different accuracies of DBH measurements for different species (see text for equation used}
Maximum allowable error (one-directional)
Species Bark roughness* lmm 2mm 3mm 4mm 5mm 6mm
Podocarpus Latif olius medium 14 4 2 1 Ocotea bullata coarse 33 9 -l 3 2 1 Apodytes dimidiata smooth 16 4 2 1 Olea capensis subsp macrocarpa medium 20 5 3 2 1
Mean 21 6 3 2 1
• The bark roughness indicated applies to the measured trees only. e.g. although 0. bullata bark is normally smooth. the specimens in the sample had coarse bark.
48 South African Forestry Journal- No. 146, September 1988

Univers
ity of
Cap
e Tow
n
might have been significant if infested and healthy trees could have been -,cparated individually.
As expected, resi-,tance readings did indicate faster growth for Rapanea melanophloeos trees in forest than those among alien trees (Figure 3) whereas resistance readings for Acacia mearnsii and
e eo .I:.
~ OI .e eo i ! .. i E 40 0 OI :c
en c : 20 ::E • • •
200
'\l Aepanee under alien•
• Aapanea In forest
• • • 300 400 500
DBH (mm)
FIGURE 3. Scatter diagram of electrical resistance readings (measured with a Shigometer) versus DBH of Rapanea melanophloeos trees in forest and under alien trees at Hogsback, eastern Cape.
- ~J E .I:. 0 ::.:: -
\J Repenea under aliens
• Aapanea in forest
~ '6 eo tll • .. 'V .. • - 'V • E 40 0 OI :c en
' • • • ' '
c 201 CD
G> ::E
1
•
2 3 4 5
Crown Position
FJG URE 4. Scatter diagram of electrical resistance readings (measured with a Shigometer) versus crown position of Ra pan ea melanophloeos trees inf orest and under alien trees at Hogsback, eastern Cape.
CONCLUSIONS
Given the problems with measuring growth and determining the pathogen infestation of individual trees, I could not prove that cambial electrical resistance rea-
Suid-Afrikaanse Bosboutydsknf- nr. 146, September 1988
75
e ~ ~ 0 c
i Cl ... ... Cl -GI E 0 Cl :c !/)
c Ill GI :I
Rachospermae melanoxylon were in the same range (Figure 5), indicating similar growth rates. Similar graphs for resistance reading versus crown position (Figures 4 and 6) indicate higher growth rates for trees receiving more sunlight.
80 • 'V Acacia mHrnsli
• RachoapermH melanoxyton
80 •
•o • 'V
'V
• 'V 'V 20
' • 'V v
100 200 300 400 500
DBH {mm)
FIGURE 5. Scatter diagram of electrical resistance readings (measured with a Shigometer) versus DBH of Acacia mearnsii and Rachospermae melanoxylon trees ... .:. at Hogsback, eastern Cape.
e eo ./; 0 ~ Cl c ~ 60 Cl ... ~ -Cl E 40
.~
./; I/)
c Ill 20 Cl :I
· '7 Acacia mearnsli
• Rachosparmae melanoxylon
• • ~ •
\l )
2 3 ' 5
Crown position
FJGURE 6. Scatter diagram of ilectrical resistance readings (measured with a Shigometer) versus crown position of Acacia mearnsii and Rachospermae melanoxylon trees at Hogsback, easrern Cape.
dings could indicate growth rates of forests trees reliably (question 1 ); and that these readings could indicate which trees are affected by the root pathogen
49

Univers
ity of
Cap
e Tow
n
CHAPTER 5
DATING OF TREES

Univers
ity of
Cap
e Tow
n
78
Scicnr((ic Paper
Dating of Pterocarpus angolensis Trees
J.C. van Daalen 1, J.C. Voge12, F.S. Malan3 and A. Fuls2
I. P.O. Box 47 I 5. George East 6539 (fi1rmff/y: Di1·ision of Fores/ Scienn' and 1 e< -/1110/ogY. CSIR. P.O. Box 395. Preroria 0001)
2. Dil'isinn 1~{ Earrh. Marine and Armospheric Science and TechnolngY. CSIR. P.O. Box 395. Pretoria 0001 3. Dirisinn of Fores/ Science and TechnologY. CSIR. P.O. Box 395. Pretoria 0001.
SYNOPSIS
Samples of Pterornrp11s 11ngole11.1is collected in KaNgwane were dated hy mean<, of (a) the C 14 dating method. (b) Yisual ring counting. (c) counting of rings on X-ray photograph" taken from the transverse surfaces of <..ample" cut from tree hole<,. and (d) hy using radiation densitometry. C 14 dating nf some forest trees of known age prmided accurate results. Therefore. the ages of the P1aocarp11s trees detern1ined in this wa) were accepted as correct. Visual ring counting and counting of rings on X-ray photographs is suhjectiw and experience is necessary to provide reliahle age estimate" in the"e ways. C14 dating of tree ... is expensiw and takes a fe\\ months to L·omplcte. but it is the most reliahle method for dating tropical trees where growth rings are absent or indiqinct. For those tree species where the denser areas on the transwrse surfaces of the wood samples correspond to annual growth. gamma ray densitometric mea1,urement<, proYide reliable age estimate~. Jn the case of Prerocarpus angolensis. the-radiation den1,itometric system yielded poor result<, de1,pite the fact that the wood of this species is semi-ring-porous and contaim terminal parenchyma. However. alterations such as the use of a Fe55 isotopic source. which emits softer gamma rays that arc helter ahsorhed hy wood. the use of thinner sections and measurements O\'er sm:iller areas and inten ab could irnprn' e the rcliahility of results considerably.
l~TRODUCTION
Preracarpus angolensi.1 is one of the best-known. most generally used and most valuahle sa\'anna trees in tropical southern Africa. ]ts mechanical properties and attractive figure and colour make it one of the world"s most sought-after timbers for furniture. building and high~clas<, joinery (Vermeulen. 1990).
Cnder natural conditions successful gennination appears tn depend on fire (Edwards. 198 l l and sufficient rain soon after seedfall (Van Daalen. 1991 ). Earl: survi\'al of seedlings <.eems to be dependent on soil condition~ and absence 0f fire for the first few ) ears (Edwards. 198 I l. Personal obserYations suggest that grazing pressures can be Ve!) detrimental to the surviYal of seedlings. During later years frequent and hot fires can be beneficial to the fire resistant Prerocarpus ango/cmis saplings in that competition is remo,·ed by killing off the less resistant trees (Boaler. I 966 l. :\fost of these conditions are typical of shifting cultiYation -area~ with fayourahle soil conditiom are cleared. fire and grazmg are preYented and after the cessation of cultiYation. ~ras,es tend to gro\\ temporarily more strongly than in the 'urrounding saYanna. resulting in hot fires. These are the reasons for the belief that Preracarpus angnlensis is a weed of shifting cultiYation (\'on Breitenbach. 1973: Edwards. 1981 ). The present distribution of this species in South Africa in general is patchy. lacks a healthy size class distribution and regeneration is poor or ab<.ent <Yan Daalen. 1991: personal obsen ations). Thi~ could be the result of the cessation of shifting cultirntion and the protection of natural areas. lf tree ages can he determined. historical records on the agricultural practices could explain aspects of the present state of
Suid-A.fi·ikuanw BoshourYd.ikrif - nr. 162. September / 992
Prcrornrpus angolensis in South Africa and pro,·ide clues to the sound management of this important timber species. Furthermore. if growth rates are known. harvest levels can he prescribed.
Boaler <I 966 l found that apparently no correlation exists bet" een diameter and age. and that there is a great \'ariability in the growth rates of indi\'idual trees. Diameter growth rate estimate' ''ar: from I 0.69 mm/a for some trees in Zimbabwe (Groome et al.. 1957) to 5.4 mm/a in northern Namibia ( Li.ickhoff. 1969). 5.28 mm/a at Gwaai in Zimbabwe (Groome er al .. 1957) .. Hl7 mm/a in Trans,aal <Luckhoff. 1969!. and 3.03 and 1.5 mm/a in Tanzania <Groome er al .. 1957).
The diameter growth rate estimates can be done either by remeasurements over long periods (e.g. the above-mentioned growth rate of I 0.69 mm/a in Zimbabwe was determined OYer a 33-year period) or by dividing the DBH (diameter at breast height! by the estimated age. In most case~ the~e age estimates were hased on growth ring counts. According to Pierce (I 982 lex Bryant ( I 968 ). discrepancies between known age and ring count~ "ere found to be few. although the accuracy is impeded by the pre~ence of band~ of parenchyma and false rings resulting from defoliation b~ natural agents. Groome er al. ( 1957 J added I 0 years to cover establishment and growth to breast height. Li/IY ( 1977! gave P1erocarp11s angolensis a 2-rating on a dendrochronological potential scale ranging from - I 0 for the least suitable for dendrochronological usage to +I 3 for the most suitable species. This made it a weak ··possible species" with many disadvantageous characteristics for dendrochronological usage.
Groome er al. ( 1957) suggested treatment with iodine and phowgraphy with appropriate filters to impro' e the Yisibility
I I
I I I

Univers
ity of
Cap
e Tow
n
79
of growth ring' of l'tt'rn< cir11111. Hmi.e\1..T. 1111 reference' could he found on th1..· Jpplication nf the'.: recommendatinn'. Apart from ring count,. other method' U'-ed for age dctennination of tree' include C 14 dating. X-ra;. photography and densitometric measuremenh using gamma ray ahsorption <Woods and Lav.don. 197-h
The hasic pn:mise t)f rad!ocarhon Jating is that the Cq level in the environment has remaineJ constant over time. This is. however. not the case and over the past centuries considerable fluctuations have occurred. which often makes it difficult to deri'e a precise age from a c1-l measurement. even though the analyse~ are very accurate. Thus a rJdincarbon age for plant material in the "outhern hemi,phen.: that lies between 100 and 2-lO ;.ears may com:sponJ to as many as four different hi~1<,rical dates between AD 1670 and AD 197-l tVogel. 1972: \'oge) ct ul .. 1986. in press). In aJJitinn to this aft~ct. en' ironn;ental C 14 in the atmosphere \\a' increased significantly abo' e natural le' eb after 1955 as a re'ult of the nuclear\\ eapon te"ts between 195-l and I %2 t \' ogel. l 97 l ). The >tth,equent gradual decrea.;e in the artifil'ial C 14 content of the Jt!1lt)sphere makes it pns-,ible to JL'tually date plants thJt ha'e gnmn ,im:e 1964 to an accural';. uf approximately one year b: means of C 14
. Thi.; contrast, 11ith the limiting uncertJint: pf c1hout 20 years for normal radiocarbon dating. :\lozetl' er al. 1 1988 J used this artificial fallout to determine growth rates in the outer portions of tropical trees in the Amazon region. These data wa" then extrapolated to provide an estimate of minimum tree age.
Owing to the variatiom in the C !-l tevel. radiocarbon dating of trees may ill\ oh e considerable effort. The first step would be to date the inner annual growth rings of the trunk.. If the age lies between 130 and 230 years. two or three further samples along the radius would indicate which of the possible historical dates apply to the core. Lacking this. other considerations ma: be used to arri1·e at the ··most probable" age for the specimen.
During the fom1ation of heartwood organic suh~tan('es that are up to 20 year younger than the annual rings are deposited in the cells. This organic matter can significantly increase the C l.J leYel l_)f the ,ample and make it appear young-. er. The degree of this contamination depends on the species and is as yet not well known. To avoid this complication all organics that are soluble in acid and alkali are removed prior to analysis. In cases where this treatment is not adequate. pure cellulose can be prepared from the sample. This carbon definitely dates to a single year.
As gamma rays traverse matter they are absorbed exponentially according to the following equation (Malan and Marais. 1991 ):
Ill 0
= e -µi
where:
2
= intensity of radiation after passing through the ,ample (counting rate)
I 0 = intensity of radiation through air (reading through zero sample thickness) (counting rate)
µ = linear attenuation coefficient (cm- 1)
= thickness of sample (cm)
µ = µ'D
where:
µ' = ma-,-, attenuation coefficient (cnr/gl 1
D = den-.it~ 1g/cnr'J
I and I 0 for a wood ,ample of a gi\·en thickness is determined bv the dcn;,itumeter. These value-, are u-.ed to calculate µ W:herea' µ' i' a material Yaluc. With both µ and µ' known the density of the wood can be calculated.
'.\IETHODS
Sampling
A fc1\ mature indi~.:nuu' fnre't tree' ,if known age \1erc: ,ampled in the Conrnrd1a arbt,retum ju,t north of Kny-,na 1n the ,puthcrn Cape. The,e \\ere used to 1erify the accurac: 11f the c 14 dating of tree\. Sub,e4uently. in 1990. Pteronir1>111
u11gnle11.1i.1 tree' \\ere ..;amplcJ at three ~ites in Ka'.\gwane· one ne\t tn the \-lzinti '.\ature Resen·e on the sandy Lehombo Flats north of SwazilanJ. one on the ea~tern -.ide of'.\ lananga \loumain in the Lebornbo \lountain range. clo'e tt' the Yil-. la~e ~·ailed ThamhoJ...hulu not far from the \.1ozambi4ue borde-r. and one in the \lthethcmusha '.\ature Reserw in the ~ranite mountains <;OUth-west of the Kruger National Park ~ Fi~wre I J. Later a few ,amples were received from Ptero
u11;11s angolensis stump~ .left after clearing a strip for a pov. -er line close to.Boschfontein on the Lebombo Flats.
?ARK
SWAZILAND i (
\
!
FIGURE 1. location of study sites. The shaded area represmts KaNgwane. Pterocarpus angolensis trees were sampled for daring in the Mthethomusha Nature Reserve. next to the Af:inti Nature Resen-e and on the eastern side of Mananga Mountain. close to Thambokhulu.
Samples were collected as close as possible to ground level. In order to obtain a large enough sample for C14 dating the
South African Forestry Journal - No. 162. September 1992

Univers
ity of
Cap
e Tow
n
lower 30 cm of a bole wa~ removed and di\'ided into three
di~c~ for ea~ier handling. The core of these discs <i.e. ahout the inner JO rings) wcrt' removed and used for dating. This
implies that the determint'd age of the tree will he the avernge date for the inner few ring~. A further JO rn1 disc wa~ re
moved from the bole to be used for age determination by
meam of X-ray photograph~ and gamma ray densiwmetric
measure~.
Dating
The C 14 dating wa~ done in the Quaternary Dating Research Unit of the Division of Earth. Marine and Atmospheric Sci
ence and Technology of the CSIR in Pretoria. Before the
discs were broken up to remove the core for dating. we counted the visible rings.
Cylinders with diameters of about 20 mm were cut from
the core of the discs to give 25 g of wood for the C 14 analyses. All the samples were rigorously treated with diluted acid and alkali to remo,·e soluble organics before combustion to
carbon dioxide. The gas was meawred in a large \'Olume high-precision proportional counter for se,·eral days and the results were corrected for variatiom in the initial isotope ra
tio.of the carbon.
To test the consistency of visual growth ring counting. rings on some smaller samples were counted by twn different peo
ple. both with no experience of ring counting on this species.
Various X-ray exposures were needed to make the growth.
rings in the sapwood and heartwood \'isible. Furthermore. the thicknesses of the discs used for these photographs varied somewhat. Therefore. a series of X-ray photographs were
taken from each sample and printed on one sheet to enable direct comparison among the different exposures. The photographs(= negatiYCs) were placed on a light table to count
the growth rings.
Densitometric determinations were carried out at air-dry
moisture content using a system de\'eloped recently b) the Division of Forest Science and Technology <Malan. 1991 ). Three collimator sizes were used. Two pro,·ided rectangular beams (JO x 0.25 mm and JO x 1 mm) with the smallest dimension~ in the radial direction. and the third one pro,·ided a I mm diameter circular beam. Count rate~ were recorded from pith to bark for I 0 seconds per measuring point. These points were 0.2 mm apart for the 10 X 0.25 mm rectangular beam collimator and J mm apart for the two other collimators.
For the demitometric scanning strips of 20 x 20 mm were cut along two radii from some of the discs and air-dried. To a\'oid any huming of the wood sample and to pro,·ide smooth surf aces and strips of unifom1 thickness in the tra,·erse direction of the rays. carbide tipped saw blades were used to cut these sample~.
Radial \'ariation in density was plotted and the peaks !i.e. the denser area~ l counted as estimates of the number of annual rings. For tho~e samples where reading~ were taken at 0.2 mm inten·als. the X-axes were exaggerated and a series of graph~ prepared to enable the more accurate counting of the peaks.
RESliLTS
The C14 dating of the indigenous fore~t trees from the south-
S11id-Afrikoa11se Bosho11tnl.1kri( - 11r. 16:Y. Scptemher 199::
80
ern Cape v.ere very close to their real ages (Tahle /).Thi~
pro\'ed the rehahility of this dating technique. at least within a time frame of about I 00 year~.
TABLE I. C14 axes of indif?enousforest tree.1from the Con· cnrdia arhoretum. southern Cape. All three trees were plant· ed hf'tween 1897 and 1900, i.e. they were 90 to 93 years old.
Species
Curtisia drntata Podocarpu.1 falcatus Ocotea hullata
Calibrated C14 age ()'ear)
80-100 80-100
90
The results from the different age determinations on Ptero· ca17m.1 a11gole11si.1 are listed in Tahlc 2. The first sample. No. 17! Mt). had a C 14 content of 49 % abo"e normal. On the con"entional cP age scale this corresponded to a ··negati\'e .. age
of -3 203 ± 16 years. Howe\'er. when thi~ deri\'ed age wa~ corrected for the increased atmospheric C 14 levels resultinf from nuclear v. capon tests. the resultant age was 22±4 year~ in 1990. Thi' is a good agreement with the vi~ual ring count of 25 year,. Sample J 8(Mt) showed a slightly elevated C14
content. 2.2 <,( above nomrnl. or -164±24 years old. suggest
ing a calibrated germination date of around 1956. The ~amt result could aiso be obtained if the tree wa~ actually older bu1 the corcwc1c1J contained a small amount (lf post- 1954 carbon. To check thi' po~sibility. pure cellulose \\as prepared from a further 40 g of corewood and analysed. This material ga\·e an age of 160::'.:18 years BP (Before Present. i.e. hefore 1950). which calibrates to AD I 930. 1818 or I 710. Since the deposition of younger organics in the wood cells is unlikely to take place for more than 40 or 50 years after the rings are formed. it can safely be concluded that the tree started growing in AD 1930±5 or 60 years ago. The derived age again compare' well with the ring count of 57.
Two other ,;nnples. No. 19(J\1t) and 16<Mz). also showed slightly eJe,·ated c14 levels or "negati\ e·· ages, indicating
that they started growing before 1957. For the same reason as that gi,·en abo\'e the ring counts can thus in all probabilit; be accepted as approximately correct.
The rest of the samples all gave ··positi\'C .. C14 ages of between 7 J and J 52 years. The oldest. No. 3(J\1a). calibrated to AD 1710. 1820 to I 880 or 1926. The ,·isual ring count for this specimen of 116 suggests that the tree started growing in 1874 so that the 19th century date seems the most acceptable. viz. 140::'.:30 years old. The youngest C14 age obtainable in the prenuclear bomb era is about I 00 years. This age correspond~ w AD 1900. The remaining samples that were dated in this way had an a\'erage c14 age of 101±15 years. which indicate' that the results are compatible with the hypothesis that these tree~ started growing in about AD I 900. The Yisua] ring count~ h1r the~e I 0 specimens is I 13 years - slightly more than the age of 90 years inferred from C 14
.
Although unlikely. the possibility remains that organic compounds produced during the past 30 : ears did find their way to the core of boles of the older (i.e. :? 90 years) trees. causing C 14 dates that appear too young. To test this. pure cellulose wa~ prepared and analysed from the core of sample No. 7(Mz). which yielded the highest ,·isual ring count. The result was 1-13± 19 years BP. 34±25 year~ older than the standard analysi~ ofl 09± 17 years BP. Although the difference is

Univers
ity of
Cap
e Tow
n
81
TABLE 2. Resultsfrmn d!ffrrem age determinations 011 Ptcrocarpu~ angolensis .1·c1111p/t'.I ml/ected in l\a.\'g1rnnl'. Tiu suffices to the sample numhers indicate the sites where the .1(1111/)ln 11·crt' collected: M: = M:i111i. Ma = Manm1f!.<l Mo1111ta1r;. Mt = Mthethomusha Naturt' Rn1·11·e and Pl = poll'er linl' at Bo.IC h(11ntei11. The co111·e11ti01111I rntl1ocarlw11 age.1 arc gii·en in·' rar.1 BP (Before Present. i.e. be.fort' 1950). The core of sample /0( M:.1 was l'C'f'!. acentric and ring.1 were counted along the .1honor and longest radii. For sample I 5( M:.) two d!fferrnt strip.1 were used for dl'll~itometric mcasurement.1 u.1i11g the I mm circular beam
I I
I I i
i
i
Sample DBH Con\·entional Calibrated Visual number (mm) c14 age C14 age ring
(years BP) (years) count
17 (Mt) 127 -3 203 ± 16 18 25
18 <Mt) 266 160± 18 60± 5 57 (-164±24) (>33)
19(Mt) 213 -48 ± 24 >34 57
3 <Mal 434 152 ± 21 140 ± 30 116
4a (Ma) 314 128 ± 21 90 I I03
4b(Mal 360 84 ± 18 90 133
5 <Mal 240 94 ± 22 90 i 140
6(Ma) 270 103 ± 21 90 ! 82
16(MZJ 274 -180 ± 24 >33 I 64 '
7 (Mzl 450 109 ± 17 90 ! 166
8 (Mzl 432 i 75 ± 15 90 ! 141
10 (MZ) 367 ! 106 ± 21 90 i 45 &. 81
II (Mzl 377 113 ± 21 90 I 75
13 <Mzl 317 100±19 90 ' 88 i 15(Mzl 410 99 ± 22 90 I 118
I (Pl) I
2 (Pl) I . I
3 (Pl) I
I
-HP!) ! '
5 <Pl)
not statistically significant. it may indicate some tran~location of organic~ in the stems of this tree species. If ~o. the actual tree ages would be somewhat older than 90 years. Further investigations would be required to establish the magnitude of the contamination that can take place.
Although the correlation between DBH and the C14 dates
I i
i
I I
i !
i
I
I I !
:
X-ra~· Gamma raJ densitometric measuremenL~ ring Rectangular I Rectangular I Circular
count beam, 0,2 mm J beam. 1 mm i beam. I mm inten-als \ intenals \ intervals
16 I I I
I I
I I I
! i I i I : i
57 i j
I I :
7'2 I I 4 I ! 65 I I i I ' I
68 I I I ?-1 i I ',
38 I i : i I
107 I : i I
62 I I I I
I
54 6:. 68 I I I
95 I ! I I
62 j I
I 83 l 1
476:.41 I
52 21 l : : I
I 101 33 I 29 I 99 ' 41 I 4(• i
I J JI -10 ' : I
98 I .~9 !
I I I !
wa~ highly significant ( Tahlc 3 l. the discrepancie~ \\ere too large to u-.e DBH as an indication of age (Tohle .?1. The Cray ring counts correlated slightly better with lhe C;.: re,ults than the Yisual ring counb. The rnrrelalion betweer. the Yisual and C-ra) ring counts wa' just behrn the 5 'r kvel of significance.
TABLE 3 Spean11a1111 correla1io11 coe.fflcient.1 f(1r DBH and rnrious aging tcch11iq11esfnr Pterocarpus angolen~i'
i Variable 1 Variable 2
i \DBH Cl4 date
I c14 date Visual ring counl
! c 14 date X-ray ring count ' ! Visual ring count X-ray ring count
The visual ring count!'> of smaller Prerocarpus a11gole11sis samples by inexperienced people provided ver) divergent results <Table 4). This indicate~ that degree of suhjecti\·ity present when determining the age of thi~ species in this way.
The densitometric density variation. as determined at in-
; Correlation : Probability > Ir;. l roeflicient ! Ho:p = 0
i 0.717 i0.003
; 0.591 ! Cl.0-13
I 0.652 10.022
! 0.571 ! U.053
tenab of 1 mm. is gi\·en in Figure 2. For those ~mple~ where readings were taJ..en at intenab of 0.2 mm. the X-axes were exaggerated and a series of graphs plotted. cc..,wring ~uc:cessi\·e parts of the di~c~· radii anal~sed (Fiplll'< .~1. Onl~
relatiw densities are of imponance here. the demi!~ \ alue~ on the Y-scale of the graphs haw been omitted.
S!llllh A.friu111 F!lrcsirY Jo11nw/ - .\'o. 162. S1·11r1·m.i·, • 1992

Univers
ity of
Cap
e Tow
n
TABLE 4. Grml"th ring counts of Pterocarpus angolensi~ samples done b_, two different people. The number of figure.I reflect the number of radii of a sampler counted by a particular person
Number of growth rings as counted by
Sample number Person I Person 2
I
2
3
4
5
6
7
8
9
10
I I
(a)
15 33
15 31
14. 13, 14, 12 25,21,22
14. 15. 12, 14 18,25
11. 14, 14, 13 34
5,5,5 14
6. 7.6 15. 14
9,9.9 15
3.4.5 JO
4.5.4,3 JO
7,8. 7 21, 19
D 10 20 30 40 50 60 70 80 90 100 110 120 130 DISTANCE FR:lM PITH(""')
82
0 10 20 JO "0 50 60 70 80 90 100 OISTiu«::e FR:M Plll1 (mn)
FIGURE 2. Results from gamma ray densitometric measurements 011 Pterocarpus angolensis sample No. 2( Pl J. using the collimator ll'ith a round hole and measuring at 1 rrim inten-als. All peaks ll'ere taken as representinf!, gmll'th rings
In .
ffi 0
lb)
100 101 102 103 10<! 105 106 107 109 109 0 I ST .ANCE FR:).! PI TH ( llT!\)
FIGURE 3. Gamma ray demitometric measureme111s on Pterocarpus angolensis sample No. 5( Pl). The collimator proriding a rectangular JO X 0.25 mm beam was used and measurements taken at 0,2 mm i111ervals (a). To enable the counting of peak.5 in the graph the same data ·were plotted as a series of graphs 011 a drawn-out X-axis. Only a small portion of the total data is represented in (bJ. Seven growth rings were counted on this portion of the graph (those taken to represent a year's growth are marked with an arrow)
For comparison. samples from three other species with distinct annual rings were scanned by the densitometer from pith to bark taking measurements at inter\'als of I mm (Figure 4). In these cases visual ring counts agreed precisely with the peaks in density values indicated by radiation densitometry. This confirms the reliability of radiation densitometry provided rings are demarcated by Jatewood zones of higher density.
If the C14 dates are accepted as correct. densitometric measurements. using the existing system. did not provide an accurate estimate of age (Table 2). Although a 10 x 0,25 mm rectangular beam enabled the scanning of samples at very small intervals. the curvature of the rings and the misalignment of the aperture with the growth rings, as well as the fact that the grain of the wood often did not run parallel with the radiation path. caused poor resolution which made it very difficult to detect ring boundaries if present. The use of the I
Suid-Afrikaanse Bosbmm·dskr~f - nr. 162. September 1992
mm circular beam solved the problem of ring cur\'ature but the larger beam size gave poor resolution for the very narrow rings. (Table 2). It also did not soh·e the problem of grain deviation from the radiation path despite the fact that the samples were later reduced in thickness to I 0 mm.
CONCLUSIONS
At present C 14 dating seems to be the most reliable method of estimating the age of Pterocarpus angolensis trees in the time-range of a few hundred years. provided that the measurements have a high enough accuracy (with an uncertainty of::::; 25 years). Adequate care must be taken with the chemical pretreatment of the material.
Visual ring counting and ring counting from X-ray phot0-graphs are subjective as a result of the indistinctness of these rings. It is often difficult to decide whether or not an appareni

Univers
ity of
Cap
e Tow
n
0
la)
10 20 30 <CO DISTANCE FRC>A PITH (mn)
>t-
Vl z w 0
0
§
83
50
(h)
0 10 20 30 "10 50 60 70 80 90 100 OISTf.NCE FP::JJ PITH(""')
0 10 ;i.'tl 30 •D 50 60 70 80 90 100 110 1<'0 130 1•0
DISTANCE FRO.A PITH(""')
(C)
FIGURE 4. Gamma ray densitometric measurements rm samples nf Pinus (a). Robinia ( h 1 and Populus ( c ). The collimator proriding a rectangular JO X 1 mm heam \\'(IS used and 111carnremc11I.\ \\'ere taken at 1 mm i111errnl.\.
ring is real and should be counted. Experience is necessary to provide reasonable age estimates of this species using these methods and precision cannot be claimed. Groome et al. (1957) described the species as ring-porous. i.e. not Yery distinct but sufficiently so to be counted over a wide radius. According to them the growth rings are marked on the end surface by a band of terminal light-coloured parenchyma and by a zone in the early wood with a few distinctly larger and widely spaced vessels. The latewood zone ha~ fibre~ with thicker walls and fewer vessels.
In the samples investigated the parenchyma and larger vessels were often not arranged in visible bands. Where some stratification could be detected. the rings seem to disappear and re-appear on the trans\'erse surface. This caused very divergent results when counting rings on different radii of the same disc cut out of a bole.
The major disadvantages of the C14 dating technique are the high costs <about R800 per sample) and the time needed for the analyses (about four months). It does. however. pro,·ide a reliable technique for dating tropical trees. which in tum provides the basis for harvest control in forest area~
where more detailed growth data are not available. 'With tree ages known, mean growth rates can be calculated and han·est
6
leveh determined to ensure sustained timber production. Various researchers haw prowd that gamma ray den$ito
metry is a reliable and relatiwl~ cheap method for tree ring analyses for species with distinct growth rings (Kano'' ~ki. 1985~ Moschler and Dougal. 1988). Since Pterocarp11s ango/ensis is semi-ring-porou~ with reasonably well defined terminal parenchyma it should be possible to detect the density differences caused by the presence of these anatomical features. It would. howe,·er. be necessary to reduce beam size to at least 2.0 mm x 0.1 mm. In this way. the effect~ of ring curvature and ring misalignment will be reduced too. Thinner samples will haw 10 be u~ed (preferably less than 5 mm thick) to reduce the effect of grain deviation from the radiation path. This v.·ill. in turn. require a radiation source that emits softer rays. such as Fe.-,='. to obtain the required ab~orption by the thin samples and to e~timate density accurately. Such alterations to the existing system are being planned at present.
The similar ages of the trees sampled on the Lebombo Flats and on the Mananga Mountain is difficult to explain. In the Mzinti area this could be related to the presence of old fields. Unfortunately aerial photographic records do not go back very far. The area around the village Thambok.hulu is
South African Fores1n .1011mul - .\lo. 162, Sep1embcr !99~

Univers
ity of
Cap
e Tow
n
cultivated today, but the Pterocarpu.~ trees occur only on the rocky mountain slope. which is unsuitable for cultivation. Therefore, a more likely explanation would be the occurrence of fires before seed fall and above average rainfall soon aften.vard~ (Van Daalen. 1991). Grazing could also play a pronounced role in eliminating regene~ation.
ACKNOWLEDGEMENTS
The Division for Forest Science and Technology of the CSIR provided funding for this work. This is gratefully acknowledged. KaNgwane Parks Corporation assisted with the collection and railing of samples. Mr Gerhard Mostert of FORESTEK is thanked for the preparation of samples for ring counting and for ha\'ing the patience to count rings on many samples. Mrs Dorita du Plessis of FORESTEK prepared the map of the study area.
REFERE~CES
BOALER. S.B .. 1966. The ecology of Ptcrocarpu.1 angnlensi.1 DC in Tan
zania. 01·erseas Rc.<carch Publication No. 12. Ministry of 0,·er;.ea> De
' elopment. Her Majesty·;. - Stationary Office. London.
EDWARDS. l.D .. 19g1. Minute 16/2/3 dated 8 December 1981. received
from the Forestry Research Institute of Malawi. Zomba. Depanmental file A20/S/3/Pterocarpus. Depanment of Water Affair;. and Fore>try.
Pretoria.
GR00\1E. J.S .. LEES. H.MS .. and WIGG. LT .. 1957. A summary of informauon on Pterocarpu.1 angnlensis. Pam I & JI. Forf.ltn Ahstract.1
18il & 2): 3-15.
KAl\OWSKI. P .. 1985. Densitometric analysis. of a large number of wood
samples. Journq/ of the lnstit!'tP of \.\'ood Science Vol 10t4J: 145-151.
LILLY. M.A .. 1977. An assessment of the dendrochronological potential of
Suid-Afrikaanse Boshmm·dskrif - nr. 162. Sepremhcr 1992
84
indigenou;. tree specie> in South Africa. Enl'imnmrntal Studin Occa·
sinnal Paper No. 18. Department of Geography and Environmental
Stud1e;., Univer..ity of the Witwatersrand. Johanneshurg. LOCKHOFF. H.A .. 1969. \'er,lag oor be'oek aan Suidwe;-Afrika: No
vember 3- I 5. I 969. Departmental file A20/5/31Pterocarpus, Department
of Water Affairs and Fore;try. Pretoria.
MALAN. F.S .. 1991. Direct gamma ray densitometric system for wood.
CSIR Report FOR-1158. 15 pp. MALAN. F.S .. and MARAIS. P.G .. 1991. Direct gamma ray densitometry
of wood. South African Forestry Journal No. 157: 1-6. MOSCHLER. W.W .. and DOUGAL. E.F .. 1988. Calibration procedure for
a gamma scanning densitometer using gamma radiation. Wood Science
and Technology Vol. 20(3 ): 297-303.
MOZETO. A.A.. FRITZ; P .. MOREIRA. M.Z .. VETrER. E.. ARA VENA. R .. SALA Tl. E.. and DRIMMIE. R.J .. 1988. Growth rates of natural Amazonian forest trees based.on radiocarhon measurements. Radiocar
bon Vol. 30(1): 1-6.
PIEARCE. G.D .. 1982. Minute 271 M'6.33M' dated I 0 May 1982 received
from the office of the Chief Foreq Re;earch Officer. Forest Department.
Kitwc. Departmental file A20/5/3/Pterocarpus. Depanment of Water Af
fairs and Forestry. Pretoria. VAN DAALE\. J.C.. 1991. Germination of Prerocarpus angolensis seed.
South African FurcstrY Journal No. I )g: 31-34. VERMEl'LE\. W.J .. 1990. A monograph on Ptcrocarp11.1 angnlensi.<.
SARCCl'S Technical Publication. VOGEL. J.C.. 1971.. Radiocarbon in nature. South African Journal of Sci
ence Vol. 67 (2): 32-42.
VOGEL. J.C.. FULS. A. .. and VISSER. E.. 1986. Radiocarhon fluctuation;. during the third millennium BC. Radiocarhcm Vol. 28 I 2B ): 935-938.
VOGEL. J.C .. Fl'LLS. A .. VISSER. E.. and BECKER. B .. In Press. Preto
ria calitiration cul'\e for shon-Ji,ed samples. 1930 BC-3350 BC. Radio· carhfln,
·VON BREITE\B..\GH. F .. I 973. Pterocarp11.1 angolcnsis - a monograph.
Trl'Cs in Sourh Africa Vol. 2~131: 58-80. WOODS. F.\\' .. and LA WOO)';. W.T.. 1974. Gamma densitometry of in
crement cores. Forest Science, Vol. 20(3): 269-271.

Univers
ity of
Cap
e Tow
n
SECTION 3
EVALUATION AND CONCLUSIONS

Univers
ity of
Cap
e Tow
n
I
EVALUATION AND CONCLUSIONS
ID>El..Llt«l ~ SUCCESSION
Most regression models on forest growth explain growth directly in terms of
other observations such as DBH, basal area, soil type and rainfall. Despite
the fact that these regression equations suggest possible theoretical models,
in itself they normally have little theoretical foundation. Often they are
only the first step in formulating a theory (Bragg and Henry, 1985).
Forest growth models are really developed to compute outcomes for situations
not actually represented in the data base. For this purpose, regression
models have limited application. With these models extrapolation beyond the
1 imi ts of the avai,lable data can easily lead to erroneous conclusions. Models
which are constrained by tested and reasonable theories should be more
reliable in extreme behaviour than models based on regressions alone.
The OUI'ENIQUA model.reflects the reductionistic approach to succession. It
yielded satisfactory simulations of measured short term (i.e. 15 year) forest
growth and seemed to reflect the longer term forest dynamics reasonably well.
Although it could best be described as an ecological model which attempts to
describe and predict long-term successional behaviour in the southern Cape
forests, it is capable of producing sustained yield calculations. It is
written in such a way that it can be modified relatively easy to reflect
another succession theory and results of the modified model could then be
compared with the present simulations.
The time scale for which a model is developed is of paramount importance.
When one is interested in evolutionary time scales, one's modelling approach
will differ substantially from the case where one is interested in succession
denoted by the recovery of the forest after natural tree falls or managed
logging operations designed on a sustained yield basis where individual trees
are marked and the forest canopy is not unduly disrupted. The OUTENIQUA model
was developed with the latter approach in mind.
Scale of mechanism is equally important for model development. For example,
biomass increase of a disturbed forest that is growing back can be considered

Univers
ity of
Cap
e Tow
n
87
at the photosynthesis level within a leaf, or at the larger mechanism scale
of stomata control I ing the energy balance of the leaf, or at the scale of leaf
geometry, where the shape and orientation of the leaf can have a pronounced
effect on the ability of the plant to take in C0 2 for photosynthesis while
giving up little H20. At a still larger mechanism scale vertical light
extinction as a result of the orientation and layering of leaf layers of the
tree can be considered, and finally, the tree effect of shape on the hori
zontal light extinction can be contemplated. Any of these mechanisms can be
important over some time scale. All of these mechanisms cannot be included
in a single growth model. For instance, it is impractical to consider the
growth of a large tree by simulating the energy balance of each individual
leaf on that tree, for the number of interactions among the leaves increase
as a function of the square of the number of leaves (Shugart, 1984). The
OUI'ENIQUA model simulates tree birth (by considering sprouting, seed
production, seed dispersal, seed phenology, seed longevity and germination),
diameter and height growth of trees (as a function of tree size, leaf area and
crowding from other trees), competition (as a function of shade tolerance,
avail ab 1 e 1 i ght , and density and species compos it ion of tree groups) and
mortality of individual trees. The small mechanism scale photosynthesis and
energy balance of individual leaves are, therefore, absorbed into the model
parameters such as tree size, leaf area and available light. In this model
seedling recruitment plays an important role because it determines which
species will increase or decrease over several tree generations. In a model
of a commercial plantation, seedling recruitment will probably not even be
considered. Plantations are initiated with a given number of seedlings
planted on some fixed spacing. Therefore, the level of detail in different
models cannot be taken as a criterion for using the one and not the other for
a particular situation.
For the purposes of this study the OUI'ENIQUA model served, and succeeded, as
a research tool in that it was directed towards summarising existing infor
mation on the southern cape forest dynamics and identifying inadequacies.
Research topics (of which some were addressed in this thesis) could be
identified and a context provided for the studies on forest dynamics and
biology in the southern cape forests. During the model development much data
was inferred from general experience, such as what we thfnk the maximum age
a trees of a specific species would be, what we think the maximum height would

Univers
ity of
Cap
e Tow
n
88
be, do we thfnk the tree will sprout when felled etc. To compile the data
used for the model, I had to sit for days with my col leagues to discuss their
experience on every variable for every species used - very similar to the
process necessary to develop an Expert System on a specific topic. This in
itself was a very valuable and enriching exercise and probably highlighted
gaps in our knowledge more than anything else. Often we think that we know
something until somebody starts asking us specific questions about it.
When evaluating any growth or succession model it must be remembered that it
can only represent a limited part of the processes and dynamics of a forest.
"Even where the model works, it is intended only to be sufficient as a
caricature of reality, rather than necessary as a mechanistic explanation"
(Horn, 1981). It can never replace the scientifically trained, experienced
and commonsense forest ecologist or forest manager and it can never be more
than a tool developed by people with imperfect understanding of the total
forest processes and dynamics.
FOREST GROWl1I AND SUCCESSION
The forest growth observed on the study area is slow when compared to for
example that of Pinus radiata D. Don. plantations (with a mean annual
increment of about 15 m3/ha) in the same area. However, the gross rate of 2
mo/ha per annum appears to be comparable to those of tropical and subtropical
forests elsewhere in the world. If this apparent global uniformity of growth
rates could be confirmed it could be a unique opportunity for the refinement
and standardisation of forest succession models such as OUTENIQUA. Then these
models could be applied on a much wider scale with much less laborious and
time-consuming calibration than at present.
Many aspects of the observed growth and mortality rates could be explained in
terms of the developmental phases of the forest as described by Bormann and
Likens's (1979) model of biomass accumulation. It was concluded that growth
rates are declining and mortality rates are increasing, indicating competition
for space and other resources. Some species, such as CUrtisia dentata (Burm.
f.) C.A. Sm., Gonioma kamassi E. Mey., Pterocelastrus tricuspidatus (Lam.)

Univers
ity of
Cap
e Tow
n
89
Sond., Podocarpus Jatifolius (Thunb.) R. Br. ex Mirb. and Cassine papillosa
(Hochst.) Kuntze are favoured by this situation and are increasing their
numbers relative to other species, whereas recruitment rates of Olinia ventosa
(L.) Cufod., Ocotea bullata (Burch.) E. Mey., Olea capensis (L.) subsp.
/118crocarpa (C.H. Wr.) Verdoorn and Apodytes ·dimidiata E. Mey. ex Arn. are less
than their mortality rates.
Two questions need to be asked at this stage: First, is the southern cape
forest succession predictable, and secondly, is it directional? G6mez-Pompa
and Vasquez-Yanes (1981) state that it is impossible to predict what the
regeneration process (and consequently succession) for rain forest in Mexico
will be in the next hundred years. Franklin and Hemstrom (1981) found the
same unpredictability in the species composition in the early successional
stages of coniferous forests of coastal northwestern America. In both cases
the only predictable succession was on the physiognomic scale. Cottam (1981)
mentioned that the only succession that appeared to be predictable at the
species level is in the arctic, an extreme climatic area. Because of their
failure to define floristic vegetation changes G6mez-Pompa and Vasquez-Yanes
(1981) emphasised growth rates, seed size, seed dormancy, tree geometry and
shade-( in)tolerance. In the tropical Mexican forests they were studying there
were so many species capable of filling a particular niche that they had to
place the accent on physiognomy and tree physiology.
To a large extent this is true of the southern Cape forests too, at least the
medium-moist forest type studied. As such most sites are suitable for most
species. Certain trends have been observed during the study period, but it
is impossible to predict the long-term species composition of a particular
stand. This phenomena is reflected in the OlTl'ENIQUA model in that species are
selected at random to recruit on a given site. After selection of a species
it is subjected to various establishment criteria before incorporating it in
the simulated forest development. With our present understanding of the
forest ecosystem we cannot define or describe all the "random" aspects of
forest development and have to maintain stochasticity to smaller or larger
degrees in forest models. The beauty of the modelling approach followed in
this study is that these "undefinable" aspects are arranged in separate
subroutines in the model, al lowing forest scientists to research these aspects
in a structured way and to incorporate every newly discovered part of the

Univers
ity of
Cap
e Tow
n
90
total jigsaw puzzle into the model without redoing the whole simulation. The
latter would be necessary for a regression model.
The second question, that of (uni)directional succession, normally implies
that succession leads to a cl-t'max. I am aware of the fact that the term
"climax" is very fuzzy, and in some circles it is considered close to a swear
word. For our purposes I will define it as the stable community which will
be perpetuated indefinitely, provided the environmental conditions remain
constant and human interference (such as agriculture and man-made fires) could
be eliminated. Apart from the interminable time span needed to determine
whether or not a particular plant community is the climax, it will be very
difficult, if not impossible with our present understanding, to determine the
floristic climax for a particular site in the southern cape, be it forest or
any other vegetation type. The general view seems to be that succession
proceeds from shade-intolerant to shade-tolerant species, and from small,
herbaceous species to trees, if the climate will support trees (Cottam, 1981).
Yet there are postulated exceptions to this conviction. Assuming that forest
is the vegetative climax (and this would be open to debate) for the southern ·
cape under the present climatic regime, from the above it should be clear that
we would not be able to predict this climax beyond the physiognomic scale.
This now leaves the manager with a dilemma. What must his long-term conser
vation goal be? Must he manage the forests in such a way that the status quo
is maintained? can he maintain the status quo? Or must he aim at allowing
the forest to develop? And if so, develop to what? And how must he manage
the fynbos areas under his control? Is the fynbos the vegetative climax, or
is it si11PlY maintained as such by fire? To be practical, I think the climax concept should not be part of the forest management goal for the southern
cape, except perhaps for smal 1 areas where the forest appears to be disturbed,
such as some of the fynbos "islands" (Midgley and Bond, J990; Van Daalen,
1981). Rather follow a conservative management approach and aim to maintain
the present physiognomic status quo, but closely monitor the long-term changes
in species composition (on sufficient permanent sample plots) and adjust
harvesting practices as soon as any detrimental trends (in terms of recruit
ment, growth and mortality) are observed. Guard against a too pragmatic
approach where the rate of changes of management styles do not allow proper
evaluation and follow-up of management activities, as has been the case to
f

Univers
ity of
Cap
e Tow
n
91
some degree in the southern Cape.
cn.tPETITI~ ~ TREES
Results from the competition study (chapter 3) indicated that both inter- and
intraspecific competition do play significant roles in the forest dynamics.
However, it does not apply unconditionally to all species interactions.
Pterocelastrus tricuspidatus and Apodytes dimidiata did not compete with each
other. Curtisia den ta ta inhibited the growth of Podocarpus falcatus (Thunb.)
R. Br. ex Mirb. and Pterocelastrus tricuspidatus only to a limited extent.
Furthermore, the most abundant tree species, Olea capensis subsp. macrocarpa,
exhibited weaker than expected competition with <;>ther trees. Both Curtisia
dentata and -Apodytes dimidiata (a weak interspecific competitor) showed strong
intraspecific competition, whereas Ocotea bullata's growth rate was increased
by the presence of other individuals of the same species.
In the OUTENIQUA model the primary assumption is that trees compete primarily
for 1 ight. This is in accordance with the general view that succession
proceeds from shade-intolerant to shade-tolerant species (mentioned above).
With this I do not imply that light is the only driving force in campetition
for the southern cape forests. To the contrary. However, at present light
is the easiest means of defining competition for simulation purposes.· Other
competition factors are treated as stochastic features, such as the chance of
a particular species being available as seedlings or sprouts immediately after
a disturbance. It must be realised that most species can grow on a much wider
range than they actually occur. However, each species is found where it can
compete successfully with the other species present. If a dominant Olea
capensis subsp. macrocarpa tree, with its heavy crown dies, the chances are
greater that another species wi 11 take its place than a tree of the same
species. This will depend on the availability of a particular species to
occupy the gap. The first tree that can utilise the increased light levels
will have the competitive advantage over the other trees.
Small gaps are of vital importance in the evolution of these forests. As in
the case of most tropical and subtropical mixed evergreen forests, catastro-

Univers
ity of
Cap
e Tow
n
92
phes capable of creating large gaps (such as fires) are so rare that it would
have little or no evolutionary significance. Furthermore, despite very low
light levels, regeneration of many species can persist on the undisturbed
forest floor for many years. Most of the light reaching the forest floor is
in the form of sunflecks. In undisturbed Australian rain forests light levels
are often as low as 1 % or less of that in the open. The light intensity at
the centre of small flecks is often surprisingly low and sometimes sunflecks
do not appear to provide sufficient energy for the growth of any plants except
specialised understorey species (Stocker, 1985). Under these circumstances
most regeneration will eventually die off in the absence of disturbances.
However, normally there are enough seedlings and saplings that can "hang on"
long enough to utilise the increased light levels following the death of one
or more trees. This strategy appears to be, apart from obvious competitive
advantages it provides, a response to the greater relative significance of
seed predation compared to herbivory (Stocker, 1985). Thus, for both growth
in small gaps and survival on the forest floor beneath an undisturbed canopy,
a degree of shade-tolerance is required of most of the tree species which
could be expected to occur in the typical forest assemblages. Most of the
trees in the southern Cape are shade-tolerant. This also implies that they
can grow in close proximity to other trees, despite the fact that the growth
rate of various species is retarded by competition. This fact is emphasised
by the observation that the distances between competing and non-competing
trees were similar. Although this is most probably an art if act of the
stocking density of the forest, it could in part explain why trees of equal
size in natural forests can have vastly different ages.
The results from the study on competition indicated that the two Podocarpus
species have the ability to increase their numbers. These species were very
popular for furniture, building and railway sleepers and were heavily over
utilised in the past. Their survival can probably be attributed to their
competitive abilities. Today Podocarpus Jatifolius is one of the more
abundant tree species in these forests. The study confirmed results from
other studies (e.g. the growth study reported in chapter 2) that the forests
are in a late successional stage (judged physiognomically), and it indicated
that the present management approach of harvesting trees that would probably
die before the next harvesting cycle is a sound one.
1·
Univers
ity of
Cap
e Tow
n
93
TREE GROWlll INDICATORS
Having a forest growth model, knowing the average growth rates of trees in a
particular forest stand, having determined the successional stage of the
forest, being aware of the importance of avoiding large gaps in the forest
canopy and knowing which trees and tree species compete, does not help the
forest manager much in selecting specific trees for harvesting. He needs some
practical criteria for selecting the harvest. For this reason the next
logical step in this study was to determine tree growth indicators.
Crown position proved to be a useful growth indicator for the canopy tree
species in the forest (see chapter 4). Crown form correlated positively with
most of the canopy species tested, as well as with a number of subcanopy
species. These results could, however, not be applied unconditionally.
Ocotea bullata's growth, for example, was affected by its crown form, but not
by its crown position. Although the tree grows well in the shade of others,
it still needed adequate foliage to photosynthesize sufficiently. On the
other hand, Olinia ventosa, one of the most pioneer-like trees in the forest,
is much more dependent on growing in full sunlight than on the form of its
crown.
Cambial electrical resistance readings, measured with an instrument called a
Shigometer (after its inventor, Dr Alex Shigo), proved to be of little use for
management purposes. Standard deviations of the measurements were too high
to use any relationships between cambial electrical resistance and tree vigour
for predictive purposes. Much more thorough experimentation and plant physio
logical studies will be needed to make this instrument practically useful.
As early as 1976 Newbanks (exTattar and Blanchard, 1977) tried out a similar
instrument for determining tree vigour. He calculated the correlation between
electrical resistance readings and visual crown classification (as an indi
cation of tree vigour) of sugar maple in the united States of America, but
found little or no relationship. This could have been expected in the light
of the limited reliability of visual assessments of tree crowns as indicators
of tree vitality. However, linking electrical resistance readings in the
outer wood and cambium layers of trees with the presence of diseases such as
fungal infections, cold temperature injury, discolouration and decay, root
rot, vascular wilt disease, air pollution injury, cankers and proliferation
I fi

Univers
ity of
Cap
e Tow
n
94
disease, proved to be more successful and seems to be the only usable appli
cation of relative electrical resistance readings in wood tissue (Newbanks and
Tattar, 1982; Tattar and Blanchard, 1977).
DATIMl OF TREES
One of the most complicating factors in (sub)tropical hardwood forest
management is the difficulty of determining a tree's age. Should this have
been possible it would have been a relative simple exercise to calculate
growth curves for the main timber species on different sites and harvest them
at the point in their life cycles where growth rates start declining. Lilly
(1977) classified a large number of South African indigenous trees according
to their dendrochronological potential. According to him the ages of several
southern cape forest tree species could possibly be determined with some kind
of reliability. The savanna hardwood, Pterocarpus angolensis, is classified
as a tree species with a better potential for dendrochronological work than most of the forest hardwoods. Therefore, when the opportunity arose to obtain
a large enough sample of Pterocarpus stumps for this purpose I grabbed it with
both hands. It would be easier to develop aging techniques on Pterocarpus and then apply them to the forest trees than to work on tree species with very
little or no visible growth rings only.
All the ring counting techniques (chapter 5) proved to be subjective and
considerable experience was necessary to obtain reasonable results. c14
dating is expensive and it takes a few months to complete, but is the most objective and reliable method for dating hardwoods where growth rings are
absent or indistinct. Due to the cost of this technique (about R800 per sample) it is not a method to apply indiscriminately. However, if the real
cost of long-term growth measureaents in fores ts would be taken into account, R800 per sample becomes less prohibitive. Add to this the relative short
period needed for determining the mean growth rates (as compared to long-term
measurements) and C14 dating becomes a viable management technique, especially
for extensive forest management over large areas, as is the case in many of the tropical countries. Deforestation and mismanagement in some of these
. countries is so widespread that there is no time left for long-term measurements on permanent sample plots.
r
l i l
Univers
ity of
Cap
e Tow
n
95
CONCLUDit«:J RfMARKS
The modelling and follow-up approach fol lowed in this study, i.e. the
development of a deterministic distance-independent individual tree model,
followed by the verification of assumptions made during the model ling process,
provides a framework for a systematic and management orientated study of mixed.
forests. The present world-wide economic situation is the cause of dwindling
research funding, and the luxury of research for the sake of research cannot
be afforded any more. Researchers are forced to spell out the practical
benefits of their (intended) research more and more clearly. To do this and
to convince the financing bodies that their money will be well spent research
motivations must be presented in a logical way with clear indications where
the specific research project(s) fit into the whole. The approach followed
here tried to do just that.
At this stage I must ask myself: Did I succeed in my goal of "providing the
IWlager with a framework .for determining and selecting the tree to be
harvested"? The answer is not a simple yes or no:
* A framework hAs been provided, but it is still incomplete and open for
improvement. For example, the succession model was developed in
FORTRAN V. Today (within four years since the development) more
efficient fourth generation computer languages and modelling packages
are freely available. Few, if any, managers would still have FORTRAN
compilers on their computers, and most will probably not be interested
in purchasing a compiler and acquainting themselves with it. There
fore, I would not recommend to incorporate the new information into the
existing FORTRAN V programme. Rather use the tested structure and
information and rewrite it using the more up to date tools. To my mind
this should be the next research priority. It might even be possible
to switch to a stochastic distance-independent modelling approach,
based on data collected during recurrent measurements on permanent
sample plots. Given sufficient data become available for a specific
forest , event ua 11 y a distance-dependent mode 11 i ng approach can be
followed. At the same time the principles, and the basic model, of the
distance-independent individual tree modelling approach could be
Univers
ity of
Cap
e Tow
n
96
applied to lesser known forests that are managed more extensively. As
experience and information are gained models can be improved following
the exact same principles followed here.
* Just as the model 1 ing approach served the researcher to col late and
contextualise a vast amount of (often apparently diverging) information
it can serve the manager in exactly the same way. Here is a model, he
does not have to develop it, but if he acquaints himself with the basic
structure of and the information used in it, it will highlight the
"grey" areas in his understanding of forest ecology. He is the one who
must have sufficient understanding to react in a sound way in situ
ations not investigated by research yet.
What direction should be followed by res6arch from here onward? We now do
have a modelling approach that works (although it should be rewritten using
more modern software), the central growth function adequately reflects forest
growth and there seem to be no major errors in the assumptions used for
constructing the model. We have a fair idea of the growth rates of trees (in
the forest types used for timber production), and have some indications that
these are very similar to growth rates in (sub)tropical forest regions else
where. It is clear that the forests are in a late successional stage, that
competition among trees is an important factor and that many later succes
sional species have superior competitive abilities under the present circum
stances. Together with the senility indices that are used by forest planners
and managers in the southern Cape already ( Seydack et al., 1992), crown
position and crown form can be useful tree growth indicators. In this way
suppressed and senile trees can be selected for harvesting effectively, pre
empting mortality to a large extent. Finally, c14 dating (and possible
radiation densitometry) of trees provides a viable method of dating trees and
determining their growth rates.
There are obvious omissions in this study, such as the study of the germi
nation and establishment of forest seedlings, their development into saplings,
the animal/plant interactions and the plant physiological processes involved.
These needs were not overlooked, but could not be addressed in this study.
Some are/were already addressed in other studies. Examples are Lttbbe and
Geldenhuys's (1991) and Koen's (1991) studies on forest regeneration, studies

Univers
ity of
Cap
e Tow
n
97
on the decline and regeneration of Ocotea bullata (Ulbbe 1990; LUbbe and
Geldenhuys 1990; Lilbbe 1991; LUbbe and Mostert 1991), Koen and Crowe's (1987)
and Koen's (1988) studies on animal-plant interactions (his 1991 study also
deals with this subject), Midgley and Bond's (1990) study on the occurrence
of and reasons for fynbos "islands" in the forest and Kotze and Geldenhuys's
(1992) study on the root systems of some forest trees. To my mind studies of
the germination and establishment of tree seedlings and their development into
saplings should receive priority. Apart from the fact that the model simula
tions yielded satisfactory results, there is no information to test or improve
the mode 1 assumptions in this respect. Management's present attitude towards
this phase of tree development is to consider it as a huge resource of
potential trees from which adequate numbers will survive to maintain the tree
composition of the forest - a type of "black box" with young trees that should
be left alone. That this assumption might work in a natural forest that is
left alone is not denied, but what is the effect of management practices on
this phase of forest development and what can be done to improve or accelerate
the survival and growth of seedlings and saplings without violating conser
vation principles? Nobody knows. Most of these."unknowns" are treated in a
stochastic way in the OUI'ENIQUA model, and these are the subjects that should
be researched. For research purposes the model is a vehicle that reflects our
current knowledge of the forest dynamics. It enables us to identify the
strengths and weaknesses in our understanding, and in this way future research
efforts can be guided into directions where information is needed most.
Forestry research in South Africa is predominantly applied (this was in fact
the case in this study too), and research topics are more and more prescribed
by managers in top positions deciding what research should or should not be
funded. The danger of this situation is that basic research (as might be
required to answer simulation model questions) will be increasingly pushed
into the background in favour of applied research. For instance, if
management is satisfied with considering the regeneration phase of forest
development as "black box" which need not be researched, it will be difficult
to obtain funding for any projects on forest regeneration. This wi 11 require
special skills on the researcher's side, and training in compiling well
motivated project proposals might have to become an important aspect of his
training in future. Too many important research projects are never executed
simply because the original proposal and planning did not meet up to the
Univers
ity of
Cap
e Tow
n
98
required standards.
Lastly, the value of permanent sample plots cannot be emphasised enough. Once
they are established, remeasurements can be done with relative low cost and
manpower input. Data from these plots form the backbone of any forest growth
study. The present study would not have been possible without at least some
of the· long-term growth data which I had available. Fortunately, a network
of permanent sample plots do exist throughout the indigenous forest of South
Africa (Geldenhuys and Van Daalen, 1992). It is of vital importance that
these plots are properly maintained and data computerised and-systematically
indexed. Techniques for remeasurements of these plots and analyses of data
obtained-should be flexible enough to adjust to altered needs and new methods.
But at the same time care must be taken that adjustments are not done so
frequently that extrapolation of results become impossible.

Univers
ity of
Cap
e Tow
n REFERENCES
for
Abstract, Section 1 and Section 3

Univers
ity of
Cap
e Tow
n
REFERENCES r
ACOCKS, J.P.H. 1953. Veld types of South Africa. Memoirs of the Botanical
Survey of South Africa 28.
ANONYMOUS. 1987. Commercial timber resources and roundwood processing in
South Africa 1985/86. Department of Environment Affairs, Pretoria.
ALDER, D. 1980. Forest volume estimation and yield prediction. Vol. 2 - Yield
prediction. FAO Forestry Paper 22/2.
ALDER, D. ~ SYNNOTT, T.J. and SMITH, J.P. 1977. GROPE: A standardized growth
projection method for tropical rain forest. In: Brunig, E.F. (ed.).
Transactions of the International MAB-IUFRO Workshop on. Tropical
Rainforest Ecosystems Research, Hamburg. pp 170-175.
BORMANN, F .H. and LIKENS, G.E. 1979. Catastrophic disturbance and the steady
state northern hardwood forests. American Science 67:660-669.
BOTKIN, D.B. 1981. Causality and succession. In: West, D.C., Shugart, H.H.
and Botkin, D.B. (eds). Forest succession: Concepts and application.
Springer-Verlag, New York. pp 36-55.
BOTKIN, D.B., JANAK, J.F. and WALLIS, J.R. 1972. Some ecological consequences
of a computer model of forest growth. Journal of Ecology 60(3):849-
872.
BRAGG, C.T. and HENRY, N.B. 1985. Modelling stand development for prediction
and control in tropical forest management. In: Shepherd, K.R. and
Richter, H.V. (eds) 1985. Managing the tropical forest. Australian
National University, Canberra. pp 281-297.
CONNELL, J.H. and SLATYER, R.O. 1977. Mechanisms of succession in natural
communities and their role in community stabi 1 ity and organization.
American Natura Ji st 111 : 1119-1144 .
COTTAM, G. 1981. Patterns of succession in different ecosystems. In: West,
C. W., Shugart, H.H. and Botkin, D.B. (eds). Forest succession.

Univers
ity of
Cap
e Tow
n
101
Concepts 811d application. Springer-Verlag, New York. pp. 178-184.
DAVIS, W., SHORTLE, W. and SHIGO, A. 1981. Growth potential of balsem fir
sites classified by measurement of cambial electrical resistance.
Scientific Contribution No. 1102 from the New Hampshire Agricultural
Experimental Station, USA.
EK, A.R. and MONSERUD, R.A. 1979. Performance and comparison of stand growth
models based on individual tree and diameter-class growth. can8dian
Journal of Forest Research 9:231-244.
FRANKLIN , J . F. and HEMSTR.OM, M.A. 1981. Aspects of success ion in the
coniferous forests of the Pacific Northwest. In: West, C.W., Shugart,
H.H. and Botkin, D.B. (eds). Forest succession. Concepts. and
application. Springer-Verlag, New York. pp. 212-229.
GELDENHUYS, C.J. 1982. The management of the southern cape forests. South
Afric811 Forestry Journal 121:4-10.
GELDENHUYS, C. J. 1987. Distribution and classification of evergreen forests. ·
In: Von Gaciow, K., Van der Zel, D.W., Van Laar, A., Schonau, A.P.G.,
Kassier, H.W., Warkotsch, P.W., Vermaas, H.F., OWen, D.L. and Jordaan,
J. V. (eds). South AfricBn Forestry Handbook, Southern African Inst i
tute of Forestry, Pretoria. pp. 443-453.
GELDENHUYS, C.J. and VAN DAALEN, J.C. 1992. History, value and maintenance
of permanent sample plots in Southern African forests. Unpublished
report to Forestry Branch: Department of Water Affairs and Forestry,
No. FOR-DEA 548, Division of Forest Science and Technology, CSIR,
Pretoria.
~Z-POMPA, A. and VASQUEZ-YANES, C. 1981. Successional studies of a rain
forest in Mexico. In: West, C. W., Shugart, H.H. and Botkin, D.B.
(eds). Forest succession. Concepts and application. Springer-Verlag,
New York. pp. 246-266.

Univers
ity of
Cap
e Tow
n
102
HORN, H.S. 1975. Markovian properties of forest succession. In: Cody, M. and
Diamonds . J. (eds). Ecology and evolution of communities. Harvard
University Press, Cambridge. pp 196-211.
HORN, H .. s. 1981. Some causes of variety in patterns of secondary succession.
In: West, D.C., Shugart, H.H. and Botkin, . D.B. (eds). Forest
succession: Concepts and application. Springer-Verlag, New York.
JANZEN, D.H. 1974. Tropical blackwater rivers, animals and mast fruiting by
the Dipterocarpaceae. Biotropica 6(2):69-103.
KOEN, J.H. 1988. Strata! distribution and resource partitioning of birds in
the Knysna forest, South Africa. African Journal of Ecology 26:229-
238.
KOEN, J .H. 1991. The effect of rodent granivory on recruitment of the
irregularly fruiting Podocarpus falcatu~ in the southern Cape. South
African Forestry Journal 159:25-28.
KOEN, J.H. and CROWE, T.M. 1987. Animal-habitat relationships in the Knysna
forest, South Africa: discrimination between forest types by birds and
invertebrates. Oecologia 72:414-422.
KOTZE, H. and GELDENHUYS, C.J. 1992. Root systems of some southern Cape
indigenous forest trees. South African Forestry Journal 163:21-25.
LANLY, J.P. 1983. Assessment of the forest resources of the tropics.
Forestry Abstracts 44:287-318.
LAlXJHTON, F .S. 1937. The silviculture of the indigenous forests of the Union
of South Africa with special reference to the forests of the Knysna
region. Government Printer, Pretoria.
LILLY, M.A. 1977. An assessment of the dendrochronological potential of
indigenous tree species in South Africa. Environmental Studies
Occasional Paper No. 18, Department of Geography and Environmental
Studies, University of the Witwatersrand, Johannesburg.

Univers
ity of
Cap
e Tow
n
103
LLOYD, E.H. 1974. What is, and what is not, a Markof chain. Journal of
Hydro logy 22: 1-28.
LUBBE, W.A. 1990. Management of the coppice regeneration of Ocotea bullata
(Lauraceae). South African Forestry Journal 157:32-37.
LUBBE, W.A. 1991. The response of Ocotea bullata (Lauraceae) to f-looded
conditions. South African Forestry Journal 159:43-50.
LUBBE, W.A. and GELDENHUYS, C.J. 1990. Decline and mortality of Ocotea
bullata trees in the southern Cape forests. South African Forestry
Journal 154:7-14.
LUBBE, W.A. and GELDENHUYS, C.J. 1991. Regeneration patterns in planted and
natural forest stands near Knysna, southern Cape. South African
Forestry Journal 159:43-50.
LUBBE, W.A. and MOSTERT, G.P. 1991. Rate of Ocotea bullata decline in
association with Phytophtora cinnamoni at three study sites in the
southern cape indigenous forests. South African Forestry Journal
159:17-24.
McKEY, D.' WATERMAN, P.G.' MBI, C.N.' GARTLAN, J.S. and STRUHSACKER, T.T.
1978. Phenolic content of vegetation in two African rain forests:
ecological implications. Science 202:61-64.
MIOOLEY, J.J. and BOND, W.J. 1990. Knysna fynbos "islands": origins and
conservation. South African Forestry Journal 153:18-21.
MILES, J. 1979. Vegetation dyn8111ics. Chapman & Hall, London.
MURRAY, B.G., Jr. 1986. The structure of theory, and the role of competition
in community dynamics. Oikos 46:145-158
NEWBANKS, D. and TATTAR, T.A. 1982. Electrical resistance and stem water
relations in Vert ici I Jiu~infected red maple. European Journal of
Forest Pathology 12:113-123.

Univers
ity of
Cap
e Tow
n
104
NOBLE, I.R~ and SLATYER, R.O. 1981. Concepts and models of succession. In:
Gill, A.M., Groves, R.H. and Noble, I.R. (eds)~ Fire BTJd Australian
biota. Australian Academy of Science. pp 312~335.
ODUM, E.P. 1971. Fundamentals .of ecology, Third edition. W.B. Saunders Co.,
Philadelphia.
OLIVER, C.O. and LARSON, B.C. 1990. Forest stand dynamics. McGraw-Hi 11, New
York.
PHILLIPS, J.F.V. 1931. Forest succession and ecology in the Knysna Region.
Memoirs of the Botanical Survey of South Africa 14.
PHILLIPS, J.F.V. 1963. The forests of George, Knysna, and the Zitzika.ma - a
brief history of their management 1778-1939. Government Printer,
Pretoria.
RICE, E.L. 1974. Allelopathy. Academic Press, New York.
SEYDACK, A.H. W. 1982. Indigenous forest management planning - a new approach.
Foris Communication 98(2) :525-553, Faculty of Forestry, University of
Stellenbosch.
SEYDACK, A.H.W., GREWAR, S.G. and VAN DIJK, D. 1982. Management system
proposals for the indigenous forests of the southern cape and
Tsitsikamma forest regions. Unpublished report, Department of
Environment Affairs, Forestry Branch, Knysna.
SEYDACK, A.H. W., VAN DAALEN, J.C., VAN DIJK, D., REYNELL, D., HEYNS, H.,
· JOOSTE, A., FERGUSON, M., PITCHFORD, W., DURRHEIM, G. and WILLEMS, D. 1990.
Yield regulation in the Knysna forests. South AfricBTJ Forestry Journal
152: 50-61.
SHEPHERD, K.R. and RICHTER, H.V. (eds) 1985. Managing the tropical forest.
Australian National University, canberra.

Univers
ity of
Cap
e Tow
n
105
SHUGART, H.H. 1984. A theory of forest dynamics. The ecological implications /
of forest succession models. Springer-Verlag, New York.
SHUGART, H.H. and WEST, D.C. 1977. Development of an Appalachian deciduous
forest succession model and its application to assessment of the impact
of chestnut blight. Journal of Environmental Management 5:161-179.
SHUGART, H.H., HOPKINS, M.S., BURGESS, I.P. and MORTLOCK, A.T. 1980. The
development of a succession model for subtropical rain forest and its
application to assess the effects of timber harvest at Wiangaree State
Forest, New South Wales. Journal of Environmental Management 11:243-
265.
STOCKER, G.C. 1985. Aspects of gap regeneration theory and the management of
tropical rainforests. In: Shepherd, K.R. and Richter, H.V. (eds) 1985.
Managing the tropical forest. Australian National University,
Canberra. pp 225-228.
SYNNOTT, T.J .. .1979. A manual of permanent plot procedures for tropical
rainforests. C.F.I. Tropical Forest~v Papers No. 14.
SYNNOTT, T.J. 1980. Tropical rainforest silviculture: A research project
report. C.F.I. Occasional Papers No.10 •
. TATTAR, T .A. and BLANCHARD, R.O. 1977. Electrical techniques. for disease
diagnosis. Journal of Arboriculture, February 1977.
VAN DAALEN, J.C. 1981. The dynamics of the indigenous forest-fynbos ecotone
in the southern cape. South African Forestry Journal 119:14-23.
VAN DAALEN, J .c. 1984. Distinguishing features of forest species on nutrient
poor soils in the southern Cape. Bothalia 15(1 & 2):229-239.
VAN DIJK~ D. 1987. Management of indigenous evergreen high forests. In: Von
Gad.ow, K., Van der Zel, D. W., Van Laar, A., SchOnau, A.P.G., Kassi er,
H.W., Warkotsch, P.W., Vermaas, H.F., Owen, D.L. and Jordaan, J.V.
(eds). South African Forestry 118ndbook, Southern African Institute of
l r

Univers
ity of
Cap
e Tow
n
106
Forestry, Pretoria. pp. 454-469.
VON BREITENBACH, F. 1968. Indigenous forest management manual volume II:
Principles of management. Unpublished report, Department of Forestry,
Pretoria.
VON BREITENBACH, F. 1974. Southern Cape forests and trees. Government
Printer, Pretoria.
WEBB, L.J. 1978. A general classification of Australian rainforests.
Australian Plants. 9: 349-363.
WHITIAKER, R.H. 1975. Communities and ecosystems, Second edition. Macmillan,
New York.