j b • ml solar energy legislative and regulatory ... · the economic developmen of tht e region...
TRANSCRIPT

J B • ML Solar Energy * * I Industries
^ ^ • • I Association®
Legislative and Regulatory Activities Division Office of the Comptroller of the Currency Mail Stop 9Q-11 400 7th Street, SW Washington, DC 20219
November 7, 2014
RE: Docket ID QCC-2014-0021 (Federal Reserve System Docket No. OP-1497)
Agencies:
Please f ind attached comments in response to the above numbered docket, "Community Reinvestment
Act: Interagency Questions and Answers Regarding Community Reinvestment." The attached comment
set is submitted on behalf of more than 1,000 companies, representing a solar industry of 143,000
American workers across the United States. Note that the entirety of the attached comments may not
reflect the opinion of every SEIA member company.
SEIA applauds the Office of the Comptrol ler of the Currency, Board of Governors of the Federal Reserve
System, and Federal Deposit Insurance Corporation for undertaking this t imely review of critical aspects
of the Community Reinvestment Act (CRA). In particular, we strongly endorse the final issuance of
guidance aff i rming that renewable energy facilities and energy efficiency enhancements responsive to
local needs are eligible for CRA consideration.
We do feel that fur ther clarification in a number of key areas wil l increase the success of the CRA as
intended by the Agencies. Our comments focus on CRA regulations 12 CFR .12(g)(3) on economic
development definit ions in the context of renewable energy, energy efficiency and energy storage, and
505 9th Street, NW • Suite 800 • Washington, DC 20004 • 202.682.0556(T) • 202.682.0559(F) • www.SEIA.org
12 CFR .12(h) regarding community development loans for renewable energy, energy efficiency and
energy storage purposes.
If you have any questions regarding the attached submission, please contact me directly at the
coordinates below. Thank you for your consideration.
Thomas P. Kimbis Vice President for Executive Affairs & General Counsel Solar Energy Industries Association (SEIA) 505 9th Street, NW Suite 800 Washington, DC 20004 202-682-0556 (main) 202-469-3737 (direct) [email protected]
Sincerely,

Docket ID QCC-2014-0021 (Federal Reserve System Docket No. OP-1497)
Stakeholder Comments from the Solar Energy Industries Association, Inc., (SEIA) on
"Community Reinvestment Act: Interagency Questions and Answers Regarding Community Reinvestment."
The below comments represent the aggregate comments of the stakeholders ("Stakeholders") listed
at the end of this document on the above-referenced docket ("Proposed Q&A"). Comments submitted
focus on two of the ten topics identified for clarification in the Proposed Q&A:
III. A. "Economic Development" and
III. B. "Community Development Loans."
The proposed questions and answers (Q&A) address definitions regarding economic development as
stated in 12 CFR .12(g)(3), including the "purpose test", intended to ensure that the activities of any
financial institution acting under CRA promote economic development as CRA intends. According to
existing Q&A in this area, the purpose test requires that activities "support permanent job creation,
retention, and/or improvement for persons who are currently low- or moderate income, or support
permanent job creation, retention, and/or improvement either in low- or moderate-income geographies
or in areas targeted for redevelopment by Federal, state, local or tribal governments." We support the
direction of the proposed Q&A that adds examples demonstrating economic development such as job or
career training programs, small business creation, and technical assistance within CRA targeted
geographies. However, due to the enormous and diverse economic benefits of renewable energy and
energy efficiency activities to the intended beneficiaries under the CRA, we strongly encourage the
addition of broader language and additional examples that clarify that such benefits qualify such
activities for CRA consideration.

Docket ID OCC-2014-0021 (Federal Reserve System Docket No. OP-1497) SEIA Response
Specific Questions within the Proposed Q&A
10. Does the proposed revised guidance clarify what economic development activities are
considered under CRA?
Permanent Jobs
The term "permanent," referenced twice in the above "purpose test" 12 CFR .12(g)(3)
language in reference to job creation, retent ion or improvement, is problematic in both its existence
alone, as well as its interpretat ion, in ensuring that financial institutions are able to invest in low and
middle income communit ies as the CRA intends.
Although the existing Q&A cite "support [of] permanent job creation" as a requirement, there is
no substantial guidance on the nature of "permanent" . For instance, a substantial number of the jobs
created by the renewable energy and energy efficiency industries in low- or moderate-income
geographies are craftsman and tradesman positions, such as carpenters, electricians, plumbers, and
roofers. Although a particular renewable energy or energy efficiency project may not create a
permanent, ful l - t ime craftsman or tradesman position, it may create th i r ty person-years of full t ime
work, similar to the career length of a worker in a permanent position.
In addit ion, the very need for the CRA in the first place is because of the lack of sufficient private
market forces to drive economic growth in designated areas as quickly as in other areas, if at all.
Understanding the characteristics of the well-recognized market adoption curve developed by Everett
Rogers, including its sequencing and t iming, is of critical importance to the success of CRA activities that
involve introduct ion of technologies or services to a given market.1 The success of creating of a localized
market for goods and services, especially those that involve the physical installation of equipment on
1 E.g., http://cancergrace.org/cancer-101/fi les/2014/08/technology-adoption-curve-Rogers.png
2

Docket ID OCC-2014-0021 (Federal Reserve System Docket No. OP-1497) SEIA Response
real property, is dependent upon " innovators" and "early adopters", as designated on the adoption
curve.
CRA stimulates the demand for these goods and services by facil itating their introduct ion into
regions by, in part, reliance on innovators and early adopters to choose these goods and services. Yet,
depending on the size of the market and speed wi th which it matures, the initial projects in any given
geography may begin w i th the creation of part-t ime, permanent jobs that mature into ful l-t ime,
permanent jobs. CRA can help communit ies by incenting the first installation in a communi ty that has
no experience wi th solar energy technology or its benefits. According to a growing number of academic
studies, a strong "neighborhood effect" is seen wi th solar energy system deployment in markets around
the wor ld: once a technology is adopted by one resident of a community, its acceptance rates among
other members skyrockets.2 In addit ion, there is a direct correlation between the increased adoption of
renewable energy and energy efficiency products and services and the creation of permanent jobs. In
fact, wi th in the U.S. solar industry alone, there are more than 143,000 Americans employed in
permanent positions.3
The phrase "permanent job" is itself somewhat antiquated. The labor market in the U.S. over
the twent ie th century grew famously fluid, despite some t ightening of that f luidity in recent years.4
Persons of low-and moderate incomes, or individuals in low-or moderate-income geographies or areas
targeted by governments for redevelopment, change employers, job types, industries, and geographies
during the course of their working lives like other Americans. As of January 2014, the median number of
2 E.g., http://ioeg.oxfordiournals.org/content/early/2014/10/07/ieg.lbu036.abstract and http://www.academia.edu/8141230/Solar energy integration in urban planning GUUD model 3 National Solar Jobs Census 2013, The Solar Foundation, www.solarfound.org 4 http://www.economist.com/news/finance-and-economics/21614159-americas-famously-flexible-labour-market-becoming-less-so-fluid-dynamics
3

Docket ID OCC-2014-0021 (Federal Reserve System Docket No. OP-1497) SEIA Response
years that U.S. wage and salary workers had been wi th their current employer was only 4.6 years, w i th
significant drop-off in length of tenure for those who had not obtained a high school diploma.5
As wr i t ten, it is unclear of whether a "permanent job" is one that must remain w i th the same
employer, of the same type, in the same industry, or wi th in the same geography to be considered
"permanent." Nor is it specified for how long a period is necessary for a job to qualify as "permanent" ,
or whether a hiatus in a job, such as for materni ty leave or educational pursuits, disqualifies an
individual's job f rom being "permanent" .
Jobs come f rom sustainable product and service markets wi th in any geography, regardless of
income levels. In order to build a sustainable marketplace for renewable and energy efficient
technologies, there must first be sufficient available capital at a low enough cost for developers to
undertake projects. Currently, there is strong interest by the renewable energy and energy efficiency
industries in building projects that bring private dollars, institutional knowledge, and jobs to low- and
mid-income communit ies. To build a sustainable local or regional renewable energy or energy efficiency
market, certain conditions are needed, such as:
Awareness by energy purchasers of their renewable energy and energy efficiency options and
the financial savings accompanying those options
Ability to obtain routine service and warranty coverage on any renewable energy and energy
efficiency installations
Financing options that work for the purchaser, such as those that overcome the first cost of
certain technologies or projects (e.g. energy efficiency or roof top solar projects may require all
funds to be paid upfront, whi le the energy savings accrue over t ime)
5 N.b. Table 4: http://www.bls.gov/news.release/tenure.nrO.htm
4

Docket ID OCC-2014-0021 (Federal Reserve System Docket No. OP-1497) SEIA Response
Because institutions and those they serve generally proceed methodically, we tend to see modest
initial investments, w i th fewer initial jobs created, prior to a more full investment and job creation
impact once the market reaches strength. Those initial projects may not alone create permanent jobs
they may create a year-long construction job but they are necessary to create a sustainable,
permanent market in CRA-targeted geographies with permanent jobs. This is a similar model to
construction jobs in an economically-challenged area. Incentives are sometimes needed to motivate
financial institutions to fund new construction projects in such areas where new build has not occurred
for decades. Such construction jobs are temporary by nature, but can and wil l lead to permanent jobs if
the economic development of the region continues. The same is t rue w i th renewable energy and energy
efficiency projects.
Such vagaries of the term "permanent" prevent financial institutions and project developers
f rom pursuing renewable energy and energy efficiency projects that could normally qualify for credit
under and support the goals of the CRA. Clarification of the term "permanent" and the phrase
"permanent job creation" would assist lenders and project developers in meeting the intended
requirement and demonstrat ing economic development impact of an activity on intended beneficiaries
or areas. Any definit ion, whi le still requiring lenders to meet the "purpose test" by proving economic
development job creation, retention, and/or improvement, should be conceived in the context of a fast-
evolving economy and fluid labor force in general, especially given the cyclical nature of construction
and related positions.6
6 The Agencies suggest a similar language revision within the Notice, due to the possible unintended consequences of focusing bank community development activities on the support of low-wage jobs, by proposing removal of the word "currently" from existing guidance under Q&A Sec. .12(g)(3). Similarly, the Agencies could to re-examine the word "permanent" when referring to job creation, as it is both vague in meaning creating uncertainty in how to achieve it and dampening on the types of meaningful economic development that could be brought to communities and persons the CRA is designed to benefit.
5

Docket ID OCC-2014-0021 (Federal Reserve System Docket No. OP-1497) SEIA Response
We respectfully request that the Agencies clarify that, although activities that promote
permanent job creation, retention, and/or improvement do suffice to meet the "purpose test" of Q&A
Sec. .12(g)(3), they are not the exclusive means of meeting the "purpose test" in demonstrat ing that a
financial institution's activities promote economic development consistent w i th the intent of the CRA.
The Agencies could then offer examples of how the banking communi ty could meet the core
requirement of the CRA of promot ing economic development through the expected impact of the
activity in support ing the development of a sustainable local market for goods or services which, in the
case of renewable energy and energy efficiency, necessitates permanent jobs. One key example could
i l luminate that the "purpose test" may be satisfied by the creation of ful l- t ime jobs that last for the
durat ion of the project period w i th a realistic expectation that the project creation wil l st imulate the
demand for additional projects wi th in that geographic market sufficient to consider such positions as
permanent jobs.
Community Solar
The reference in the draft Q&A to "affordable housing or community facil ity" is unclear and in
the case of "affordable housing" a circular reference. Given that affordable housing is already defined
as "communi ty development," the guidance provides l i t t le help as of ten renewable energy or energy
efficiency projects in an affordable housing project require treat ing most or all of the energy or
efficiency equipment or materials as part of either the physical structure of the housing and/or the
federal income tax basis of the affordable housing tax credit.
Community solar provides an example of a new technology use that directly promotes the goals
of the CRA when deployed in targeted CRA territories. In communi ty solar, affordable housing projects
or buildings, or individuals intended as beneficiaries under the CRA can have power bills lowered by a
local solar installation not attached to a community building or facility. This installation nonetheless
6

Docket ID OCC-2014-0021 (Federal Reserve System Docket No. OP-1497) SEIA Response
serves the energy needs of the building's tenants, or the common areas of the affordable housing
project or communi ty facility and/or the broader low and moderate income area. Community solar can
be financially attractive due to economies of scale by building one centralized local system for electricity
product ion that provides power to the intended CRA beneficiaries rather than placing solar equipment
on the roofs of mult iple affordable housing projects. Wir ing costs, racking for solar panels, and siting
costs can all be cheaper than roof top solar for certain projects. The communi ty solar project remains
local but "stand a lone" - of ten in an unused lot or brownfield. In other cases, communi ty solar allows
those who otherwise could not benefit f rom cost-cutting solar power when roof top solar is infeasible
because of shading or other siting issues on particular communi ty centers or housing projects.
"Microgr id" systems are similar f rom a benefit perspective, w i th a mixture of distr ibuted generation
roof top or groundmount systems, combined wi th storage technologies to keep targeted communit ies
and their residents w i th power during electricity grid outages.
This t reatment needs to be clear under the CRA guidance because of the nascent nature of such
"stand alone" communi ty and microgrid power systems, and the unfamiliarity wi th many bankers about
their characteristics. Renewable technology, its deployment techniques, and lending have all changed
dramatically in the last decade. It is these market and lending advancements that in turn require
clarification. Accordingly, the guidance should clarify that regardless of whether the renewable energy
or energy efficiency equipment or materials are physically part of, or separately apart f rom, the
affordable housing or communi ty facility, lending to a renewable energy company that provides
renewable energy generating equipment under a lease, power-purchase agreement, energy services
contract or otherwise, and whereby such affordable housing or communi ty facility may obtain part or all
of its energy needs and/or the needs of its residents or customers in the intended CRA beneficiary
7

Docket ID OCC-2014-0021 (Federal Reserve System Docket No. OP-1497) SEIA Response
community, such lending to a "stand alone" renewable energy or energy efficiency provider should be in
and of itself eligible for CRA consideration.
Consistent w i th this express and necessary clarification as to stand alone renewable energy or
energy efficiency providers, the providers of community renewables, e.g, "communi ty solar" or
"communi ty wind" and/or "micro-grid" providers should also be listed as express examples of the kind
of project and borrowings that this guidance authorizes and supports for CRA eligibility.
Also critical to include in the guidance on renewable energy systems is the eligibility of energy
storage and conversion technologies. Although such technologies, such as batteries, flywheels, smart
inverters, compressed air, thermal storage, fuel cells, power conditioners, salt systems, and other
storage and conversion technologies do not generate electricity in the same manner as a renewable
resource, these technologies can store and deploy energy as flexible capacity that enhances
the efficiency of renewable resources and improves the quality of such energy so it is of higher value to
the end consumer.
If a microgrid is not connected to the local electricity grid, and is relying on solar for power,
there would be fluctuations in output depending on when the sun shined. Storage is an integral part of
the solution since it can store electricity or heat generated f rom intermi t tent resources and dispatch
them to the end consumer as needed. Storage technologies also allow for use of power or heat in a
blackout or disaster, when low- and mid-income communit ies are of ten hit hardest due to weak
infrastructure. In fact, energy storage can serve mult iple purposes that other systems on the
grid. Energy storage resources can provide numerous solutions for challenges to the electric gr id—from
generation services like arbitrage, ancillary services and renewables f irming, to transmission and
distr ibution services such as reducing circuit and line overload, enabling grid resiliency, and voltage
support.
8
Docket ID OCC-2014-0021 (Federal Reserve System Docket No. OP-1497) SEIA Response
Brownfields
Brownfields are distressed lands, many the site of chemical or other environmental
contamination, that cannot be used for normal residential or commercial development. Often, they are
located in the same low- and moderate- income communit ies intended to benefit f rom the CRA. Each
brownfield site represents a waste of a communi ty asset, a non-productive property and net liability for
the community. Fortunately, renewable energy technology, such as solar, when installed on otherwise
burdened brownfield sites can create positive economic impact in low and moderate income areas by
lowering the cost of power, increasing power stability and quality to low- and mid- income users,
creating jobs, and increasing the local tax base.
Consistent w i th the need for "communi ty" and "micro-grid" related borrowing, the Agencies
should expressly clarify in the final Q&A guidance language that "brownf ie ld" development of
renewable energy projects in low and moderate income areas or that serve low or moderated income
individuals, but are not physically attached to the low- or mid- income facilities, housing, or communi ty
centers, are eligible for CRA consideration.
Property Assessed Clean Energy (PACE)
Property Assessed Clean Energy (PACE) financing is a relatively recent innovation that,
although it has faced stumbling blocks especially wi th in the residential market segment, has enormous
potential to drive renewable energy, energy efficiency and storage projects wi th in CRA-focused
geographic areas.7 Dozens of states and municipalities have developed PACE programs or legislation.
The largest obstacle to rapid uptake of PACE, especially in the residential market segment, has involved
7 See: http://www.dsireusa.org/solar/solarpolicyguide/Pich26 for additional information.
9

Docket ID OCC-2014-0021 (Federal Reserve System Docket No. OP-1497) SEIA Response
lien priorit ization as determined by the Federal Housing Finance Agency (FHFA).8 Yet, even today,
according to a national PACE organization, " [ t ]wenty- f ive programs now make PACE financing available
in nearly 500 cities and towns in nine states and Washington, D.C. More than 250 PACE projects wor th
over $75 mil l ion have been completed; programs report a total pipeline of more than $250 mil l ion in
project applications."9
In addit ion, the success of PACE programs could create a compounding effect on benefits to the
intended beneficiaries of CRA. A renewable energy, energy efficiency and/or storage project could
capitalize on the combination of federal-state/ local policies through the Agencies' CRA lending
incentives and state/local PACE program. The economic benefit that they can bring to those who benefit
f rom the CRA is determined by the creativity of stakeholders in developing advanced lending and
ownership structures, the willingness of state and local policymakers to develop PACE programs, and the
assurance that PACE programs are not encumbered or slowed unintentionally by regulations of indirect
relevance.
The reference to retent ion of lien position in the Community Development Loans section of the
Proposed Q&A is redundant w i th existing practice and may lead to confusion over the ability of PACE
programs to properly funct ion wi th in CRA-targeted areas. Therefore, whi le we agree that lending
practices must be safe and sound, we respectfully request that the Agencies remove the language
stricken in the excerpt below f rom Proposed Q&A in regard to Community Development Loans when
draft ing the final Q&A:
See: http://pacenow.Org/settina-the-pace-2-0/#sthash.MuECwluT.dpuf 9 Ibid.
10

Docket ID OCC-2014-0021 (Federal Reserve System Docket No. OP-1497) SEIA Response
"All loans considered in an institution's CRA evaluation, including loans that finance renewable
energy or energy-efficient technologies, must be consistent w i th the safe and sound operat ion of the
insti tut ion and should not include foaturos that could compromiso any lender's existing lion position."
11. What information should examiners use to demonstrate that an activity meets the size and
purpose tests described in the proposed revised guidance?
The intent of the CRA is to ensure that low- and mid-income persons and communit ies receive
true and measurable economic benefits through lending practices. Keeping that congressional intent in
mind, Agencies should direct examiners to look at direct and indirect economic impacts in their analysis
of projects. Jobs are critically important, and allow individuals to generate income after an investment
that obtains CRA credit has been completed, and are understandably an important metric for examiners.
Yet, lending to projects may provide communit ies and individuals w i th other direct and indirect
economic benefits that are very real, and have lasting impact, but must be measured wi th a more
expansive set of metrics by CRA examiners.
Energy not only drives our national economy, it is necessary in every community 's growth and in
every residence in America today. For example, w i thout electricity, learning through electronic tools or
by the internet, including online education and training that allows many of today's workers to develop
the skills to f ind jobs, would be impossible. Projects that lower an electricity bill, such as solar projects in
the right conditions, may mean the difference between using a computer, monitor, printer, and
associated electronic products needed for such distance learning or forgoing that opportuni ty. Energy
efficiency also has a similar impact in lowering the costs of energy bills, al lowing funds to be spent
elsewhere; using the same example, lower heating bills through energy efficiency may allow a
communi ty center to purchase a faster computer wi th high-speed internet access necessary for
operating large educational engineering, architectural, or visual arts tools.
11
Docket ID OCC-2014-0021 (Federal Reserve System Docket No. OP-1497) SEIA Response
The benefits are many f rom lowering the cost of a unit of energy (electric or thermal) f rom
renewable energy, to cutt ing the amount of those units needed by low- and middle- income Americans
through energy efficiency, to reducing the crippling cost of health impacts f rom heritage fossil fuels that
pollute air and water. Luckily, there are both completed and ongoing studies across the nation looking
to calculate these costs and develop common sets of benefits in order to help shape national and state
energy policies.10
12. Does the proposed revised guidance help to clarify what is meant by job creation for low-
or moderate-income individuals?
[Please see the response under Question 10 re: "Permanent Jobs."]
13. Are the proposed examples demonstrating that an activity promotes economic
development for CRA purposes appropriate? Are there other examples the Agencies should include
that would demonstrate that an activity promotes economic development for CRA purposes?
[Please see the response under Question 11 on direct and indirect benefits.]
While the proposed examples demonstrat ing that an activity promotes economic development
for CRA purposes were, in the past, appropriate before the advent of commercially available and cost
effective solar energy and other renewable energy or energy efficiency technologies, the examples
should be refreshed by the provision of solar or other renewable or energy efficiency and/or storage
technology project examples. Examples using these newer technologies and their applications are
particularly helpful to lenders who are just beginning to explore their use in low- and mid-income
10 Many analyses have been conducted in response to state level debates over the benefits and costs of distributed solar to the grid. These are helpful in understanding the greater value of solar, although focused on distributed solar. See: A Regulator's Guidebook: Calculating the Benefits and Costs of Distributed Solar Generation, IREC (July 2013), this comprehensive report, http://michigan.gov/documents/mpsc/irecguidebook 448505 7.pdf; as well as a recent report before the Nevada Public Utility Commission, http://puc.nv.gov/uploadedFiles/pucnvgov/Content/About/Media Outreach/Announcements/Announcements/E3 %20PUCN%20NEM%20Report%202014.pdf
12
Docket ID OCC-2014-0021 (Federal Reserve System Docket No. OP-1497) SEIA Response
communit ies targeted by the CRA. Solar energy is one of the fastest growing industries in the U.S.
today, despite an economic recession and slow recovery.11 Federal guidance needs to stay current w i th
the information lenders need to keep this growth going, creating jobs across the nation, not impede its
growth in areas or for persons intended to benefit under the CRA.
The fast-evolving energy marketplace has finally caught up w i th the guidance of the Agencies,
causing a critical need for the Agencies to address the needs of low and moderate income individuals
not only today, at the t ime these Q&A are being considered, but what can be reasonably, even
conservatively, expected during the t ime the current regulatory approval process and their lifespan as
final guidance before the next revision cycle. Improvements in both energy efficiency and renewable
energy technology and cost reductions continue to accelerate at an incredible rate.12
14. What information should examiners review when determining the performance context of
an institution seeking CRA consideration for its economic development activities?
As stated above, the current regulations place too much emphasis on permanent job creation,
which may have been an appropriate proxy for economic development in past years. Attached in the
appendix are two jobs studies that represent the typical jobs make up of a large and smaller scale solar
project. You wil l note that just as an affordable housing project has many up-front construction jobs
which are then el iminated leaving far fewer residual permanent jobs, so too is the case wi th renewable
energy projects. The ratio may be slight dif ferent, but the fact is the same, and in either case, the benefit
to the community is real. For the CRA to remain relevant to the t imes and persons it serves, less
11 ht tp: / /www.renewableenergvwor ld.com/rea/news/ar t ic le/2014/01/solar- iobs-growing- ten- t imes-faster- than-nat ional-average-emplovment-growth 12 See Lazard's Annual Levelized Cost of Energy Analysis - V e r s i o n 8.0, demonstrat ing the compet i t ive prices of solar and other renewable energy and energy efficiency technologies. http://www.lazard.com/PDF/Levelized%20Cost%20of%20Energy%20-%20Version%208.0.pdf (note: Slide 2)
13
Docket ID OCC-2014-0021 (Federal Reserve System Docket No. OP-1497) SEIA Response
emphasis should be given to jobs and more emphasis put on the direct and indirect, individual and
public benefits of solar and other renewable energy and energy efficiency technologies.
16. Are there particular measurements of impact that examiners should consider when
evaluating the quality of jobs created, retained, or improved?
As discussed above, there are universities, state and national efforts to determine the particular
measurement of impact of renewable energy and energy efficiency on jobs created and other economic
benefits. Much of the national discussion on this matter, in terms of solar energy deployment, takes
place in the forum of "value of solar" (VOS) debates. Although VOS discussions are not precisely the
same as the issues raised herein, they contain very similar categories of analysis, including certain
subsets of measurements. VOS efforts seek to determine the value (costs and benefits) of adding solar
particularly retail distr ibuted solar to the current electric grid. The value may be to the ratepayer or to
the util ity, as well as other stakeholders. Some of those measurements can also be used in the CRA
context to determine positive economic impact of solar project development to low- and mid-income
residents and CRA-targeted communit ies.13
17. Should loans for renewable energy or energy-efficient equipment or projects that support
the development, rehabilitation, improvement, or maintenance of community facilities that serve low-
or moderate-income individuals be considered under the CRA regulations?
Yes. The Agencies have made significant process in the issuance of the draft Q&A and should be
commended for consideration of this issue. There is little doubt that, for reasons ment ioned throughout
this response and its attachments, renewable energy and energy efficiency equipment and projects can
13 See: A Regulator's Guidebook: Calculating the Benefits and Costs of Distributed Solar Generation, IREC (July 2013), this comprehensive report, http://michigan.gov/documents/mpsc/irecguidebook 448505 7.pdf; as well as a recent report before the Nevada Public Utility Commission, http://puc.nv.gov/uploadedFiles/pucnvgov/Content/About/Media Outreach/Announcements/Announcements/E3 %20PUCN%20NEM%20Report%202014.pdf
14

Docket ID OCC-2014-0021 (Federal Reserve System Docket No. OP-1497) SEIA Response
have major economic benefits and improve the lives of those for whom the CRA is intended to benefit.
The Agencies should publish in the final Q&A not only the informat ion included in the draft Q&A, but
also should supplement it w i th the information requested throughout this response to ensure the
maximum impact on lender decisions simply through clarification.
This ef fort is all about clarity. To provide greater clarity to lenders in reaching a lending decision,
the Agencies should explicitly list in the final Q&A the types of technologies that qualify as "renewable
energy technologies." This list should not be meant as exhaustive, as new renewable energy
technologies even those using the same renewable energy sources may emerge over t ime. We
suggest the final Q&A reference "renewable energy" as defined in Executive Order 13514, w i th the
additional specification of "(using technologies including but not l imited to photovoltaics, solar heating
and cooling, and concentrating solar power technologies)" after "solar".14 As ment ioned above, lending
for energy efficiency and energy storage technologies and projects should also be included for CRA
consideration.
14 Executive Order 13514 (Oct. 5, 2009) states in relevant part: " "renewable energy" means energy produced by solar, wind,
biomass, landfil l gas, ocean (including t idal, wave, current, and thermal) , geothermal, municipal solid waste, or new hydroelectric generation capacity achieved f rom increased efficiency or additions of new capacity at an existing hydroelectric project;"
15

Docket ID OCC-2014-0021 (Federal Reserve System Docket No. OP-1497) SEIA Response
Appendix A: Solar Jobs Study for the Camilla Solar
Farm Development Project
16

Docket ID OCC-2014-0021 (Federal Reserve System Docket No. OP-1497) SEIA Response
The Economic and Workforce Development Impacts of
The Camilla Solar Farm Development Project
Prepared for:
Solar Design and Development
By:
Richard Clinch, Ph.D.
Date:
April 2012
17

Docket ID OCC-2014-0021 (Federal Reserve System Docket No. OP-1497) SEIA Response
1 . 0 Introduction and Summary
Solar Design and Deve lopment re ta ined Richard Clinch, PhD Director of Economic Research at
t he Jacob France Inst i tu te of t he Mer r i ck School of Business at the Universi ty of Ba l t imore (JFI) to
analyze the economic 1 5 and wo rk fo rce deve lopmen t impl icat ions of the deve lopmen t of t he Camilla
Solar Farm Deve lopment Project on the Georgia economy. 1 6 The t w o goals of this analysis are:
1. To prepare and present information on the economic and workforce development impacts resulting from the construction and operation of the Camilla Solar Farm Development Project; and
2. To analyze the impact of the construction and operation of the Camilla Solar Farm Development Project in terms of creating employment opportunities for low income residents in Georgia as a component of the use of New Market Tax Credits (NMTC) to support this project.
The Camilla Solar Farm Development Project will have the following impacts:
• The construction and operation of the Camilla Solar Farm Development Project will directly create 133.7 FTE construction-related jobs and partially support 2.8 FTE
17 operational jobs maintaining and servicing the solar facility ;
• The construction expenditures associated with the Camilla Solar Farm Development Project will generate $38.7 million in economic activity in Georgia, and when multiplier effects are included, create 344.1 FTE jobs earning $15.6 million in employee earnings;
• Once the Camilla Solar Farm Development Project is constructed and operational it will generate more than $2.4 million per year in electricity sales;
• The annual operations and maintenance spending on in-State labor, maintenance and equipment will support 2.8 FTE Solar Maintenance Technicians and when multiplier effects are included support 4.6 FTE workers statewide, earning $248,820 and increase economic activity in Georgia by $434,746. The facility will generate an estimated $187,500 in annual property taxes; and
• Seventy-nine percent (79%) of the direct and multiplier effect jobs created by the construction of the Camilla Solar Farm Development Project are low-skilled jobs accessible to low income residents, and an estimated 70% have access to retirement benefits and 76% have access to medical benefits. All of the direct jobs created by the operation of the solar facility will have access to benefits.
15 This analysis does not assess the extent to which the Camilla Solar Farm Development Project competes with or substitutes for other development activity. Thus, this analysis measures the relationship between this development activity and the larger State of Georgia economy. 16 The development is located in Mitchell County, Georgia; however, the National Renewable Energy Lab's (NREL) Jobs and Economic Development Impact (JEDI) model used is only available at the State level. As described in the Methodology Section below, this state-level model was used because it was created to analyze the impacts of the highly specialized solar and other renewable energy sector projects. 17 The NREL-JEDI Model estimated jobs on a Full Time Equivalent (FTE) basis wi th one job equaling 1 FTE person year of 2,080 hours. The main economic impact of a solar facility is from its construction and a higher number of persons will be employed - but only on a part-time basis on the construction site. Job impacts are presented on an FTE basis in order to better understand the actual number of jobs created on an annualized basis.
18
Docket ID OCC-2014-0021 (Federal Reserve System Docket No. OP-1497) SEIA Response
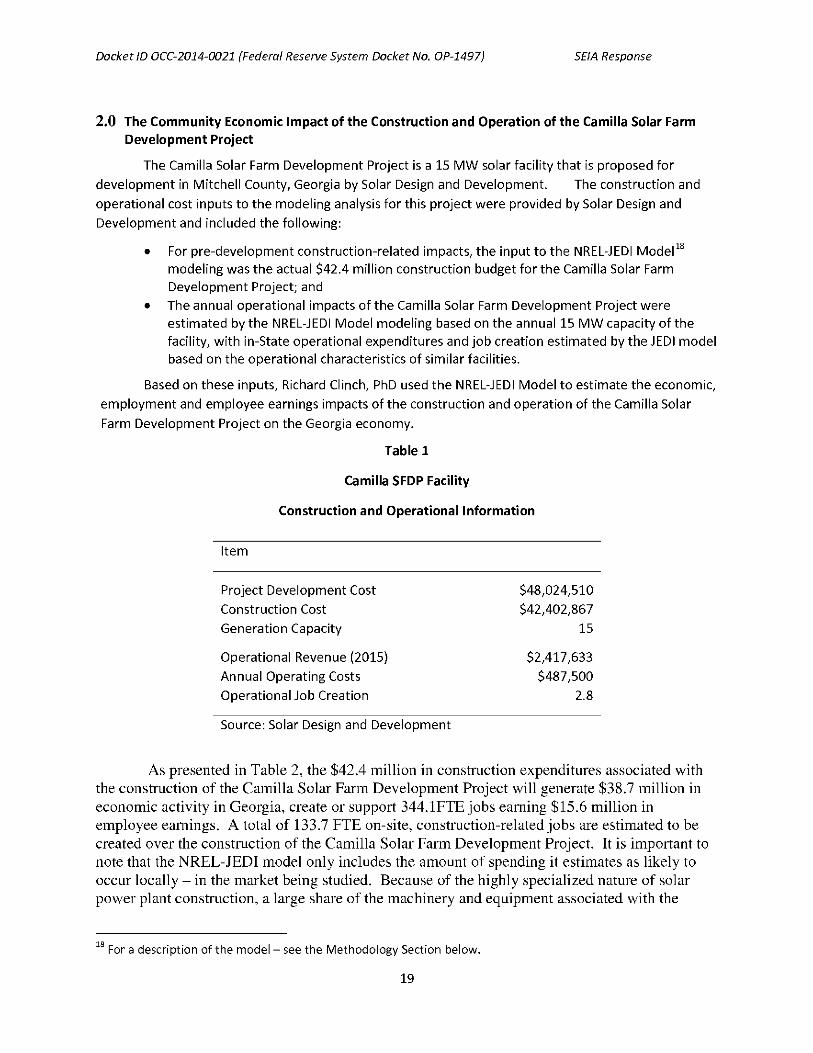
2 . 0 The Community Economic Impact of the Construction and Operation of the Camilla Solar Farm Development Project
The Camilla Solar Farm Development Project is a 15 M W solar facility that is proposed for development in Mitchell County, Georgia by Solar Design and Development. The construction and operational cost inputs to the modeling analysis for this project were provided by Solar Design and Development and included the fol lowing:
• For pre-development construction-related impacts, the input to the NREL-JEDI Model18
modeling was the actual $42.4 mil l ion construction budget for the Camilla Solar Farm Development Project; and
• The annual operational impacts of the Camilla Solar Farm Development Project were estimated by the NREL-JEDI Model modeling based on the annual 15 M W capacity of the facility, w i th in-State operational expenditures and job creation estimated by the JEDI model based on the operational characteristics of similar facilities.
Based on these inputs, Richard Clinch, PhD used the NREL-JEDI Model to estimate the economic, employment and employee earnings impacts of the construction and operat ion of the Camilla Solar Farm Development Project on the Georgia economy.
Table 1
Camilla SFDP Facility
Construction and Operational Information
Item
Project Development $48,024,510 Construction Cost $42,402,867 Generation Capacity 15
Operational Revenue (2015) $2,417,633 Annual Operating Costs $487,500 Operational Job Creation 2.8
Source: Solar Design and Development
As presented in Table 2, the $42.4 million in construction expenditures associated with the construction of the Camilla Solar Farm Development Project will generate $38.7 million in economic activity in Georgia, create or support 344.1FTE jobs earning $15.6 million in employee earnings. A total of 133.7 FTE on-site, construction-related jobs are estimated to be created over the construction of the Camilla Solar Farm Development Project. It is important to note that the NREL-JEDI model only includes the amount of spending it estimates as likely to occur locally - in the market being studied. Because of the highly specialized nature of solar power plant construction, a large share of the machinery and equipment associated with the
18 For a description of the model see the Methodology Section below.
19
Cost
Cos

Docket ID OCC-2014-0021 (Federal Reserve System Docket No. OP-1497) SEIA Response
development of a project are likely to be imported from outside of the region, and are, therefore, not counted in the economic and job impacts analysis.
Table 2
Camilla SFDP Facility
Economic Impacts of Construction Expenditures
(Jobs and 2012$)
Annual Annual
Annual Earnings Output
Construction Phase Jobs (2010$) (2010$)
Project Development and Onsite Labor Impacts 133.7 $7,156,142 $11,778,023
Construction and Installation Labor 59.7 $3,863,675 -
Construction and Installation Related Services 74.0 $3,292,467 -
Module and Supply Chain Impacts 123.7 $5,229,613 $16,010,000
Induced Impacts 86.7 $3,187,696 $10,948,086
Total Impacts 344.1 $15,573,451 $38,736,110
Average Employee Earnings per Job ($s) $45,255
Source: JEDI Model
The ongoing economic activity generated in the Georgia economy by the operation of the Camilla Solar Farm Development Project is presented in Table 3. Once the Camilla Solar Farm Development Project is constructed and operational it will generate approximately $2.4 million in electricity sales. The annual operations and maintenance spending on in-State labor and maintenance and equipment will support 2.8 FTE Solar Maintenance Technicians and when multiplier effects are included support 4.6 FTE workers statewide, earning $248,820 and increase economic activity in Georgia by $434,746. The facility will generate an estimated $187,500 in annual property taxes. It is again important to note that, as with construction impacts, the NREL-JEDI model only includes the on-site operational, maintenance, and support expenditures estimated as likely to occur in the region being studied.
20

Docket ID OCC-2014-0021 (Federal Reserve System Docket No. OP-1497) SEIA Response
Table 3
Camilla SFDP Facility
Economic Impacts of Operations
(Jobs and 2012$)
Annual Annual
Annual Earnings Output
Operational Phase Jobs (2010$) (2010$)
Onsite Labor Impacts
PV Project Labor Only 2.8 $167,186 $167,186
Local Revenue and Supply Chain Impacts 1.0 $51,161 $162,894
Induced Impacts 0.8 $30,473 $104,665
Total Impacts 4.6 $248,820 $434,746
Annual Property Tax Revenues $187,500
Source: JEDI Model
3.0 NMTC Impacts of the Construction of the Camilla Solar Farm Development Project The NMTC program's goal is that funded projects wil l have a positive community development
and economic impact on distressed communit ies. One of the key benefits tracked by the program is the number of jobs for low-income persons that are created or maintained. In the Community Impact port ion of the NMTC funding application, applicants are asked to present the number of Jobs Created or Maintained by any predevelopment/construct ion and properties developed by QLICIs for planned investments. This analysis wil l present the results of the job impact estimates for the project presented above in a format applicable to the NMTC Program's goals.19
There is no generally accepted means of estimating the number of jobs held or that could be held by low-income individuals. This analysis, therefore, estimates the number of jobs created that is low-skill and therefore, accessible in terms of skills profiles to low income populations, who generally have lower levels of educational at ta inment and job skills. This was accomplished by using an occupational matrix based on U.S. Bureau of Labor Statistics (BLS) occupational employment developed by IMPLAN. This matrix allows for the estimation of the occupational profile of the jobs estimated by
19 This is based on the 2010 NMTC application. Future applications may require dif ferent community impact calculations.
21
Docket ID OCC-2014-0021 (Federal Reserve System Docket No. OP-1497) SEIA Response
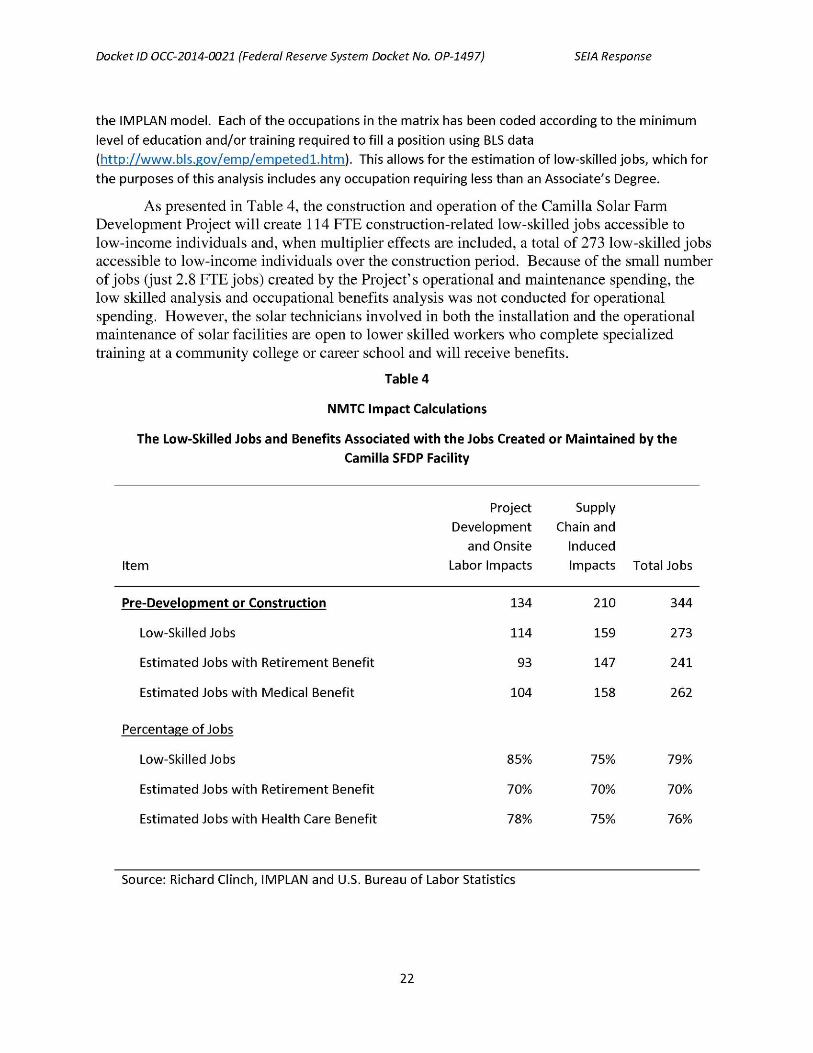
the IMPLAN model. Each of the occupations in the matrix has been coded according to the min imum level of education and/or training required to fill a position using BLS data
(h t tp : / /www.b ls .gov /emp/empeted l .h tm) . This allows for the estimation of low-skilled jobs, which for the purposes of this analysis includes any occupation requiring less than an Associate's Degree.
As presented in Table 4, the construction and operation of the Camilla Solar Farm Development Project will create 114 FTE construction-related low-skilled jobs accessible to low-income individuals and, when multiplier effects are included, a total of 273 low-skilled jobs accessible to low-income individuals over the construction period. Because of the small number of jobs (just 2.8 FTE jobs) created by the Project's operational and maintenance spending, the low skilled analysis and occupational benefits analysis was not conducted for operational spending. However, the solar technicians involved in both the installation and the operational maintenance of solar facilities are open to lower skilled workers who complete specialized training at a community college or career school and will receive benefits.
Table 4
NMTC Impact Calculations
The Low-Skilled Jobs and Benefits Associated with the Jobs Created or Maintained by the Camilla SFDP Facility
Project Development
and Onsite Labor Impacts
Supply Chain and
Induced Impacts Item
Pre-Development or Construction 134 210 344
Low-Skilled Jobs 114 159 273
Estimated Jobs wi th Retirement Benefit 93 147 241
Estimated Jobs wi th Medical Benefit 104 158 262
Percentage of Jobs
Low-Skilled Jobs 85% 75% 79%
Estimated Jobs wi th Retirement Benefit 70% 70% 70%
Estimated Jobs wi th Health Care Benefit 78% 75% 76%
Total Jobs
Source: Richard Clinch, IMPLAN and U.S. Bureau of Labor Statistics
22

Docket ID OCC-2014-0021 (Federal Reserve System Docket No. OP-1497) SEIA Response
The CDFI Fund is also interested in the quality of the jobs to be created by investments. The data f rom the occupational employment analysis conducted were used to estimate the access to benefits for the jobs created, based on the BLS Employee Benefits in the U.S. Report20, which presents data on benefits by summary occupation and industry. Estimates on the quality of jobs created by the Camilla Solar Farm Development Project were included in this communi ty economic impact analysis, which found that 70% of the jobs created by the construction of the Camilla Solar Farm Development Project offer access to ret i rement benefits and 76% offer access to medical benefits. There is no way of estimating the number of jobs providing employee stock programs, but according to the ESOP Association2110% of workers nationally have access to stock purchase plans.
20 Data are for March 2011 see http://www.bls.gov/ncs/ebs/sp/ebnr0017.pdf 21 http://www.esopassociation.org/media/media_statistics.asp
23

Docket ID OCC-2014-0021 (Federal Reserve System Docket No. OP-1497) SEIA Response
The results of the occupational analysis conducted for the construction of the Camilla Solar Farm Development Project are presented in Table 5, which presents an analysis of the jobs by level of education and training required, and Table 6, which presents a list of jobs created in the leading occupations for the construction of the project. Because of the small number (just 2.8) of FTE jobs created by the Project's operational and maintenance spending, an occupational analysis was not conducted but the solar technician jobs supported by the project can be accessible to low income individuals who complete a specialized training course.
Table 5
Employment by Educational Level
For the Construction of the
Camilla SFDP Facility
Item
Project Development
and Onsite Labor Impacts
Module and Supply
Chain Impacts
Induced Impacts Total
% of Total
Total 133.7 123.7 86.7 344.1 100%
First Professional Degree 0 2 2 3 1%
Doctoral Degree 0 0 1 1 0%
Master's Degree 0 1 1 2 1%
Degree plus work Experience 5 6 3 15 4%
Bachelor's Degree 14 20 8 43 12%
Associate Degree 0 4 4 8 2%
Postsecondary vocational award 1 7 5 13 4%
Work experience in a related occupation 20 9 6 34 10%
Long-term on-the-job training 39 6 3 48 14%
Moderate- term on-the-job training 43 30 14 87 25%
Short-term on-the-job training 11 38 42 90 26%
Note: Totals may not sum due to rounding.
Source: Richard Clinch, IMPLAN and U.S. Bureau of Labor Statistics
24

Docket ID OCC-2014-0021 (Federal Reserve System Docket No. OP-1497) SEIA Response
25

Docket ID OCC-2014-0021 (Federal Reserve System Docket No. OP-1497) SEIA Response
Table 6
Top 15 Occupations
For the Jobs Created by the Construction of
Camilla SFDP Facility
Number
Occupation of Jobs Education Level
Carpenters 28 Long-term on-the-job training
Construction laborers 21 Moderate- term on-the-job training
First-line supervisors/managers of construction trades and
extraction workers 14 Work experience in a related occupation
Office clerks, general 8 Short-term on-the-job training
Construction managers 8 Bachelor's degree
Retail salespersons 7 Short-term on-the-job training
Truck drivers, heavy and tractor-trai ler 6 Moderate- term on-the-job training
Bookkeeping, accounting, and auditing clerks 6 Moderate- term on-the-job training
General and operations managers 6 Bachelor's plus experience
Executive secretaries and administrative assistants 6 Moderate- term on-the-job training
Cashiers, except gaming 6 Short-term on-the-job training
Secretaries, except legal, medical, and executive 6 Moderate- term on-the-job training
Laborers and freight, stock, and material movers, hand 5 Short-term on-the-job training
Civil engineers 5 Bachelor's degree
Janitors and cleaners, except maids and housekeeping
cleaners 5 Short-term on-the-job training
Source:Richard Clinch, IMPLAN and U.S. Bureau of Labor Statistics
26

Docket ID OCC-2014-0021 (Federal Reserve System Docket No. OP-1497) SEIA Response
4.0 Methodology This analysis used the National Renewable Energy Lab's (NREL) Jobs and Economic
Development Impact (JEDI) model. Information about this model is available at http://www.nrel.gov/analysis/jedi/about jedi.html. This model is available for free from the NREL, and can be regionalized. The NREL-JEDI model for Georgia was used in this analysis. The JEDI model can be used to estimate the economic impacts of constructing and operating power generation (including solar) and biofuel plants at the local (usually state) level.
JEDI estimates the number of jobs and economic impacts to a local area that could reasonably be supported by a power generation project, based on project-specific or default inputs (derived from industry norms). The JEDI model's data are based on interviews with industry experts and project developers. Economic multipliers contained within the model are derived from Minnesota IMPLAN Group's IMPLAN Professional model. Project specific total costs were used in this analysis, but they were distributed into specific areas using the JEDI model's defaults. The JEDI model' jobs, earnings, and output impact estimates are distributed across three categories:
• Project Development and Onsite Labor Impacts;
• Local Revenue, Equipment, and Supply Chain Impacts; and
• Induced Impacts.
The construction and operation of solar and other renewable energy projects is highly specialized. The JEDI model was used in this analysis because it is based on actual data on construction and operational expenditures associated wi th renewable power projects, whi le the more widely used economic models - such as RIMS II and IMPLAN would include the construction and operat ion of renewable power projects in highly diversified sectors that would lack detailed informat ion on actual spending patterns. The JEDI model is only available at the state level, whi le other models can be targeted geographically on a county or even zip code; however, it does contain more accurate, industry specific data on which to estimate impacts.
27
Docket ID OCC-2014-0021 (Federal Reserve System Docket No. OP-1497) SEIA Response
Appendix B: Solar Jobs Study for the Camp Solar Farm
Development Project
28

Docket ID OCC-2014-0021 (Federal Reserve System Docket No. OP-1497) SEIA Response
The Economic and Workforce Development Impacts of
The Camp Solar Farm Development Project
Prepared for:
Solar Design and Development
By:
Richard Clinch, Ph.D.
Date:
April 2012
29

Docket ID OCC-2014-0021 (Federal Reserve System Docket No. OP-1497) SEIA Response
5 . 0 Introduction and Summary
Solar Design and Deve lopment re ta ined Richard Clinch, PhD Director of Economic Research at
t he Jacob France Inst i tu te of t he Mer r i ck School of Business at the Universi ty of Ba l t imore (JFI) to
analyze the economic 2 2 and wo rk fo rce deve lopmen t impl icat ions of the deve lopmen t of t he Camp Solar
Farm Deve lopment Project on the Georgia economy. 2 3 The t w o goals of this analysis are:
3. To prepare and present information on the economic and workforce development impacts resulting from the construction and operation of the Camp Solar Farm Development Project; and
4. To analyze the impact of the construction and operation of the Camp Solar Farm Development Project in terms of creating employment opportunities for low income residents in Georgia as a component of the use of New Market Tax Credits (NMTC) to support this project.
The Camp Solar Farm Development Project will have the following impacts:
• The construction and operation of the Camp Solar Farm Development Project will directly create 35.7 FTE construction-related jobs and partially support 0.7 FTE
24 operational jobs maintaining and servicing the solar facility ;
• The construction expenditures associated with the Camp Solar Farm Development Project will generate $10.3 million in economic activity in Georgia, and when multiplier effects are included, create 91.8 FTE jobs earning $4.2 million in employee earnings;
• Once the Camp Solar Farm Development Project is constructed and operational it will generate more than $640,000 per year in electricity sales;
• The annual operations and maintenance spending on in-State labor, maintenance and equipment will support 0.7 FTE Solar Maintenance Technicians and when multiplier effects are included support 1.2 FTE workers statewide, earning $66,352 and increase economic activity in Georgia by $115,932. The facility will generate an estimated $50,000 in annual property taxes; and
• Seventy-nine percent (79%) of the direct and multiplier effect jobs created by the construction of the Camp Solar Farm Development Project are low-skilled jobs accessible to low income residents, and an estimated 70% have access to retirement benefits and 76% have access to medical benefits. All of the direct jobs created by the operation of the solar facility will have access to benefits.
22 This analysis does not assess the extent to which the Camilla Solar Farm Development Project competes with or substitutes for other development activity. Thus, this analysis measures the relationship between this development activity and the larger State of Georgia economy. 23 The development is located in Mitchell County, Georgia; however, the National Renewable Energy Lab's (NREL) Jobs and Economic Development Impact (JEDI) model used is only available at the State level. As described in the Methodology Section below, this state-level model was used because it was created to analyze the impacts of the highly specialized solar and other renewable energy sector projects. 24The NREL-JEDI Model estimated jobs on a Full Time Equivalent (FTE) basis wi th one job equaling 1 FTE person year of 2,080 hours. The main economic impact of a solar facility is from its construction and a higher number of persons will be employed - but only on a part-time basis on the construction site. Job impacts are presented on an FTE basis in order to better understand the actual number of jobs created on an annualized basis.
30

Docket ID OCC-2014-0021 (Federal Reserve System Docket No. OP-1497) SEIA Response
The Community Economic Impact of the Construction and Operation of the Camp Solar Farm Development Project
The Camp Solar Farm Development Project is a 4 M W solar facility that is proposed for development in Mer iwether County, Georgia by Solar Design and Development The construction and operational cost inputs to the modeling analysis for this project were provided by Solar Design and Development and included the fol lowing:
• For pre-development construction-related impacts, the input to the NREL-JEDI Model25
modeling was the actual $12.8 mil l ion construction budget for the Camp Solar Farm Development Project; and
• The annual operational impacts of the Camp Solar Farm Development Project were estimated by the NREL-JEDI Model modeling based on the annual 4 M W capacity of the facility, w i th in-State operational expenditures and job creation estimated by the JEDI model based on the operational characteristics of similar facilities.
Based on these inputs, Richard Clinch, PhD used the NREL-JEDI Model to estimate the economic, employment and employee earnings impacts of the construction and operat ion of the Camp Solar Farm Development Project on the Georgia economy.
Table 1
Camp SFDP Facility
Construction and Operational Information
Item
Project Development Cost $12,806,536 Construction Cost $11,307,431 Generation Capacity 4
Operational Revenue (2015) $644,702 Annual Operating Costs $130,000 Operational Job Creation 0.7
Source: Solar Design and Development
As presented in Table 2, the $12.8 million in construction expenditures associated with the construction of the Camp Solar Farm Development Project will generate $10.3 million in economic activity in Georgia, create or support 91.8 FTE jobs earning $4.2 million in employee earnings. A total of 35.7 FTE on-site, construction-related jobs are estimated to be created over the construction of the Camp Solar Farm Development Project. It is important to note that the NREL-JEDI model only includes the amount of spending it estimates as likely to occur locally -in the market being studied. Because of the highly specialized nature of solar power plant construction, a large share of the machinery and equipment associated with the development of a
25 For a description of the model see the Methodology Section below.
31
Cost

Docket ID OCC-2014-0021 (Federal Reserve System Docket No. OP-1497) SEIA Response
project are likely to be imported from outside of the region, and are, therefore, not counted in the economic and job impacts analysis.
Table 2
Camp SFDP Facility
Economic Impacts of Construction Expenditures
(Jobs and 2012$)
Annual Annual
Annual Earnings Output
Construction Phase Jobs (2010$) (2010$)
Project Development and Onsite Labor Impacts 35.7 $1,908,305 $3,140,806
Construction and Installation Labor 15.9 $1,030,313 -
Construction and Installation Related Services 19.7 $877,991 -
Module and Supply Chain Impacts 33.0 $1,394,563 $4,269,333
Induced Impacts 23.1 $850,052 $2,919,490
Total Impacts 91.8 $4,152,920 $10,329,629
Average Employee Earnings per Job ($s) $45,255
Source: JEDI Model
The ongoing economic activity generated in the Georgia economy by the operation of the Camp Solar Farm Development Project is presented in Table 3. Once the Camp Solar Farm Development Project is constructed and operational it will generate approximately $640,000 in electricity sales. The annual operations and maintenance spending on in-State labor and maintenance and equipment will support 0.7 FTE Solar Maintenance Technicians and when multiplier effects are included support 1.2 FTE workers statewide, earning $66,352 and increase economic activity in Georgia by $115,932. The facility will generate an estimated $50,000 in annual property taxes. It is again important to note that, as with construction impacts, the NREL-JEDI model only includes the on-site operational, maintenance, and support expenditures estimated as likely to occur in the region being studied.
32

Docket ID OCC-2014-0021 (Federal Reserve System Docket No. OP-1497) SEIA Response
Table 3
Camp SFDP Facility
Economic Impacts of Operations
(Jobs and 2012$)
Annual Annual
Annual Earnings Output
Operational Phase Jobs (2010$) (2010$)
Onsite Labor Impacts
PV Project Labor Only 0.7 $44,583 $44,583
Local Revenue and Supply Chain Impacts 0.3 $13,643 $43,438
Induced Impacts 0.2 $8,126 $27,911
Total Impacts 1.2 $66,352 $115,932
Annual Property Tax Revenues $50,000
Source: JEDI Model
6.0 NMTC Impacts of the Construction of the Camp Solar Farm Development Project The NMTC program's goal is that funded projects wil l have a positive community development
and economic impact on distressed communit ies. One of the key benefits tracked by the program is the number of jobs for low-income persons that are created or maintained. In the Community Impact port ion of the NMTC funding application, applicants are asked to present the number of Jobs Created or Maintained by any predevelopment/construct ion and properties developed by QLICIs for planned investments. This analysis wil l present the results of the job impact estimates for the project presented above in a format applicable to the NMTC Program's goals.26
There is no generally accepted means of estimating the number of jobs held or that could be held by low-income individuals. This analysis, therefore, estimates the number of jobs created that is low-skill and therefore, accessible in terms of skills profiles to low income populations, who generally have lower levels of educational at ta inment and job skills. This was accomplished by using an occupational matrix based on U.S. Bureau of Labor Statistics (BLS) occupational employment developed by IMPLAN. This matrix allows for the estimation of the occupational profile of the jobs estimated by
26 This is based on the 2010 NMTC application. Future applications may require dif ferent community impact calculations.
33

Docket ID OCC-2014-0021 (Federal Reserve System Docket No. OP-1497) SEIA Response
the IMPLAN model. Each of the occupations in the matrix has been coded according to the min imum level of education and/or training required to fill a position using BLS data
(h t tp : / /www.b ls .gov /emp/empeted l .h tm) . This allows for the estimation of low-skilled jobs, which for the purposes of this analysis includes any occupation requiring less than an Associate's Degree.
As presented in Table 4, the construction and operation of the Camp Solar Farm Development Project will create 30.4 FTE construction-related low-skilled jobs accessible to low-income individuals and, when multiplier effects are included, a total of 72.7 low-skilled jobs accessible to low-income individuals over the construction period. Because of the small number of jobs (less than one FTE job) created by the Project's operational and maintenance spending, the low skilled analysis and occupational benefits analysis was not conducted for operational spending. However, the solar technician involved in both the installation and the operational maintenance of solar facilities are open to lower skilled workers who complete specialized training at a community college or career school and will receive benefits.
34

Docket ID OCC-2014-0021 (Federal Reserve System Docket No. OP-1497) SEIA Response
Table 4
NMTC Impact Calculations
The Low-Skilled Jobs and Benefits Associated with the Jobs Created or Maintained by the Camp SFDP Facility
Project Development
and Onsite Labor Impacts
Supply Chain and
Induced Impacts Item Total Jobs
Pre-Development or Construction 35.7 56.1 91.8
Low-Skilled Jobs 30.4 42.3 72.7
Estimated Jobs wi th Retirement Benefit 24.9 39.3 64.2
Estimated Jobs wi th Medical Benefit 27.7 42.3 69.9
Percentage of Jobs
Low-Skilled Jobs 85% 75% 79%
Estimated Jobs wi th Retirement Benefit 70% 70% 70%
Estimated Jobs wi th Health Care Benefit 78% 75% 76%
Source: Richard Clinch, IMPLAN and U.S. Bureau of Labor Statistics
The CDFI Fund is also interested in the quality of the jobs to be created by investments. The data f rom the occupational employment analysis conducted were used to estimate the access to benefits for the jobs created, based on the BLS Employee Benefits in the U.S. Report27, which presents data on benefits by summary occupation and industry. Estimates on the quality of jobs created by the Camp Solar Farm Development Project were included in this communi ty economic impact analysis, which found that 70% of the jobs created by the construction of the Camp Solar Farm Development Project offer access to ret i rement benefits and 76% offer access to medical benefits. There is no way of estimating the number of jobs providing employee stock programs, but according to the ESOP Association2810% of workers nationally have access to stock purchase plans.
27 Data are for March 2011 see http://www.bls.gov/ncs/ebs/sp/ebnr0017.pdf. 28 http://www.esopassociation.org/media/media_statistics.asp
35

Docket ID OCC-2014-0021 (Federal Reserve System Docket No. OP-1497) SEIA Response
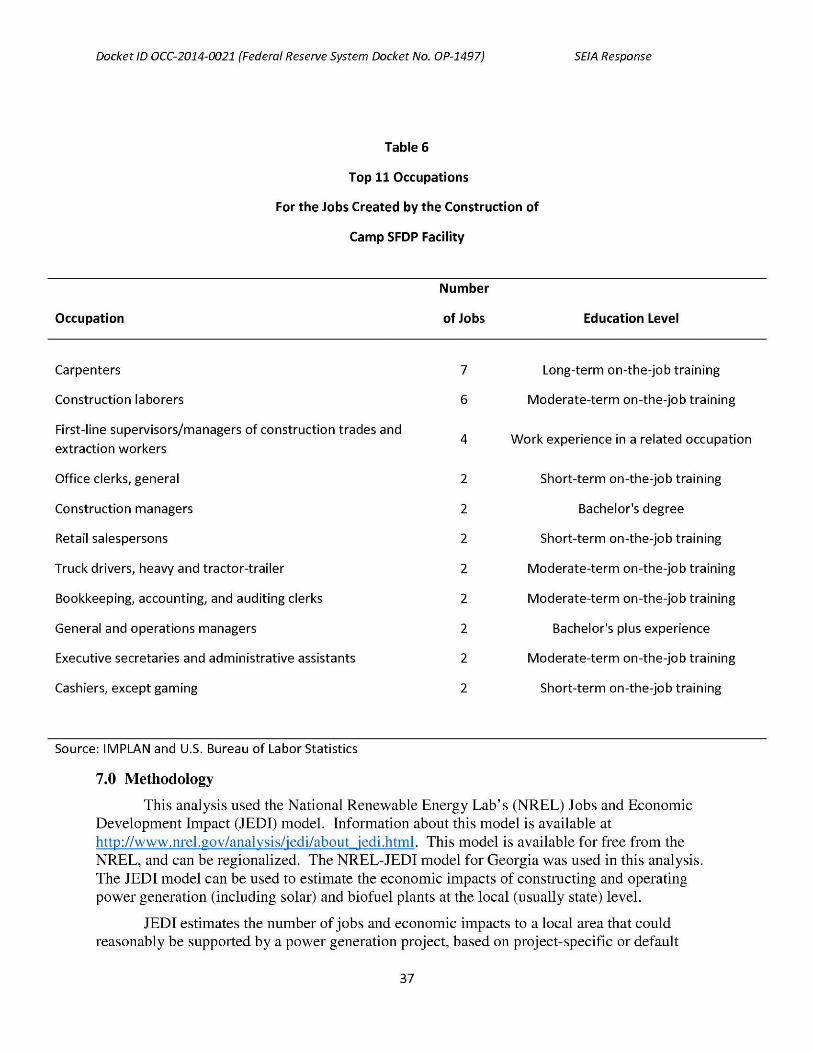
The results of the occupational analysis conducted for the construction of the Camp Solar Farm Development Project are presented in Table 5, which presents an analysis of the jobs by level of education and training required, and Table 6, which presents a list of jobs created in the leading occupations for the construction of the project. Because of the small number (less than 1) of FTE jobs created by the Project's operational and maintenance spending, an occupational analysis was not conducted but the solar technician job supported by the project can be accessible to low income individuals who complete a specialized training course.
Table 5
Employment by Educational Level
For the Construction of the
Camp SFDP Facility
Item
Project Development
and Onsite Labor Impacts
Module and Supply
Chain Impacts
Induced Impacts Total
% of
Total
Total 35.7 33.0 23.1 91.8 100%
First Professional Degree 0.0 0.4 0.4 1 1%
Doctoral Degree 0.0 0.0 0.2 0 0%
Master's Degree 0.0 0.3 0.3 1 1%
Degree plus work Experience 1.4 1.7 0.8 4 4%
Bachelor's Degree 3.8 5.4 2.1 11 12%
Associate Degree 0.1 1.2 1.0 2 2%
Postsecondary vocational award 0.3 2.0 1.3 4 4%
Work experience in a related occupation 5.4 2.3 1.5 9 10%
Long-term on-the-job training 10.4 1.6 0.8 13 14%
Moderate- term on-the-job training 11.4 8.1 3.6 23 25%
Short-term on-the-job training 2.9 10.1 11.1 24 26%
Note: Totals may not sum due to rounding.
Source: IMPLAN and U.S. Bureau of Labor Statistics
36
Docket ID OCC-2014-0021 (Federal Reserve System Docket No. OP-1497) SEIA Response
Table 6
Top 11 Occupations
For the Jobs Created by the Construction of
Camp SFDP Facility
Number
of JobsOccupation Education Level
Carpenters 7 Long-term on-the-job training
Construction laborers 6 Moderate- term on-the-job training
First-line supervisors/managers of construction trades and extraction workers
4 Work experience in a related occupation
Office clerks, general 2 Short-term on-the-job training
Construction managers 2 Bachelor's degree
Retail salespersons
Truck drivers, heavy and tractor-trai ler
2 Short-term on-the-job training
2 Moderate- term on-the-job training
Bookkeeping, accounting, and auditing clerks 2 Moderate- term on-the-job training
General and operations managers 2 Bachelor's plus experience
Executive secretaries and administrative assistants 2 Moderate- term on-the-job training
Cashiers, except gaming 2 Short-term on-the-job training
Source: IMPLAN and U.S. Bureau of Labor Statistics
7.0 Methodology This analysis used the National Renewable Energy Lab's (NREL) Jobs and Economic
Development Impact (JEDI) model. Information about this model is available at http://www.nrel.gov/analysis/jedi/about jedi.html. This model is available for free from the NREL, and can be regionalized. The NREL-JEDI model for Georgia was used in this analysis. The JEDI model can be used to estimate the economic impacts of constructing and operating power generation (including solar) and biofuel plants at the local (usually state) level.
JEDI estimates the number of jobs and economic impacts to a local area that could reasonably be supported by a power generation project, based on project-specific or default
37

Docket ID OCC-2014-0021 (Federal Reserve System Docket No. OP-1497) SEIA Response
inputs (derived from industry norms). The JEDI model's data are based on interviews with industry experts and project developers. Economic multipliers contained within the model are derived from Minnesota IMPLAN Group's IMPLAN Professional model. Project specific total costs were used in this analysis, but they were distributed into specific areas using the JEDI model's defaults. The JEDI model' jobs, earnings, and output impact estimates are distributed across three categories:
• Project Development and Onsite Labor Impacts;
• Local Revenue, Equipment, and Supply Chain Impacts; and
• Induced Impacts.
The construction and operation of solar and other renewable energy projects is highly specialized. The JEDI model was used in this analysis because it is based on actual data on construction and operational expenditures associated wi th renewable power projects, whi le the more widely used economic models - such as RIMS II and IMPLAN would include the construction and operat ion of renewable power projects in highly diversified sectors that would lack detailed informat ion on actual spending patterns. The JEDI model is only available at the state level, whi le other models can be targeted geographically on a county or even zip code; however, it does contain more accurate, industry specific data on which to estimate impacts.
38