iv. india: cdm opportunities and benefits
TRANSCRIPT

IV.India: CDM Opportunities and BenefitsMilind Pathak, Leena Srivastava, and Sudhir Sharma*Tata Energy Research Institute, New Delhi
*The opinions expressed herein are those of the authors and do not necessarily reflect the positions of their institutions.
SummaryMore than twenty potential Clean Development Mechanism(CDM) projects in five different sectors are reviewed in thischapter. They include new technologies and fuel-switchingoptions for conventional power generation, applications ofrenewable technologies for power generation and agriculturalactivities, and efficiency improvements in the production ofcement and iron and steel. All projects advance sustainabledevelopment in some form. Non-climate environmental benefitsinclude improved air and water quality, reduced solid waste, andsoil protection. Development benefits include rural electrifica-tion, employment opportunities in particular groups, andimprovements in industrial efficiency.
An analytical tool—the Analytical Hierarchical Process(AHP)—is used to evaluate the benefits of different options—in particular, their consistency with national priorities articu-lated in the planning process and their environmental andeconomic development benefits.
Among the abatement opportunities reviewed, there appearsto be a very high overlap between projects that are low-cost andprojects that are consistent with India’s development priorities. Inthree of the four sectors for which comparisons can be made, thefirst and second options ranked by price are also the first andsecond options when ranked by their non-carbon benefits. Thissuggests that projects advanced under the CDM would make asignificant contribution to India’s own development goals.
Planning Priorities and DevelopmentPathsIn India, the planning process takes the form of Five-Year Plans formulated by the Planning Commis-sion.1 The development objectives laid out for theupcoming period provide a touchstone for assessingthe CDM’s potential to address domestic priorities.
The objectives stated in the ninth and currentFive-Year Plan (1997–2002) reveal a mix of eco-nomic, environmental, health, and social goals.They include
• promoting agriculture and rural development,
• accelerating economic growth whilemaintaining stable prices,
• improving the supply of drinking water andprimary health care,
• containing the population growth rate,
• ensuring environmental sustainability of thedevelopment process,
• empowering women and socially disadvan-taged groups,
• promoting and developing people’s participa-tory institutions, and
• strengthening efforts to build self-reliance.
After independence in 1947, planning wasinitially geared toward the development of agricul-ture, with a focus on irrigation and power. Overtime, emphasis has shifted toward energy-intensivesectors and energy generation. The growingimportance of the energy sector is evident from itsincreasing share of total outlay under successiveplans, rising from 19 percent of total spending in thefirst plan to 27 percent in the latest.
Energy planning in the Five-Year Plan is supple-mented by some medium- and long-term planningby other groups. For example, in 1985, the AdvisoryBoard on Energy drew up plans for the energy sectorup to the year 2004–05. Similarly, the CentralElectricity Authority has a National Power Plan upto 2011.
The principal objectives outlined in the NinthFive-Year Plan for the energy sector are to meet theeconomy’s energy needs through efficient andsustainable use of resources. This will be achieved bydeveloping institutional mechanisms for energyconservation, demand management, research anddevelopment (R&D), and regulatory mechanisms.Continuing the effort to promote renewables, thegovernment is aiming for a gradual commercializa-tion of non-conventional energy and increasedexploitation of India’s large potential for cogenera-tion. Planned legislation will enable power produc-ers using these technologies to sell to the grid. Theprivatization trend initiated in 1991 will continue.In line with past reforms in energy pricing, tariffswill be rationalized, and the use of “time-of-day”metering and peak-period pricing will be exploredfor eventual use. Private sector participation will addimpetus to the ongoing renovation and moderniza-tion program for generating stations. Importing ofhydrocarbons and coal fuels for power sectors willbe “decanalized”—allowing importers to contractdirectly with foreign suppliers instead of beingforced to obtain imports indirectly through theIndian Oil Corporation.
The agriculture sector still commands substantialattention. Policy plans include augmenting irriga-tion facilities, intensifying the watershed develop-ment program, enabling larger and more timely
credit flow, setting up crop insurance programs, andconducting R&D into new technologies. Moregenerally, the government hopes to improve theframework for technology transfer and to develop astrong scientific capability domestically.
For all sectors, several important obstacles willhave to be surmounted to meet development objec-tives. These include: a lack of capital, insufficientgovernment resources to meet development objec-tives, a lack of foreign exchange for ensuring balanceof payments sustainability, and inadequate infra-structure.
Environmental Pressures and AimsA further sense of India’s environmental prioritiescan be discerned from current trends. The Asia-Pacific Environment Outlook identifies water resources,industrial pollution, urban congestion, land and soilresources, and deforestation as the major environ-mental issues for India (UNEP, 1997). Some ofthese issues overlap with potential CDM projects:
Urban Air Pollution. India’s major sources of air pollu-tion are industries (toxic gases), thermal powerplants (fly ash and SO
2), and motor vehicles (carbon
monoxide, lead, and particulate matter) (TERI,1998b). While particulate levels are high, averageSO
2 concentrations in these cities are all within
World Health Organization (WHO) guidelines(WRI, 1998). Motor vehicles are a major source ofurban air pollution, especially for particulates.Although none of the CDM options reviewed hereaddresses this issue, projects aimed at improvingefficiency and reducing CO
2 emission levels from
urban transport sources would also do much toimprove urban air quality.
Solid Waste. Solid waste includes heterogeneous urbanhousehold waste and more homogeneous accumula-tions of industrial, agricultural, and mining wastes.Solid waste in urban areas, mainly municipal andindustrial solid wastes, is collected and disposed ofby municipal corporations. The other waste isdisposed of by the respective industries.
Most Indian cities are generating fast-increasingamounts of municipal waste. Per capita waste
Financing Sustainable Development with the Clean Development Mechanism 51
March 2000 W o r l d R e s o u r c e s I n s t i t u t e http://www.wri.org/

52
March 2000 W o r l d R e s o u r c e s I n s t i t u t e http://www.wri.org/
Financing Sustainable Development with the Clean Development Mechanism
generation is growing by 1.33 percent a year (TERI,1998c). Indian cities and towns generate an esti-mated 4,000 tons (t) of municipal wastes every day,creating pressure for land space and generating airpollutants and other problems with their disposal.In 1991, nearly 90 percent of waste was landfilled(EPTRI, 1995).
Industrial solid waste is made up of non-hazardous, non-biodegradable waste. The majorgenerators of industrial waste are: thermal powerplants, which produce coal ash, integrated iron andsteel mills, which produce blast furnace slag andsteel melting slag; nonferrous industries such asaluminum, zinc, and copper, which produce red mudand tailings; and fertilizer and allied industries, whichproduce gypsum. Overall, the industrial sectorgenerates an estimated 100 million tons (Mt) of non-hazardous solid wastes—with coal ash from thermalpower stations accounting for more than 70Mt—and 2Mt of hazardous waste a year (TERI, 1998b).
Industrial waste poses a serious threat to theenvironment because its disposal is largely uncon-trolled. Dumping it on public land or introducing itinto the municipal waste stream is common. Thetreatment and disposal of hazardous waste is particu-larly problematic. Chemical processes to destroyhazardous substances and biotechnological pro-cesses to detoxify hazardous components are seldomemployed. Highly toxic wastes are sometimesdestroyed by controlled incineration but morecommonly, small quantities of sludge are burnedwith factory garbage in open pits (Bhoyar et al.,1996). Uncontrolled dumping is less common thansecure landfilling.
Water Pollution. While municipal sources contributethree quarters of wastewater measured by volume,industrial waste makes up more than half of the totalpollution load. Sewage treatment facilities in majorcities can often process only 10 percent of thewastewater generated. On average, the treatmentcapacity in Class I cities can handle only 60 percentof the wastewater collected and less than 15 percentof the total volume of wastewater generated.2
Average figures for Class II towns indicate about 90percent of the water supply is polluted, and only 1.6
percent of the polluted wastewater gets treated(CPCB, 1990).
Of the total pollution contributed by industrialsubsectors, 40 to 45 percent is from processing ofindustrial chemicals; nearly 40 percent of all organicpollution comes from the food products industryalone (World Bank, 1996). Food products and agro-based industries together contribute 65 to 70percent of all industrial wastewater in terms oforganic load. Of the 426 large- and medium-sizedindustries in the region covered by the GangaAction Plan, 101 do not have adequate pollutioncontrol facilities. These include sugar mills, distiller-ies, leather processing units, and thermal powerstations. Small industries, in particular, lack suchtreatment facilities. Coal mining also degradeswater quality in specific areas.
Land Use and Deforestation. Deforestation, though lessextreme in India than in other countries, is puttingrapidly growing pressures on forest resources. Themain causes of deforestation are from conversion toriver valley projects (for both power and irrigationpurposes) and from legal and illegal harvesting tomeet timber and firewood needs (Ravindranath andSomashekhar, 1995). With economic and demo-graphic growth, demand is expected to rise sharplyfor timber, from 30 Mt a year in 2000 to 43 Mt in2020, and for firewood, from 185 Mt to 272 Mt(Ravindranath and Somashekhar, 1995). Meetingthese demands poses challenges for the Indianforestry sector, quite apart from the carbon implica-tions. Deforestation creates various problemsincluding damage to soil and water resources as wellas loss of biodiversity.
To date, India has addressed the issue through aseries of Forest Conservation Acts and an Afforesta-tion Program. The main policy thrust is to monitorand protect existing forests and to reduce inherentpressures on forest resources by extending biomassproduction under management programs thatinvolve local communities. The CDM offerspotential to extend or supplement these efforts.
Climate Change. Though not currently a priority,compared to pressing non-climate environmental

53Financing Sustainable Development with the Clean Development Mechanism
March 2000 W o r l d R e s o u r c e s I n s t i t u t e http://www.wri.org/
problems, India could be more at risk than manyother countries from changes in temperature andsea level. Models predict an average increase intemperature in India of 2.3 to 4.8 oC for the bench-mark doubling of CO
2 scenario (Lonergan, 1998).
Temperatures would rise more in Northern Indiathan in the South. In the North Indian Ocean, undera doubling, the average number of tropical distur-bance days could increase from 17 to 29 a year(Haarsma et al. 1993); while, without protection,approximately 7 million people would be displaced,and 5,760 km2 of land and 4,200 kilometers (km) ofroad would be lost (Asthana, 1993). The dominantcost would be the land loss, accounting for 83percent of all damages. For the same CO
2 doubling
scenario, a crop-simulation study estimates thatwheat yields could decrease between 28 and 68percent (Rao and Sinha, 1994). Even allowing foradaptation options, agricultural losses could besignificant. The loss in farm revenue is estimated at 9to 25 percent for a temperature rise of 2 to 3 oC(Kumar and Parikh, 1998)
Energy TrendsIndian energy supply relies heavily on coal use—atrend likely to continue as rising energy demandspurs on new capacity development.3 Industry is thebiggest user of commercial energy. Although only athird of rural households are now electrified, theresidential sector will become an important sourceof demand. Although coal is forecast to dominate,India could support significant amounts of renew-able technology capacity—wind, solar, and biomass.
Conventional Energy GenerationVital to the development process, India’s energysector has been a major beneficiary under theplanning system. The public sector outlay for theenergy sector in 1996–97 was Rs.115,000 crores(US$3.2 billion). Nearly 70 percent has been setaside for power generation.
Between 1984 and 1994, final commercialenergy consumption grew at a rate of about 5.6
Figure 4.1
Sectoral Consumption of Commercial Energy in India, 1994 (Mtoe)
0
10
20
30
40
50
60
70
80
90
100
Agriculture Industry Residential Transport Others
Mill
ion
to
ns
of
oil
equ
ival
ent
Electricity
Natural gas
Petroleum products
Coal
Source: TERI, 1998b.

54
March 2000 W o r l d R e s o u r c e s I n s t i t u t e http://www.wri.org/
Financing Sustainable Development with the Clean Development Mechanism
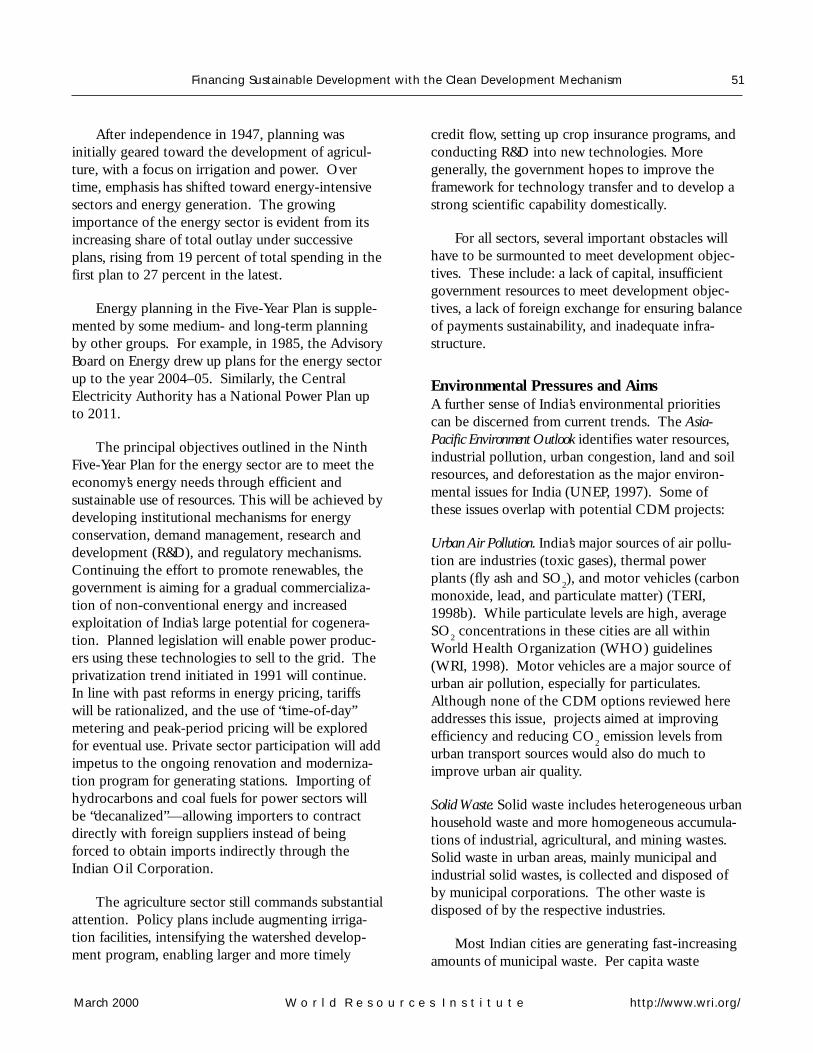
percent a year. Commercial energy fuels nowaccount for 60 percent of overall energy consump-tion, up from a mere 26 percent in 1950–51. India’senergy-GDP elasticity is fairly high at 0.9–1.0, buton a slightly downward trend. Even with recentgrowth, per capita commercial energy consumptionis low at 0.48 toe—a mere 6 percent of U.S. levels(IEA, 1998). The industrial sector is the largestconsumer of commercial energy, followed bytransport. (See Figure 4-1.)
India has an installed capacity of about 87 GW,65 per cent of it coal-based. The generating capac-ity of utilities comprises a mix of hydro, thermal,and nuclear plants. After focusing on hydro-electricity projects in the 1960s, thermal capacityhas shown a remarkable increase. (See Figure 4-2.)The share of hydro capacity has been declining forvarious reasons, including low public acceptancebecause of adverse environmental impact and thelarge-scale displacement of people. The share ofnuclear power remained stationary at about 3percent. Gross power generation from utilitycapacity has increased from 6 billion kilowatt hours
(kWh) in 1950–51 to 380 billion kWh in 1995–96—an average growth rate of about 10 percent a year(MoF, 1996).
Even at this rate, capacity expansion has beenunable to keep pace with demand, due to seriousfinancial constraints. Shortages remain fairlyconstant at between 7 and 9 percent, with peakshortages in the range of 15 to 20 percent (MoP,1996). The situation may worsen in the face ofexpected demand increases, following economicliberalization policies and national objectives. Lessthan a third of rural households are electrified. Newcapacity of 12 GW will be required every year underthe next three Five-Year Plans, and power demandby 2020 is estimated at 385 GW, requiring invest-ment of at least US$380 billion in the power sectoralone (TERI, 1998b). Coal would remain the domi-nant fuel for power generation. Business-as-usualprojections for the demand and supply of coal andother primary energy are presented in Table 4-1.Projected increases in carbon emissions from theenergy sector are shown in Table 4-2.
Figure 4.2
Gross Electricity Generation 1950-95 (billion kWh)
0
50
100
150
200
250
300
350
400
1950 1960 1970 1980 1990 1995
Bill
ion
s o
f ki
low
att
ho
urs
Nuclear
Thermal
Hydro
Source: MoF, 1996

55Financing Sustainable Development with the Clean Development Mechanism
March 2000 W o r l d R e s o u r c e s I n s t i t u t e http://www.wri.org/
RenewablesIndia’s renewable energy program can be traced tothe first oil shock in the early 1970s. Renewableenergy technologies have since been developed andimplemented in India for power generation, heating,cooling, lighting, pumping, cooking devices, and asalternative fuels for surface transport. About 1,050MW of power generating capacity—7 percent ofthe total power capacity added during the EighthFive-Year Plan—was made up of non-conventionalenergy sources (GoI, 1997). A significant amountcame from grid-connected wind-farms, wherecapacity rose from 47 MW in 1992 to 900 MW in1997. Even so, renewables comprise less than 2percent of total installed capacity.
Renewable energy sources offer a significantpotential to extend energy supply without relyingon carbon-intensive fuels and to allow for decentral-ized electricity generation. The Ministry for Non-conventional Energy Sources (MNES) has adopted athree-pronged approach for its implementationstrategy for renewables: (1) providing budgetarysupport for R&D and demonstration projects, (2)extending institutional finance through the IndianRenewable Energy Development Association(IREDA) for private sector participation and bilateraland multilateral projects, and (3) promoting privateinvestment through various fiscal incentives such astax holidays. The MNES has also announced
certain targets to be achieved in the Ninth Plan.These include
• 3,000 MW of additional power fromrenewables,
• installation of 10,000 PV water pumpingsystems,
• solar water-heating systems for 500,000households,
����������� ��� ������� ������� �������
���������
���� ���� ��� � � ��������������� ��� ��� ���
�������� ���� ��� ��� ��������������� �� ��� ���
�������� �������������
���� ���� �� ��� ��� !"#���" �� �� ���
�������� ���� �� ��� ��� !"#���" �� ��� ���
������������ �����!��� ��� "�
���� ���� �� ��$�� �������������� �� ��$ � ��
���%&"�%���������'%����%%����%��!(�%��)��!�*%�)���#���������#%����+%��� �
Table 4-1
Demand and Supply Forecasts forPrimary Energy Under 1995-96Business as Usual
Table 4-2
Projected CO2 and CH4 Emissions in the Baseline (Tg)
���� ���� ���� ������!(�%)���"! ��� ��� �+��� �+�� ,�
�%���))�")%-�(.
/"!�)�!�0��1#)�)���"!
� �� �� 22
�"��� �"$ �%��� �%�"� ��%"�&��
���!��%%/�!������"� ��� ��� �� � �3�#!�%3��(����� �� �� �� ��
,4�%���))�")%-�%,�
�%56 %�7#������)+%�(.
����� � �� ��� ��
�"���%-,4�%"��+%�(. �$� ��� ��� "�$
�"���%-,��%�%,4
�+%�(. �&� �%��� �%��$ ��%�����
����*�%���))�"%8!"9����")%�!�%���%��%�*�%,��!��%:���*�!%��)��!�*%�)���#��%-,:��.+%��)�%"%�����%8"8#����"%(!";�*%!���%�"!�� �1 ��
��%�*�%���))�"%�!"�%��#!�%���(����%�!�%��)"%��)�%"%)���%�����%8"8#����"%(!";�*%!������%&���"��% *�)����%:��"!��"!�%-& :.%�)������)��%�"���)%�<��#�%�"!�)�!�0��%#)�%)���"!�������'%����+%��� �

56
March 2000 W o r l d R e s o u r c e s I n s t i t u t e http://www.wri.org/
Financing Sustainable Development with the Clean Development Mechanism
• 500,000 m2 of solar collectors in industrial/commercial establishments,
• additional small hydro capacity of up to 15MW (MNES, 1998).
Besides new renewable technologies, decentral-ized bioenergy plans also offer significant potentialto meet energy needs in rural areas (Ravindranathand Hall, 1995).
India’s Greenhouse Gas EmissionsDespite initiatives to promote clean energy, theexpansion of conventional energy generation,particularly coal-based generation, implies a rapidlygrowing emissions profile for India. Under businessas usual, energy sector CO
2 emissions in 2010 may
be three times greater than in 1990 (TERI, 1998d).4
Table 4-2 also illustrates CO2 emissions from the
forestry sector and CH4 from the agriculture sector.
Though relatively small in magnitude, forestry andland use emissions are expected to grow rapidly.Agricultural emissions of CH
4, accounting for 32
percent of the present global warming potentialfrom these sources, are expected to grow moreslowly.
Changing development paths now mightprevent greenhouse gas (GHG) emissions fromreaching such levels (Reid and Goldemberg, 1997).CDM finance would strengthen that trend.
Potential CDM OptionsIndia already has five CDM-type projects in placeunder the pilot version of the CDM—ActivitiesImplemented Jointly (AIJ). (See Table 4-3.) The
projects cover the spectrum of potential CDMactivities, including improvements in industrialefficiency, power generation using waste materials,and changes in agricultural practices. Such diversityis consistent with using the AIJ phase as a learningperiod. Formed to recommend and evaluateprojects, and consisting of representatives fromgovernment and nongovernmental organizations(NGOs), the “Task Force on AIJ” continues to assessnew proposals.
Here, we review 22 separate projects in fivedifferent sectors. (see Table 4-4.) These options formthe basis of a comparative ranking using analyticaltechniques. Typically, these options lead to animprovement in energy efficiency and resourceconservation and introduce advanced technologies,so laying the foundation for long-term sustainabledevelopment.
Mitigation options in the power sector includeclean coal technologies and renewables. Optionssuch as bagasse-based cogeneration and combinedcycle plants are already profitable and generatefewer emissions per kWh of electricity than conven-tional generation. Similarly, small hydro-, wind-,and biomass-based power, though more expensivethan conventional coal-based plants, providessignificant abatement opportunities. Renewableoptions for power and irrigation in the agriculturesector are also considered, as are opportunities inthe iron, steel, and cement sectors.
Three main criteria governed the choice of theseoptions: their consistency with national develop-ment priorities; the relatively high level of energy
Table 4-3
Pilot Phase AIJ Projects Endorsed by the Government of India
���(����!� � )������! *!+���� ,��
� ��!���%��#��%�!"%-���. 5#9�!�� =�8� 30)%�))�!+%5#9�!��+%���
� ��!(�%!��"��!�(%�!"�%;�)��%(�)%�%��7#� 5#9�!�� =�8� � ,:% ���%��%>�"�!�+%5#9�!��+%���
� ���(!���%�(!��#��#!��%����%?��%3��(���� �*!�% !��)* 6"!�%@�A �*!�% !��)*%?����%�����!�����%@"�!+���
� ��?�% ";�!B%��"��))%(�)�������" ��%)���) &��*�!��) ��?�% ";�!+%�����"8���%����!�����)+���
� ����!�%�!�*�!%�(!"�"!�)�!�%�"!%�!�%:� C�!���A� D���%?����) ����+%@�(�8����+%C�!���A�+%���

57Financing Sustainable Development with the Clean Development Mechanism
March 2000 W o r l d R e s o u r c e s I n s t i t u t e http://www.wri.org/
consumption in the base activity; and the relativelylarge GHG reduction potential offered by theabatement technology. (For a detailed assessment of eachoption, see Appendix 4A.)
Conventional Power GenerationUnder business as usual, coal would remain India’spredominant fuel for power generation, in view ofthe large reserves and the high cost of alternatives.To keep up with demand, capacity will have to growby 12 GW a year for the next 15 years.
Improvement in coal generation is certainlypossible. Average gross conversion efficiency ofcoal thermal power stations is 28 percent, andaverage net efficiency about 25 percent (CEA,1990). A variety of new technologies are availableto improve energy efficiency from conventional fuelsources, mostly coal. In addition to reducing CO2
emissions per unit of output, these technologiescould significantly reduce—or eliminate—particu-lates, SO2, and NOx releases. The introduction ofsuch technologies would also constitute “leap-frogging” for the Indian power sector, allowing
Table 4-4
Potential CDM Projects
������ -��.�������/!���01 ����0����!��2���!
#���!�E�%�"��%)#8�!�!������%�"���!)
���")8*�!��%��#��E�%��%�"��#)��"
!�))#!�E�%��#��E�%��%�"��#)��"
���(!���%(�)�������"%�"����%�����
,"����%�����%(�)%�#!���)F��#!��%(�)$��)�
,"����"��%8";�!%(��!���" #���!�E�%�"��%)#��!������%�"���!)�"!%���%��)�)
,"(��!���"F��(�))�$��)�
?����%*�!"
6�%��!�
*"�"�"�����$��)�%8";�!%(��!���"
���;����)%�"!%8";�!%(��!���" �!����"��%�*�!���%8";�!(��!���"%#)�(%"��)���%�"��
@�"��))1��)�%8";�!%(��!���"
�(!"1;�)��$��)�%(�)����!
6""1;�)��$��)�%(�)����!
6�%)*���";%8#�8
6�%��8%8#�8
���;����)%�"!%�(!��#��#!� ?����1)����%��)��%8#�8)��)
>%8#�8
���(!���%)����%8���%;��*%;��17#��*�(%"8��"
��!���%!�#���"%8!"��))
6��%7#��*�( �!�%7#��*�(
�8�%*��!�*%�#!��� @�)��%"<�(�%�#!���
,"����"��%�����!��%�!�%�#!��� D��!�1*�(*%8";�!%�����!��%�!�%�#!���
�!"%�%)����
,"����"��%-"!���.%��)��( ,"��#"#)%��)��(
&"18!�������!%A��) �!�%8!�������!%A��),����
&"18!�*����!%A��) �!�%)#)8�)�"%8!�*����!%A��)

58
March 2000 W o r l d R e s o u r c e s I n s t i t u t e http://www.wri.org/
Financing Sustainable Development with the Clean Development Mechanism
plants to benefit directly from technologies devel-oped elsewhere. Over time, a growing familiaritywith such technologies may facilitate further transferand even domestic production.
Two technologies imply fuel switching awayfrom coal to natural gas and bagasse, respectively.The first option uses natural gas in a combined-cycletechnology to attain efficiency of 50 percent ormore—higher than any coal option. Cobenefitswould be commensurately higher than for coaloptions, too. Under the bagasse-cogenerationoption, sugar mills would develop a capacity to burnbagasse, a byproduct of sugar refining. Socialbenefits under this option range from additionalincome for farmers and sugar mill owners to in-creased employment opportunities. Even without acredit for carbon reductions, this option is profit-able but could be greatly extended with furtherfinancing.
Renewable Energy Sources and TechnologiesThe growth of conventional new energy capacityhas slowed during the Eighth Five-Year Plan.Projects in power generation, coal mining, and oiland gas exploration—which require long gestationperiods and significant levels of investment andfinancial restructuring—are lagging behind demand.Consequently, there is even greater opportunity forrenewable energy technologies to meet capacitydemands.
Renewable options were considered for bothpower generation and for power supply and irriga-tion in the agriculture sector. Four power-generationoptions are examined: small hydro, wind farms,biomass gasifiers, and photovoltaics. Decentralizedpower may create new jobs by enhancing localenergy supply and expanding maintenance needs forpower generation (e.g., through energy plantationsfor biomass) or by promoting economic growthgenerally. Increased demand for biomass gasifiersand photovoltaics would also create job opportuni-ties in the manufacturing sector. As renewabletechnologies, adverse environmental impacts areminimized or non-existent. Similar benefits pertainto renewable technologies for the agricultural sector.
Iron and SteelIndia’s iron and steel sector has grown substantiallysince the industry’s de-licensing in 1991. Totalproduction of finished steel was 17 Mt in 1994–95,with domestic demand projected to rise to 31 Mt by2001–02.5 Such high growth is driven by largeinvestments in infrastructure, growth in the trans-portation sector, and increasing demand for con-sumer durables.6 Per capita consumption of only 22kg—among the lowest in the world—leaves signifi-cant room for growth (TERI, 1998a). The privatesector is developing 8 Mt of new capacity.
The iron and steel industry, where energyaccounts for 30 percent of production costs, isIndia’s largest industrial consumer of energy. How-ever, energy consumption per unit of output is highcompared to many other countries—about twice ashigh as in the old industrial countries and higherthan in the main developing-country competitors(TERI, 1998a). This is for several reasons. Process-ing the low-grade ores used by the Indian industrytakes more energy per unit of output. Most plants inIndia still use the dated wet quenching method ofcoke preparation. Modern dry coke quenchingimproves the coke quality and reduces energyconsumption and dust emissions. Efforts are beingmade to reduce energy consumption by importinggood quality coking coal, developing heat energyrecovery systems, phasing out the open hearthfurnaces for steel making, and increasing theindustry’s continuous casting capacity.
Potential CDM activities for the iron and steelsector are listed in Table 4-4. These are based onintroducing current technology into all or part ofthe steel-making process. Such technology willlower CO
2 emissions and simultaneously raise the
efficiency of steel making in India. Unfortunately,lack of adequate data prevents estimation of carbonprice ($/tC), and so improvements are expressedonly in terms of reductions per ton of finished steel.
CementIndia is the fourth largest producer of cement afterChina, Japan, and the United States. The cementindustry is one of the six most energy-intensive

59Financing Sustainable Development with the Clean Development Mechanism
March 2000 W o r l d R e s o u r c e s I n s t i t u t e http://www.wri.org/
industries in India (TERI, 1998a).
Cement is manufactured in India using dry,semidry, or wet processes. The current trend favorsthe dry manufacturing process, which consumes lessthermal energy than the wet process, even though ituses more electricity (CMA, 1996; CMA, variousyears).
The cement industry is a continuous processindustry where power cuts not only disrupt produc-tion but can entail costly damage to equipment. Tomaintain uninterrupted cement production, the useof captive power by cement industry is increasing—27 percent of the total power supply is currentlyfrom captive power compared to 16 percent at thestart of the decade (CMA, 1997).
Two particular abatement options are reviewedhere: the introduction of dry precalciner kilns anddry suspension preheater kilns. The first technologyallows 85 to 90 percent of the necessary pretreat-ment (“calcination,” of the “meal” input) to takeplace at a lower temperature than used in the mainkiln, a significant energy saving relative to currenttechnology. The second technology uses in apreheater kiln waste heat recovered from the mainkiln.
Land Use and Forestry SectorIn addition to projects in the industrial and energysectors, CDM options in the forestry sector offer amix of carbon and sustainable development benefits.Degraded land, estimated at between 66 and 130million hectares (ha)—20 to 40 percent of total area
in India—could support a variety of mitigationprojects, from direct carbon sequestration to biom-ass growth for energy use that would displace coalburning. The ALGAS-India study reviewed anumber of alternative forestry sector projects thatwould mitigate carbon (TERI, 1998d). (See Table 4-5.)
Besides helping to meet growing demands fortimber, firewood and electricity, such activitieswould confer other benefits. Newly afforested areaswould reduce present levels of soil erosion and waterloss on degraded lands and would enhancebiodiversity. Afforestation would also raise grassproductivity, extending grazing capacity (Shailajahaet al., 1994). Large-scale afforestation and reforesta-tion activities would also yield employment oppor-tunities, particularly among rural, low-incomegroups, through planting, harvesting, and processingof biomass and by supplying non-timber forestproducts.
Different projects offer a different mix of carbonand other benefits. Natural Regeneration wouldfocus primarily on carbon sequestration and wouldprovide a high level of ecological benefits. Commu-nity woodlots would sequester less carbon directlybut would meet local demands for biomass as abuilding material and fuel source. In so doing, theywould reduce the burden on women of retrievingfirewood and other biomass. Plantations andagroforestry might offer more employment opportu-nities than other options.
Several forestry options have been proposed toUSIJI for consideration as AIJ projects. Theseinclude a bioelectricity project that would generate
Table 4-5
Potential CDM Projects in the Forestry Sector
����0����!��2���!
��� ��1������/��
��� �!�2��������/���!����$��1������3/��
4�������� �!�5���������40� ����������6�73���
&��#!��%!�(��!���" �� �� �+��� �
�*���%!�(��!���"
%%%3�!(�����%�(!��%����� � ��� �+��� ��
%%%�"�����%�(!��%�� �� �� �+��� ��
!�����%��%-�(!"�"!�)�!�. �� � �+��� ��
������'�48*�����&��#

60
March 2000 W o r l d R e s o u r c e s I n s t i t u t e http://www.wri.org/
Financing Sustainable Development with the Clean Development Mechanism
electricity from biomass grown on degraded land, ateak plantation for carbon sequestration, and atamarind agroforestry project, already approved bythe Indian Task Force on AIJ, which would providefruit, halt land degradation and desertification, andsequester carbon (Ravindranath et al., 1998). Allthese activities offer sustainable developmentbenefits and are consistent with the priorities ofspecific Indian ministries.
Though questions persist about which, if any,types of forestry project will be permitted under theCDM, these projects indicate a carbon and sustain-able development potential every bit as significantas, and often less costly than, energy and industrialsector projects.
Prioritizing CDM optionsWhich of the above options are best depends onone’s perspective. Developed-country investors willbe mainly concerned about a project’s abatementcost, financial risk, and feasibility. India will be moreconcerned about a project’s development andenvironmental benefits and their consistency withnational priorities. Different parties to a transactionwill weigh project characteristics differently, sug-gesting that developed- and developing-countryparticipants would rank overall projects differently.
To explore how projects meet national prioritiesand which, if any, would satisfy all parties, projectswere assessed both on the basis of their developmentbenefits and their carbon-abatement cost. Whileassessing abatement cost is relatively straightfor-ward, evaluating development benefits requirescomparison of different types of impact—improve-ment in air quality, say, against the benefits of ruralelectrification or employment generation. Inevita-bly, the assessment of cobenefits is somewhatsubjective. However, a model can be used to makethe evaluation framework transparent and to exploresensitivities. Such a model—an Analytical Hierar-chical Process (AHP)—was used here. (See Appendix4B for details.)
Projects were evaluated against nine differentcriteria that seek to capture India’s developmentpriorities.7 (See Table 4-6.) Researchers and govern-
ment officials were then polled on the importance ofdifferent development criteria allowing weights tobe placed on these different cobenefits. Scoringeach project against these weighted criteria createdan approximate assessment of the overall develop-ment potential.
The ranking procedure was conducted on asectoral basis for four of the sectors reviewed above.Projects were ranked both by carbon-abatement costalone and by a measure of overall developmentbenefits. Table 4-7 illustrates how the two rankingscompare.
For three of the four sectors for which comparisons can bemade, the two highest ranked options, based on cost of carbonoffset, are also the two highest ranked options, based on theircobenefits. This suggests a high degree of overlap betweenprojects that would be given priority by carbon-focusedinvestors and projects that are in India’s best interest. Onlythe renewables for power generation category showsa mismatch in the first-choice as perceived bymarket criteria alone and the wider criteria thatmake up the AHP scores. Also in conventionalpower generation and renewables for agriculture,some of the lower rankings are different.
ConclusionsFor the abatement options reviewed, there seems tobe a high degree of overlap between projectsavailable at lowest cost and projects most consistentwith national priorities and offering the most to
Table 4-6
Development Criteria Used toEvaluate Projects
���!�����0��1 �� ����0��1
1%,")�)����%;��*%("��!���%8"����
1%?"��"��""���%����"8���
/��)�������
1% !"9���%!�)A
1%��)"#!��%�")�!����"
1%���!��)�%�%8"��#��"%�"��(
&"����������!"�����������)
1%4����*
1%��8�"����%(��!���"
1%>��#�%��
�����"8���
1%�#!��%����"8���

61Financing Sustainable Development with the Clean Development Mechanism
March 2000 W o r l d R e s o u r c e s I n s t i t u t e http://www.wri.org/
Ranking byabatement cost
Ranking by overalldevelopment benefits
(base-case weights)ProjectPredicted abatement cost(U.S. dollars/tC removed)
Conventional Power Generation
Bagasse-based cogeneration –244 1 1
Combined cycle generation (natural gas) –133 2 2
Atmospheric fluidized bed combustion 7 3 5
Pressurized fluidized bed combustion 47 4 4
Pulverized coal super-critical boilers 96 5 6
Integrated gasification combined cycle 96 5 3
Renewables for Power Generation
Small hydro 29 1 2
Biomass power 134 2 1
Wind farm 216 3 3
Photovoltaic 1,306 4 4
Renewables for Agriculture
Wood-waste gasifier 169 1 1
Agro-waste gasifier 177 2 2
Wind well (shallow) 298 3 5
Wind well (deep) 329 4 4
Photovoltaic pump 6,333 5 3
Cement, Iron, and Steel Manufacture
Dry suspension preheater kiln 7 1 1
Dry precalciner kiln 214 2 2
Table 4-7
Summary of Sector Rankings and Carbon Price

62
March 2000 W o r l d R e s o u r c e s I n s t i t u t e http://www.wri.org/
Financing Sustainable Development with the Clean Development Mechanism
India in terms of development and environmentcobenefits.
This paper also demonstrates a useful methodol-ogy for evaluating the sustainable developmentpotential of projects offering different types ofcobenefit. Inevitably, weighing projects thatgenerate different and unquantifiable cobenefits willbe somewhat subjective. The advantage of theranking (AHP) technique used here is that it createsa transparent framework for handling subjectiveviews on a project’s worth. Over time, the weightsgiven to different types of benefit will have to beconstantly updated to reflect the latest preferencesmanifest in the political process.
This study has presented a preliminaryprioritization of CDM projects for India. Thecurrent application of that technique could beimproved or extended in several ways. Ideally, allprojects could be compared together, instead ofmerely within sectors. This would let policymakersknow which sectors should be emphasized beforedeciding which projects within a sector make mostsense. Adding projects and sectors would allow for amore comprehensive evaluation. In particular,including land use and forestry options, despite theircurrent status in the negotiations, would be helpful.The transport sector is another potential area forfinancing. Urban air pollution and congestion havebeen identified as key environmental problemsdirectly traceable to the many inefficient motorvehicles on the road. The CDM could be used tohelp finance new transport initiatives or to improveengine technologies. Finally, more details on theprojects themselves would allow for more accurateevaluation. For example, the health benefits ofcleaner coal technologies are sensitive to the preciselocation of the plant to be modified.
Even at this stage, however, it is clear thatcandidate projects in India could simultaneouslymake progress on the dual goals set out for theCDM. Ultimately, it is up to India to decide whichprojects to put forward for CDM investment.Project evaluation for carbon as well as non-carbonbenefits should be further developed to maximizethis overlap.
Notes1. This section draws on TERI (1998d).
2 Class I cities have a population of 100,000 or greater; Class IIcities have populations of between 50,000 and 100,000.
3 This section draws on TERI (1998b).
4 These are CO2 emissions from the energy sector in a base-
line scenario for 1990–2020 assuming a 12 percent discountrate. They were calculated using the MARKAL model.
5 This is based on moderate estimates of growth of GDP (5percent to 6 percent a year)
6 Appraisal of the Credit Rating Information Services of IndiaLtd. (CRISIL).
7 In the formal analysis and rankings shown later in Table 4-7,some recognition was also given to the carbon-abatementcost. This however, amounted to only 7.5 percent of a project’sranking and did not alter the overall rankings.
ReferencesAsthana (1993) Impacts of Greenhouse Gas Induced Sea-level
Rise on Islands and Coasts of India. New Delhi: Departmentof Environment and Forests, Jawaharlal Nehru University.
Bhoyar, R.V., Titus, S.K., Bhide, A.D., Khanna, P. (1996)Municipal and industrial Solid Waste Management in India.Journal of Indian Association of Environmental Management,23: 53-64.
CEA (1990) Public Electric Supply, All India Statistics, GeneralReview 1986-87. New Delhi: Central Electricity Authority,Government of India.
CMA (1996) Indian Cement Industry (Statistics) 1995-96. NewDelhi: Cement Manufacturers’ Association.
CMA (1997) 36th Annual Report 1996-97. New Delhi: CementManufacturers’ Association.
CMA (Undated) Various Issues. Indian Cement Industry(Statistics). New Delhi: Cement Manufacturers’ Association.
Confederation of Indian Industries (1996) EnvironmentalBusiness Opportunities in India: A Guide. New Delhi: CII.
CPCB (1990) Status of Water Supply and Wastewater Collec-tion, Treatment and Disposal in Class I Cities—1988. NewDelhi: Central Pollution Control Board.
EPTRI (1995) Status of Solid Waste Disposal in Metropolis.Hyderabad: Environment Protection Training and ResearchInstitute. Draft.
GoI (1997) Annual Plan 1996/97. New Delhi: PlanningCommission, Government of India.
Haarsma, R.J., Mitchell, J.F.B., Senior, C.A. (1993) TropicalDisturances in GCM. Climate Dynamics, Vol. 8, pp. 247-257.

63Financing Sustainable Development with the Clean Development Mechanism
March 2000 W o r l d R e s o u r c e s I n s t i t u t e http://www.wri.org/
IEA (1998) Key World Energy Statistics form the IEA, InternationalEnergy Agency, Paris, Cedex 15
Kumar, K.S. Kavi, Parikh, J. (1998) Climate Change Impacts onIndian Agriculture: The Ricardian Approach. In Dinar et al.edited Measuring the Impact of Climate Change on IndianAgriculture. World Bank Techical Paper No. 402. Washing-ton, DC: The World Bank.
Lonergan (1998) Climate Warming and India. In Dinar et al.edited Measuring the Impact of Climate Change on IndianAgriculture. World Bank Techical Paper No. 402. Washing-ton, DC: The World Bank.
MoF (1996) Economic Survey 1995/96. New Delhi: Ministry ofFinance, Government of India.
MNES (1998) Annual Report 1997/98. New Delhi: Ministry ofNon-convential Energy, Government of India.
MoF (1996) Economic Survey, 1995/96. New Delhi, Ministry ofFinance, Government of India.
MoP (1996) Annual Report 1995/96. New Delhi: Ministry ofPower, Government of India.
Rao, D.G., and Sinha, S.K. (1994) Impact of Climate Changeon Stimulated Wheat Production in India. In C. Rosenzweigand A. Iglesias edited Implications of Climate Change forInternational Agriculture: Crop Modelling Study. Washing-ton, DC: United States Environment Protection Agency.
Ravindranath, N. and B. Somashekhar (1995) “Potential andEconomics of Forestry Options for Carbon Sequestration inIndia,” Biomass and Bioenergy, Vol.8, No. 5, pp. 323-336.
Ravindranath, N. and D. Hall (1995) Biomass, energy and environ-ment, A developing country perspective from India, Oxford UniversityPress, Oxford.
Ravindranath, N, A. Meili and R. Anita (1998) AIJ in the Non-Energy Sector in India:Opportunities and Concerns, Preparedfor the U.S. EPA Climate Policy and Program Division,November.
Reid, W. and J. Goldemberg (1997) “Are Developing CountriesAlready Doing as Much as Industrialized Countries to SlowClimate Change?” WRI Climate Note. Washington D.C:World Resources Institute.
Shailajaha, R, N Ravindranath, H. Somashekar and K Jagadish(1994) “Biomass generation in mixed tree plantations,” Energyand Sustainable Development , Vol. 1, pp. 52-55.
TERI (1996) Survey of Slag Utilization in India. New Delhi:TERI. TERI Project Report No. 95EE51.
TERI (1998a) Activities Implemented Jointly in India. NewDelhi: TERI. TERI Project Report No. 97GW54, pp. 100.
TERI (1998b) TEDDY 1998/99. New Delhi: TERI. Draft.
TERI (1998c) Looking Back to Think Ahead: GREEN India2047. New Delhi: TERI.
TERI (1998d) India National Report on Asia Least-costGreenhouse Gas Abatement Strategy (ALGAS). New Delhi:TERI. TERI Project Report No. 95GW52. Draft: June 1998.
TERI (1998e) Development of a Framework for ElectricityTariffs in Gujarat. Electrowatt Engineering Services Ltd. inAssociation with Tata Energy Research Institute. New Delhi:TERI. ADB T.A. No. 2739-IND. Draft Final Report: February1998.
TERI (1998f) Greenhouse Gas Mitigation Study for SouthernIndia. TERI Project Report No. 95BO51. New Delhi: TERI.Draft: June 1998.
UNEP (1997) Asia Pacific Environment Outlook. Bangkok, Thailand:United Nations Environment Program, EnvironmentAssessment Program for Asia and the Pacific. Washington,DC: World Bank, South Asia Regional Office.
World Bank (1996) India’s Environment—Taking Stock of Plans,Programs and Priorities.
World Resources Institute in collaboration with the UnitedNations Environment Programme, the United NationsDevelopment Programme, and the World Bank (1998) WorldResources Report 1998-99. New York: Oxford University Press.

64March
2000 Wo
rl
d
Re
so
ur
ce
s I
ns
ti
tu
te h
ttp://w
ww
.wri.o
rg/
Finan
cing
Sustain
able D
evelop
men
t with
the C
lean D
evelop
men
t Mech
anism
Appendix 4AClean Development Mechanism Options, by Sector
Appendix 4A
Table 4A-1 Conventional Power Sector
���� �������+���9��������� .��������� �����
���+���9���������2���������� �����
:� �2/�����������9�� ����� ����!
������9���������9��� ���� ����!
�8��" @�)�1��)�%���*"�"(�����!%�*�%��)�%��%���!)+#��%)�E�%*�)%(!�#������!��)�%�"%�"!�%�*����%36�%���������%!���("�%�%��!(�%)����1��!�8���%�)%��%8�!���%"!*�(*�!�
#���!�E�%)#8�!�!������%�"���!)%�!�"�%��#����#!�%�%����4";���!+%�%)�(��%���%36%#��%*�)���%�<��!����%���������������%�)%��"��%� %8�!����
,"��#)��"%"�%�"��%#�!��#��E�%�"���")%�����")8*�!��%8!�))#!�+%;��*�*�%*���%����!���%���"��#)��"%�!�)��!!�%�"�*�%��#�%�%�*�%;���!%;����"%(��!���%)������8�!���(%����������)!�(�%�!"�%��%�"%� 8�!����
�%�"����%�����%���*"�"(��"!%�"��1��)�%%(��!���"��*�%�"����"��%�"��#)��"�*����!%"�%�*�%(�)%�#!���%�)!�8����%��%�%8!�))#!�E���#��E�%��%�"��#)�"!�%�*�8!"#��)%"�%�"��#)��"%8�))�*!"#(*%�%*"�%(�)%����#8)�)���%���"!�%���!�(%�*��#!����%�<*�#)�%(�)%�)%#����E��%�%";)�!���%�#!����5!"))%����������)%�!�%��%�"%��8�!����
��!������%�")�1����������))%-D?G0�,�
�%!�#���".
@�)�%,�)� �� � ��
��#���"%�%��!8"��#��"
@�)�%,�)� ?#�)��������%!�#��%?��%�%,� ,"�8����%��������"%"�
8�!���#����)�%%?��
!�#���")%"�%��%�"%��8�!���'%&�
<%!�#���")%"�
��%�"% �%8�!����
,"�8����%��������"%"�8�!���#����)�%?�
�%!�#���")%"�
�%�"%��%8�!���'%&�<
!�#���")%"�%��%�"% �8�!����
��#���"%�%"�*�!8"��#���)
@�)�%,�)� ��#��%)"��%;�)�� ?"��%;�)��%��!��)�)%�#����#�)%(�8)#�F�%#)������8!"#���
?"��%;�)��%��!��)�)%�#����#�)%(�8)#�F�%#)������8!"#���
��*�!���!"�����������)
@�)�%,�)� &�#�!�� &�#�!�� &�#�!��
6*��%)"����%������)!�)#��H%-��%(�+8"��!��%���������"+!#!��%����"8���.
@�)�%,�)� &�#�!�� ?���%"�%(�8)#�%(��!���)����"��%��"��%�%����!����%9"�)�
?���%"�%(�8)#�%(��!���)����"��%��"��%�%����!����%9"�)�
����'%D?G�%I%�)%��

65Fin
ancin
g Su
stainab
le Develo
pm
ent w
ith th
e Clean
Develo
pm
ent M
echan
ism
March
2000 Wo
rl
d
Re
so
ur
ce
s I
ns
ti
tu
te h
ttp://w
ww
.wri.o
rg/
Appendix 4A
Table 4A-1 Conventional Power Sector (continued)
���� ����*!��0������0���������!�� �!����1���
�� �!����1����0�!������!� ����!���������0�
-�0��. ������0�!������!
�8��" �%(�)�������"%8���%�"��!�)%�"��%��"�%�"��#)�����%�%8#!����%(�)+%;*��*�)%8�))�%�"%�%(�)%�#!����%�<*�#)�(�)�)%�!�%��8�#!�%�%(��!���)�����%%/"!%)��"1(��!���"���*"�"(��)+%����������)%�!�%�<8�����"%��%��%�"%��%8�!����
&��#!��%(�)%�"����%�����%8���)%#)��*�%;�)��%*���%�%�%*���%!��"��!�)����%(��!��"!%-4�?5.+%(��!���(����"��%8";�!�%%���������%�)%��8�!���%"!%*�(*�!�
@�(�))�1��!�%�"(��!���"%;"#����%�"%*�(*%���������%�%)#(�!����)%�%8!"���%�%��!(�%��8�����+)����1"�1�*�1�!�+%"��1)��)"%�#��)#88���%%��%;"#�%!�7#�!�!��!"�����(%�<�)��(%�"���!)%��)�����(%�"(��!���"%�7#�8����%�����%8"��#��"%�"�!"��7#�8����%% ���%"8�!���(���������%�)%�)%*�(*%�)% �%8�!���
��� �!�-�!����
��!������%�")�����������))%-D?G0�%,�
�
!�#���".
�� $��� $���
!+���! �!����-�!����
��#���"%�%��!%8"��#��" ,"�8����%��������"%"�%8�!���#����)�?�
�%!�#���"%"�%��%�"%��%8�!���'%&�
<
!�#���"%"�%��%�"%��%8�!����
,"�8����%��������"%"�%?��%�
8�!���#����)'%)#�)������%!�#���"%"�&�
<
��������)%��!%8"��#��"�
��#���"%�%"�*�!8"��#���)%-��(�+%)"��%;�)��).
@"��"�%�)*%�)%(��!���� &"%)"��%;�)��%(��!���" ?"��%;�)��%�)%!�#��%����#)���(�))�%�)%#)�%�"!%8";�!(��!���"�
��*�!%���!"�����������)%-��(�+%��"���!)���8!"�����"+%8!"�����"%"���")�)���).
&�#�!�� :�%!�7#�!����%�)%)#�)��������!�#���
@�%�)8����(%�"��1��)�%8";�!(��!���"+%��!���%������)%�!�)��!"�%!�#��%8"��#��"%�"��(�!"�%���(%�%�)8����%8";�!(��!���"�
�������-�!����
6*��%)"����%������)%!�)#��H-��%(�+%8"��!��%���������"+!#!��%����"8���.
&�#�!�� &�#�!�� ����"��%��"��%(��!���"%�"!�"�*%%��!��!)%�%)#(�!%����";�!)�%����"��%��8�"����(��!���"�
����'%D?G�%I%�)%��

66March
2000 Wo
rl
d
Re
so
ur
ce
s I
ns
ti
tu
te h
ttp://w
ww
.wri.o
rg/
Finan
cing
Sustain
able D
evelop
men
t with
the C
lean D
evelop
men
t Mech
anism
Appendix 4A
Table 4A-2 Renewables for Power Generation
���� ���� � ����/1��� ;�!����� -�� ��2�<�� �/���+������
��)�!�8��"%"�%"8��" ?����%*�!"%#��)%��%��A������(�%"�%)�����)�*�!(�)%�!"�%8�!����)�!���)%�%���%*��(*�����!�����)%�%��!(��!!�(���"%)�)���)%�%�*�8���)�%%�)�����%��8�����!�(�)%�!"�%�%36%�"%��36�%�*�)%�)%�%%���!���E�8";�!1(��!���"%"8��"�
�%;�%��!�%�)%���%#8%"�%(!�1�"����%;�%�����!��(��!��"!)%-#)#����%���A6%���"��.�%���*"#(*%;�(��!��"!)%��%��%#)�%�"!�"�*%���!���E�%�����!���E�%8";�!(��!���"+%�*�%��!(�)��)�������")%�"%���%*���%����"����%�"%�%(!��%%�*�������%��8�"�%*"!�E"���%�<�);�%�#!���)�%5!�1�"����(��!��"!)%!�(�%�!"�%���%�"���%A6%!�(��%%D��)%"�%���%�"%�36%)*"#�%)""%��%����������
�%�%(�)����!+%)"��%�#��%�)%�"��!��%��%�)�!��)%"�%�*�!�"�*������%8!"��))�)%��"�%(�)�"#)%�#��%�*��%��%��%�"��#)����*�)%���*"�"(�%��%��%#)�%�%(!�1�"����%"!%)��1��"�%�88������")�3"!�%�<8�!�������"%���")�!���"%��)%�"%��%"�%;��*)����1)����%(�)�������"%���*"�"(�%-����"%���%A6.�%�*�)%�)%�%����!���E�"8��"�
?"��!% >%)�)���)%�"��!�)#��(*�%��"%�����!�����%�*!"#(*�%)����"#��"!%�����!"��8!"��))�%���*"#(*%�*�%"8��"%�)�"!%����!���E�%8";�!(��!���"+%%��!(�1)����%#������"8��")%�!�%��)"%8"))�����%�*�*�(*%�")�%"�% >%�)%�%��9"!"�)�����%�"%��)%���#)�"�/#!�*�!+%���*"#(*%�*�%�"#��)�!�%*�(*��%!�������+%"��!���)�)���%!����������%�)%�")�!�����%8""!%8�!�"!����%"�������%)�)���)�%,")�)%�"!%�*�)���*"�"(�%;���%����%;��*���!�(�
��� �!�-�!����
��!������%�")�����������))%-D?G0�%,��!�#���".
�� ��� ��� �+���
!+���! �!����-�!����
��!%8"��#��"%-��(�+%?��+&�<+%�? +%�E"�+%,�.
&"%��!%8"��#��" &"%��!%8"��#��" ��"#�%��%�"% �%8�!���%"�%�*�%�"))��%�#���)%!�8����%��%��"��))+%!�#��(���))�")%"�%8�!���#����)+%?��%�%&�<+"�*�!;�)�%������
&"%��!%8"��#��"
��#���"%�%"�*�!8"��#���)%-��(�+%)"��;�)��).
&"� &"� ?"��%;�)��%(��!���"%�)%�����E�%�))"��%;�)��%�%�*�%�"!�%"�%�!�7#����)%�)#)�%�)%�#���
&"�
��*�!%���!"�����������)%-��(�+%��"���!)���8!"�����"+%8!"�����"%"���")�)���).
?����%*�!"%��"�)%�*�8!"����)%"�%��!(�%��))#�*%�)%%)#���!(���%"�8!"#�����%�0"!%�"!�)���+%�"))%"�%��"���!)���+�)8�������%"�%8�"8���
�*���)%�"���%��!(�%)��#!���� �*���)%�"���%��!(�%)��#!���� �*���)%�"���%��!(�%)��#!����
6*��%)"����%������)%!�)#��H-��(�+%8"��!��%���������"+!#!��%����"8���.
5��!���)%�"�����8�"����+%!#!������"8���+%�%"�*�!!�����%��""���%���������)�
,!����)%��8�"����%�"!%�"�*)A����%�%)���)A����%;"!A�!)�
,!����)%�"���%��8�"����%"88"!�#����)�%���������)%!�����%�"%��!(�8������"�%/#!�*�!+%�)%8";�!(��!���"%�)%����!���E�%��%���%����"%!�(�"��%����"8���%"�%��""����%�#)�!���%���������)�%%�*�%���*"�"(��)%�"�����%��(�"#)+%)"%��8�"����%���#����#!�(%���%��)"%��!��)�%#�%�"�*�%��!��)�%#����E���"%"�%(�)����!)�
D��A�%"�*�!%"8��")+%��%�)%*�(*����8����%���)����%@#�+%!�8��"���!�����E���"%��(*�%�!����9"�)%�%��#����#!�(+�)�������"%�%�����������������)�
&"��B%D?%G�%I%�)%��

67Fin
ancin
g Su
stainab
le Develo
pm
ent w
ith th
e Clean
Develo
pm
ent M
echan
ism
March
2000 Wo
rl
d
Re
so
ur
ce
s I
ns
ti
tu
te h
ttp://w
ww
.wri.o
rg/
Appendix 4A
Table 4A-3 Renewables for Agriculture
���� ����:0��.<���� ���0������
;���.<���� ����0������ ;�!��/����<�<��� ;�!�����2�<��� �=�2� 2
��)�!�8��"%"�%"8��" 5�)����!)%�#���%��%�(!��#��#!��;�)��)�%�*�%�"�8������������;��%(�)%�%�(��%��)�"%��%!�)"����%��)"%��8������#���(%�)%!�7#�!�%�%)�)���"8�!���"%�%���������
�)%8!���"#)%�#��#���%��%;"";�)��)
6�����)%��%��%#)�%�"%8#�8;���!%�%���*�!%��8%"!%)*���";;���)�%�%���+%;�%8#�8)%�!�#)#����%���*�����%!��*�!%�*������!���%%�*�%���*"�"(�%��)�"%��%�#!�*�!%����"8�%�""��!�"��%�#!!��%�)�(8!"����)�%%����%�*�%)����)�(%)�)���)%*���%�"%��%#)��"!%����!��%)���%�"���")���)"+%�*�!�%�)%�%���A%"�%8!"8�!���*����%���A#8�
�)%8!���"#)%�#�;��*%��8�!%;���
*"�"�"�����)%��%��%#)��"!%;���!%8#�8�(%���"!%�!!�(���"%�%!�(�");��*%)*���";%;���!%�����)��;"%��8�)%"�%8#�8%�!����������B%)#!�������!��#(��%8#�8)%���8%;���%)#���!)����8#�8)�%%?�E�)%!�(�%�!"����%68%�"%�+���%68�%%�*�)���*"�"(�%!�7#�!�))�(������%����"8���� !�)��%�")�!���)%�")�)�"�%�";%�����!�����%8!���)%�"!�*�%�(!��#��#!�%)���"!%��*�%*�(*%��8����%�")��
��� �!�-�!������!������%�")�����������))%-D?G0�,��%!�#���".
��� ��� �� ��� �+���
!+���! �!�����-�!����
��#���"%�%��!8"��#��"%-��(�+%?��+&�<+%�? +%�E"�+%,�.
6"#�%)#�)��������%!�#����)��%#)�%�%�*#)%8�!���#�����%,�%���))�")�%%��#���")�%?��%;"#�%�8�%"%�*�7#�����%"�%�#��%#)�+%;*���%&�<!�#���"%;"#�%�8�%"�"��#)��"%���8�!��#!��%@"�*�*�%�����!%��%��%�"�!"���%�")#�)��������%!�#��%"��!���8"��#��"
?���%�)%�(!"1;�)��%(�)����!)
��#���"%�%��!%8"��#���)%"��#!)�*!"#(*%�)8�������%"�8#�8)��)%#)�(%�"����"%�"))���#��)%-��)��.�
?���%�)%;�)*���";%;���
��#���"%�%��!%8"��#���)"��#!)%�*!"#(*�)8�������%"�%8#�8)��)#)�(%�"����"%�"))���#��)%-��)��.�
��#���"%�%"�*�!8"��#���)%-��(�+%)"��;�)��).
?"��%;�)��%�)%)�(��������!�#��%�*!"#(*%�!�7#����(%"�)"��%;�)��)%�%�"!�%�"�8�����"��#)��"�
?���%�)%�(!"1;�)��%(�)����!)
���%)�#(�%�!"�%��)��%#��)%�)�)8�����%%&"�)�%8"��#��"%�))#�)��������%!�#���
?���%�)%;�)*���";%;��� ���%)�#(�%�!"�%��)��
#��)%�)%�)8�����%%&"�)�8"��#��"%�)%)#�)��������!�#���
��*�!%���!"�����������)%-��(�+��"���!)���%8!"�����"+8!"�����"%"���")�)���).
�*�)%"8��"%;"#�%��"���)�(������%)���(%"�%�"))��%�#��)�)%;���%�)%8!������"!�)����"�%/#!�*�!+%*����**�E�!)%;"#�%��%(!�����!�#���
?���%�)%�(!"1;�)��%(�)����!)
,")�!��)%;���!%��%#)�(%�����!;���!%���(����%���*�7#�)��*�)%�%�#!%���)%�"%)"���")�!����"%��%!�#��(%�"8%)"���!")�"�
?���%�)%;�)*���";%;��� ,")�!��)%;���!%��%#)�(
�����!%;���!1���(����%���*�7#�)��*�)%�%�#!%���)%�"%)"���")�!����"%��%!�#��(�"8%)"��%�!")�"�%%@�����)�!�%�";�!%�*�%�%�*�;�8#�8%��)�)�
�������-�!����
6*��%)"����%������)!�)#��H%-��(�+%8"��!�����������"+%!#!������"8���.
�#!��%����"8���%�!"������%���*"�"(�%�"8��"�%�*�%�(!��#��#!�%)���"!%�%������!%���!"����
?���%�)%�(!"1;�)��%(�)����!)
&�#�!�� ?���%�)%;�)*���";%;���
&�#�!��
����'%D?G�%I%�)%���

68March
2000 Wo
rl
d
Re
so
ur
ce
s I
ns
ti
tu
te h
ttp://w
ww
.wri.o
rg/
Finan
cing
Sustain
able D
evelop
men
t with
the C
lean D
evelop
men
t Mech
anism
Appendix 4A
Table 4A-4 Iron and Steel
���� ����>��������������!2�����?>8�@
>�1�5��!�/�!0�A-B�,���A�484�A�-CB�A���?>D@
-�����E10�!����!���?-CB@
6����./�0/�2�<���.����������������!�����6,�.:B�
��!��!��������!0?��@
��)�!�8��"%"�"8��"
�!"%"!�%�)%�!�����!�#��%�"%�!"%��#)�(%�"��%"!%��#!��(�)%�)%�#��%���"!�%�*�!�)#���(%J)8"(��!"K%�)%�"��!��%�")����%�%�%�����!��%�!��#!���%-��/.�"8��(%#��!�1*�(*8";�!%�#!������*"�"(�%-D4/.�
�!�%7#��*�(%"�%�"A�#)�(%��!"(�%(�)�6�)��%*���%�)%!��"��!��!"�%�*�%��!"(�%(�)�"%(��!���%8";�!%�"!���!��%#)�%�%�*�8����%�%�*�%�!"1��A�(%8!"��))+%�%*�(*18!�))#!�%���)�%�#!���;��*%�%�"8%!��"��!��#!���%-���.%�)%#)���*�%!�����(%;�)��*���%�)%#)�%�"!%8!"��))*���%�88������"�%�*�)����1��A�(%8!"��))#)�)%�%��)��%"<�(��#!���%-@�/.+%;*��*#)�)%"<�(�%�"%�"��!�8�(%�!"%�"%)����%�)���"�%�#��%"��%�)%�%�*�%"8�*��!�*%�#!���%-�4/.��*�%�"���%)����%�)%��)��%�"��#"#)%��)��!-,,.�
4"�%�����%�!"�%�*�%���)��#!���%�)%�"��!���!�����%�"%)����%��%��";�("<�(�%��"%�*�%�����+%�*#)!�#��(%��)%��!�"%�"������";%�%8�!����%�*�)���*"�"(�%�)%�88�������"��%�%)����%��#����#!�(�%���(!���%)����%8���)�%���)%"�%�"���!���������������%�%����
�%�����!��%�!�%�#!�����8����%"�%"8�!���(%�����8�!��#!�)%"�%#8%�"����",�%�*�)%���*"�"(�%�)#)�%�%��#����#!�()����+%8!���!���%�%)8"(��!"%8���)%�%���1)����8���)%�*��%#)�%"��%)�!�8%�)���)�"�A�%4";���!+%��/)*���%"�*�!%�88������")%��*�%��!�)���)+%!��!���"!�+�%�����!"�*�������#)�!��)�%�*�)%���*"�"(���)"%*�)%�"%��%��8"!���
3"���%)����%�)�!�����%��)�%�"���)*�%)����+�"�����%��8�))�(�*�%���!������)��(�%"�%�!#�%)������#����#!�%;*�!��%)#�)��������"#�%"�%��!(��)%;�)��%�%�*����)*�(�%�*�)8!"��))%�)�88�������%�"%)������#����#!�(%��"�*%���(!���)����%8���)%����1)����%8���)�
�������%��)�1��)��"�8�!�)"
���(!���%)����%8������*"�"(�%;��*%�*�;��%7#��*�(%-6L."8��"+%���)�%�#!���-@/.+%"8�%*��!�*�#!���%-�4/.+!�*����(%�#!���-�4/.+%�%"!�����)��(%-&,.�
6��%7#��*�(%-6L."8��"%;��*%���)��#!���%-@/.+%�%"8�*��!�*%�#!���%-�4/.+!�*����(%�#!���%-�4/.+�%"!���%��)��(-&,.�
�8�%*��!�*%�#!��� ,"����"��%�����!��%�!��#!���
,"����"��%��)��(
��� �!�-�!����
/������%�")�-����%D?G.
���%�"%���0%�%���)*�)����%-��).
���%�"% ��%0%��)%-;��*"#����.�
����%3%�"%����%3� ����%3%�"%����%3 ����%3�
,�!�"%�"<��!�#���"%-C(,�
�0�%"�%�!"%�
)����.
�����%C(0��) ����%C(0��) � ���%C(0��) �+���%C(0��) �+�����%C(0��)

69Fin
ancin
g Su
stainab
le Develo
pm
ent w
ith th
e Clean
Develo
pm
ent M
echan
ism
March
2000 Wo
rl
d
Re
so
ur
ce
s I
ns
ti
tu
te h
ttp://w
ww
.wri.o
rg/
Appendix 4A
Table 4A-4 Iron and Steel (continued)
���� ����>��������������!2�����?>8�@
>�1�5��!�/�!0�A-B�,���A�484�A�-CB�A���?>D@
-�����E10�!����!���?-CB@
6����./�0/�2�<���.����������������!����6,�.:B�
��!��!��������!0?��@
!+���! �!����-�!����
��#���"%�%��!8"��#��"%-��(�+?�
�+%&�
<+%�? +
�E"�+%,�.
"��#��"%�"��(�8�)%"%�#��%#)��&"��*���))+%�)#�)������%!�#���"�%8"��#��"%"��#!)%�)�%!�)#��%"�%�����E�("8�!���(%)��8)
?#�)������%!�#���"%�8"��#��"+%�)8�������8�!���#����)
6��*%"<�(�%!�8����(%�#��"��+%���%8"��#���)%�!�)#�)��������%!�#���
�88!"<�������%�%�;"1�*�!)%!�#���"%�%���8"��#���)�
���%8"��#���)%�!�!�#��%-�)%"!�*����(%�)%!�7#�!�.�
��#���"%�%"�*�!8"��#���)%-��(�+)"��%;�)��).
��#��%)"��%;�)�� &"%)"��%;�)��(��!���
&"%)"��%;�)��%(��!��� �)%��)�%��)� ?"��%;�)��%(��!���"�)%)#�)�������������E�+%�)%�!�!�7#�!����)%�"!�""��(%;���!%�%�#��"���
��*�!���!"�����������)%-��(�+��"���!)���8!"�����"+8!"�����"%"���")�)���).
@"�*%;���!%�%��!�7#�!����)%�!�%��))�
&"%;���!%�)%#)�+%����!"�����%*�E�!)�!�%)#�)��������!�#���
?#�)�������%&"�%"��%�)%�*�;�)��%*���%!��"��!�%��!�*�(*+%�#�%;�)��%(�)�)%�!"�@�/%��%��)"%��%#)�%�)�#��)%�%"�*�!%8�!�)%"�%�*�8����
�)%��)�%��)� ��!���%������)%�!"�"�%#)�(%�""��(;���!+%�#��%"��%��"���
�������-�!����
6*��%)"����������)%!�)#��H-��(�+%8"��!�����������"+%!#!������"8���.
�*�)%���*"�"(�%���)�"%�%�!��1"��B%;*�����8����%�")�)%�!�!���������%�";+%�*�*�(*%��""���)%"�)����%)��%�%��!(����(!���%)����8���)%��"�%��)#)�����
�)%��)�%��)� �)%��)�%��)� �)%��)�%��)� ��!���%������)%�)*����*%*�E�!)%�!������E��
��)%�")%"�%���)*�%)�����'%3%�����"�����'%D?%G�%I%�)%��

70March
2000 Wo
rl
d
Re
so
ur
ce
s I
ns
ti
tu
te h
ttp://w
ww
.wri.o
rg/
Finan
cing
Sustain
able D
evelop
men
t with
the C
lean D
evelop
men
t Mech
anism
Appendix 4A
Table 4-5 Cement
���� ���� >�1�2�������!���F��! >�1.��2�!��!����/������G��!��)�!�8��"%"�%"8��" !���������"%�)%�%8!"��))%"�%�!����(%�*�%!�;
����%���"!�%����(%��%�"%�*�%���%A���%�%�*�8!���������"%8!"��))+%�*�%8!�*����%!�;%�����)%*����%��%�%�";�!%���8�!��#!�%�*�%�*��%��*�%���%A���%�*�%��"#�%"�%��������"��*����%�)%���;��% �%�%��%8�!����%�*�)���*"�"(�%�)%�88�������%"��%�%!�%8!"��))�����%��#����#!�(�%/"!%�*�)%��)�+%�*�%��)����*"�"(�%�)%"18!�������!%A���
4"�%(�)�)%�����(%�*�%���%A��%�!�%���;��%���%�����",%�%��!!�%�%)#�)������%7#�����%"�%;�)��%*�����*�)%;�)��%*���%�)%!��"��!�%�%*�(*1���������)#)8�)�"%����"�%8!�*����!)�%�*�)%���*"�"(�%�)���������%"��%�%!�%8!"��))%�����%��#����#!�(�%/"!�*�)%��)�+%�*�%��)�%��)�%�)%"%8!�*����!%A���
��� �!�-�!����
��!������%�")�%����������))-D?G0�%,�
�%!�#���".�
��� �
!+���! �!����-�!����
��#���"%�%��!%8"��#��"%-��(�+%?��+&�
<+%�? +%�E"�+%,�.
��#���"%�%8"��#���)%�)%��!(�%�")#�8��"�)%)#�)��������%!�#���
�%!�#���"%�%8"��#��"%�)%��A���%����#)�%"�%�*�%�";��!(�%�")#�8��"%#!�(%�*�%��������"%8!"��))�
��#���"%�%"�*�!%8"��#���)-��(�+%)"��%;�)��).
�)%!������%��)�%��)� �)%!������%��)�%��)�
��*�!%���!"�����%������)-��(�+%��"���!)���%8!"�����"+8!"�����"%"�%��")�)���).
�)%!������%��)�%��)� �)%!������%��)�%��)�
�������-�!����
6*��%)"����%������)%!�)#��H%-��(�+8"��!��%���������"+%!#!��%����"8���.
�)%!������%��)�%��)� �)%!������%��)�%��)�
����'� ���%��8�����%�)%�+���%�")%8�!%��'%�%�*�%8���%;"!A)%���%��)%�%���!�D?%G�%I%�)%��

71Financing Sustainable Development with the Clean Development Mechanism
March 2000 W o r l d R e s o u r c e s I n s t i t u t e http://www.wri.org/
Appendix 4BRanking Projects Offering DifferentTypes of Noncarbon BenefitsProjects are difficult to rank because many importantcriteria are unquantifiable and non-comparable.How, for example, should a project that leads to air-quality improvements be compared with a projectthat generates jobs? To tackle this problem, anAnalytical Hierarchical Process (AHP) technique isused. AHP provides a tool for scoring and weight-ing a mitigation option’s unquantifiable attributes.Though providing no single answers, the AHPresults reveal which projects will be preferred underdifferent criteria and how rankings would change ifcertain criteria were weighted differently. AHP lendstransparency and structure to project evaluation anddecisionmaking.
To assess and set priorities for mitigationoptions, we have used the Hierarchical PreferenceAnalysis model (HIPRE) developed by the SystemsAnalysis Laboratory of the Helsinki University ofTechnology. The process involves ranking a projectby four criteria: cost-effectiveness, feasibility andconsistency with national priorities, non-climatebenefits, and development benefits. Aggregatingthese for each project allows project comparisons.Priorities were developed for each sector reviewed.
CDM options are evaluated against the fourfollowing criteria, three of them with furthersubcriteria:
• Incremental cost effectiveness: the incremental costper unit of CO
2 reduction.
• Feasibility: including consistency with existinggovernment policy; perceived risks from boththe investors’ and the host country’s points ofview; and consistency with national priorities,namely, social and economic development.
• Other environmental benefits: including resourceconservation; pollution loading, and healthimpacts.
• Development: including importance ofemployment generation, adding value, andrural development.
The relative priorities of these objectives wereexpressed using weights. For the base case, weightswere derived from a delphi study conducted amonggovernment officials and in-house experts. (See Table4B-1.) (Note that the carbon price makes up only7.5 percent of the overall weighting.)
At this stage, in the absence of data on nonmon-etary criteria, different technological options areevaluated against each other by comparing pairs.Each option is scored according to the following:
A is equally preferred to B 1 point
A is slightly preferred to B 3 points
A is more preferred to B 5 points
Table 4B-1
Base-Case Weights for AHP Criteria
���!���������8�����+�<��0/�� �� ��������
8�����+�<��0/�
��!������%�")�%����������))%-G0�,. ���
���� 5"��!���%8"���� ����,"�8!"��)�(%)"��"��""���%����"8���� ����
/��)�������
��)A ����
���� ��)"#!��%�")�!����" �������!��)�%�%8"��#��"%�"��( ����
��*�!%���!"�����%%������)%-"1,��.
4����* ����
���� ��8�"����%(��!���" ��� >��#�%����" ����
�����"8���
�#!��%����"8��� ������%�)%8�!����(�%"�%�"���%;��(*��(���%%�)%8�!����(�%�"�!��#��"%�"%���%����("!��

72
March 2000 W o r l d R e s o u r c e s I n s t i t u t e http://www.wri.org/
Financing Sustainable Development with the Clean Development Mechanism
A is significantly preferred to B 7 points
A is strongly preferred to B 9 points
where A and B represent two technologicaloptions. Where possible, basing rankings onquantitative data would be preferable. For example,pollution loadings attributable to different optionscould form a scoring basis for that particularsubcriterion. Over time, it would be hoped that asmany as possible of the criteria could be judged onthe basis of quantities rather than subjective evalua-tion, accepting, of course, that some values (e.g.,consistency with government policy) defy meaning-ful quantification.
Example: Results for the Power SectorFigure 4B-1 demonstrates the results for a singlesector—conventional power generation. Underbase-case weighting, bagasse-based cogeneration isthe most highly preferred option. This is followedby Combined Cycle Gas Turbine (CCGT), Inte-
grated Gasification Combined Cycle (IGCC) andPulverized Coal Subcritical Boilers (PCSCB), whichare similarly ranked in overall terms but exhibit adifferent composition of benefits. In particular,PCSCB scores highly on development benefits butscores a negligible amount on non-climate environ-mental improvement relative to the other options.The fifth- and the sixth-ranked options are Pressur-ized Fluidized Bed Combustion (PFBC) and Atmo-spheric Fluidized Bed Combustion (AFBC). Similarrankings were done for all four sectors that could beanalyzed.
Because the overall benefit of a project is madeup of its constituent parts, various sensitivity analy-ses can be done. For example, if projects werejudged only on their non-climate environmentalbenefits, CCGT would rise to the top, whilePCSCB, which offers no environmental benefitsoutside of climate, would rank last. An almostinfinite number of sensitivity analyses could be runto reflect different perspectives on what is mostimportant for a project. This could be adapted overtime to reflect changing views.
Figure 4-B1
Evaluating Noncarbon Benefits of Projects for Conventional Power GenerationSector
0.000
0.050
0.100
0.150
0.200
0.250
0.300
0.350
PCSCB AFBC PFBC IGCC CCGT Bagasse
Feasibility
Other environment
Development