issues to address - eastern mediterranean universityme.emu.edu.tr/behzad/meng286/applications and...
TRANSCRIPT

1
Chapter 11: Applications and Processing of Metal Alloys
ISSUES TO ADDRESS...
• How are metal alloys classified and what are their
common applications?
• What heat treatment procedures are used to improve the
mechanical properties of both ferrous and nonferrous alloys?

2
Classification of Metal Alloys
Adapted from Fig. 9.24, Callister &
Rethwisch 8e. (Fig. 9.24 adapted from
Binary Alloy Phase Diagrams, 2nd ed.,
Vol. 1, T.B. Massalski (Ed.-in-Chief),
ASM International, Materials Park, OH,
1990.)
Adapted from Fig.
11.1, Callister &
Rethwisch 8e.
Metal Alloys
Steels
Ferrous Nonferrous
Cast Irons
<1.4wt%C 3-4.5 wt%C
Steels <1.4 wt% C
Cast Irons 3-4.5 wt% C
Fe 3 C
cementite
1600
1400
1200
1000
800
600
400 0 1 2 3 4 5 6 6.7
L
g
austenite
g +L
g +Fe3C a
ferrite a +Fe3C
L+Fe3C
d
(Fe) Co , wt% C
Eutectic:
Eutectoid: 0.76
4.30
727ºC
1148ºC
T(ºC) microstructure: ferrite, graphite/cementite

3
Steels
Based on data provided in Tables 11.1(b), 11.2(b), 11.3, and 11.4, Callister & Rethwisch 8e.
Low Alloy High Alloy
low carbon <0.25 wt% C
Med carbon 0.25-0.6 wt% C
high carbon 0.6-1.4 wt% C
Uses auto struc. sheet
bridges towers press. vessels
crank shafts bolts hammers blades
pistons gears wear applic.
wear applic.
drills saws dies
high T applic. turbines furnaces
Very corros. resistant
Example 1010 4310 1040 43 40 1095 4190 304, 409
Additions none Cr,V
Ni, Mo none
Cr, Ni
Mo none
Cr, V,
Mo, W Cr, Ni, Mo
plain HSLA plain heat
treatable plain tool stainless Name
Hardenability 0 + + ++ ++ +++ varies
TS - 0 + ++ + ++ varies EL + + 0 - - -- ++
increasing strength, cost, decreasing ductility
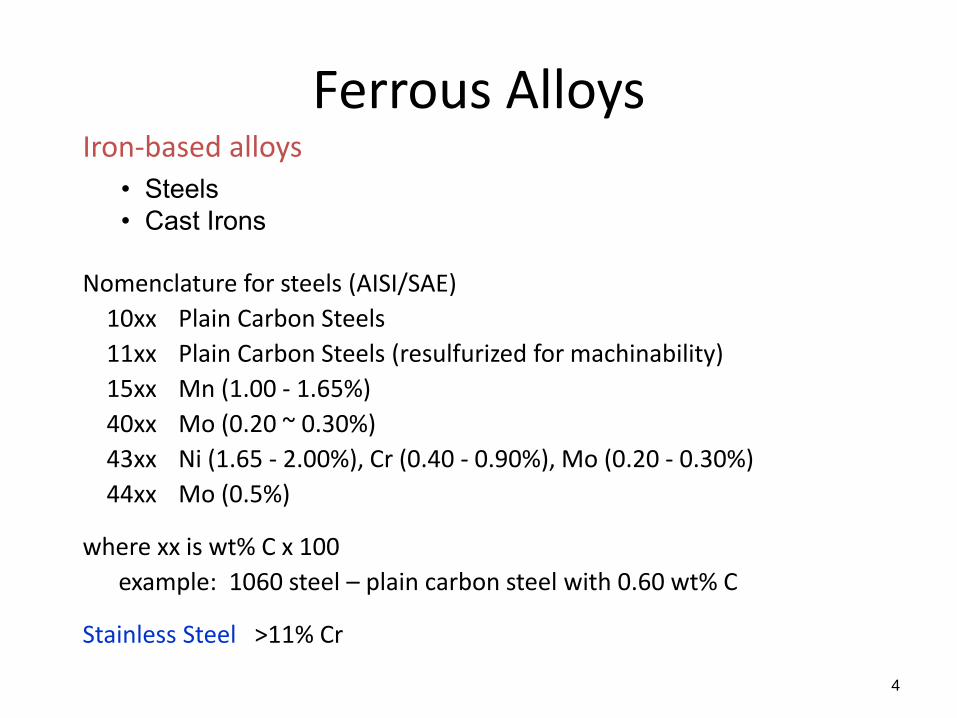
Ferrous Alloys Iron-based alloys
Nomenclature for steels (AISI/SAE)
10xx Plain Carbon Steels
11xx Plain Carbon Steels (resulfurized for machinability)
15xx Mn (1.00 - 1.65%)
40xx Mo (0.20 ~ 0.30%)
43xx Ni (1.65 - 2.00%), Cr (0.40 - 0.90%), Mo (0.20 - 0.30%)
44xx Mo (0.5%)
where xx is wt% C x 100
example: 1060 steel – plain carbon steel with 0.60 wt% C
Stainless Steel >11% Cr
4
• Steels
• Cast Irons

Cast Irons
• Ferrous alloys with > 2.1 wt% C – more commonly 3 - 4.5 wt% C
• Low melting – relatively easy to cast
• Generally brittle
• Cementite decomposes to ferrite + graphite Fe3C 3 Fe (a) + C (graphite)
– generally a slow process
5

Fe-C True Equilibrium Diagram
6
Graphite formation
promoted by
• Si > 1 wt%
• slow cooling
Adapted from Fig. 11.2,
Callister & Rethwisch 8e.
[Fig. 11.2 adapted from
Binary Alloy Phase
Diagrams, 2nd ed.,
Vol. 1, T.B. Massalski (Ed.-
in-Chief), ASM International,
Materials Park, OH, 1990.]
1600
1400
1200
1000
800
600
400 0 1 2 3 4 90
L
g +L
a + Graphite
Liquid +
Graphite
(Fe) C, wt% C
0.6
5 740ºC
T(ºC)
g + Graphite
100
1153ºC g
Austenite 4.2 wt% C
a + g

Types of Cast Iron Gray iron
• graphite flakes
• weak & brittle in tension
• stronger in compression
• excellent vibrational dampening
• wear resistant
Ductile iron
• add Mg and/or Ce
• graphite as nodules not flakes
• matrix often pearlite – stronger but less ductile
7
Adapted from Fig.
11.3(a) & (b),
Callister &
Rethwisch 8e.

Types of Cast Iron (cont.) White iron
• < 1 wt% Si
• pearlite + cementite
• very hard and brittle
Malleable iron
• heat treat white iron at 800-900ºC
• graphite in rosettes
• reasonably strong and ductile
8
Adapted from Fig.
11.3(c) & (d),
Callister &
Rethwisch 8e.

Types of Cast Iron (cont.) Compacted graphite iron
• relatively high thermal conductivity
• good resistance to thermal shock
• lower oxidation at elevated temperatures
9
Adapted from Fig. 11.3(e),
Callister & Rethwisch 8e.

Limitations of Ferrous Alloys
1) Relatively high densities
2) Relatively low electrical conductivities
3) Generally poor corrosion resistance
10

11
Nonferrous Alloys
Based on discussion and data provided in Section 11.3, Callister & Rethwisch 3e.
NonFerrous Alloys
• Al Alloys -low r: 2.7 g/cm3
-Cu, Mg, Si, Mn, Zn additions -solid sol. or precip. strengthened (struct.
aircraft parts & packaging)
• Mg Alloys -very low r : 1.7g/cm3
-ignites easily - aircraft, missiles
• Refractory metals -high melting T’s -Nb, Mo, W, Ta • Noble metals
-Ag, Au, Pt - oxid./corr. resistant
• Ti Alloys -relatively low r: 4.5 g/cm3
vs 7.9 for steel -reactive at high T’s - space applic.
• Cu Alloys Brass: Zn is subst. impurity (costume jewelry, coins, corrosion resistant) Bronze : Sn, Al, Si, Ni are subst. impurities (bushings, landing gear) Cu-Be : precip. hardened for strength

12
Thermal Processing of Metals Annealing: Heat to Tanneal, then cool slowly.
Based on discussion in Section 11.7, Callister & Rethwisch 8e.
Types of
Annealing
• Process Anneal:
Negate effects of cold working by (recovery/ recrystallization)
• Stress Relief: Reduce stresses resulting from:
- plastic deformation - nonuniform cooling - phase transform.
• Normalize (steels): Deform steel with large grains. Then heat treat to allow recrystallization and formation of smaller grains.
• Full Anneal (steels): Make soft steels for good forming. Heat to get g , then furnace-cool
to obtain coarse pearlite.
• Spheroidize (steels): Make very soft steels for good machining. Heat just below Teutectoid & hold for
15-25 h.

Heat Treatment Temperature-Time Paths
a) Full Annealing
13
b) Quenching
c)
c) Tempering
(Tempered
Martensite)
P
B
A
A
a) b)
Fig. 10.25,
Callister &
Rethwisch 8e.
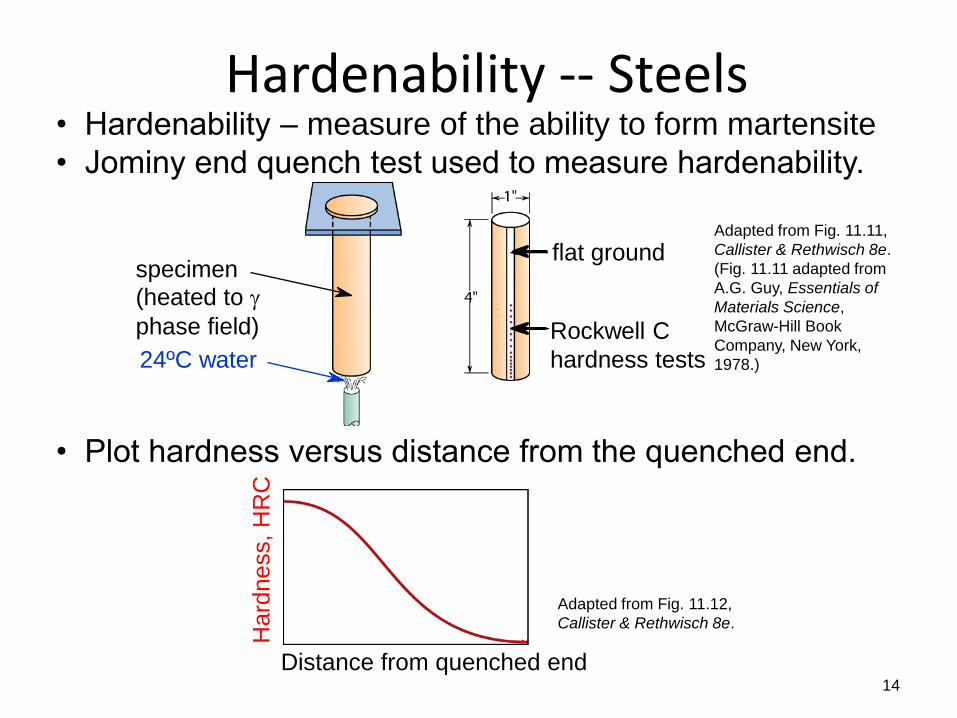
Hardenability -- Steels
14
• Hardenability – measure of the ability to form martensite
• Jominy end quench test used to measure hardenability.
• Plot hardness versus distance from the quenched end.
Adapted from Fig. 11.11,
Callister & Rethwisch 8e.
(Fig. 11.11 adapted from
A.G. Guy, Essentials of
Materials Science,
McGraw-Hill Book
Company, New York,
1978.)
Adapted from Fig. 11.12,
Callister & Rethwisch 8e.
24ºC water
specimen (heated to g
phase field)
flat ground
Rockwell C
hardness tests
Hard
ness,
HR
C
Distance from quenched end

15
Reason Why Hardness Changes with Distance
• The cooling rate decreases with distance from quenched end.
Adapted from Fig. 11.13, Callister &
Rethwisch 8e. (Fig. 11.13 adapted from H.
Boyer (Ed.) Atlas of Isothermal
Transformation and Cooling
Transformation Diagrams, American
Society for Metals, 1977, p. 376.)
distance from quenched end (in) Hard
ne
ss, H
RC
20
40
60
0 1 2 3
600
400
200 A M
0.1 1 10 100 1000
T(ºC)
M(start)
Time (s)
0
0%
100%
M(finish)

Hardenability vs Alloy Composition
16
• Hardenability curves for
five alloys each with,
C = 0.4 wt% C
• "Alloy Steels" (4140, 4340, 5140, 8640)
-- contain Ni, Cr, Mo
(0.2 to 2 wt%)
-- these elements shift
the "nose" to longer times
(from A to B)
-- martensite is easier
to form
Adapted from Fig. 11.14, Callister &
Rethwisch 8e. (Fig. 11.14 adapted from
figure furnished courtesy Republic Steel
Corporation.)
Cooling rate (ºC/s)
Ha
rdn
ess, H
RC
20
40
60
10 0 20 30 40 50 Distance from quenched end (mm)
2 10 100 3
4140
8640
5140
50
80
100
%M 4340
T(ºC)
10 -1
10 10 3
10 5 0
200
400
600
800
Time (s)
M(start)
M(90%)
B A
TE

17
Influences of Quenching Medium & Specimen Geometry
• Effect of quenching medium:
Medium
air
oil
water
Severity of Quench
low
moderate
high
Hardness
low
moderate
high
• Effect of specimen geometry:
When surface area-to-volume ratio increases:
-- cooling rate throughout interior increases
-- hardness throughout interior increases
Position
center
surface
Cooling rate
low
high
Hardness
low
high

18
Precipitation Hardening
0 10 20 30 40 50 wt% Cu
L a+L a
a+q q
q+L
300
400
500
600
700
(Al)
T(ºC)
composition range available for precipitation hardening
CuAl2
A
Adapted from Fig. 11.24, Callister & Rethwisch 8e.
(Fig. 11.24 adapted from J.L. Murray, International
Metals Review 30, p.5, 1985.)
• Particles impede dislocation motion.
• Ex: Al-Cu system
• Procedure:
Adapted from Fig.
11.22, Callister &
Rethwisch 8e.
-- Pt B: quench to room temp.
(retain a solid solution)
-- Pt C: reheat to nucleate
small q particles within
a phase. • Other alloys that precipitation
harden: • Cu-Be
• Cu-Sn
• Mg-Al
Temp.
Time
-- Pt A: solution heat treat
(get a solid solution)
Pt A (sol’n heat treat)
B
Pt B
C
Pt C (precipitate q)

19
Influence of Precipitation Heat Treatment on TS, %EL
• 2014 Al Alloy:
• Maxima on TS curves.
• Increasing T accelerates
process.
Adapted from Fig. 11.27, Callister & Rethwisch 8e. (Fig. 11.27 adapted from Metals Handbook:
Properties and Selection: Nonferrous Alloys and Pure Metals, Vol. 2, 9th ed., H. Baker (Managing
Ed.), American Society for Metals, 1979. p. 41.)
precipitation heat treat time
tensile
str
ength
(M
Pa
)
200
300
400
100 1min 1h 1day 1mo 1yr
204ºC 149ºC
• Minima on %EL curves.
%E
L (
2 in s
am
ple
) 10
20
30
0 1min 1h 1day 1mo 1yr
204ºC 149ºC
precipitation heat treat time