issues in whole district implementation - paths® … · issues in whole district implementation...
TRANSCRIPT

Issues in Whole District
Implementation
Paul A. LeBuffe, M.A.
Devereux Center for Resilient Children
Villanova, PA
Presented at the Ninth International
PATHS Conference
May 15, 2014
Devereux Center for Resilient Children
(DCRC)
Our mission is to promote social and
emotional development, foster resilience,
and build skills for school and life success in
all children from birth through school-age, as
well as to promote the resilience of the
adults who care for them.
Today’s Objectives
1. Identify common barriers to conducting
implementation and outcome evaluations of
SEL programs
2. Describe ways to address potential barriers to
measuring implementation fidelity
3. Describe ways to enhance outcome evaluation
during and following the implementation of an
SEL program
Today’s Objectives
1. Paul – Use of formative and summative
evaluation to inform PATHS delivery and
provide accountability
2. Sandra –
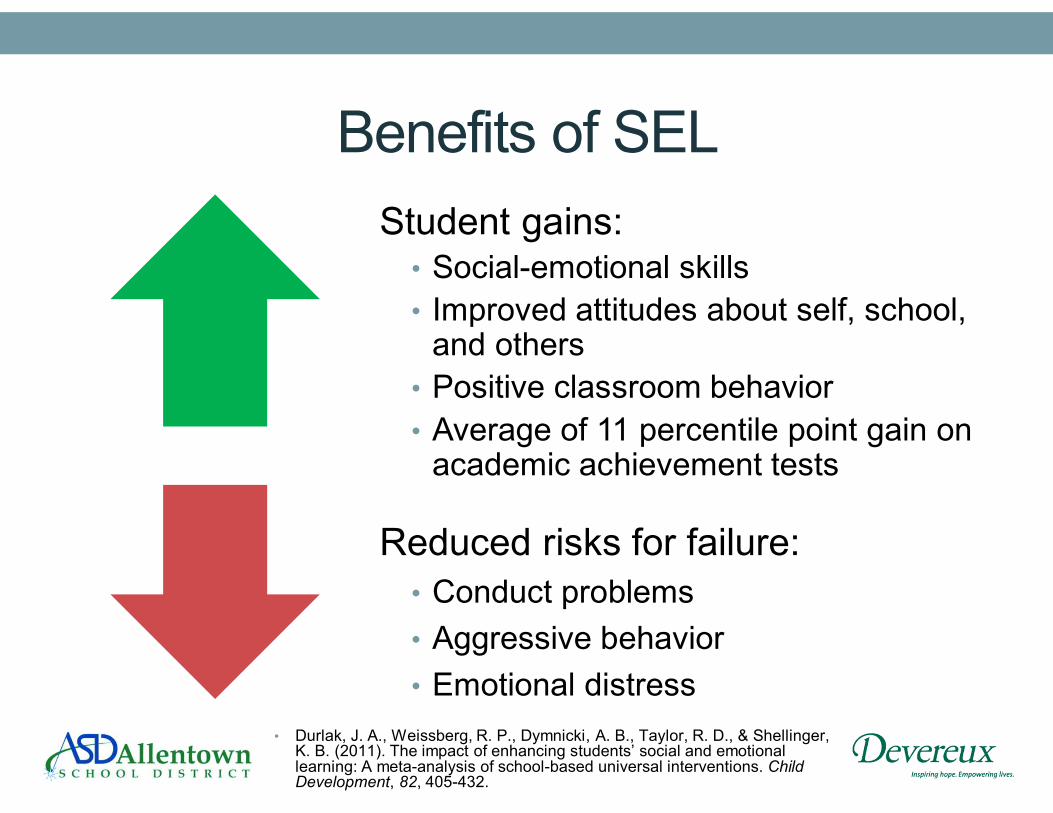
Benefits of SEL
• Durlak, J. A., Weissberg, R. P., Dymnicki, A. B., Taylor, R. D., & Shellinger, K. B. (2011). The impact of enhancing students’ social and emotional learning: A meta-analysis of school-based universal interventions. Child Development, 82, 405-432.
Student gains:• Social-emotional skills
• Improved attitudes about self, school, and others
• Positive classroom behavior
• Average of 11 percentile point gain on academic achievement tests
Reduced risks for failure:
• Conduct problems
• Aggressive behavior
• Emotional distress
Need to Assess Implementation
• To have their desired impact, SEL programs need to be
delivered accurately and with sufficient intensity.
• “The most effective intervention will not produce positive
effects if it is not implemented. Thus, assessments of
performance are a critical component of implementation.”• Fixsen, D. L., Naoom, S. F., Blase, K. A., Friedman, R. M. & Wallace, F. (2005).
Implementation Research: A Synthesis of the Literature. Tampa, FL: University of
South Florida, Louis de la Parte Florida Mental Health Institute, The National
Implementation Research Network (FMHI Publication #231).
Evaluation is Essential
• Regular and ongoing evaluation of practices and
outcomes is an essential component of SEL.
• “Effective SEL programming…Incorporates continuing
evaluation and improvement. It continues gathering data
to assess progress, ensure accountability, and shape
program improvement.”• Collaborative for Academic, Social, and Emotional Learning. (2003). Safe and
sound: An educational leader’s guide to evidence-based social and emotional
learning (SEL) programs. Chicago, IL: Author.

But what barriers may we face and how
do we overcome them?
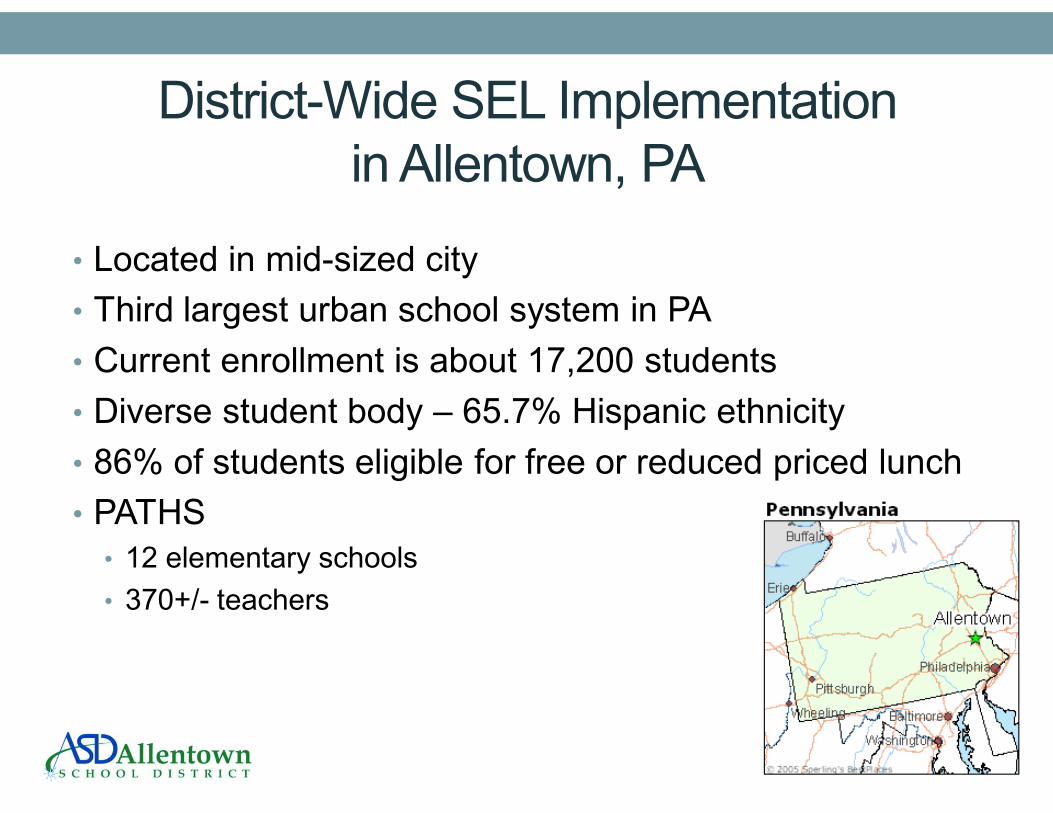
District-Wide SEL Implementation
in Allentown, PA
• Located in mid-sized city
• Third largest urban school system in PA
• Current enrollment is about 17,200 students
• Diverse student body – 65.7% Hispanic ethnicity
• 86% of students eligible for free or reduced priced lunch
• PATHS
• 12 elementary schools
• 370+/- teachers

Allentown’s Social-Emotional
Learning Initiative (2011-2014)
• Elementary Schools:
• Promoting Alternative Thinking Strategies (PATHS) curriculum
being delivered in pre-K through 5th grade classrooms in 12
schools
• Middle Schools:
• Second Step curriculum being delivered in 6th through 8th grade
classrooms in 4 middle schools
• DCRC’s role is to monitor implementation fidelity and
evaluate the impact of the initiative

Challenge #1: Ensuring commitment
and clear communication for
evaluation efforts

Challenge #1: Commitment and
Communication
• SEL programming needs to be a school and district
priority
• Strong leadership is essential to the success of SEL –
from the district administrators through school
administrators
• Commitment must be made from the start to collect and
utilize implementation and outcome data
• This commitment must be clearly communicated to all
school staff consistently and regularly

Formed a District Steering Committee
• Formed district SEL leadership team with representation
from the district (administrators, principals), PATHS,
Second Step, and DCRC
• Responsible for overseeing, guiding, and supporting the initiative
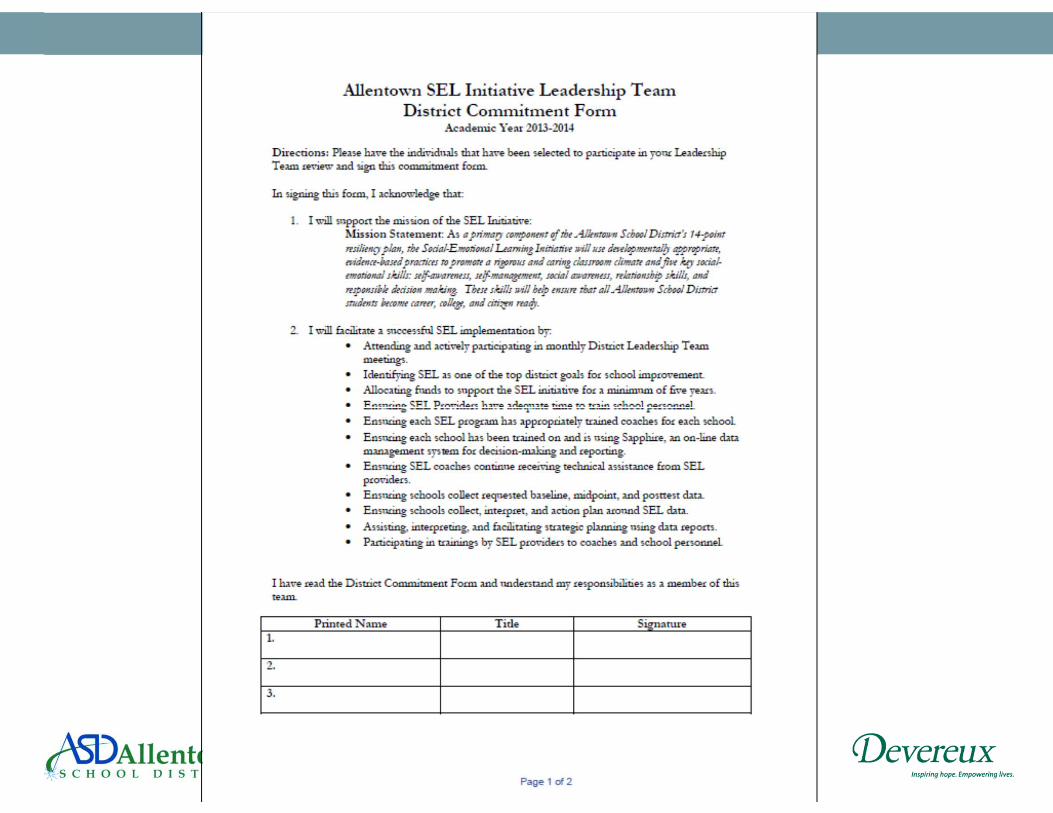
• Developed a District Commitment Form
• Included within was commitment to collecting, reviewing, and planning
with implementation and outcome data
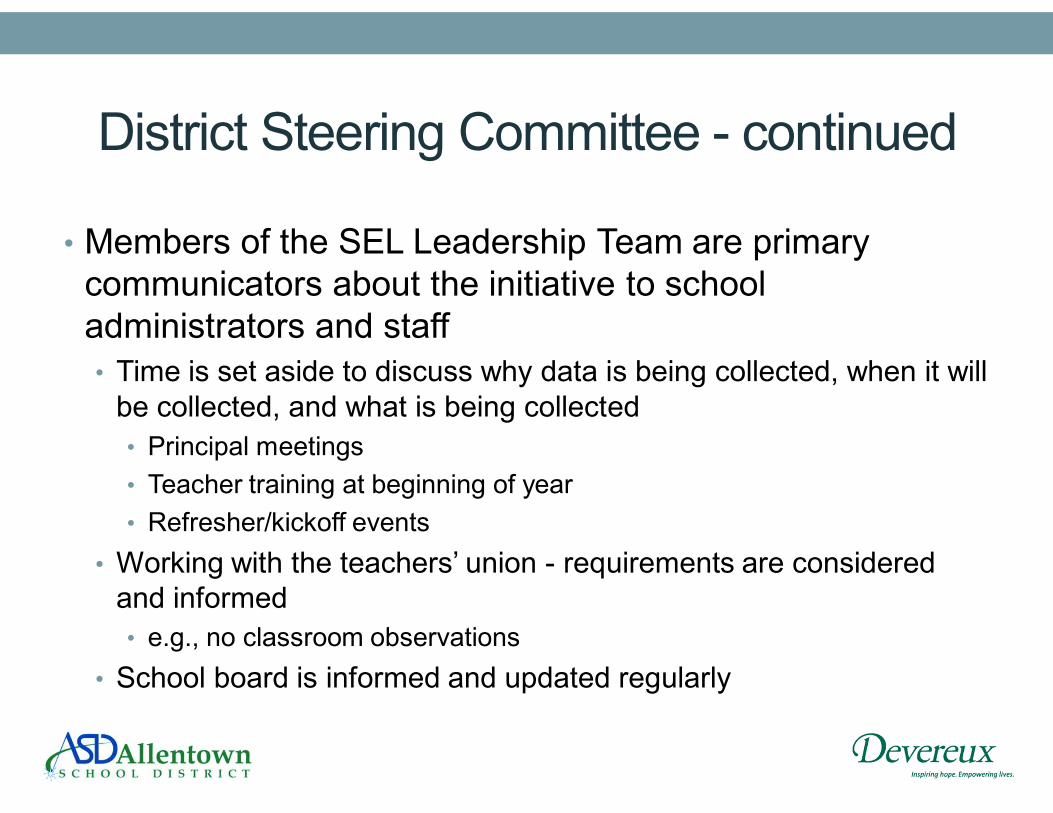
District Steering Committee - continued
• Members of the SEL Leadership Team are primary
communicators about the initiative to school
administrators and staff
• Time is set aside to discuss why data is being collected, when it will
be collected, and what is being collected
• Principal meetings
• Teacher training at beginning of year
• Refresher/kickoff events
• Working with the teachers’ union - requirements are considered
and informed
• e.g., no classroom observations
• School board is informed and updated regularly
Challenge #1: Developing an
evaluation plan
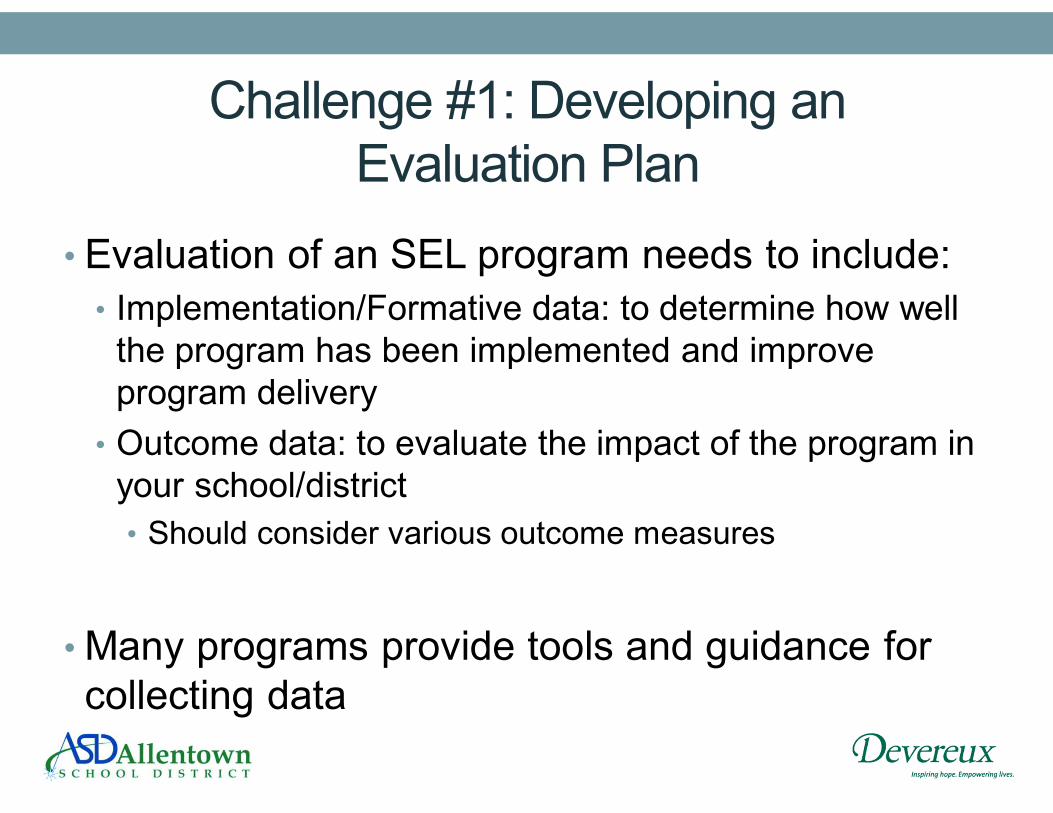
Challenge #1: Developing an
Evaluation Plan
• Evaluation of an SEL program needs to include:
• Implementation/Formative data: to determine how well
the program has been implemented and improve
program delivery
• Outcome data: to evaluate the impact of the program in
your school/district
• Should consider various outcome measures
• Many programs provide tools and guidance for
collecting data
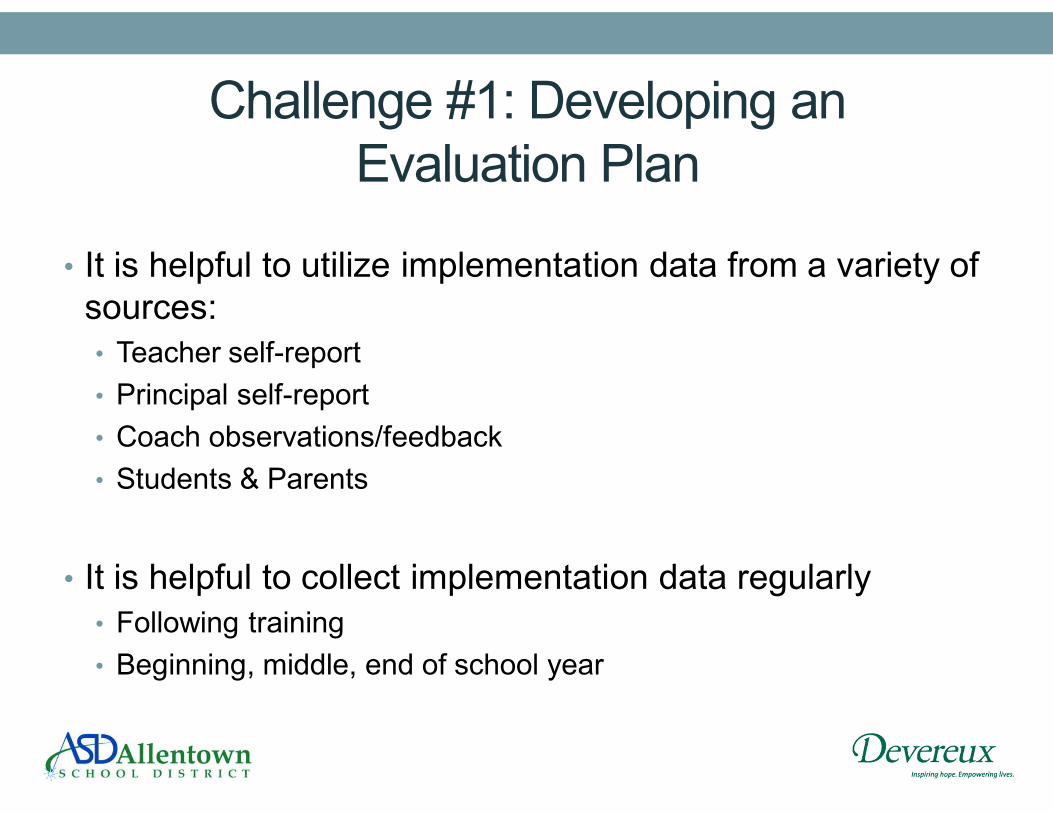
Challenge #1: Developing an
Evaluation Plan
• It is helpful to utilize implementation data from a variety of
sources:
• Teacher self-report
• Principal self-report
• Coach observations/feedback
• Students & Parents
• It is helpful to collect implementation data regularly
• Following training
• Beginning, middle, end of school year
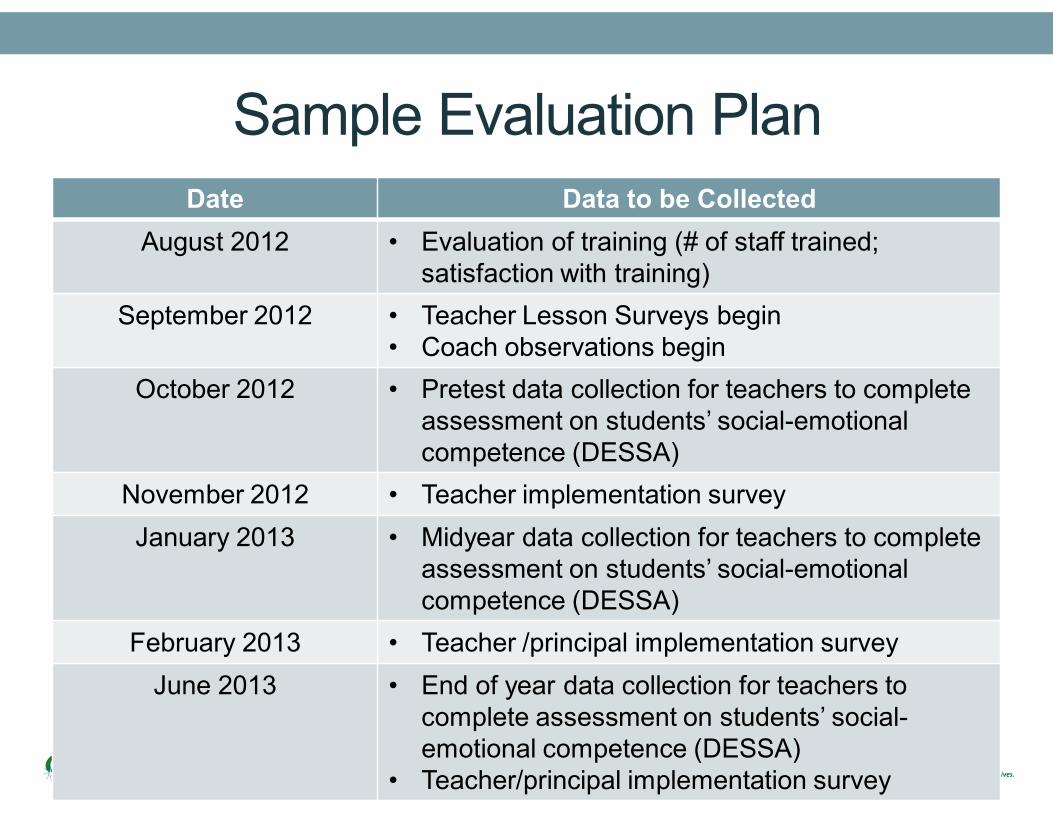
Sample Evaluation Plan
Date Data to be Collected
August 2012 • Evaluation of training (# of staff trained;
satisfaction with training)
September 2012 • Teacher Lesson Surveys begin
• Coach observations begin
October 2012 • Pretest data collection for teachers to complete
assessment on students’ social-emotional
competence (DESSA)
November 2012 • Teacher implementation survey
January 2013 • Midyear data collection for teachers to complete
assessment on students’ social-emotional
competence (DESSA)
February 2013 • Teacher /principal implementation survey
June 2013 • End of year data collection for teachers to
complete assessment on students’ social-
emotional competence (DESSA)
• Teacher/principal implementation survey
Challenge #3: Ensuring staff time and
resources are available for data
collection

Challenge #3: Ensuring Staff Time
and Resources
• Teachers have many demands placed them
• Periodic surveys and assessments may not be prioritized
by school administration
• Districts may face difficulties in getting high teacher data
completion rates
• Without high rates of completion, it’s difficult to accurately measure
implementation fidelity
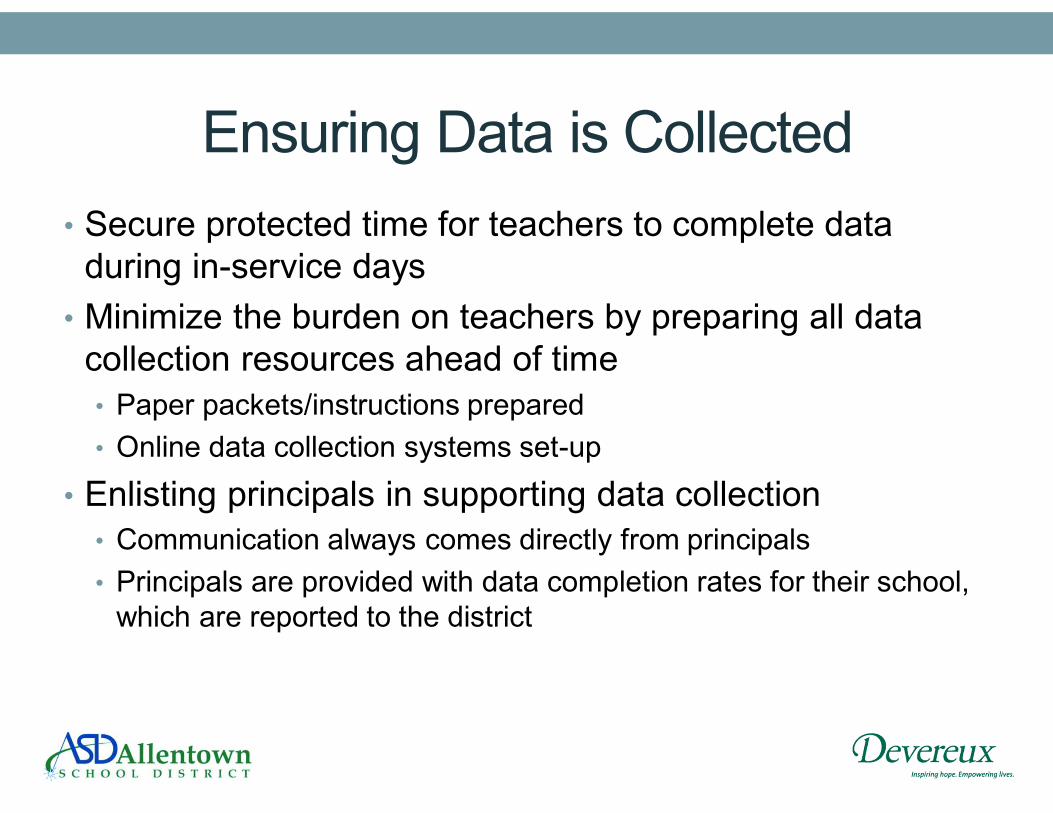
Ensuring Data is Collected
• Secure protected time for teachers to complete data
during in-service days
• Minimize the burden on teachers by preparing all data
collection resources ahead of time
• Paper packets/instructions prepared
• Online data collection systems set-up
• Enlisting principals in supporting data collection
• Communication always comes directly from principals
• Principals are provided with data completion rates for their school,
which are reported to the district
Ensuring Data is Collected
• Reminders as to why data is being collected (instruction
letter)
• “Thank you to all preK-5th grade teachers for your hard work with
the PATHS program this year! We’ve had a very successful year
due to your continued dedication, support, and excellent
implementation of PATHS. To wrap up the year, we have one last
round of data collection. Your participation is very important and
will allow us to evaluate the impact of the initiative on students’
social-emotional competence and behaviors targeted by the
PATHS program. It will also help us plan for next year. We truly
appreciate your time in completing these measures. Time has been
set aside for you to complete the forms on Tuesday, June 18.
Please have all forms completed by the end of that day.”
Ensuring Data is Collected
• Thanking teachers at every opportunity
• Data collection instructions and email communication
• Providing incentives during data collection (bagels, sheet cakes)
• Rewarding teachers who completed 80% or more of their data
throughout the school year (PATHS bags)
Challenge #2: Reporting and using
the data
Challenge #2: Reporting and Using Data
• Collected data will not be useful unless it is compiled,
interpreted and reported in an easy to understand format
• Sensitive to time limitations and limited data analysis and
interpretation skills
• Once data is compiled, structures must be in place to
ensure data is reviewed and used to enhance program
implementation
• Feedback has to be provided to data providers
• Has to be timely to be effective

District Data Sharing Policy
• Developed a data sharing policy with the district
1. DCRC will never share data at the individual teacher level and
will not share identifying information (e.g., teacher names) when
reporting data to ASD.
2. DCRC will share both completion totals and content of district
level data with the SEL Leadership Team and schools.
3. DCRC will only share completion totals of school level data
(not content) with the SEL Leadership Team.
4. DCRC will share completion totals and content of school level
data with only that school. School level data will not be shared
with other schools or with the Leadership Team. If a principal,
when reviewing completion totals, requests the names of
teachers who did not complete assessments or surveys, DCRC
will provide that information.

Reporting Implementation Data
• Three examples:
• Lesson Pacing
• Coach observation feedback
• Teacher feedback

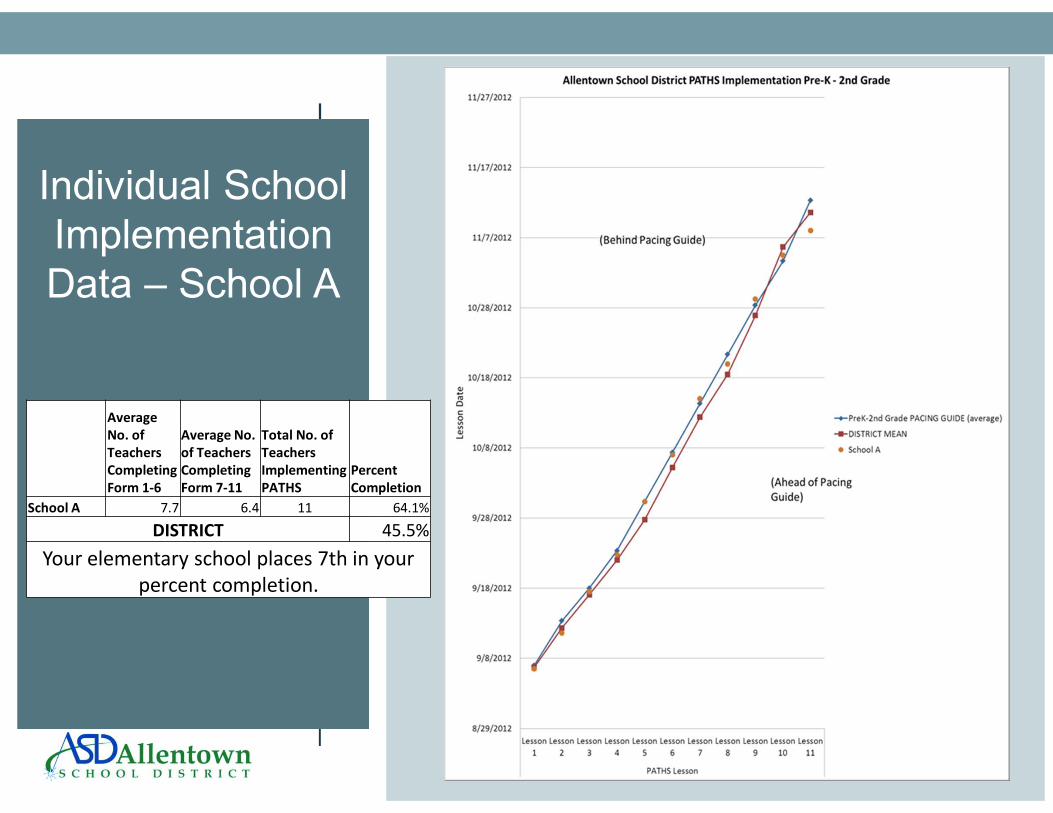
Individual School
Implementation
Data – School A
Average
No. of
Teachers
Completing
Form 1-6
Average No.
of Teachers
Completing
Form 7-11
Total No. of
Teachers
Implementing
PATHS
Percent
Completion
School A 7.7 6.4 11 64.1%
DISTRICT 45.5%
Your elementary school places 7th in your
percent completion.

Implementation Survey Monkey
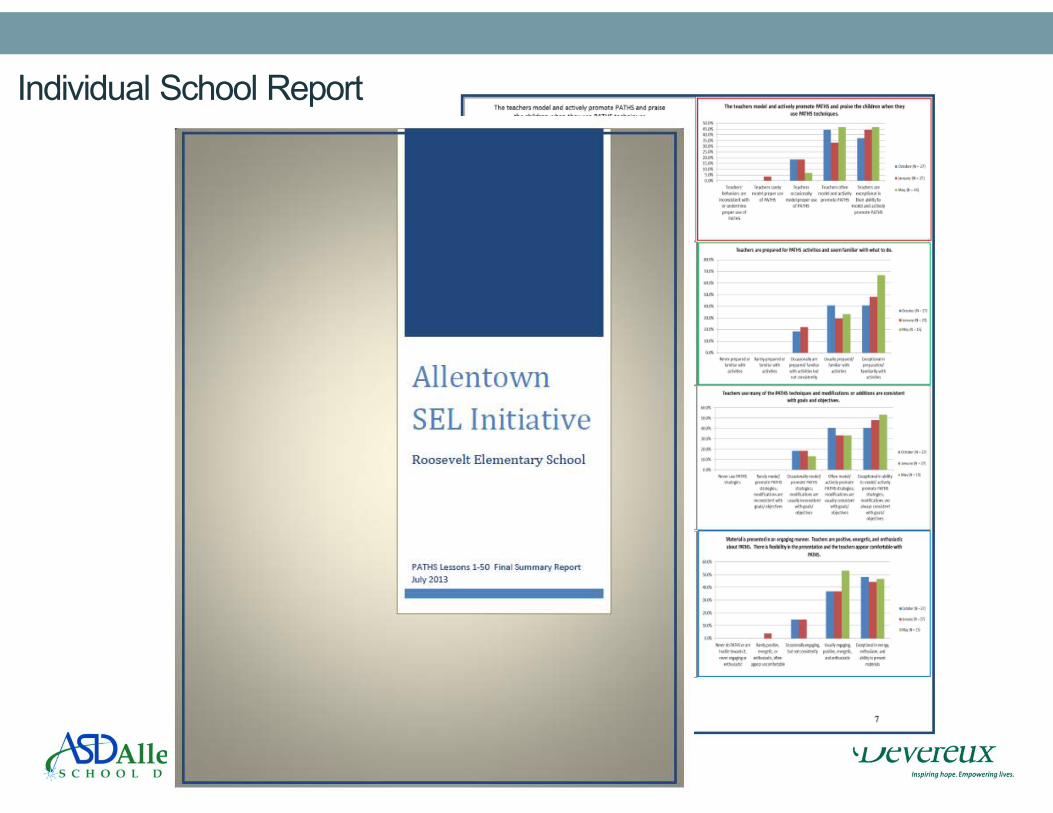
Individual School Report
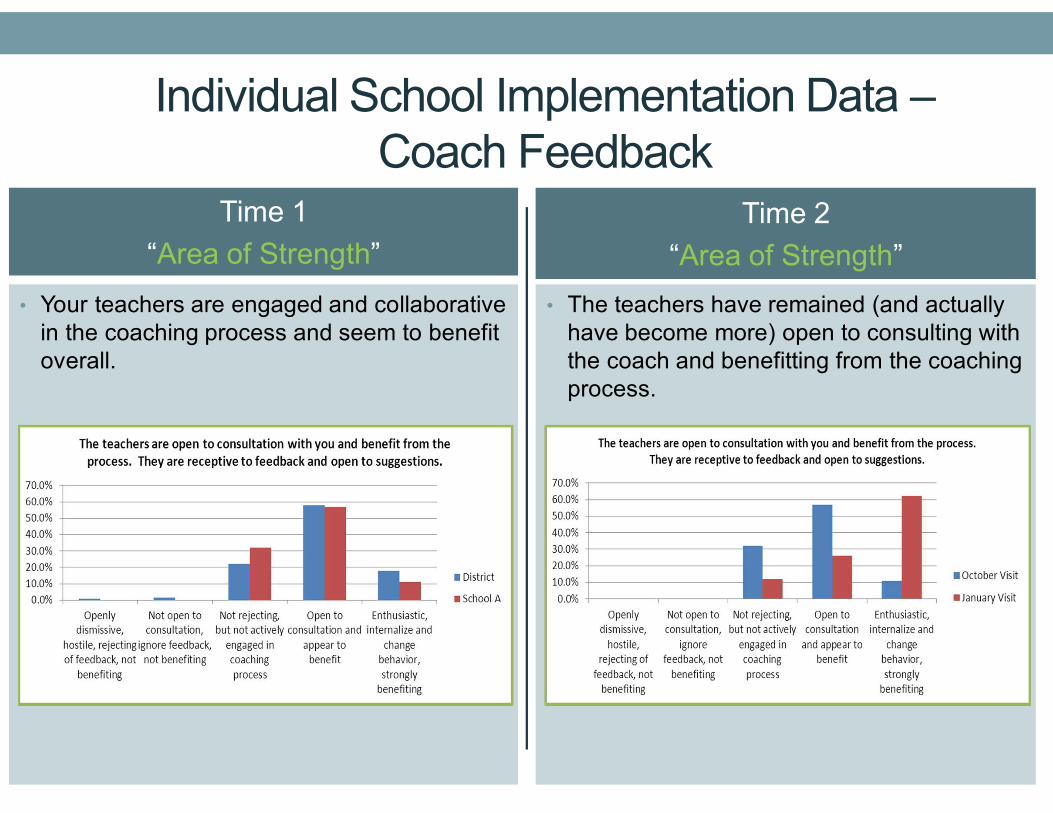
Individual School Implementation Data –
Coach FeedbackTime 1
“Area of Strength”
• Your teachers are engaged and collaborative
in the coaching process and seem to benefit
overall.
• The teachers have remained (and actually
have become more) open to consulting with
the coach and benefitting from the coaching
process.
Time 2
“Area of Strength”
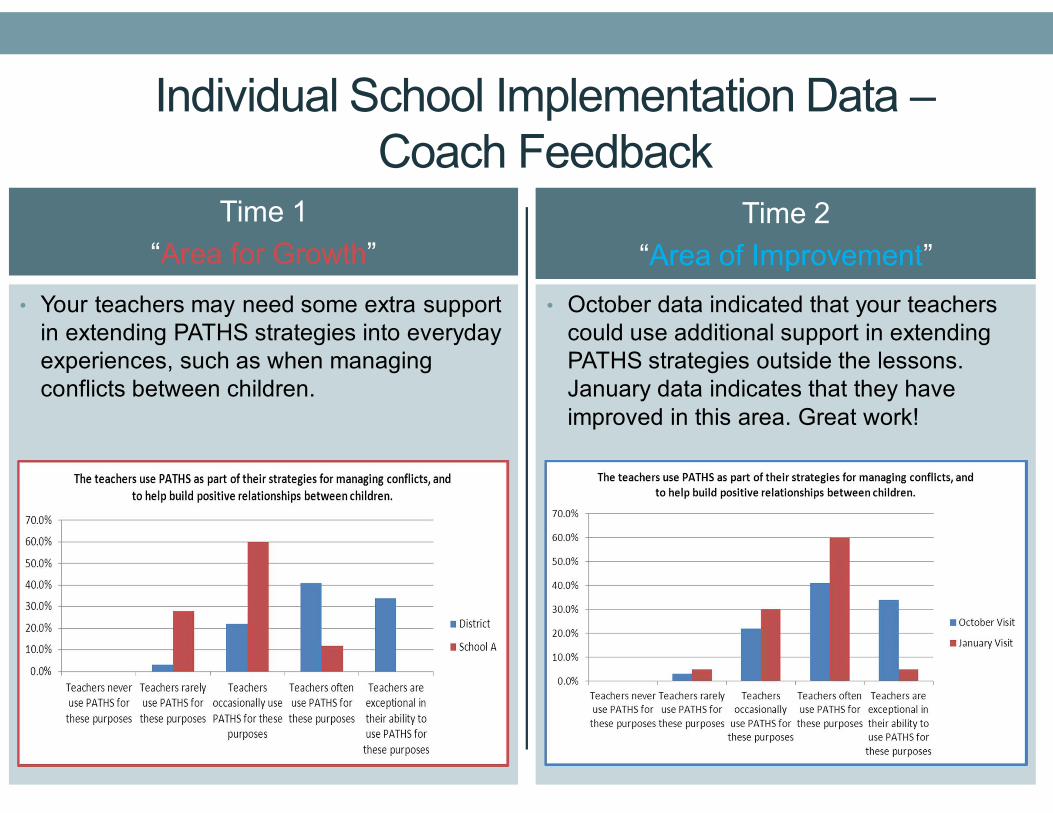
Individual School Implementation Data –
Coach FeedbackTime 1
“Area for Growth”
• Your teachers may need some extra support
in extending PATHS strategies into everyday
experiences, such as when managing
conflicts between children.
• October data indicated that your teachers
could use additional support in extending
PATHS strategies outside the lessons.
January data indicates that they have
improved in this area. Great work!
Time 2
“Area of Improvement”
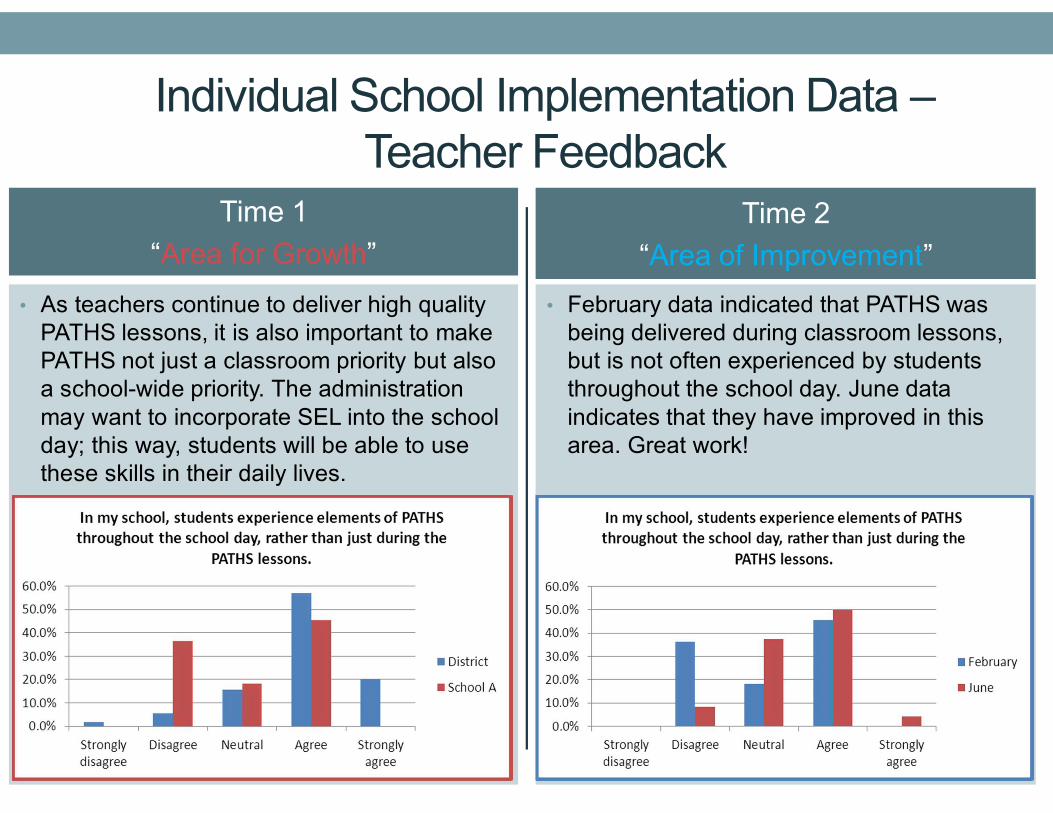
Individual School Implementation Data –
Teacher FeedbackTime 1
“Area for Growth”
• As teachers continue to deliver high quality
PATHS lessons, it is also important to make
PATHS not just a classroom priority but also
a school-wide priority. The administration
may want to incorporate SEL into the school
day; this way, students will be able to use
these skills in their daily lives.
• February data indicated that PATHS was
being delivered during classroom lessons,
but is not often experienced by students
throughout the school day. June data
indicates that they have improved in this
area. Great work!
Time 2
“Area of Improvement”
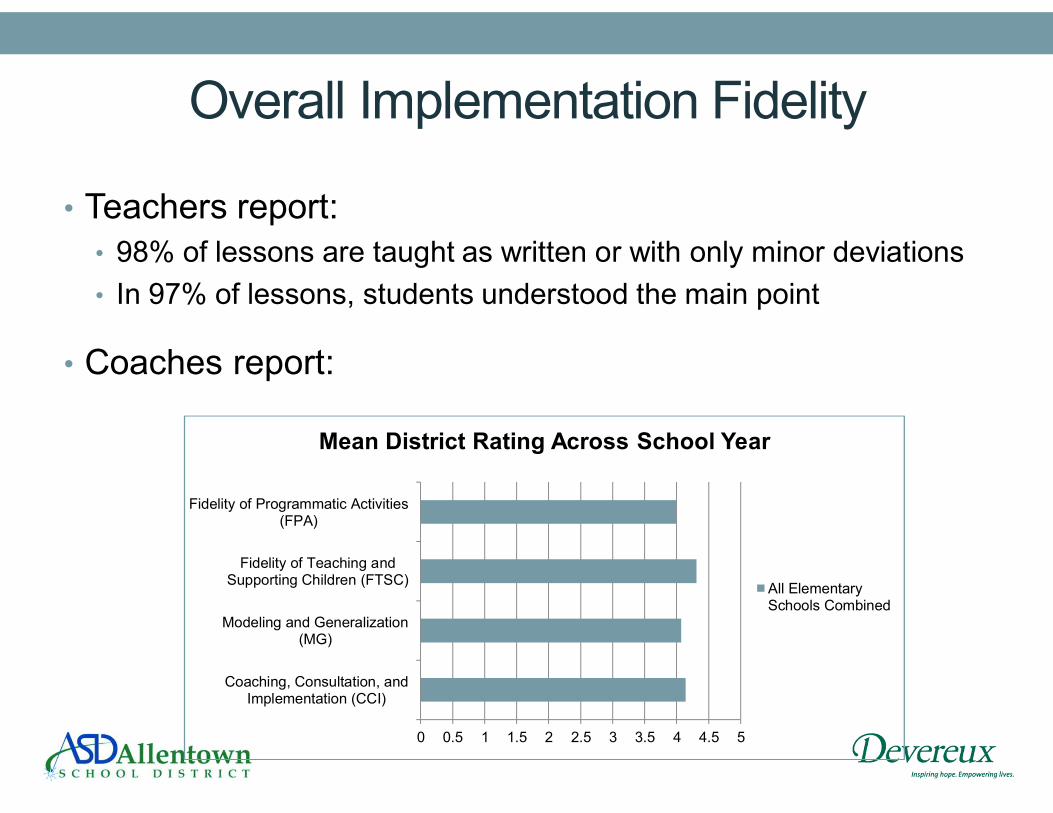
Overall Implementation Fidelity
• Teachers report:
• 98% of lessons are taught as written or with only minor deviations
• In 97% of lessons, students understood the main point
• Coaches report:
0 0.5 1 1.5 2 2.5 3 3.5 4 4.5 5
Coaching, Consultation, andImplementation (CCI)
Modeling and Generalization(MG)
Fidelity of Teaching andSupporting Children (FTSC)
Fidelity of Programmatic Activities(FPA)
Mean District Rating Across School Year
All ElementarySchools Combined
Using Implementation Data
• Formed school SEL teams with representation from
principals, assistant principals, counselors, and teachers
• Responsible for discussing how implementation is going and
reviewing implementation data
• Problem-solving any barriers to implementation or areas for
improvement
• This year, we are supporting teams in providing technical
assistance related to effective meeting structures and data-based
decision making (based on principles of PBIS)
Reporting Outcome Data
• Tips for reporting outcome data:
• Can be analyzed and reported in a variety of ways
• Statistical tests (ANOVAs, t-tests)
• Descriptives and frequency distributions
• Can be aggregated at a variety of levels
• District level
• School level
• Classroom level
• Individual child level
• How it is reported may be different depending on the audience
(principals, school board, funders, etc.)
• Stories are often as important as numbers
• Standardized measures
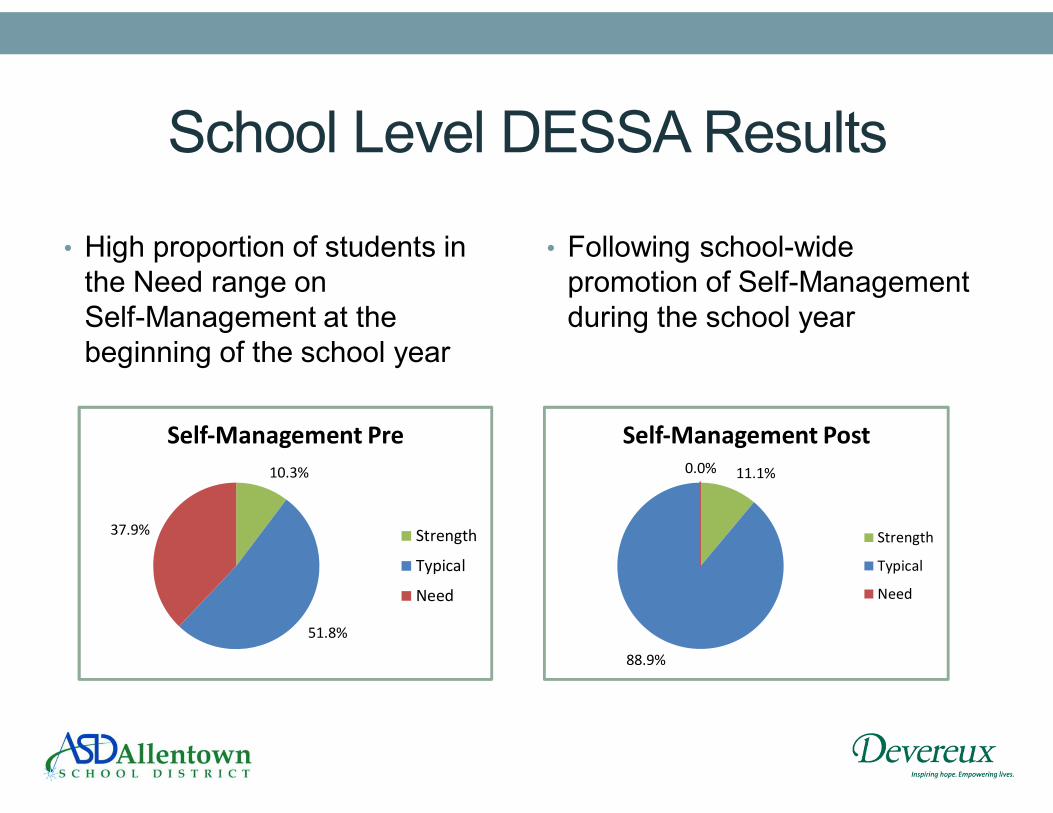
School Level DESSA Results
• High proportion of students in
the Need range on
Self-Management at the
beginning of the school year
• Following school-wide
promotion of Self-Management
during the school year
10.3%
51.8%
37.9%
Self-Management Pre
Strength
Typical
Need
11.1%
88.9%
0.0%
Self-Management Post
Strength
Typical
Need

Preschool DECA Results – Year 1
PreK Baseline
N = 70
Mean: 42.4
SD: 7.4
PreK End of Year
N = 70
Mean: 52.4
SD: 10.6
Significant change from pre to post: t (1, 69) = -12.09, p < .001
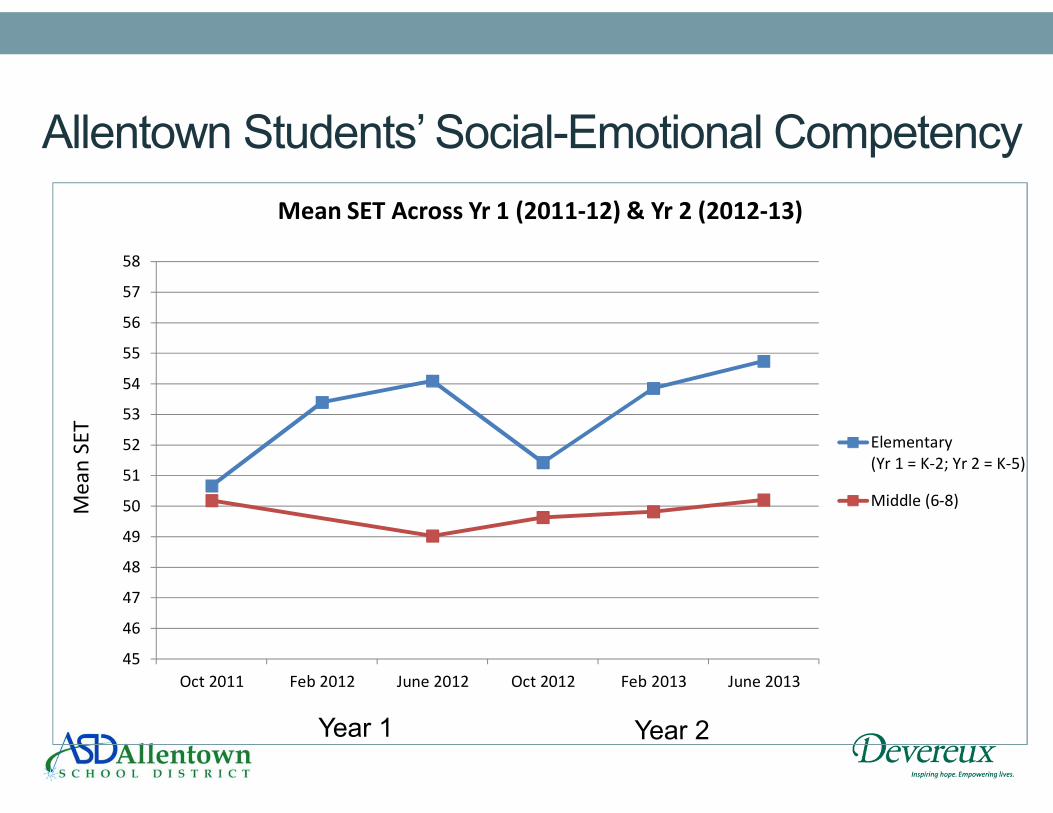
Allentown Students’ Social-Emotional Competency
Year 1 Year 2
45
46
47
48
49
50
51
52
53
54
55
56
57
58
Oct 2011 Feb 2012 June 2012 Oct 2012 Feb 2013 June 2013
Me
an
SE
T
Mean SET Across Yr 1 (2011-12) & Yr 2 (2012-13)
Elementary
(Yr 1 = K-2; Yr 2 = K-5)
Middle (6-8)
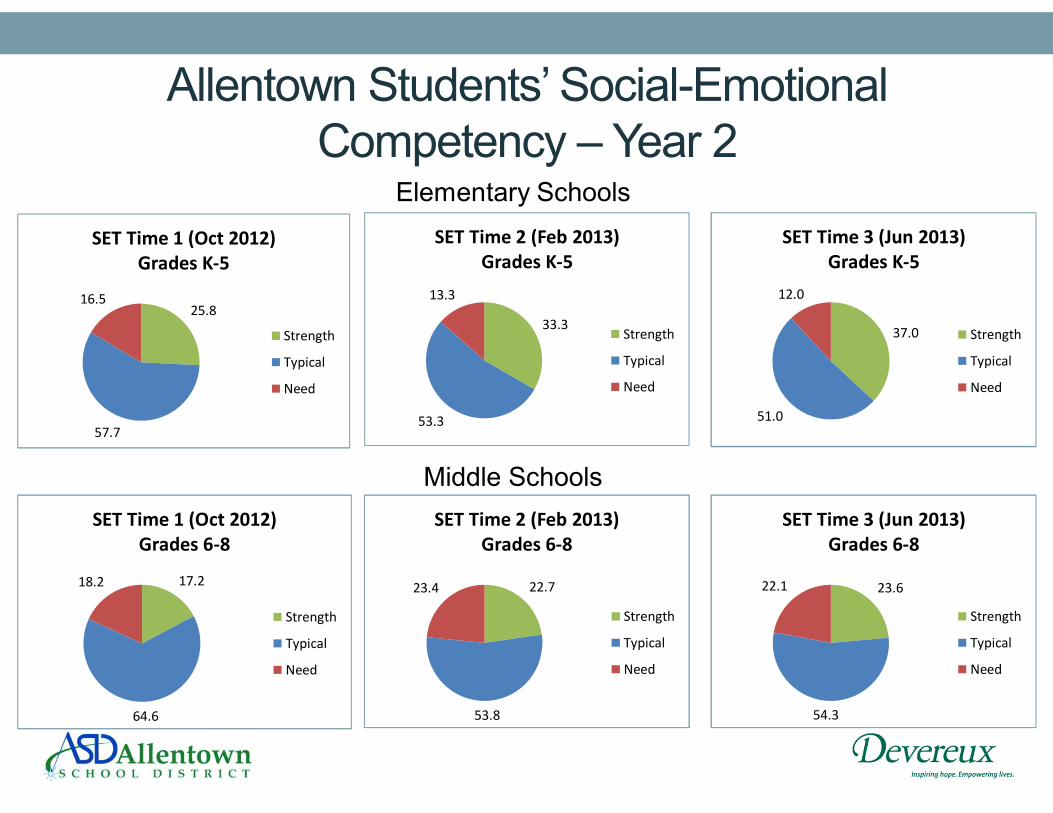
Allentown Students’ Social-Emotional
Competency – Year 2
25.8
57.7
16.5
SET Time 1 (Oct 2012)
Grades K-5
Strength
Typical
Need
33.3
53.3
13.3
SET Time 2 (Feb 2013)
Grades K-5
Strength
Typical
Need
37.0
51.0
12.0
SET Time 3 (Jun 2013)
Grades K-5
Strength
Typical
Need
17.2
64.6
18.2
SET Time 1 (Oct 2012)
Grades 6-8
Strength
Typical
Need
22.7
53.8
23.4
SET Time 2 (Feb 2013)
Grades 6-8
Strength
Typical
Need
23.6
54.3
22.1
SET Time 3 (Jun 2013)
Grades 6-8
Strength
Typical
Need
Middle Schools
Elementary Schools
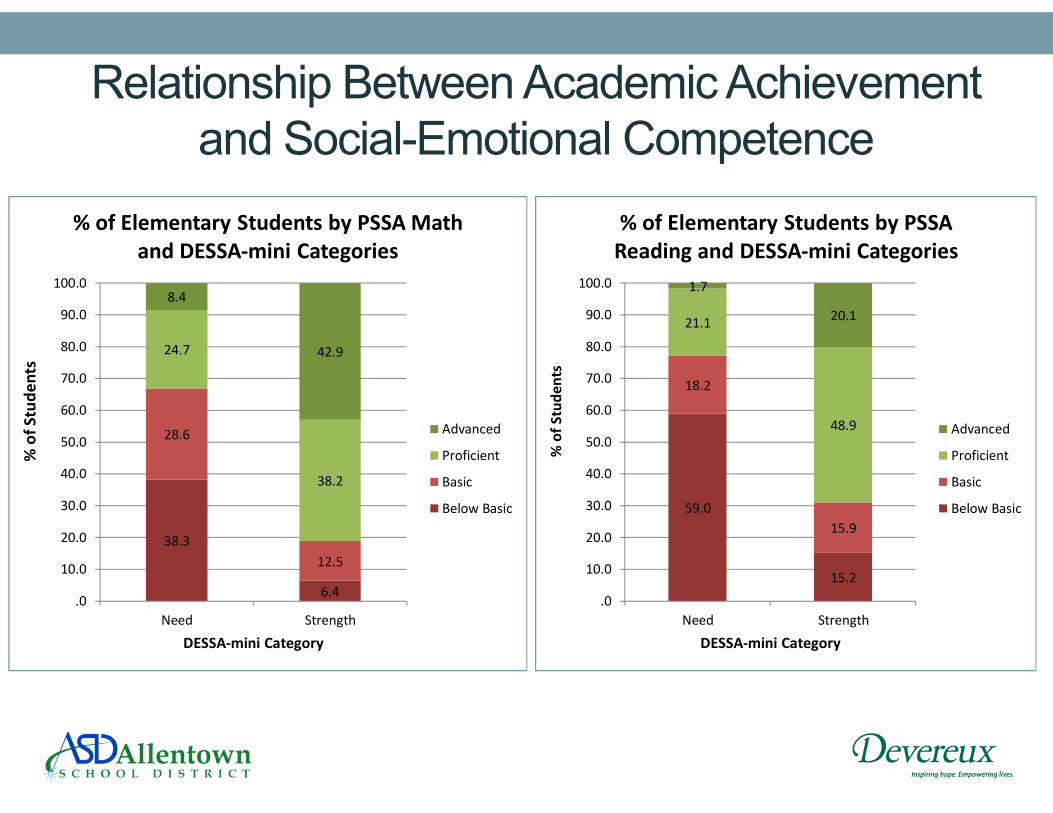
Relationship Between Academic Achievement
and Social-Emotional Competence
38.3
6.4
28.6
12.5
24.7
38.2
8.4
42.9
.0
10.0
20.0
30.0
40.0
50.0
60.0
70.0
80.0
90.0
100.0
Need Strength
% o
f S
tud
en
ts
DESSA-mini Category
% of Elementary Students by PSSA Math
and DESSA-mini Categories
Advanced
Proficient
Basic
Below Basic 59.0
15.2
18.2
15.9
21.1
48.9
1.7
20.1
.0
10.0
20.0
30.0
40.0
50.0
60.0
70.0
80.0
90.0
100.0
Need Strength
% o
f S
tud
en
ts
DESSA-mini Category
% of Elementary Students by PSSA
Reading and DESSA-mini Categories
Advanced
Proficient
Basic
Below Basic
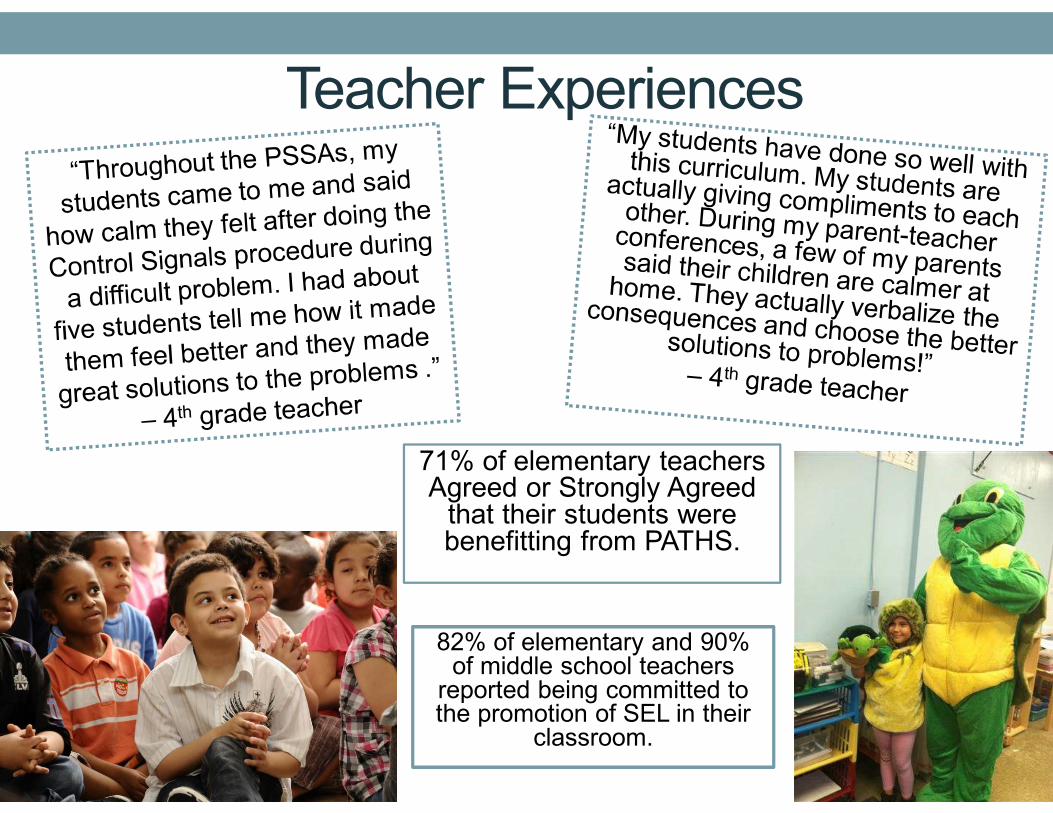
Teacher Experiences
71% of elementary teachers Agreed or Strongly Agreed
that their students were benefitting from PATHS.
82% of elementary and 90% of middle school teachers
reported being committed to the promotion of SEL in their
classroom.
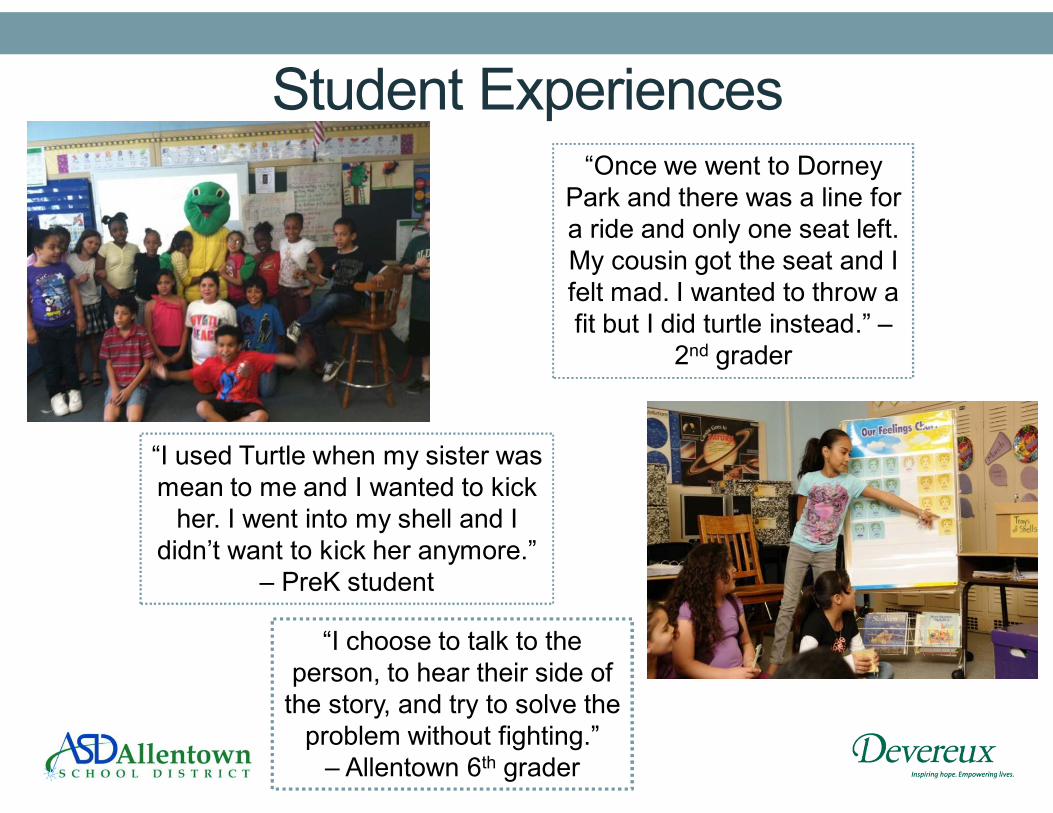
“Once we went to Dorney
Park and there was a line for
a ride and only one seat left.
My cousin got the seat and I
felt mad. I wanted to throw a
fit but I did turtle instead.” –
2nd grader
“I used Turtle when my sister was
mean to me and I wanted to kick
her. I went into my shell and I
didn’t want to kick her anymore.”
– PreK student
Student Experiences
“I choose to talk to the
person, to hear their side of
the story, and try to solve the
problem without fighting.”
– Allentown 6th grader

Challenge #5: Sustaining motivation
and showing appreciation
Challenge #5: Sustaining Motivation and
Showing Appreciation
• It may take several years to demonstrate the positive
effects in your own school or district
• Continued commitment and dedication to the programing
and data collection is essential
• Data collection fatigue may result, impacting the accuracy
of your findings

Showing Appreciation
• Teacher Appreciation Day – May 7
Dear Mrs. Wheeler,
On National Teacher Appreciation Day I want to thank you
for both your ongoing support and participation in the
Allentown School District SEL Initiative implementing
PATHS, but also for the wonderful work you do each day
to help strengthen and stretch the minds of
students. Each one of us is touched by teachers
throughout our lives. Your effort supports the intellectual
and social-emotional capacities of students today, and
into the future. This meaningful work that you take on
every day is appreciated. Thanks for all you do!
Sincerely,
Rebecca Guzie, PATHS Coach
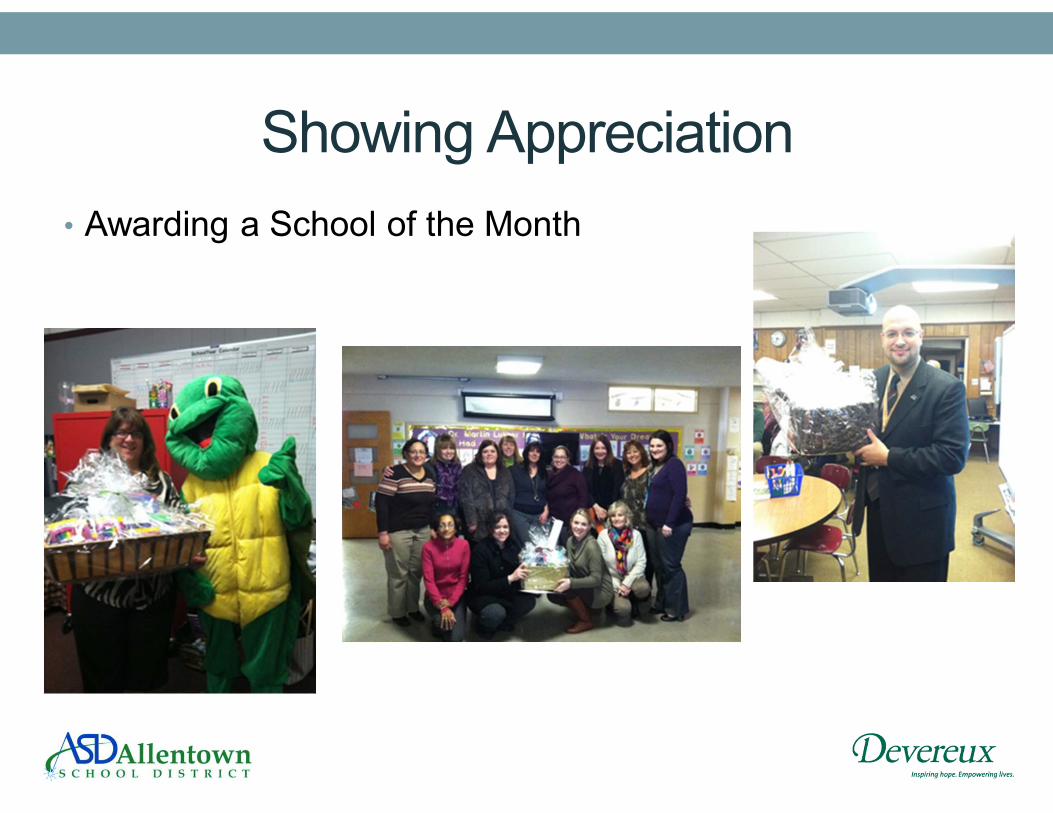
Showing Appreciation
• Awarding a School of the Month
Showing Appreciation
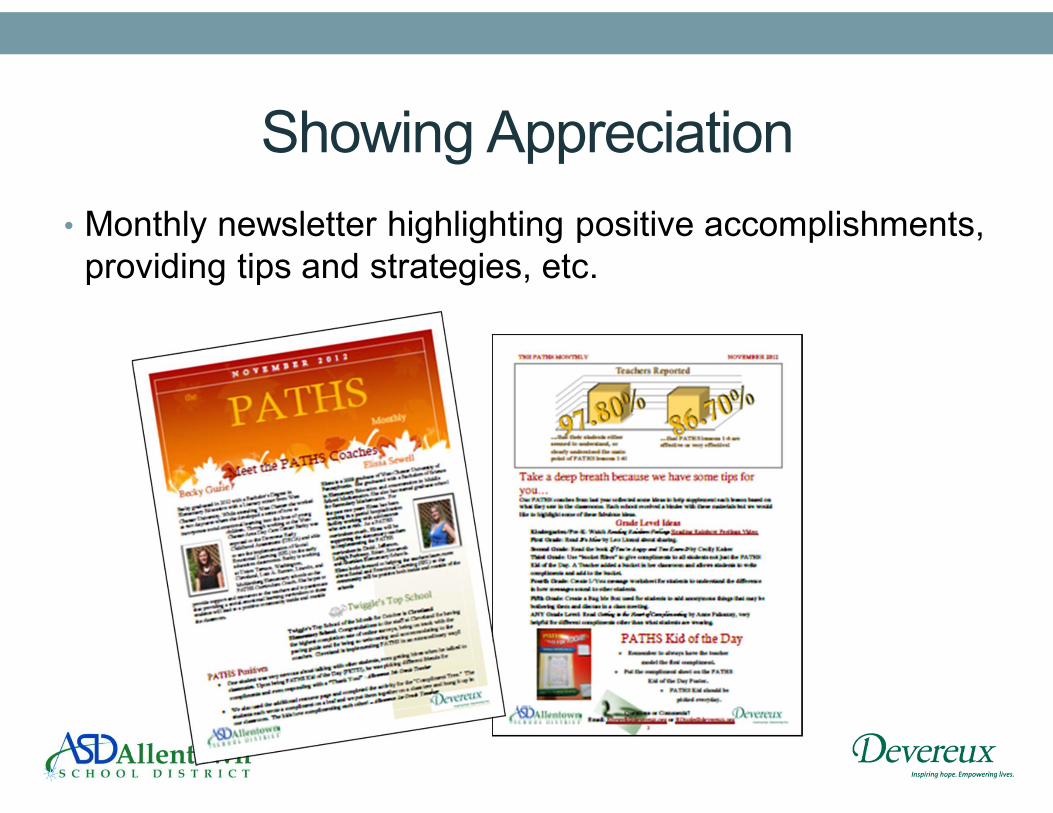
• Monthly newsletter highlighting positive accomplishments,
providing tips and strategies, etc.
Showing Appreciation
• Providing thank you notes to teachers and staff at end of
school year
• Providing a small gift at end of the school year to teachers
and administrators (notebooks)
• Sharing data and positive impacts found with all school
staff

QUESTIONS?
Contact Information
Paul LeBuffe
610-542-3090
Devereux Center for Resilient Children
www.CenterForResilientChildren.org