iso/tc8 - ships & marine technology …€¢ agreement dated 2002-06-20. main steps of a draft...
TRANSCRIPT

ISO/TC8 - SHIPS & MARINE TECHNOLOGY
“STRATEGIC STANDARDIZATION”(BUSINESS & REGULATORY IMPORTANCE)
ISO / TC8 SeminarMARINTEK
Trondheim, Norway 2006-06-08
CAPT Charles H. PiersallChairman, ISO/TC8

IMO ISO INDUSTRY
• REQUIREMENTS TRANSFORM • SHIPYARDS• REGULATIONS REQUIREMENTS • SUPPLIERS
TO • SHIP OWNERS/ INDUSTRY OPERATORS
STANDARDS &PROVIDE INDUSTRY
STANDARDS FOR CONSIDERATIONBY IMO, ILO, IAPH, WCO
ISO/TC8 - A LINKING INSTRUMENT

REQUIREMENTS FOR TODAY’S STANDARDS
• Management, systems based• Market driven• Universally accepted - “Standard of choice”• Timing and Timeliness• Developed concurrently with new technology• Focused on interchangeability and performance• Must define a product that can be manufactured,
installed, used, maintained and supported safely and efficiently at competitive cost

TIMING & TIMELINESS
• Timing -– You have to be there, be active, be accepted
and be known for delivering results• Timeliness
– You MUST deliver When the Customer Needs It
– “Business as usual” means failure- customer seeks another venue
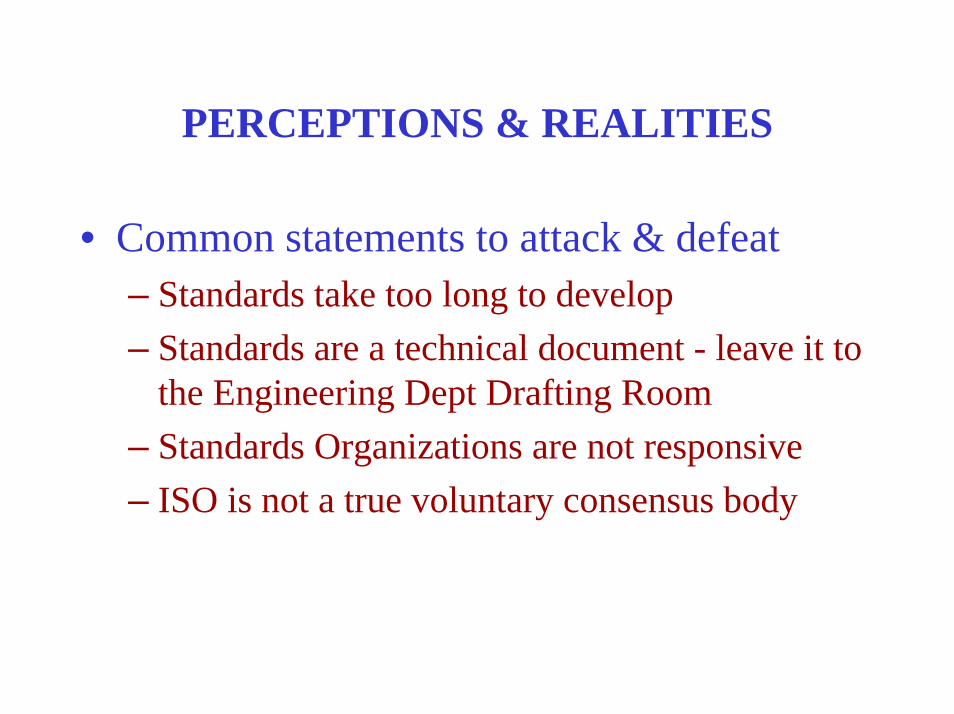
PERCEPTIONS & REALITIES
• Common statements to attack & defeat– Standards take too long to develop– Standards are a technical document - leave it to
the Engineering Dept Drafting Room– Standards Organizations are not responsive– ISO is not a true voluntary consensus body
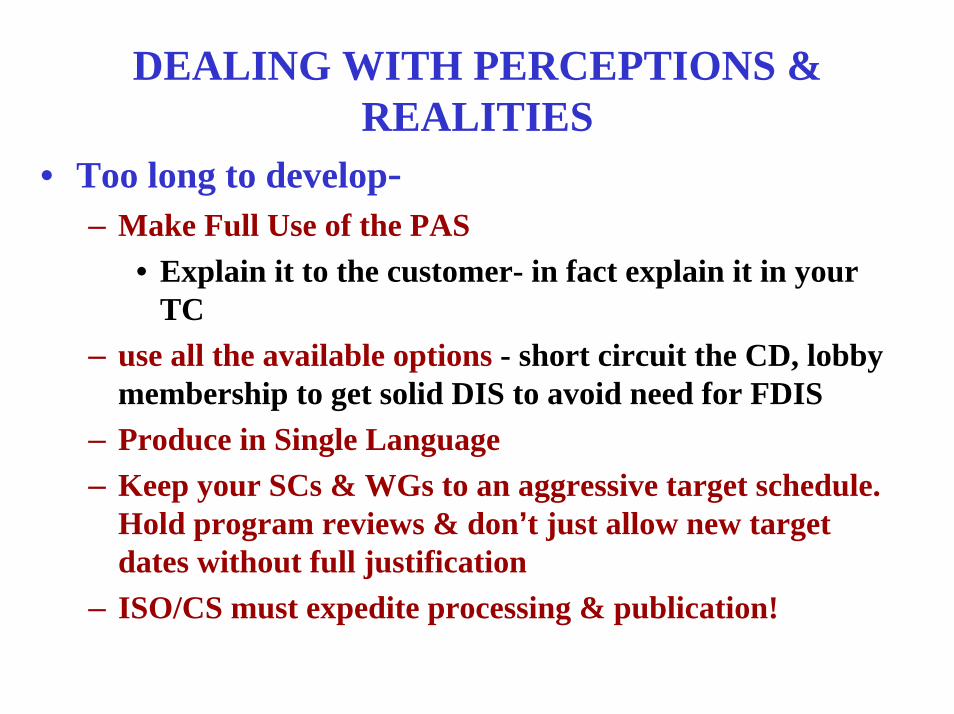
DEALING WITH PERCEPTIONS & REALITIES
• Too long to develop-– Make Full Use of the PAS
• Explain it to the customer- in fact explain it in your TC
– use all the available options - short circuit the CD, lobby membership to get solid DIS to avoid need for FDIS
– Produce in Single Language– Keep your SCs & WGs to an aggressive target schedule.
Hold program reviews & don’t just allow new target dates without full justification
– ISO/CS must expedite processing & publication!

DEALING WITH PERCEPTIONS & REALITIES (Continued)
• Standards are just a technical document– Explain “Strategic Standardization”
• To all your stakeholders• To your TC & SC Leadership
– Communicate with Top Executives in Government & Industry
• Educate your customers• Market your abilities• Publish articles in trade journals, etc.• Actively participate in seminars/conferences

STRATEGIC STANDARDIZATION
• Standardization is a Strategic Business Decision– more than a technical document
• Effective Market Tool– open new markets– reduce trade barriers– ensure company’s competitiveness
• If you are not participating in the standards process, your competitors are– influencing business issues– gaining competitive edge

DEALING WITH PERCEPTIONS & REALITIES (Continued)
• Standards Organizations are not responsive– Unfortunately there are examples, BUT
ISO has taken an aggressive forward looking strategy
• Program Management improvements & accountability,
• more use and understanding of IT, greater sensitivity to the Market requirements
• Develop and use a Business Plan, Operating Plan & Marketing Plan- This is standard business operating procedure -Format it for your use!!
• “Timing & Timeliness”!!!

ISO/TC8 STANDARDS ACTIVITY1947-1994 ------Equipment Standards1994-2001 ------Systems Standards2002-2010 ------ Safety, Security, Environment,
Information, Intermodal
PROACTIVE REACTIVE DORMANTWrite Industry Implement Do NothingStandards for Regulations Accept ActionsConsideration by of OthersRegulatory BodiesBEST SOLUTION UNACCEPTABLE

STATUS OF WORK PROGRAMME(ISO/TC8 N 1000)
• Comprehensive, “living” document, regularly updated which is the “official TC8” Working Status Document
• Subcommittee Status identified - published standards, registered work items, possible proposals for new work
• Work Items of Mutual Interest to IMO and ISO/TC8• Listing of IMO Resolutions• Index of ISO Standards Numbers referring to Work
Items• Allocation of Number of Work Item to Each TC8/SC

ISO/TC8 PARTNERSHIPS• IMO/IACS/IAPH Participate in ISO/TC8 Meetings• IMO/WCO/IACS/IAPH Active in ISO Subcommittees
and Working Groups• ISO Active in IMO Committees and Subcommittees
• ISO TC8 Strategic Alliance with ISO TC67 (Petroleum and natural gas industries)
• ISO TC8 Strategic Alliance with ISO TC104 (Freight Containers) on Freight Movement in Freight Containers

MARITIME & INTERMODAL SUPPLY CHAIN SECURITY PARTNERSHIPS
• ISO Active in IMO Maritime Security WG• ISO Active in ILO & IMO/ILO WG• ISO and WCO Collaborate on Data & Supply Chain
Security Standards• ISO Participates in IMO FAL (SPI) with IAPH
• ISO TC8 MoU with Strategic Council on Security Technology
• ISO TC8 Liaisons with ITN, WSC and BIMCO• ISO/TC8 Liaison with WCO

TC8 SUCCESSES• Working closely with the IMO we have
successfully been major reference in many IMO Codes & Conventions– Fire Protection; High Speed Craft; Other– SOLAS/MARPOL/STCW
• Requires continuing presence & participation with IMO Committees Subcommittees
• > 100 TC8 work items directly related to support IMO

TC8 SUCCESSES (Cont.)
• SUPPLY CHAIN SECURITY– ISO 28000 Series– ISO 20858 - Implementing IMO ISPS Code
• Maritime & Intermodal security initiative supporting IMO, Governments , Industry
• Similar Supply Chain Success with IAPH, WCO and ILO, Governments, Industry

WHAT IS ISO/PAS 28000?The management systems standard for Supply Chain Security An
overarching “tool” – Published 2005- 11- 15
A major initiative - industry and governmental cooperation
Provides requirements for establishing, implementing, maintaining and
improving a security management system for the supply chain
Applicable to a broad range of organizations
Risk based, follows 14001, the environmental management system
standard

OTHER DEVELOPMENTSISO / PAS 20858
– Published 2004; Uniform industry implementation of IMO’s ISPS Code
ISO / PAS 28001
– Assist industry in Best practices for custody in supply chain
– Consistent with WCO Framework of Standards; Being balloted
ISO 28003 - auditing/conformity assessment; Draft completed
ISO 28004
– Guidance for 28000 - Consensus achieved;
– Ready for Balloting
ISO 28005
– Electronic Port Clearance (EPC); Under development
– Computer –to - Computer data transmission

ISO ASSISTS IN IMPLEMENTATION
Assisting 5 Major Ports in implementing ISO
28000
ISO PAS 20858 being used as teaching tool for
developing nations in concert with the ISPS Code
Assisting Major Ports in implementing ISO 14001
(Environmental management systems standard)

IMO MSC # 81 - 2006-05• Passenger Ship Safety• Maritime Security• Goal-based Standards• Ship Design and Equipment• Bulk Liquids and Gases• Stability, Load-lines and Fishing Vessel Safety• Fire Protection• Formal Safety Assessment…...Potential New Work Items for ISO/TC8

SUMMARY
• International Linkages already well established– ISO Secretary General Assigned
Responsibility to ISO/TC8 as follows:• Principal Liaison to IMO - we attend all IMO
Committee and most SC meetings - for past 11 years, active member of Maritime Security WG
• ISO/TC8 Chair is designated ISO Rep to IAPH -for past 15 years
• ISO/TC8 Chair is ISO Rep to ILO for Maritime • ISO/TC8 is Principal Liaison to WCO

SUMMARY (Cont)
• ISO/TC8 has ongoing active collaboration with International Organizations in Shipping & Shipbuilding-
• ISO/TC8 is active participant in UN/ECE Committee on Water Transport
• ISO/TC8 actively working with EU leaders on “Intermodal and short sea shipping” to provide international standards for use by the EU
• ISO/TC8 presenting to APEC in Singapore

ADDITIONAL REFERENCE SLIDES

ISO/TC8 ADVISORY GROUPMEMBER BACKGROUND REQUIREMENTS• Industry - Shipping, Shipbuilding/Repair, Intermodal• Government- Port state, regulatory needs• Possess skills in:
– Strategic planning, business planning– Organizational planning and resource allocation– Business management – Program management– Business development and marketing– Information technology
• Facilitate the “linkage” to IMO• Appointment limited on basis to “balance expertise”•• NO STANDARDS EXPERTISE REQUIREDNO STANDARDS EXPERTISE REQUIRED

SUMMARY (Cont.)• Program Status Update Presented to
– IMO Maritime Safety Committee -December 2002
– IMO SOLAS Diplomatic Conference -December 2002
– IMO Facilitation Committee and Ship/Port Interface Working Group - January 2003
– Numerous U.S. and World Leaders• Active Participation with IMO in Development
of the ISPS Code

INTERNATIONAL RELATIONSHIPS
REGULATIONSREGULATIONS
ISO
UNITED NATIONS
RESOLUTIONS IMO
SOLASTC-8
PORT STATE &FLAG STATE
ADMINISTRATIONS
IACS
CSS
ABS
DnV
LLOYDS
IAPHShip-PortInterface
Group
OTHERS
SC1for
SOLAS(MSC)
SC2for
MARPOL(MEPC)
SC(__)for
OtherMatters
NATIONALSUPPLEMENTS
OTHER ISO TCs
e.g., TC28, TC67,TC70,TC92,
TC104, etc..

TC8/TC67 STRATEGIC ALLIANCE
• MoU SIGNED BY TC CHAIRS - 2000-09-11– DOES NOT MODIFY COMMITTEE SCOPES– FIRST SUCH AGREEMENT IN ISO HISTORY
• INSURES COOPERATION & PARTICPATION IN DRILLING & PRODUCTION FLOATING SYSTEMS– Hulls Basically TC8– Systems & Requirements TC67– FPSOs, FSUs, OSVs, ATBs
• TC8 CONTINUES AS PRINCIPAL INTERFACE WITH IMO

ISO TC8/TC104 STRATEGIC ALLIANCE
• MoU SIGNED BY THE TC CHAIRMEN– TC8 (Ships & Marine Technology)– TC104 (Freight Containers)
• Insures Active Cooperation & Participation with Each Other in Writing Standards to Insure a Seamless, “Intermodal” (Ships and Ship/Port Interface) Movement of Freight in Freight Containers
• ISO/TC8 Continues to Provide Principal ISO Interface with IMO
• Agreement Dated 2002-06-20

Main Main StepsSteps of a of a DraftDraft andand RequiredRequired ApprovalApprovalSpecial case: Publicly available specification (PAS)
JUSTIFICATION - Urgent market requirement
PROCEDURE
Review of a draft and acceptancefor
its publication as anISO/PAS
Review of a draft and acceptancefor
its publication as anISO/PAS
3 • Simple majority of P-members voting• Simple majority of P-members voting
• Recommendation from the Chairman (or the secretary)
• Recommendation from the Chairman (or the secretary)
Publication of a publicly availablespecification
Publication of a publicly availablespecification
NO DIS(Draft International Standard) VOTE
Addition of a work item onthe programme of work
Addition of a work item onthe programme of work
Preparation of a committee draft(ISO/CD)
Preparation of a committee draft(ISO/CD)
• Simple majority ofP-members voting
• Participation of at least5 members
• Simple majority ofP-members voting
• Participation of at least5 members
• Working group approval• Working group approval
1
2
6
Can Be Amended as Necessary at AnytimeAfter 3 years: review for reconfirmationAfter 6 years: transformation into an ISO standard or withdrawal

INTERNATIONAL STANDARDIZATION
“We cannot engage in a level playing field, equal trade, open up markets and get rid of trade barriers unless we harmonize standards”
An essential ingredient for achieving the “well-balanced optimum” of safer, secure and cleaner seas together with a prosperous maritime industry

SUMMARY (Cont.)
• The initiatives undertaken by ISO/TC8 in maritime and supply chain security are “inclusive”, not “exclusive”.
• The Maritime Industry is “International” -Regional or National solutions are not best interest of the industry.

Copyright © 2006 Marine Cybernetics
Marine Cybernetics and DNV HIL Presentation
Asgeir J. Sørensen2006-06-08
Vestre Rosten 77 NO-7075 Tiller, Norwaywww.marinecybernetics.comE-mail: [email protected]

ControllersSW
Products
Application solutions Remote
Services
Powersystems PC
MS Windows
I/O
Integrated systems
Testing
Configuration
Operational systems
Instrumentsand
sensors
Stand-alonesystems
Communicationnetworks
Internet
HMI
The Digital “Big Bang”
AUTOMATION

Industry Challenge – Background
Modern maritime machinery plants• Mechanical ship computer-based ship
• large number of computer control systems• Increased system complexity
• more and more integrated sub-systems• components delivered by different suppliers• complex in operation
Testing methods are lagging behind the system technology development!

Propulsion Layout (principle sketch)
D
M
SWB G DF

Industry Challenge
As a result of this development: • Need for more comprehensive testing,
but integrated systems are difficult to test • Failure situations are difficult to handle
HIL is a major step forward toward a better test regime and is part of DNV's increased focus on complex machinery systems

2006 © Marine Cybernetics
Marine Control SystemsDiesel-electrical systems
– Electric power generation and distribution
– Electrical propulsion– Electrical drives and
rotating machinery
Marine Control Systems– Machinery system– Ballast system– Loading system– Power management – Dynamic positioning
system– Autopilot– …
X TERMINALS
PLANT NETWORK
COMMUNICATION LINE TO SHOREPOS. REF. SYSTEMS
INTEGRATED VESSEL AUTOMATIONDYNAMIC POSITIONING
FIELDBUSNETWORK
ENGINECONTROL
TUNNELTHRUSTERS
DRIVES
MAIN POWER GENERATION& DISTRIBUTION
PROPULSION/POD
CONTROLNETWORK
AUX POWER GENERATION& DISTRIBUTION

2006 © Marine Cybernetics
Examples of findings fromDP-HIL Safety and Performance Testing• Sensors
– Single VRU failure caused simultaneous loss of all position reference systems– Wind sensor failure caused loss of position. Too little time for DP operator to react after
warning and eventually alarm was given.– Incorrect NMEA telegram format gave no alarm
• Position Reference Systems– Drive-off due to DGPS slow drift in combination with hidden failures– Weighting and voting settings found important for resistance to common mode failures
when using two DGPS• DP Computer System
– Controller gave incorrect thrust commands after operating on capability limit for some period of time
– All controllers crashed simultaneously after mode change– Inconsistency in alarms reported on different operator stations– Incorrect alarms, incorrect alarm texts, incorrect alarm description– Hidden failure in I/O card made one controller in-operable. No alarms indicating failure was
given, even after this controller was selected in use.– An alarm was changed to a warning after some time, it appeared that the alarm never
occurred• Thruster and propellers
– One azimuth thruster was not actively used when operating at the capability limit– Thruster feedback sensor or signal failure may lead to drive-off and loss of position
• Power System– Reduced redundancy due to incorrect cabling in UPS fusing– Circuit breaker failure caused no alarm

CyberSea Simulator: HIL Simulation
Run Time Infrastructure
FMEA User Interfaces
3Dvisualization
SimulatorManager
AnalysisToolbox
DP andPMS
ROV Control
Crane control
Model Database & Library
Vessel Models:- Current, wind,
waves- Stationkeeping- Maneuvering- Mulitibody
Propulsion System:- Thruster- Rudder- Pod- etc.
Power System:- Diesel engine- Gas turbines- Generators- Transformers- Converters- Switchboards- etc.
Other Models:- Crane - Ballast- Towing / cables- ROV- Risers- Mooring
Sensor andInstrumentation:-DGPS -HPR-Gyros-MRU/VRS-Wind sensors-…
EnvironmentWave, wind and
current loads
HullsWAMIT, VERES
Propulsion units
Power components
Crane & WinchHydraulics
Heave Compensators
Ballast control
Cables, PipesNonlinear FEM
HIL: Hardware-In-the-Loop2006 © Marine Cybernetics

Hardware-In-the Loop (HIL) Testing• A NEW TECHNOLOGY for HIL testing of control systems as input to
DNV Standard for Certification of control systems• To be used in FAT (Factory Acceptance Tests), sea trials, annual tests,
periodical tests and after upgrades
Customers:1. Oil companies2. Vendors and Yards3. Ship Operators4. Contractors5. Class societies
Real timeinterface
C yberS ea S im ulatorC yberS ea S im ulator
CyberSea Simulator
2006 © Marine Cybernetics
HIL Safety and Performance Testing• DP-HIL (since 2004)• PMS-HIL (since 2006)• Propulsion-HIL (new)• Autopilot-HIL (new)• …

DP System Overview
DP Machinery, Thrusters Vessel Sensors
and Pos-ref
Power
PMS
Environment
2006 © Marine Cybernetics
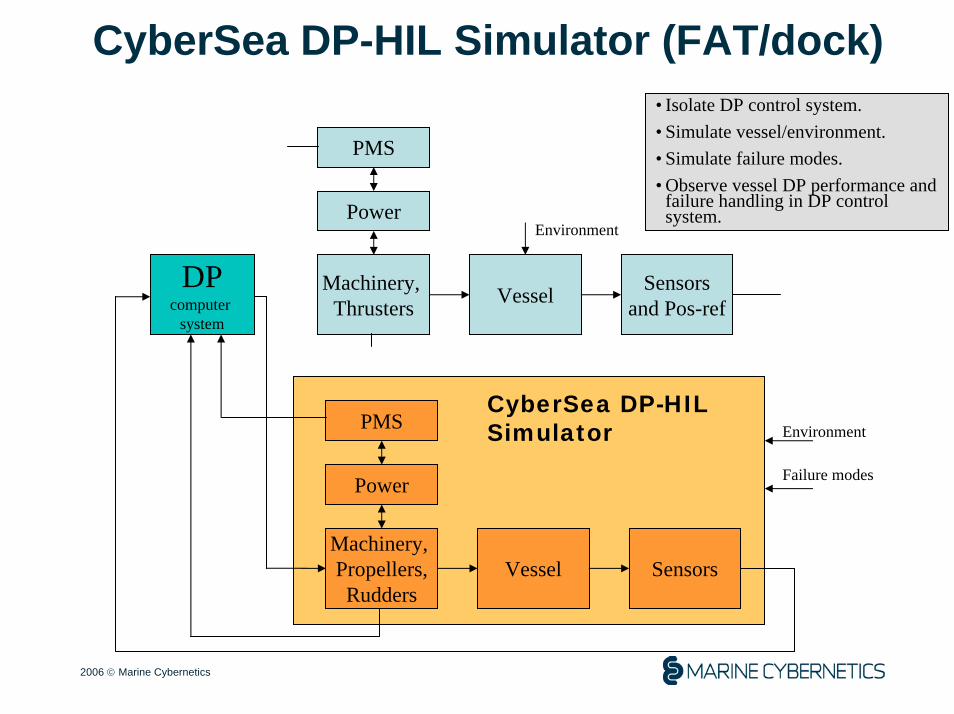
CyberSea DP-HIL Simulator (FAT/dock)
DPcomputer
system
Machinery, Thrusters Vessel Sensors
and Pos-ref
Power
PMS
Machinery, Propellers,Rudders
Vessel Sensors
Power
PMSCyberSea DP-HIL Simulator
Environment
Environment
Failure modes
• Isolate DP control system.• Simulate vessel/environment.• Simulate failure modes.• Observe vessel DP performance and
failure handling in DP control system.
2006 © Marine Cybernetics

CyberSeaVesselSimulator
2006 © Marine Cybernetics
CyberSea Simulator Manager
Option 2:CyberSea Simulator connected to DP computer or integrated automation system via network
Requirescustominterface by vendor!

CyberSea FMEA Simulator (Sea trials)• Simulate sensor and position reference signal failures/errors.
• Simulate thruster signal failure modes.
• Simulate network and system hardware failures.
• Observe failures and errors in DP, PMS, Vessel control, etc.
• Minimally invasive FMEA.
Machinery, Thrusters Vessel Sensors
and Posref
PowerEnvironment
Cyb
erS
ea F
ME
A S
imul
ator PMS
DPcomputer
system
2006 © Marine Cybernetics
Failure modes

HIL Testing and FMEA Observations
• There are no requirements for redundancy of software. Software errors should be considered a common mode failure. The consequence of software errors are therefore potentially much larger than component failures.
• A focus on functional barriers in FMEA studies is useful in order to understand the possible impact of complex failure modes, the role of software, and how to efficiently analyse and test DP systems.
2006 © Marine Cybernetics

Example: Barriers to loss of position due to VRU and DGPS failure modes
FUNCTIONAL BARRIERSTO LOSS OS POSITION FAILURE MODESCOMPONENTS
VRU/GPS HW VRU sensors GPS antennas
2006 © Marine Cybernetics
Integrity check
I/O board I/O board
Circuit loop test
Ready Pitch and roll
Circuit loop test
I/O boardI/O driver
I/O boardI/O driver
VRU/GPS SW
VRU/HPS HW
Data quality check
DPC HW
DPC SW
Integrity check anddifferential correction
I/O board Serial
Circuit loop test
Ready NMEA GGA
Circuit loop test
I/O boardI/O driver
Serial boardSerial driver
Data quality check
Sensor failuresElectronics failuresDisturbancesLoss of power / UPS
Short circuitBroken circuitLoss of power
Out of rangeTimeoutTransmission errorsNetwork failure
NoiseWild pointsFormat errorIntegrity errorsFreeze
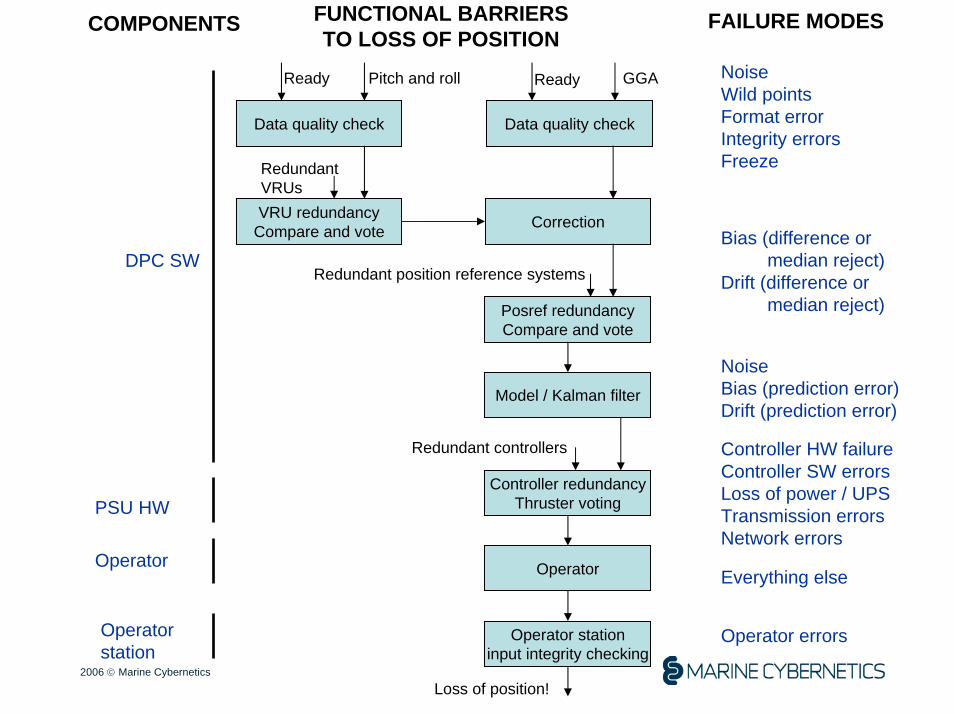
FUNCTIONAL BARRIERSTO LOSS OF POSITION
FAILURE MODESCOMPONENTS
NoiseWild pointsFormat errorIntegrity errorsFreeze
Data quality check Data quality check
GGA
VRU redundancyCompare and vote
RedundantVRUs
Ready Pitch and roll Ready
Correction
Posref redundancyCompare and vote
Bias (difference ormedian reject)
Drift (difference ormedian reject)
2006 © Marine Cybernetics
DPC SWRedundant position reference systems
Model / Kalman filter
NoiseBias (prediction error)Drift (prediction error)
Controller redundancyThruster voting
Controller HW failureController SW errorsLoss of power / UPSTransmission errorsNetwork errors
Redundant controllers
PSU HW
OperatorOperatorEverything else
Operatorstation
Loss of position!
Operator stationinput integrity checking
Operator errors

FUNCTIONAL BARRIERSTO LOSS OF POSITION
FAILURE MODESCOMPONENTS
2006 © Marine Cybernetics
Quality andIntegrity check
I/O board I/O board
Circuit loop test
Ready
VRU sensors
Pitch and roll
Circuit loop test
I/O boardI/O driver
I/O boardI/O driver
VRU/GPS HW DGPS antennas
VRU/GPS SW
VRU/GPS HW
Data quality check
DPC HW
DPC SW
Quality andIntegrity check
I/O board Serial
Circuit loop test
Ready NMEA GGA
Circuit loop test
I/O boardI/O driver
Serial boardSerial driver
Data quality check
Sensor failuresElectronics failuresDisturbancesLoss of power / UPS
Short circuitBroken circuitLoss of power
Out of rangeTimeoutTransmission errorsNetwork failure
NoiseWild pointsFormat errorIntegrity errorsFreezeTypical DP-HIL test scope
Typical FMEA trial test scope

2006 © Marine Cybernetics
FUNCTIONAL BARRIERSTO LOSS OF POSITION
COMPONENTS FAILURE MODES
Data quality check
DPC SW
Data quality check
NoiseWild pointsFormat errorIntegrity errorsFreeze
VRU redundancyCompare and vote
RedundantVRUs
Ready Pitch and roll Ready GGA
Correction
Posref redundancyCompare and vote
Redundant position reference systems
Model / Kalman filter
NoiseBias (prediction error)Drift (prediction error)
Controller redundancyThruster voting
Redundant controllers Controller HW failureController SW errorsLoss of power / UPSTransmission errorsNetwork errors
OperatorEverything else
Loss of position!
PSU HW
Operator
Operator stationinput integrity checking
Operator errorsOperatorstation
Typical DP-HIL test scope
Typical FMEA trial test scope
Bias (difference ormedian reject)
Drift (difference ormedian reject)

Certification and Class Process
Order MS/FAT Dock trial Sea trial/CAT Ship in operation(Annual tests)
Manufacturer/supplier Yard Ship owner
New Buildings and Sailing Ships
Upgrades:- Simulation 3++- Signature 3++
- Simulation 1 and report acceptance / deviations - System / configuration signature 1, version number
-Retest: Simulation 2 / Signature 2
- Request for CyberSea test and verification services- Engineering: simulator configuration, test plan with acceptance criteria for safety / performance
2006 © Marine Cybernetics

Customer Value (1)
Save Time More ThoroughMore Thorough
Reduce building risk;Get vessel productive
faster
Yards Ship Operators E&P Operators
Reduce operational risk;Less downtime
over operational lifecycle
€ / $ / NOK(by the day)
€ / $ / NOK(entire operation)
HIL testing improves building efficiency and operational availability
2006 © Marine Cybernetics

2006 © Marine Cybernetics
“Big Picture” Value Drivers Main Players
Vendor Yard Ship Operator
E&P Operator
Value of improved testing and verification for Offshore Service Vessels, Drilling, FPSO,..
~ 10.000 USD
Design/engineering team efforts
~100.000 USD
Increased sea trial costs and delayed delivery
~106 USD
Off-hire cost, damage cost, (vessel day rates)
~107 USD
Lost revenue and production, damage cost, HSE, ..
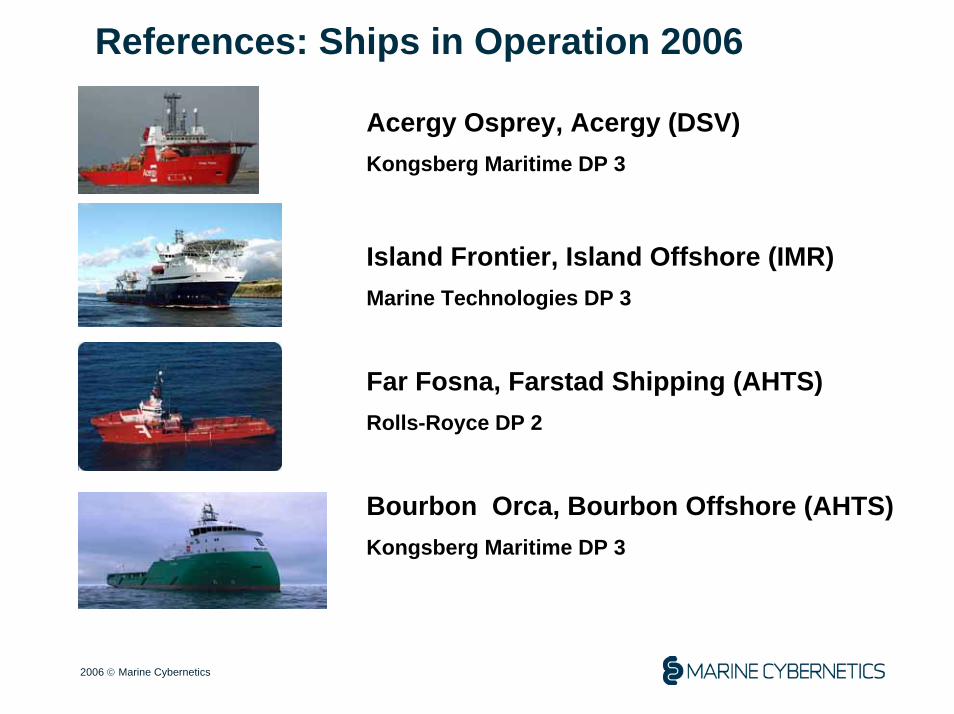
References: Ships in Operation 2006
Acergy Osprey, Acergy (DSV)Kongsberg Maritime DP 3
Island Frontier, Island Offshore (IMR)Marine Technologies DP 3
Far Fosna, Farstad Shipping (AHTS)Rolls-Royce DP 2
Bourbon Orca, Bourbon Offshore (AHTS)Kongsberg Maritime DP 3
2006 © Marine Cybernetics

References: New Buildings 2006
NB 275 Ulstein Yard, Bourbon Offshore (PSV)Marine Technologies DP 2
Ulstein/Megacon PMS
NB 275 Ulstein Yard, Bourbon Offshore (PSV)Marine Technologies DP 2
Ulstein/Megacon PMS
2006 © Marine Cybernetics

Reference: Ships in Operations
Acergy OspreyDP-HIL Safety and Performance Testing
FAT: • January 2006
Dock Trials:• February 2006
Sea Trials:• March 2006
• Diving and Construction Ship• DP Class 3: Kongsberg Maritime• E&P Operator: Statoil• Class: DNV AUTRO + SfC of HIL testing
2006 © Marine Cybernetics

Test Scope
259 tests at factory completed in 3.5
days.Focus on SW functionality.
111 tests at dock completed in 30 hrs.
Focus on SW functionality and integrated functions.
110 tests completed in 19 hours. Focus on HW and integrated functions.
Test at Sea
Test at Dock
Test at Factory
Acergy Osprey DP-HIL Testing
2006 © Marine Cybernetics

Software Problem Identification
+ HILSystem tests (FAT)
+ HILTests on board (CAT)
Revealed during normal operation + HIL
Identified during accidents and emergency handling ... or that are never identified
“Soft-ware
Bugs”

Software Problem Identification
System tests (FAT)
Tests on board
Revealed during normal operation
Identified during accidents and emergency handling ... or that are never identified
+ HIL
+ HIL
+ HIL
Goal: Reduced number of possible ”Software bugs”will give a safer system after HIL testing
“Soft-ware
Bugs”

Why does DNV believe in HIL testing in the maritime industry?• HIL technology is successfully applied
to other industries • Reliability of control systems is of great
concern to stakeholders in the offshore and the maritime industry

DNV Deliveries related to HILDNV can offer an independent certification of the HIL process• DNV approves HIL test suppliers• DNV has a standard for HIL testing • DNV issues HIL certificates

Standard for Certification of HIL testing
• Defines responsibilities for the involved parties
– Target system owner– HIL Supplier– HIL Test organisation– HIL Certification body
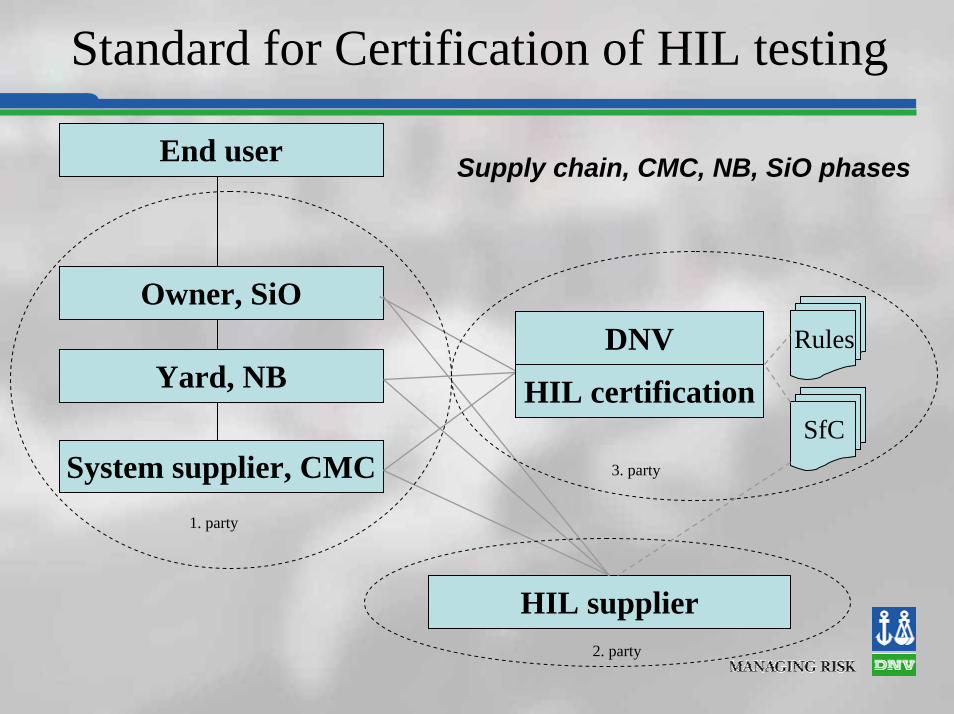
Standard for Certification of HIL testing
End user
Owner, SiO
Yard, NB
System supplier, CMC
DNV Rules
HIL supplier
1. party
2. party
3. party
HIL certificationSfC
Supply chain, CMC, NB, SiO phases

Standard for Certification of HIL testing
• Defines general requirements for the HIL test package– Requirements to configured HIL/Plant
simulator– Requirements to the HIL/FMEA simulator– Requirements to the HIL test setup and test
plan– Validation requirements for the configured
HIL simulator
+SIMULATOR
SIMULATOR

Standard for Certification of HIL testing
• Refers to functional requirements for thetarget system– E.g. class rules for DP, PMS,…
• Defines the content of the HIL test certificate

Conclusion• HIL
• makes possible improved testing compared to today's maritime test standards
• makes the system become safer • will become part of the future industry standard • is available today
HIL represents a significant step forward• The maritime and offshore markets request improved
testing regime for safety critical onboard computer systems. HIL testing and HIL test certification are an answer to this request.
• DNV can deliver certification of HIL testing today

MARINTEKNorwegian Marine Technology Research Institute
Trondheim
1MARINTEK2005-06-20

Norwegian universities and university colleges
2MARINTEK2005-06-20Updated April 2001

Gløshaugen-Campus
3MARINTEK2005-06-20Updated April 2001

SINTEF
Technology for a better society
4MARINTEK2005-06-20

The Norwegian University of Science and Technology, NTNU:- 20000 full-time students- 973 scientific employees
University of Oslo, UiO, Faculty of mathematics and natural sciences:- 4500 full-time students - 518 scientific employees
NTNU and the SINTEF Group Collaboration in R & D
Joint use of laboratories and instruments
SINTEF employees teach at NTNU
NTNU personnel working on
SINTEF projects
Our partners
5MARINTEK2005-06-20

The SINTEF Group
SINTEF’s CouncilSINTEF’s Board
PresidentSenior Executive Vice President
SINTEFICT
SINTEFPetroleum and Energy
SINTEFMarine
SINTEFTechnology and Society
SINTEFHealth Research
SINTEFMaterials and Chemistry
6MARINTEK2005-06-20

The SINTEF Group (cont.)
SINTEF Marine consists of:MARINTEKSINTEF Fisheries and AquacultureSINTEF Marine Environmental Technology
SINTEFPetroleum and Energy consists of: SINTEF Petroleum Research
SINTEF Energy Research
7MARINTEK2005-06-20

Marine Technology Centre in Trondheim, Norway
8MARINTEK2005-06-20
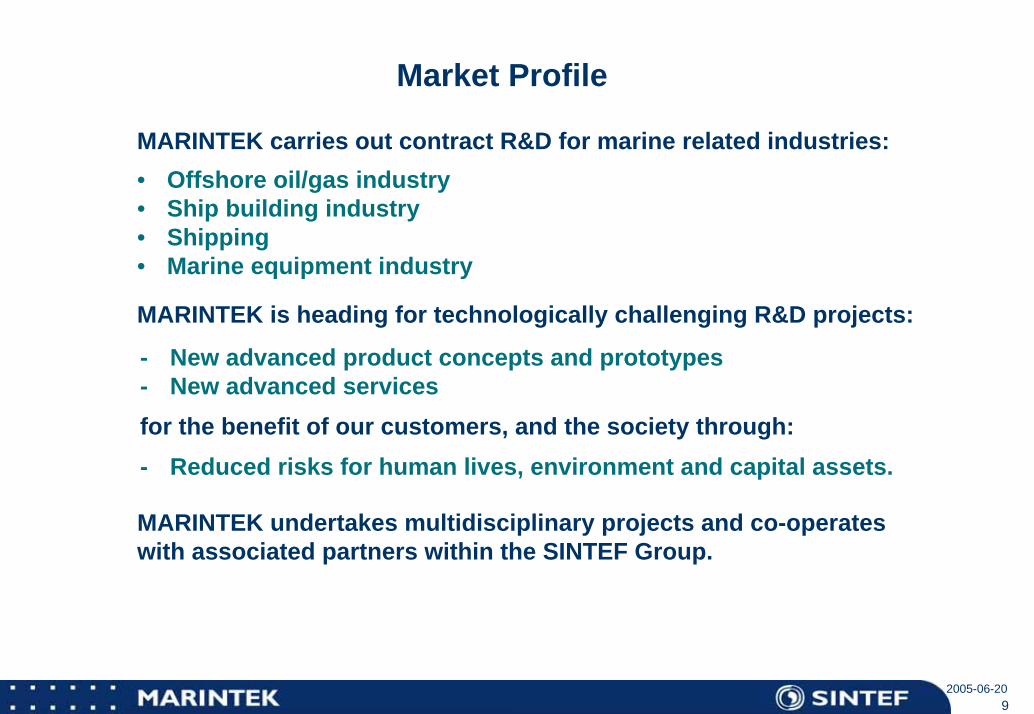
Market Profile
MARINTEK carries out contract R&D for marine related industries:• Offshore oil/gas industry• Ship building industry• Shipping• Marine equipment industry
MARINTEK is heading for technologically challenging R&D projects:
MARINTEK undertakes multidisciplinary projects and co-operates with associated partners within the SINTEF Group.
- New advanced product concepts and prototypes- New advanced servicesfor the benefit of our customers, and the society through:- Reduced risks for human lives, environment and capital assets.
9MARINTEK2005-06-20
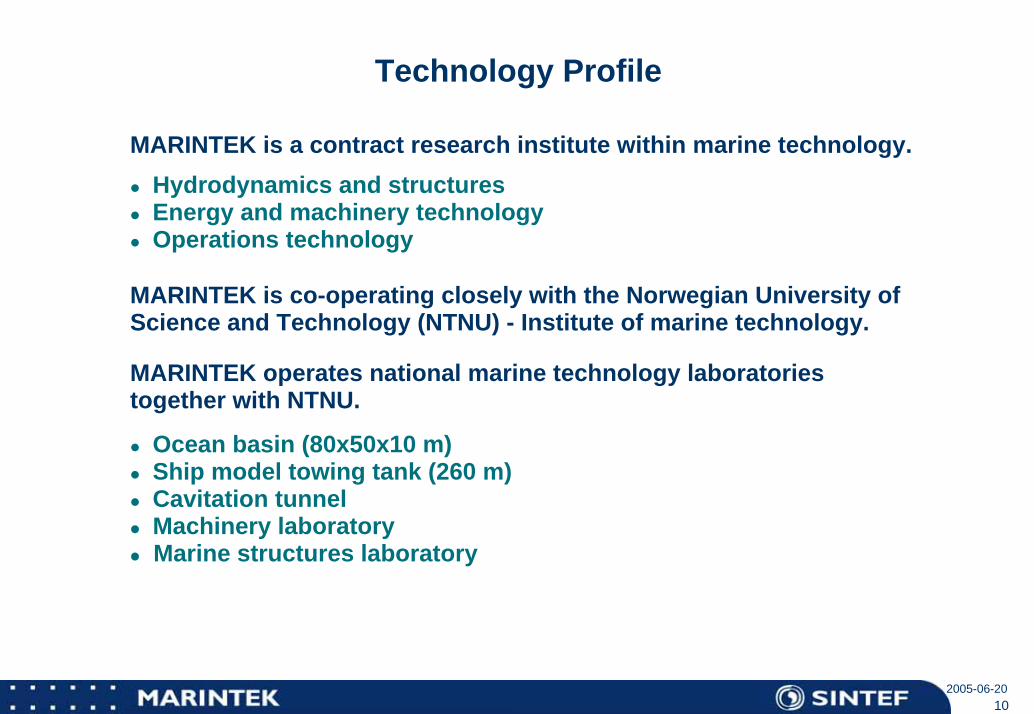
Technology Profile
MARINTEK is a contract research institute within marine technology.Hydrodynamics and structuresEnergy and machinery technologyOperations technology
MARINTEK is co-operating closely with the Norwegian University of Science and Technology (NTNU) - Institute of marine technology.
MARINTEK operates national marine technology laboratories together with NTNU.
Ocean basin (80x50x10 m)Ship model towing tank (260 m)Cavitation tunnelMachinery laboratoryMarine structures laboratory
10MARINTEK2005-06-20

Ownership
MARINTEK has the following shareholders:
Det Norske Veritas …...………..….….: 1.0 MNOK 9%Found. of Shipbuilders’ Fund for Research and Education ..……….: 0.5 MNOK 4%Directorate of Shipping ………………: 0.5 MNOK 4%Fed. of Norwegian Coastal Shipping : 0.1 MNOK 1%
SINTEF ……………..………………..….: 6.5 MNOK 56%
Norwegian Shipowners’ Association: 3.0 MNOK 26%
Total Share Capital: 11.6 MNOK
11MARINTEK2005-06-20

Foreign trade34% of total turnover
Total turnover 2004: 189 mill NOK
Foreign companies in Norway (7%)
Far East (11%)
North America (32%)
Europe (47%)
South America (3%)
12MARINTEK2005-06-20

Personnel176 employees (2005-01-01)
Dr.ing./Ph.D. (20.5%)
Technical staff (15%)
Administrative staff (10.5%)
MSc Engineers/University graduates (43%)
Engineers (11%)
13MARINTEK2005-06-20

Project-related specification of turnoverTotal turnover 2004: 189 mill. NOK
(mill NOK)
50
100
150
200
02004 2003 2002 2001 2000
Basic grants
Strategic projects
Contract research
14MARINTEK2005-06-20

MARINTEK projects in EC – FP 5
STID - Steam Injection Diesel EngineWaterman-Ts - Waterborne Traffic and Transport Management - Thematic NetworkTHEMIS (TN) - Thematic Network in Optimizing the Management of Intermodal
Transport ServicesTHEMES (TN) - Thematic Network on Safety Assessment in Waterborne TransportIP - Intermodal Portal - Integration of Ports into Intermodal Transport ChainsTRESHIP (TN) - Technologies for Reduced Environmental Impact from ShipsMARPOWER (TN) - Concepts of Advanced Marine Machinery Systems with Low
Pollution and High EfficiencyFLOWMART - Efficient Low Wash Maritime TransportationSWAN - Standardization and Dissimination Support Actions for Waterborne
Telematics Networks and ApplicationsITEA-DS - Intelligent Tools for Emergency Applications and Decision SupportD2D - Demonstration of an Integrated Management and Communication
System for Door 2 Door Intermodal Freight Transport OperationsMARTOB - On board Treatment of Ballast Water and Application of Low Sulphur
Marine FuelHullMon+ - Intelligent Hull Monitoring SystemsENCONA - Encouraging Co-operation between Community Funded and
National Research in Maritime Sector
15MARINTEK2005-06-20

MARINTEK projects in EC – FP 6
ERAMAR (TN/CA) - European Research Area Application in the Maritime DomainERASTAR (CA) - The Network for the Shipbuilding Technology applied ResearchDSS-DC (STREP) - Decision Support System – Damage Control
(MARINTEK Coordinator)MTCP (CA) - Maritime Transport Coordination PlatformINMARE (CA) - Best Practices of Ship ManagementHERCULES (IP) - Reduction of CO2 Particles from EnginesENCOMAR (SSA) - Enhanced Co-operation between EU Member States and
Associated Candidate States in Maritime Research on Transport(Extension of ENCONA project)
SPREEX (STREP) - Spreading of Oil Pollutions in SeaSUPERPROP (STREP) - Superior Life-Time Operation Economy of Ship Propellers MARNIS (IP) - Maritime Navigation and Information ServicesVISIONS (NoE) - Visionary Concepts of Vessels and Floating StructureFREIGHTWISE (IP) - Intermodal Freight Transport Information System
16MARINTEK2005-06-20

Ship Technology and Operation
Ship performance and operation
Efficient production
• Ship performance• Manoeuvring and ship handling• Sea-keeping performance and operational criteria• Sea loads• Propellers, cavitation and noise• Waterjets• Thrusters, positioning capacity
• Pre-outfitting principles and methods• Procurement principles and methods• Preliminary design tools• Cell-oriented construction methods• Preliminary design tools• Information technology for the shipbuilding industry
Energy technology• Diesel and gas engine processes R&D• Ship equipment design analyses and development• Energy conservation and pollution control• Liquid and gaseous fuels, quality validation and testing• Prototype testing and verification
(Cont.)
17MARINTEK2005-06-20

Ship Technology and Operation (cont.)
• Supply Chain Management• Transport scenarios and logistic support systems• Management and decision support systems• Condition assessment and maintenance program• Qualification testing of personnel and
computerbased training
Shipping and logistics
Control and monitoring systems• Integrated bridge systems and operational procedures• Marine cybernetics, anchoring and dynamic positioning• Marine crane operations and heave compensation
18MARINTEK2005-06-20

Offshore Oil and Gas IndustryFloating systems
Structural analysis and testing
• Loads and motions of floating support vessels• Loads and motions of risers and other connecting elements• Capacity of anchoring and dynamic positioning systems• Operation and operability criteria in specified environments
• Ultimate strength and collapse behaviour of steel structures• Dynamic analysis and fatigue design• Dynamic analysis of slender marine structures;
risers and pipelines• Stress analysis of flexible risers including thermal effects,
service life assessment• Reliability assessment of steel structures,
risers and pipelines• Integrated fire analysis of steel structures• Re-assessment of ageing structures
Cont.
19MARINTEK2005-06-20

Offshore Oil and Gas Industry (cont.)
Offshore operations• The positioning of surface vessels• Forces on, and motions of, complex geometries• Heave compensation devices• Simulation of subsea operations
Efficient design and operations• Operational scenarios and logistics support systems
• Condition assessment and maintenance program development
• Qualification testing of personnel and computerbased training
• Management information systems for operations
20MARINTEK2005-06-20

The Ocean Basin Laboratory
Length: 80 m - Width: 50 m - Depth: 0-10 m
TOW
ING
TA
NK
OCEAN BASIN
50 mMulti-flapwave maker
80 m
Cross-section of Ocean Basin
Double-flapwave maker
Multi-flapwave maker Double-flap
wave maker
21MARINTEK2005-06-20

Marine Technology Centre in Trondheim, Norway
22MARINTEK2005-06-20

Model tests in the Ocean Basin
23MARINTEK2005-06-20

Model tests in the Ship Model Tank
24MARINTEK2005-06-20

The Cavitation Laboratory
25MARINTEK2005-06-20

Structural Testing
26MARINTEK2005-06-20

The Machinery Laboratory
Artist impression
27MARINTEK2005-06-20

Heading North!!
28MARINTEK2005-06-20

Development of the Norwegian Offshore Industry
29MARINTEK2005-06-20

Oil exploitation and transport in the Arctic
25% of the world’s undiscovered oil resources are expected to be found in the Barents SeaEU imports 70% of her energy-demand. Only Danmark and UK net exporters.Politically stable areaStrategic location wrt. the EUEU’s “Northern Dimension”ProgrammeClose dialogue EU, Norway, Russia on the energy field
30MARINTEK2005-06-20

Environmental and safety issus
Surveillance and Defence
North Eastpassages
Oil and GasExploitation
Industry in North of Norway
IncreasedRussian business
New drivers for the Norwegian Ocean DimensionStortingsmelding: / Governmental White Paper :
”Challanges and Possibilities in the Northern Areas” April 2005.
31MARINTEK2005-06-20

A game-changing combination of technologies from SINTEF
ColdFlowDeepline
SIMlab
LEDA
32MARINTEK2005-06-20

SeaOrbiter at the Jules Verne Exhibition in Paris 2005
33MARINTEK2005-06-20

Verification tests
Terra Nova Project in Canada
Åsgard A in Norway Snorre II (B) in Norway
Thunder Horse, Gulf of Mexico
34MARINTEK2005-06-20

35MARINTEK2005-06-20

LNG-Chain to US and EU:
36MARINTEK2005-06-20

Small scale distribution of LNGCovering the coast of Norway
LNG source - base load LNG or receiving terminals or small scale LNG productionLNG could be further distributed by truck or rail way or distributed by locale pipeline.
Eksport av LNG
Kystgass
Kystgass skip
Kystgass skip
Lokalt LNG skip
Lokalt depot
Regionale depot
Snøhvit
37MARINTEK2005-06-20

The natural gas chain
Processing andliquefaction
Production Shipping Transmission/distribution End use
Main areas for MARINTEK activities are:Technologies for loading and transport of LNGTechnologies for end useAnalysis of supply systems for natural gas
38MARINTEK2005-06-20

Offshore offloading & LNG FPSO
• mitigation of an collision risk• reducing terrorist attack threat• preventing costly civil works
39MARINTEK2005-06-20

Maritime Transport solutions
FRESHFISH
BargeIpsi Terminal
Enisys
ENISYS
40MARINTEK2005-06-20

European Deep Sea Terminal and Warehouse
Production Location
RailHamburgStuttgart Deep Sea
Zeebrugge
Sindelfingen/Stuttgart
Hamburg
Mannheim
Inland Rail terminal & Warehouse
European Deep Sea Terminal and Warehouse
Production Location
BargeRoadMannheim Zeebrugge Deep SeaStuttgart
Alternative via Zeebrugge:
Multimodal logistics – combining deepsea, shortsea and inland waterways
41MARINTEK2005-06-20
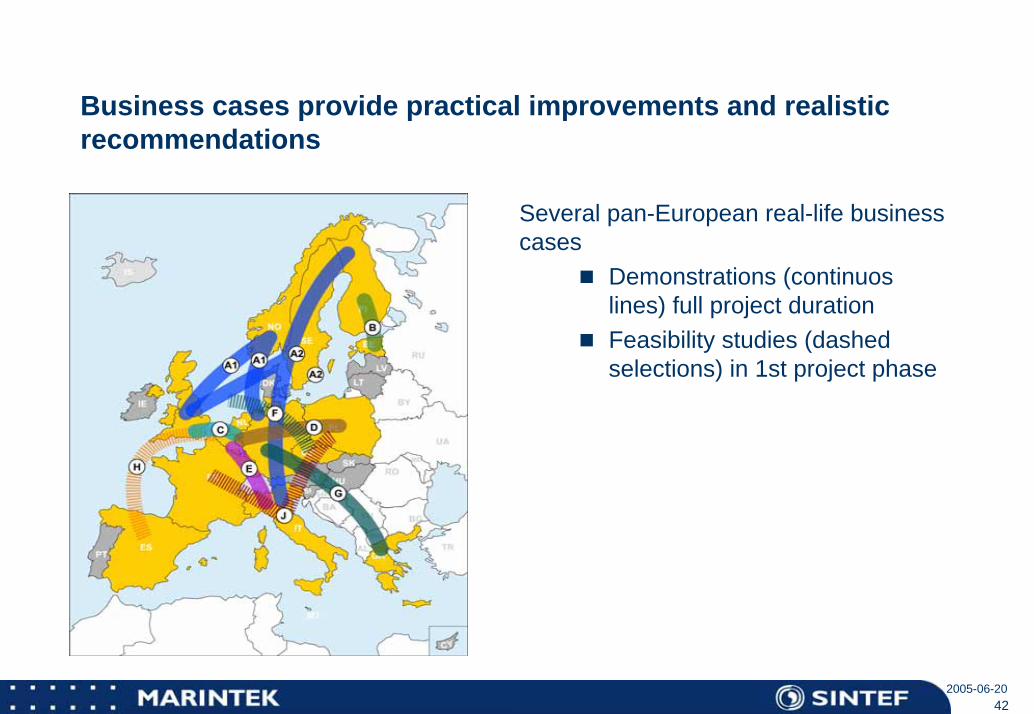
Business cases provide practical improvements and realistic recommendations
Several pan-European real-life business cases
Demonstrations (continuos lines) full project durationFeasibility studies (dashed selections) in 1st project phase
42MARINTEK2005-06-20
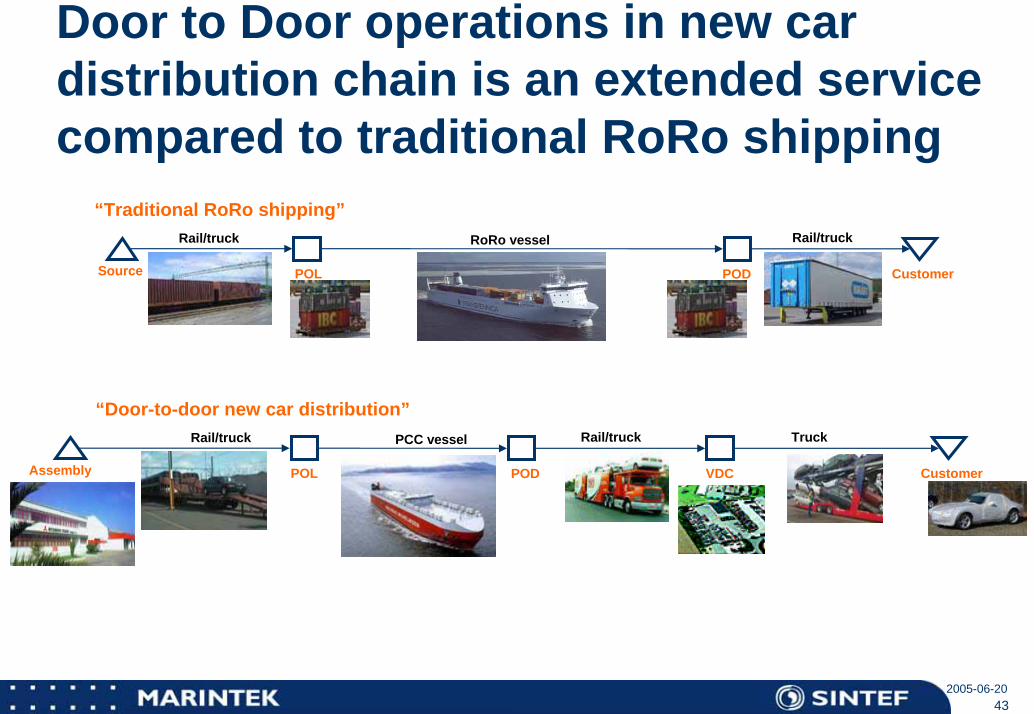
Door to Door operations in new car distribution chain is an extended service compared to traditional RoRo shipping
POL
Rail/truck RoRo vessel Rail/truck
CustomerPODSource
“Traditional RoRo shipping”
POL
Rail/truck PCC vessel Truck
CustomerPODAssembly
“Door-to-door new car distribution”
VDC
Rail/truck
43MARINTEK2005-06-20

Lead Logistics Provider service – Total Responsibility for Integrated Logistics
.OceanTransportAssembly Transport DealerIn-Plant
OperationCompound
PDI etc
CONSUMER
Lead Logistics Provider
Financial Settlements/Transactions
Transport
Physical Flow
Information Flow (simplified)Responsibility
44MARINTEK2005-06-20
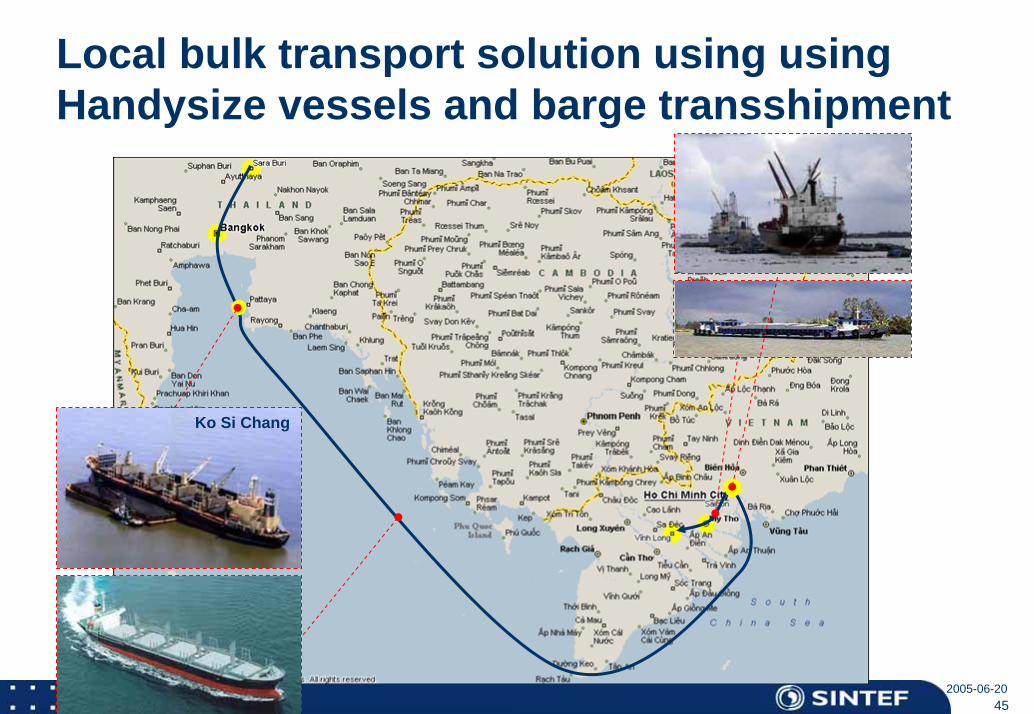
Local bulk transport solution using usingHandysize vessels and barge transshipment
45MARINTEK2005-06-20
Kat Lai
Ko Si Chang

Ko Si Chang
Local bulk transport solution using usingHandysize vessels and barge transshipment
46MARINTEK2005-06-20

IPSI - Technology for the cargo handlingState-of-the terminal lay-outFast cargo handling High capacityReduced area requirementsState-of-the-art multi modal solutionAutomatic guided vehicles, (AGV) operations2400 TEU per day400 TEU per hour
Source: HamworthyKSE, IPSI – A Revolutionary Concept for Intermodal Transport
47MARINTEK2005-06-20

IPSI - Concept terminal
48MARINTEK2005-06-20

IPSI – vessel is purpose built to accommodate specialised container boxes (SECU) carrying up to 80 tons each on RoRo cassettes
SECU = Store Enso container unit
49MARINTEK2005-06-20

Distribution cost comparison from plant to continental terminal
0
5
10
15
20
25
30
35
40
45
50
0 2 4 6 8 10 12 14 16
USD
/ton
Traditional sideport and breakbulk technologyStoraEnsoTraditional RoRo solution
Transport to POL POLHandling
Vessel transport POD Handling
Including extra transport and distribution terminal
50MARINTEK2005-06-20

The Interbarge transport concept focus on combining transport of paper and other commodities suitable for unitizing with transport of new cars, heavy machinery and other road units Targets : - To improve the cost position of RoRo based transport solutions by utilising the European waterways.
- Reduce emissions and fuel consumption facilitated by reduced light ship weight, low resistance due to optimized hull shapes and state-of-the-art propulsion systems.
Localisation of production sites in Europe / Main inland waterways:
The Interbarge concept
51MARINTEK2005-06-20

The Interbarge concept – basic design; Comparing the new design with a conventional RoRo vessel design
Main data MS”VERA”:– LOA: 108.5 m – Breadth moulded 11.4 m– Draught light ship 1.2 m– Draught loaded 2.5 m– Payload 1450 tons – Displacement light ship 1200 tons
Main data NEW DESIGN:– LOA: 110 m – Breadth moulded 11.4 m– Draught light ship 0.95 m– Draught loaded 2.63 m (design)– Payload 2050 tons(design)– Displacement light ship 950 tons
52MARINTEK2005-06-20

53MARINTEK2005-06-20

This new design is designed for transporting cement in dedicated tanks and mainly empty containers to USA and containers with cargo to Caribbean.
54MARINTEK2005-06-20

Increased capacity on High Speed Crafts(Multi-hull)
55MARINTEK2005-06-20

5656
Let’s imagine that we move 10-15 years in the future…
Short Sea ShippingDeep Sea ShippingCruise and Leisure
Inland Shipping Floating Infrastructures

Be prepared to handle critical situations
57MARINTEK2005-06-20

Operations in hard weather conditions is challenging for people and constructions
58MARINTEK2005-06-20

Energy production from wind, waves and current need in dept knowledge in marine technology
59MARINTEK2005-06-20

Technical Operation Competence Centre
http://www.tocc.no
Presentation 8. June 2006, Brage Mo, MARINTEK
1MARINTEK

Objective
TOCC improves competence by employing tools for performance analysis and decision support suited to the maritime industry.
TOCC tools are beneficial and easy to use. They are also transparent and consistent for better understanding and easier implementation.
2MARINTEK
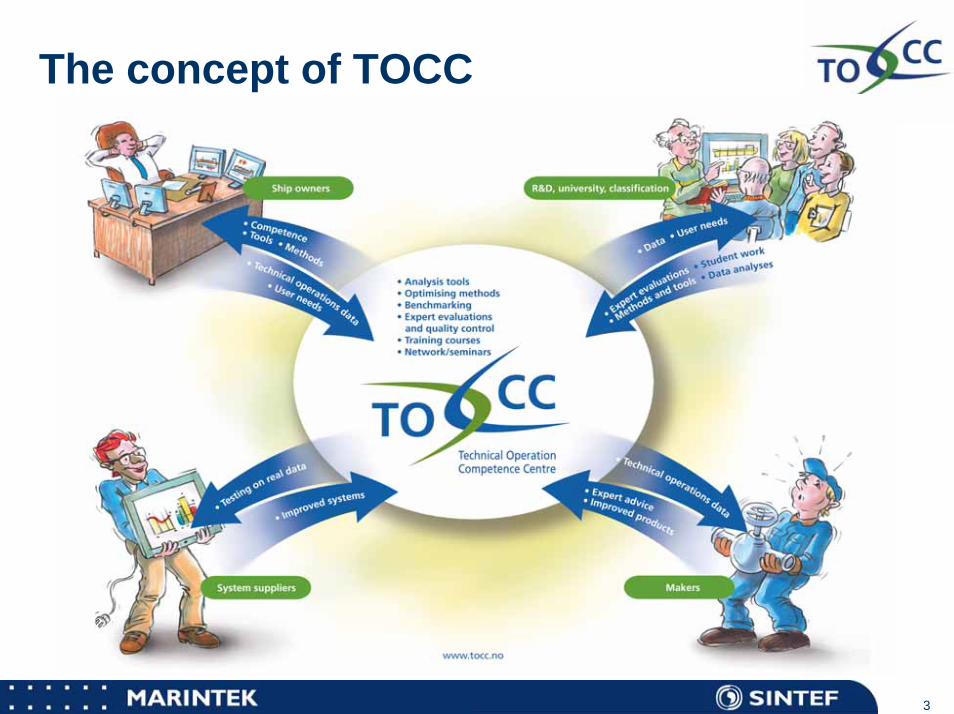
The concept of TOCC
3MARINTEK

Current situation vs. Best practice
Not optimised reporting & performance assessment methodLimited performance assessment support
Limited time to evaluate vessel dataReporting sub optimalLimited tools / support / authority for operation optimisationOperation/performance indicators not optimal
-Technical condition vs. company strategy?-Over-all fleet performance?
Little co-operationsLack of standardsLack of best practice
SEAOFFICE INDUSTRY
Simple and smart reportingQuality feedback Focus on critical systems
Clear proceduresCustomised training
Monitoring of indicatorsStandardised reporting & monitoringCross-fleet comparisonProactive planning Customised training
Cross-company comparisonCommon performance standards Competence sharing
4MARINTEK

Benefits for TOCC participants
TOCC offers new methods and tools for efficient technical operationTOCC addresses common challenges, but individual solutions are possibleTOCC will ensure the development of an active competence network.
research and university sectorclassification, authoritiesship ownerssystem and equipment suppliersoffshore industry
TOCC gives the direction for R&D within shipping technical operations.
5MARINTEK

Indexing fleet performance
Alarm
Alert
OK
Ship
Supe
rinte
nden
tFl
eet M
gr. • Safety• Environment• Finance• QA• Technical performance
6MARINTEK

TOCC cases
Performance for critical systemsIndex for main engine performance dataIndex, other systems
Auxiliary enginesOther critical systems
Hull and propeller analysis
7MARINTEK

General status:
M.E. performance model specified and tested in SW tool with data received from ships.Findings improved by ship owners.New reporting form for performance tests validates info and sends xml messages.Guidelines testing and collection of measurements under development.Onboard implementation started May 2006.
Hull and propeller model not finished for testing.
AE performance model development has started.
8MARINTEK
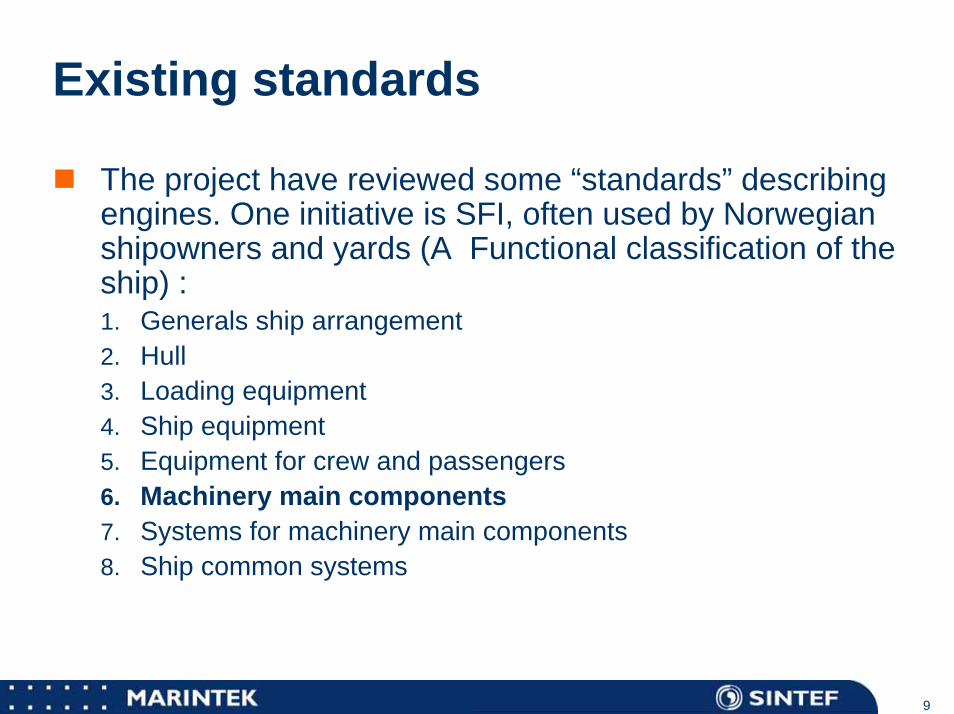
Existing standards
The project have reviewed some “standards” describing engines. One initiative is SFI, often used by Norwegian shipowners and yards (A Functional classification of the ship) :1. Generals ship arrangement2. Hull3. Loading equipment4. Ship equipment5. Equipment for crew and passengers6. Machinery main components7. Systems for machinery main components8. Ship common systems
9MARINTEK
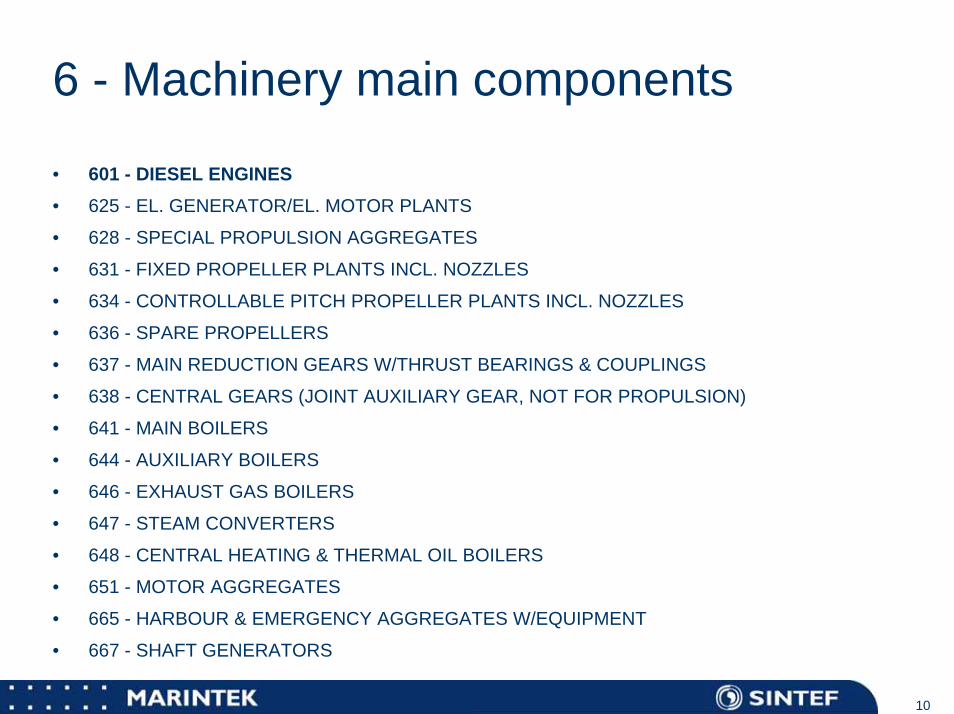
6 - Machinery main components
• 601 - DIESEL ENGINES• 625 - EL. GENERATOR/EL. MOTOR PLANTS
• 628 - SPECIAL PROPULSION AGGREGATES
• 631 - FIXED PROPELLER PLANTS INCL. NOZZLES
• 634 - CONTROLLABLE PITCH PROPELLER PLANTS INCL. NOZZLES
• 636 - SPARE PROPELLERS
• 637 - MAIN REDUCTION GEARS W/THRUST BEARINGS & COUPLINGS
• 638 - CENTRAL GEARS (JOINT AUXILIARY GEAR, NOT FOR PROPULSION)
• 641 - MAIN BOILERS
• 644 - AUXILIARY BOILERS
• 646 - EXHAUST GAS BOILERS
• 647 - STEAM CONVERTERS
• 648 - CENTRAL HEATING & THERMAL OIL BOILERS
• 651 - MOTOR AGGREGATES
• 665 - HARBOUR & EMERGENCY AGGREGATES W/EQUIPMENT
• 667 - SHAFT GENERATORS
10MARINTEK

TOCC Procedures
•Develop forms•Input ship static data•Send forms to ship
•Install forms•Input measure data•Validate•Send data to TOCC•Use email as prot.
•Receive xml/email•Validate•Store data•Analyze•Develop report•Send report to ship
•Receive report•Do maintenance
11MARINTEK

12MARINTEK

ME performance specification
13MARINTEK

14MARINTEK

15MARINTEK

16MARINTEK

17MARINTEK

18MARINTEK

19MARINTEK

General
SituationNeed for better inputNeed experience to conclude
Realistic improvement in data quality to stabilize TCI resultsMeasurements accuracy influence on indicators
ImprovementsShips get insight in TCI ME model
SpecificationsResults
Ships focus on procedures for measurement collectionA template that give feedback (hint) about illogical readings
20MARINTEK

Conclusion
Systematic analysis of operation data will improve the ship operation and quality.
TOCC analysis will focus from ship managers viewpoint to expose performance that should initiate corrective action.
TOCC will provide ship managers with tools and competence to improve operation and quality through collaboration between relevant parties.
21MARINTEK

22MARINTEK

2006年6月20日 1
NORGE
Dig network(Ethernet)
Server - Sola
Internet
VHF DataCommunication carrier for the maritime market

2006年6月20日 2
VHF Data VHF Data –– What is done? What is done?
• A pilot project was performed on a limited network with 6 VHF base stations, each with two radios. Various types of ships participated in the test for a period of two years
– We have favourable experiences regarding stability, range and functionality. It was easy to set up local networks on ship LAN and to adapt various software applications to the system

2006年6月20日 3
VHF Data VHF Data –– What is done? What is done? •
– In the test period, we have had close cooperation with the Norwegian fishery authorities. We have developed a new positioning database and a tracking system in accordance with international standards for tracking of fishing vessels.
– We have also developed a fishery catch reporting system in accordance with the SHEEL project (Secure and Harmonised European Electronic Logbook)
– The system has been approved by the Norwegian Interbank Payment Centre (BBS) as a carrier for credit card and online payment terminals on board passenger ships

2006年6月20日 4
VHF Data VHF Data –– Main projectMain project
– Based on the experience from the pilot project, and feedback from customers, a feasibility study for improvement of the system was performed in cooperation with the manufacturer.
– The suggested improvements are included in the main project
2006年6月20日 5
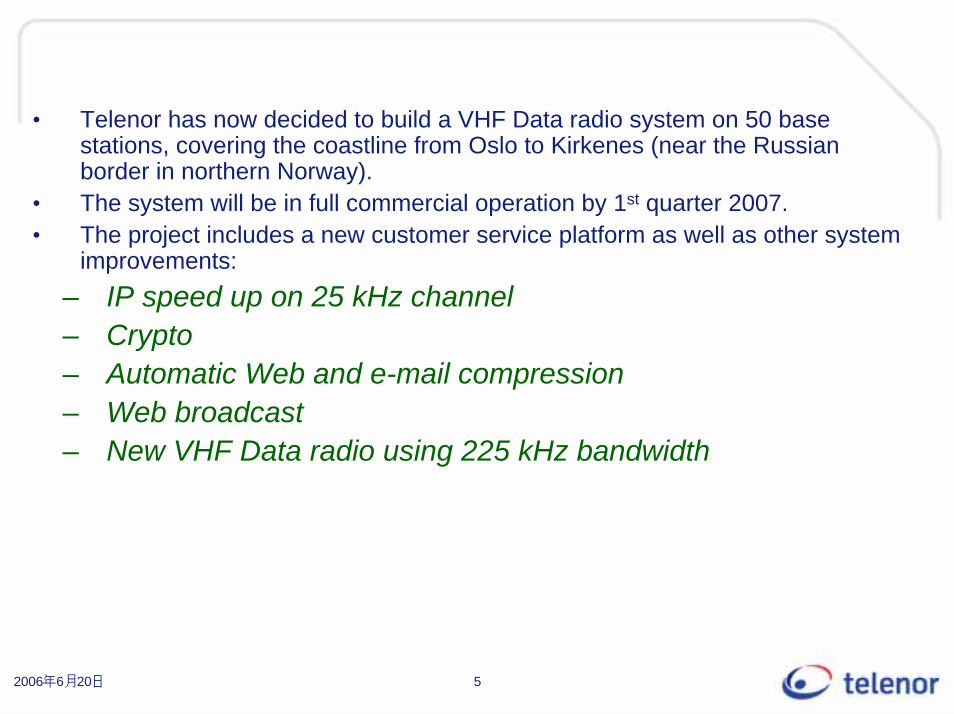
• Telenor has now decided to build a VHF Data radio system on 50 base stations, covering the coastline from Oslo to Kirkenes (near the Russian border in northern Norway).
• The system will be in full commercial operation by 1st quarter 2007. • The project includes a new customer service platform as well as other system
improvements:– IP speed up on 25 kHz channel – Crypto – Automatic Web and e-mail compression– Web broadcast– New VHF Data radio using 225 kHz bandwidth

2006年6月20日 6
VHF Data VHF Data –– functionality (1)functionality (1)
• IP protocol with Ethernet interface– Enables simple interface with other equipment and
applications• Fixed IP-address on board the vessel
– May be addressed from shore to ship without active action onboard
• Always connected – Well suited for “ real time applications”.

2006年6月20日 7
VHF Data VHF Data –– functionality (2)functionality (2)
• The system continues data transfer automatically after a break in communication, e.g. when going outside coverage
– There is no need for the operator to intervene, the system detects when the connection is resumed and continues the data transfer from the position where the break took place
• Several in and out interfaces, both analogue and digital, direct from the radio equipment
– Simple connection to instruments, GPS and local networks (LAN)

2006年6月20日 8
VHF Data VHF Data –– funcionality funcionality (3) (3)
• Extensive internal memory in the radio equipment– May be operated without any external PC connected– For instance is the complete protocol for tracking of
fishing vessels based upon the internal memory of the radio

2006年6月20日 9
VHF Data VHF Data –– funcionality funcionality (4) (4)
• Data parcels from different users and services may be transmitted on the same channel, and various IP packets may be given different priority.
– For example, it is possible to connect at the same time several active payment terminals to one radio that allready is in use for e-mail. IP packets that contain transaction data from a bank terminal may be given priority and are transmitted immediately, even if the radio is engaged with e-mail og web-surfing.

2006年6月20日 10
VHF Data VHF Data –– funcionality funcionality (5) (5)
• The system will automatically choose the next available channel if there is no capacity left on the primary channel.
– Under heavy trafic, larger volumes of data aremoved to the next available channel.
– In areas of constantly heavy trafic, it is of course possible to equip the base stations with more channels.

2006年6月20日 11
56,0
56,5
57,0
57,5
58,0
58,5
59,0
59,5
60,0
62,5
63,0
63,5
64,0
64,5
65,0
0 1 2 3 4 5 6 7 8 9 10 11 12
Longitude
Latit
ude
Njord A 29,4 nm
Heimdal 28,6 nm
Draupner 28,6 nm
Ekofisk 28,6 nm
Ula 28,6 nm
Tryvann 58,0 nm
Vealøs 55,7 nm
Høyås 45,8 nm
Hisøy 31,5 nmDolsveden 34,8 nm
Storefjell 44,7 nm
Bjerkreim 57,5 nm
Kattnakken 62,8 nm
Gulen 61,8 nm
Bremanger 61,8 nm
Gamlemsveten 65,6 nm
Litlefonni 50,3 nm
Kopparen 54.2 nm
The inner ring indicates error free coverage.The outer ring indicates useful coverage.Error free coverage for each station isgiven in nautical miles.
Falkhetta 38,2 nm
60,5
61,0
61,5
62,0
Gullfaks 27,6 nm
Oseberg 29,4 nm
Mailserver
Rundemannen 58,6 nm
Rogaland
VHF Data Located on existing VHF base stations
Under piloting
Ready for construction
• Basic coverage of theNorwegian coast, the North Sea and Haltenbanken requires construction of VHF Data on about 50 base stations
• We have about 130 existing VHF base stations which may be used if needed, enabling better localcoverage and increased transmission capacity,

Typical services provided by VHF Data. Typical services provided by VHF Data.
TelenorMaritime Radio• System owner• Frequency license• Owner of infrastructure• Operator
Service providers(examples)
• Fishery Authorities• Storm Weather Centre• Interbank payment services• Coastal Authorities• Fishery sales organisations • Machinery control systems
Supplier of ship equipment
Customer segments
VHF Data
•Delivery•Installation•Stocks
•IP-address•Configuration
Service platform
TrackingElectronic logbook
Payment services
Web Weather forecast
Off-shore and supply
Fishery Ferry- and local passenger traffic
Coast aux. & cargo
Europe Cargo

Typical services provided by VHF Data. Typical services provided by VHF Data.
TelenorMaritime Radio• System owner• Frequency license• Owner of infrastructure• Operator
Service providers(examples)
• Fishery Authorities• Storm Weather Centre• Interbank payment services• Coastal Authorities• Fishery sales organisations • Machinery control systems
Customer segments
Service platform
VHF Data
TrackingElectronic logbook
Payment services
Web Weather forecast
Supplier of ship equipment
•Delivery•Installation•Stocks
•IP-address•Configuration
Off-shore and supply
Fishery Ferry- and local passenger traffic
Coast aux. & cargo
Europe Cargo

Typical services provided by VHF Data. Typical services provided by VHF Data.
TelenorMaritime Radio• System owner• Frequency license• Owner of infrastructure• Operator
Customer segments
Service platform
VHF Data
TrackingElectronic logbook
Payment services
Web Weather forecast
Supplier of ship equipment
•Delivery•Installation•Stocks
•IP-address•Configuration
Off-shore and supply
Fishery Ferry- and local passenger traffic
Coast aux. & cargo
Europe Cargo
Service providers(examples)
• Fishery Authorities• Storm Weather Centre• Interbank payment services• Coastal Authorities• Fishery sales organisations • Machinery control systems

Typical services provided by VHF Data. Typical services provided by VHF Data.
TelenorMaritime Radio• System owner• Frequency license• Owner of infrastructure• Operator
Customer segments
Service platform
VHF Data
SafeSeaNet
TrackingElectronic logbook
Payment services
Web Weather forecast
Supplier of ship equipment
•Delivery•Installation•Stocks
•IP-address•Configuration
Off-shore and supply
Fishery Ferry- and local passenger traffic
Coast aux. & cargo
Europe Cargo
Service providers(examples)
• Fishery Authorities• Storm Weather Centre• Interbank payment services• Coastal Authorities• Fishery sales organisations • Machinery control systems

Typical services provided by VHF Data. Typical services provided by VHF Data.
TelenorMaritime Radio• System owner• Frequency license• Owner of infrastructure• Operator
Customer segments
Service platform
VHF Data
Dynamic weather forecast based on GPS position
TrackingElectronic logbook
Payment services
Web Weather forecast
Supplier of ship equipment
•Delivery•Installation•Stocks
•IP-address•Configuration
Off-shore and supply
Fishery Ferry- and local passenger traffic
Coast aux. & cargo
Europe Cargo
Service providers(examples)
• Fishery Authorities• Storm Weather Centre• Interbank payment services• Coastal Authorities• Fishery sales organisations • Machinery control systems

Typical services provided by VHF Data. Typical services provided by VHF Data.
TelenorMaritime Radio• System owner• Frequency license• Owner of infrastructure• Operator
Customer segments
Service platform
VHF Data
Open to third party application providers.
TrackingElectronic logbook
Payment services
Web Weather forecast
Supplier of ship equipment
•Delivery•Installation•Stocks
•IP-address•Configuration
Off-shore and supply
Fishery Ferry- and local passenger traffic
Coast aux. & cargo
Europe Cargo
Service providers(examples)
• Fishery Authorities• Storm Weather Centre• Interbank payment services• Coastal Authorities• Fishery sales organisations • Machinery control systems

2006年6月20日 19
VHF Data – Contracts as per 2. February 2005
Fosen trafikklag: • Bastøferga (3 ferries)• 9 payment terminals with automatic cashier accounts• (e-mail)• The company owns 18 vessels.
3 X
HSD: • 1 ferry + 1 fast passenger craft• (e-mail)• The company owns 40 vessels
Rødne ship owners: • 1 fast passenger craft• 1 payment terminal• e-mail• maintenance system• The company owns 16 vessels

2006年6月20日 20
VHF Data VHF Data –– competing / complementary systems:competing / complementary systems:VHF data versus some satellite systems VHF data versus some satellite systems
Functionality and data speed
Typical equipment cost
Monthly cost
Inmarsat C
Tracking + SMS
0,6 kbit/sIrridium
Voice + e-mail (2,4 kbit/s)
Inmarsat Fleet 77
Voice + e-mail + internet128 kbit/s)
Inmarsat Fleet 33
Voice + e-mail + internet 9,6 kbit/s up – 28 kbit/s down)
Norsat (fixed)
Voice + e-mail + internet128 kbit/s)
Equipment: € 40.000
Monthly cost: € 3.000
Payment willin
gness / needs
Limited will to pay fo
r
satellite
VHF Data
Tracking + e-mail + internet21 kbit/s - 64 kbit/s)
VHF Data may also penetrate the satellite market:• For long periods the ships are within VHF coverage• Special applications made for VHF Data• Lower costs• Complementary to satellite
Equipment: € 20.000
Monthly cost: € 3.000
Equipment: € 7.500
Monthly cost: € 1.200
Equipment: € 4.500
Monthly cost: € 400
Equipment: € 3.000
Monthly cost: € 400
Equipment: € 2.500
Monthly cost: € 400

2006年6月20日 21
VHF Data VHF Data –– competing / complementary systems:competing / complementary systems:VHF data versus cell phoneVHF data versus cell phone
Data speed and functionality UMTS
Voice + e-mail + internet 386 kbit/s down)
Will not have sufficient coverage for the maritime market.
GPRS
Voice + e-mail + internet 64 kbit/s)
Edge
Voice + e-mail + internet 128 kbit/s
GSM
Voice + e-mail + internet–14,4 kbit/s)
VHF Data
Tracking + e-mail + internet21 kbit/s - 64 kbit/s)
VHF Data for tracking.
GSM for voice and SMS
The customer will make his choice based on:
• coverage / distance to shore
• stability
• functionality
• maritime applications
Stability and coverage

2006年6月20日 22
ShipModular solutions
ANT1-VHF (duplex)narrow ch
ANT2-VHF (simplex)wide ch
MR
outer
eth1
ANT3-2,4 GHzor existing HotSpot hardware
eth3
eth4
eth2
RS232
230V/AC(or 24/48V/DC)
LAN
Cabinet
Existing Satelliteeth5
WiFi Slave for existing HotSpotororMaster for ship LAN
25 / 5 watts
User PC 1
GPS
POS terminal
MR160
MW160
MWLan
MPA160
User PC 2
WiMax?
Market segment: Coastal fishing vessel

2006年6月20日 23
ANT2-VHF (simplex)wide ch
MR
outer
eth1
ANT3-2,4 GHzor existing HotSpot hardware
eth3
eth4
eth2
RS232
230V/AC(or 24/48V/DC)
LAN
Cabinet
Existing Satelliteeth5
orMaster for ship LAN
25 / 5 watts
User PC 1
GPS
POS terminal
MR160
MW160
MWLan
User PC 2WiMax?
Market segment: Ocean Fishing vessels
ShipModular solutions
Market segment: Offshore / supply

2006年6月20日 24
ANT2-VHF (simplex)wide ch
MR
outer
eth1
ANT3-2,4 GHzor existing HotSpot hardware
eth3
eth4
eth2
RS232
230V/AC(or 24/48V/DC)
LAN
Cabinet
Existing Satelliteeth5
Slave for existing HotSpotorMaster for ship LAN
25 / 5 watts
User PC 1
GPS
POS terminal
MR160
MW160
MWLan
User PC 2
”Narrowband”/ Wlane-post / web / maintenance system / payment
servicesCost appr. € 1.500 + payment terminal
WiMax?
Market segment: Ferry and high speed passenger
ShipModular solutions

SpecificationMain Engine
Performance model
Hual Asia and Hual TraderRevision: 0.i.2Date: 5th of May 2006
Specification_ME_performance_model_H_Asia_and_Hual_Trader_2006-05-05.xls Page 1 of 29

Indexing This specification describes calculations used to decide main engine performance. The performance is a sum of index values calculated from measurements. The index values range from 0 to 100 where 0 is extreme unacceptable performance and 100 is design performance. The measurements and calculated index values are kept in a database. The index values make it easier to interpret and compare performance over time and between similar units as ships, engines, turbochargers, etc. Values and corresponding time are presented in tables and graphs. It is advantageous to run the performance tests collecting measurements at steady state at the same service condition each time for better quality in measurements and index model results. The model is more correct near the recommended power of 85% of MCR.
Summation of indexes An index tree is used to structure the main engine performance and to sum up measurements from performance tests. Summation of indices into higher level indices in the index tree is done by functions like weighted sum, mean, worst case, etc. Refer index tree in this specification.
Converting measurements to index values The example in figure 1 illustrates how measurements are converted into index values. Ideal relation between cylinder maximum pressure (Pmax) and mean effective pressure (MEP) from project guide is shown as the blue line. The slope of this curve is used to correct Pmax measured at (1) to Pmax at standard MEP (15.14 bar) at (2). Correction of Pmax to a standard MEP is essential if measurements shall be comparable through time. The index function (red, yellow and green lines) convert the corrected value (2-3-4) to an index value [0,100] and a status; red, yellow or green. Figure1: Conversion of cylinder maximum pressure measured (1) to corrected value (2-3-4) to index value (5).
Ideal performance
120
125
130
135
140
145
14.5 15 15.5 16 16.5 17 17.5 18 18.5
MEP
Pmax
1
23
Ref
Index function
0
20
40
60
80
100
120
116.00 119.00 122.00 125.00 128.00 131.00 134.00 137.00 140.00
Pmax
Inde
x
3
5
Ref
4

Results Example of result presentation in the software TeCoView is shown in figure 2 below. At left the corrected measurements are presented as points interconnected with straight lines. At right the corresponding index values are presented as points interconnected with a step curve to indicate that index values are valid until new values are obtained. The results below show that engine performance with respect to Pmax has improved and is acceptable after 2003.
Figure 2: Example of how results are presented in the Technical Condition Viewer. It is important to have in mind that low index values can be caused by:
- Bad performance. - Bad instrumentation. - Bad registration.
Instrumentation and registration quality should be checked before erroneous conclusions to poor performance. Results are also presented in reports that easier can be submitted to the ships. These reports are also in use at office. The reports focus on the performance at a high level and at measurement level where follow-up and attention are required, respectively red or yellow status.
Reference documentation Reference documents used to develop indexes are performance tests, sea-trials, shop tests, project guides, experience and statistics.

1 Main engine performance
1.3 Balance
1.2 Efficiency
WSum
10 x
10 x
1.4 Degradation10 x
1.1 Quality measurements0 x
1.1 Quality measurements
Mean
1.1.3 Power(torsio) / Pscav [Ref. M3]
1.1.2 Power(MEP,rpm) / Pscav [Ref. M2]
1.1.4 Power(torsio) / Power (MEP,rpm) [Ref. M4]
1.1.1 Fuel pump index / MEP [Ref. M1]
Specification_ME_performance_model_H_Asia_and_Hual_Trader_2006-05-05.xls Page 4 of 29

1.2 Efficiency
Wsum
1.2.3 Fuel pumps
1.2.2 Turbochargers
1.2.4 Scavenging air receivers
1.2.1 SFOC [Ref. M5]
1.2.5 Cylinders
1.2.2.1 Turbocharger 1
1.2.2.2-x Turbocharger 2 - x [Ref. 1.2.2.1]
1.2.2.1.1 TempExh inlet TC1 [Ref. M6]
1.2.2.1.2 TempdropExh TC1 [Ref. M7]
Mean
10 x
25 x
15 x
25 x
25 x
Mean
1.2.3.1 IndexAverage FPs [Ref. M8]
1.2.3.2 VIT_Average FPs [Ref. M9]
Mean
1.2.4.1 Pscav Receiver [Ref. M10]
1.2.3.2 PmaxAverage Cyl [Ref. M11]
Specification_ME_performance_model_H_Asia_and_Hual_Trader_2006-05-05.xls Page 5 of 29

1.3 Balance
Wsum
1.3.1 Fuel pumps
1.3.1.1 Fuel pump 1
1.3.1.2-x Fuel pump 2 - x [Ref. 1.3.1.1]
1.3.1.1.1 IndexDev FP1 [Ref. M12]
1.3.1.1.2 VIT_Dev FP1 [Ref. M13]
Mean
25 x
Mean
1.3.2 Cylinders
1.3.2.1 Cylinder 1
1.3.2.2-x Cylinder 2 - x [Ref. 1.3.2.1]
1.3.2.1.1 TempExhDev Cyl1 [Ref. M14]
1.3.2.1.2 PmaxDev Cyl1 [Ref. M15]
Mean
75 x
Wsum
1.3.2.1.3 MEP_Dev Cyl1 [Ref. M16]
30 x
40 x
40 x
Specification_ME_performance_model_H_Asia_and_Hual_Trader_2006-05-05.xls Page 6 of 29

1.4 Degradation
Wsum
1.4.1 Turbochargers
1.4.1.1 Turbocharger 1
1.4.1.2-x Turbocharger 2 - x [Ref. 1.4.1.1]
1.4.1.1.1 Pdrop Filter TC1 [Ref. M17]
1.4.1.1.2 TdropExh TC1 [Ref. M18]
Mean
30 x
Wsum
1.4.2 Fuel pumps
1.4.2.2-x Index FP2 - x [Ref. 1.4.2.1]
1.4.2.1 Index FP1 [Ref. M20]
20 x
1.4.1.1.3 Rot_freq. TC1 [Ref. M19]
1.4.3 Scavenging air coolers
1.4.4 Cylinders
1.4.4.1 Cylinder 1
1.4.4.2 Cylinder 2 - x [Ref. 1.4.4.1]
1.4.4.1.1 Pcomp Cyl 1 [Ref. M22]
1.4.4.1.1.2 TempExh Cyl1 [Ref. M23]
Mean
40 x
Mean
10 x
10 x
40 x
50 x
Mean
1.4.3.2-x Pdrop ScavCool2 - x [Ref. 1.4.3.1]
1.4.3.1 Pdrop ScavCool1 [Ref. M21]
Mean
Specification_ME_performance_model_H_Asia_and_Hual_Trader_2006-05-05.xls Page 7 of 29

M1. Fuel pump index / MEP {to be defined}
M2. Power(MEP,rpm) / Pscav {to be defined}
M3. Power(torsio) / Pscav {to be defined}
M4. Power(torsio) / Power (MEP,rpm)
Acceptable deviation between power from torsiometer and power calculated from MEP and rpm given in index function.
Reference value:1.00 01.00 100
Index functionSFOC Index From reference
0.90 0 -10.0 %0.96 80 -4.0 %0.97 90 -3.0 %0.98 100 -2.0 %1.02 100 2.0 % 1.03 90 3.0 %1.04 80 4.0 %1.10 0 10.0 %
Fuel pump (i) index [-]
020406080
100120
0.85 0.9 0.95 1 1.05 1.1 1.15
User function
Tech
nica
l Con
ditio
n In
dex
(TC
I)
Specification_ME_performance_model_H_Asia_and_Hual_Trader_2006-05-05.xls Page 8 of 29

M5. SFOC
Ideal performance 75 85 100 [%]SFOCBHP 129.58 130.13 130.95 [g/BHP]SFOCkWh 173.69 174.43 175.54 [g/kWh]
Reference value:173.70 0 75173.70 100 75
Calculated value:
Index functionValue Index From reference147.6 0 -15.0 %165.0 80 -5.0 %169.4 90 -2.5 %173.7 100 0.0 %182.4 100 5.0 %186.7 90 7.5 %191.1 80 10.0 %225.8 0 30.0 %
Specific fuel oil consumption [g/kWh]
020406080
100120
145.0 165.0 185.0 205.0 225.0
User function
Tech
nica
l Con
ditio
n In
dex
(TC
I)
Specific fuel oil consumption [g/kWh]
173.00173.50174.00174.50175.00175.50176.00
70 75 80 85 90 95 100
Engine load [%]
SFO
C
( ) ( )[ ] 100025_0006,025_0002,0142700][
⋅−−−−⋅⎟⎟⎠
⎞⎜⎜⎝
⎛⋅= measmeas
meas
meas
meas scavTairTLCHV
kWSHPFOC
SFOC
Specification_ME_performance_model_H_Asia_and_Hual_Trader_2006-05-05.xls Page 9 of 29

M6. TempExh inlet TC1
Ideal performance
Engine power 75 85 100 [%]Texh_T/C_inlet 350 365 386 [˚C]BHPM_meas 2097.66 2370.35 2773.94 [BHP]Power 1564.85 1768.28 2069.36 [kW]
Reference value:364.52 0 1768.28364.52 100 1768.28
Calculated value:
K exh_temp = 0.0714
Index functionValue Index From reference309.8 0 -15.0 %337.2 80 -7.5 %341.7 90 -6.3 %346.3 100 -5.0 %391.9 100 7.5 %401.0 90 10.0 %410.1 80 12.5 %455.6 0 25.0 %
2 1
2 1
_ _ _ __ _ T exh inlet T exh inletK exh tempPower Power
−=
−
Exhaust inlet temperature [°C]
020406080
100120
300.0 350.0 400.0 450.0
User Function
Tech
nica
l Con
ditio
n in
dex
(TC
I)
Exhaust inlet temperature [°C]
330340350360370380390400
1500.00 1600.00 1700.00 1800.00 1900.00 2000.00 2100.00
Power
Exha
ust t
empe
ratu
re
1_
( )n
measi
M meas
BHP iBHP
n==∑
( ) ( ) ( ) ( )( )( ) ( ) ( )( )
3_ _ _ _ _
3_ _
25 2.466 10 273
25 0.59 10 273
exh corr exh meas exh temp ref meas eng room exh meas
cool water exh meas
T T K power Power T T
T T
−
−
= + ⋅ − + − ⋅ − ⋅ ⋅ +
+ − ⋅ − ⋅ ⋅ +
Specification_ME_performance_model_H_Asia_and_Hual_Trader_2006-05-05.xls Page 10 of 29

M7. TempdropExh inlet TC1
Ideal performanceMEP(i)meas= MIP(i)meas - 0,94 [Bar]
Engine power 75 85 100 [%]Texh_T/C_inlet 350 365 386 [˚C]Texh_T/C_outlet 231 233 236 [˚C]∆T T/C_exh (∆Ti) 119 132 150 [˚C]MEPmeas 13.92 15.14 16.93 [bar]
Reference value:131.56 0 15.14131.56 100 15.14
Calculated reference:
K ∆T_T/C_exh = 10.2990
Index functionValue Index From reference
98.7 0 -25.0 %111.8 80 -15.0 %115.1 90 -12.5 %118.4 100 -10.0 %138.1 100 5.0 %139.8 90 6.3 %141.4 80 7.5 %164.5 0 25.0 %
Exhaust temperature drop [°C]
020406080
100120
95.0 115.0 135.0 155.0
User function
Tech
nica
l Con
ditio
n In
dex
(TC
I)
12
12_/_ MEPMEP
TTK exhCTT −∆−∆
=∆
( )measMrefexhCTTmeascorr MEPMEPKexhCTTexhCTT __/__/__/_ −+∆=∆ ∆
KnBHPiMEP meas ⋅
=)(
Exhaust temperature drop [°C]
100110120130140150160
13.50 14.50 15.50 16.50 17.50
MEP
Exh.
Tem
p. d
rop
Specification_ME_performance_model_H_Asia_and_Hual_Trader_2006-05-05.xls Page 11 of 29

M8. IndexAverage FPs
Ideal performance
0.966 [kg/l] 966 [kg/m³] 9690 [kcal/kg] 40570 [kJ/kg]
Engine load 0 75 85 100 [%]FPImeas -8.833 66.86 72.86 81.86 [-]MEPmeas 0 13.92 15.14 16.93 [bar]
Reference value:72.86 0 15.1472.86 100 15.14
Calculated value:
Kmep = 5.3958
Index functionValue Index From reference61.93 0 -15.0 %69.22 80 -5.0 %71.04 90 -2.5 %72.86 100 0.0 %80.15 100 10.0 %81.97 90 12.5 %83.79 80 15.0 %91.08 0 25.0 %
LCHVSTLCHVSpec. fuel grav. 15˚C Spec_ grav_ 15˚CST
Average Fuel pump index [-]
020406080
100120
60.00 65.00 70.00 75.00 80.00 85.00 90.00 95.00
User function
Tech
nica
l Con
ditio
n In
dex
(TC
I)
Average fuel pump index [-]
65.00
70.00
75.00
80.00
13 14 15 16 17 18
MEP
FPI
12
12
MEPMEPFPIFPIK mep −
−=
( )( )⋅−+= measMrefmepmeasMcorrM MEPMEPKindexpumpFuelindexpumpFuel ___ ____
⎟⎟⎠
⎞⎜⎜⎝
⎛⋅
°°
ST
meas
ST
meas
LCHVLCHV
CgravSpecCgravSpec
15__15__
1_
( )n
measi
M meas
FPI iFPI
n==∑
Specification_ME_performance_model_H_Asia_and_Hual_Trader_2006-05-05.xls Page 12 of 29

M9. VIT_Average FPs
Ideal performanceEngine load 75 85 100 [%]VITmeas 5.85 5.54 5.07 [-]
Reference value:5.54 0 855.54 100 85
Calculated value:
Index functionValue Index From reference
0.55 0 -90.0 %3.32 80 -40.0 %3.87 90 -30.0 %4.43 100 -20.0 %6.64 100 20.0 %7.20 90 30.0 %7.75 80 40.0 %8.86 0 60.0 %
n
iVITVIT
n
imeasind
Mind
∑== 1
_
_
)(
Average VIT index [-]
020406080
100120
0.00 2.00 4.00 6.00 8.00 10.00
User function
Tech
nica
l Con
ditio
n In
dex
(TC
I)
Average VIT index [-]
5.00
5.20
5.40
5.60
5.80
6.00
70 75 80 85 90 95 100
Engine load [%]VI
T in
dex
Specification_ME_performance_model_H_Asia_and_Hual_Trader_2006-05-05.xls Page 13 of 29

M10. Pscav Receiver
Ideal performance
Engine load 75 85 100 [%]Scav_air_press 1.70 2.04 2.55 [bar]BHP 2097.66 2370.35 2773.94 [BHP]Power 1564.85 1768.28 2069.36 [kW]
Reference value:2.04 0 1768.282.04 100 1768.28
Calculated value:
K_scav = 0.0017
Index functionValue Index From reference
1.43 0 -30.0 %1.73 80 -15.0 %1.81 90 -11.3 %1.89 100 -7.5 %2.19 100 7.5 %2.27 90 11.3 %2.35 80 15.0 %2.55 0 25.0 %
Scavenging air receiver pressure [bar]
020406080
100120
1.40 1.70 2.00 2.30 2.60
User function
Tech
nica
l Con
ditio
n In
dex
(TC
I)
( )_ _ _( 25) 0, 002856corr meas Pscav ref M meas Eng room meas measPscav Pscav K Power Power T Pscav= + − + − ⋅ ⋅
Scavenging air pressure [bar]
1.501.701.902.102.302.502.70
1500.00 1600.00 1700.00 1800.00 1900.00 2000.00 2100.00
Power [kW]
scav
. air
pres
sure
2 1
2 1Pscav
Pscav PscavKPower Power
−=
−
1_
( )n
measi
M meas
BHP iBHP
n==∑
Specification_ME_performance_model_H_Asia_and_Hual_Trader_2006-05-05.xls Page 14 of 29

M11. PmaxAverage Cyl
Ideal performance
Engine load 75 85 100 [%]Pmax 129 140 140 [bar]MEP 14.9 16.1 18.0 [bar]MEPmeas 13.92 15.14 16.93 [bar]
Reference value:131.16 0 15.14131.16 100 15.14
Calculated value:
KPmax = 9.0164
Index functionValue Index From reference91.81 0 -30.0 %
121.33 80 -7.5 %122.97 90 -6.3 %124.61 100 -5.0 %134.44 100 2.5 %135.10 90 3.0 %135.75 80 3.5 %150.84 0 15.0 %
n
iPP
n
imeas
measM
∑== 1
_
)max(max
n
iMEPMEP
n
imeas
measM
∑== 1
_
)(
Cylinder maximum pressure [bar]
020406080
100120
90.00 100.00 110.00 120.00 130.00 140.00 150.00
User function
Tech
nica
l Con
ditio
n In
dex
(TC
I)
12
12max
maxmaxMEPMEPPPK P −
−=
( )_ max _
3_
max max
( 25) 2,198 10 (1 max )M corr meas P ref M meas
eng room meas
P P K MEP MEP
T P−
= + −
+ − ⋅ ⋅ ⋅ +
Average cylinder max pressure [bar]
120
125
130
135
140
145
14.5 15.5 16.5 17.5 18.5
MEP
Pmax
Specification_ME_performance_model_H_Asia_and_Hual_Trader_2006-05-05.xls Page 15 of 29
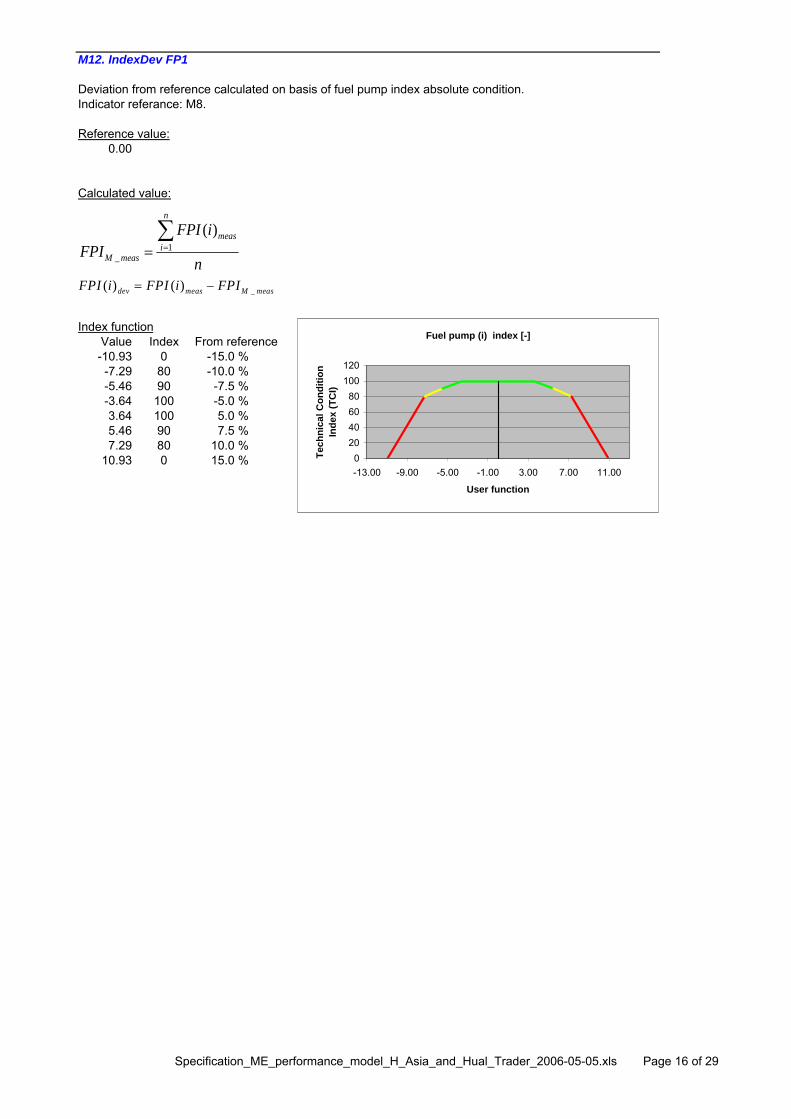
M12. IndexDev FP1
Deviation from reference calculated on basis of fuel pump index absolute condition. Indicator referance: M8.
Reference value:0.00 00.00 100
Calculated value:
Index functionValue Index From reference-10.93 0 -15.0 %-7.29 80 -10.0 %-5.46 90 -7.5 %-3.64 100 -5.0 %3.64 100 5.0 %5.46 90 7.5 %7.29 80 10.0 %
10.93 0 15.0 %
Fuel pump (i) index [-]
020406080
100120
-13.00 -9.00 -5.00 -1.00 3.00 7.00 11.00
User function
Tech
nica
l Con
ditio
n In
dex
(TC
I)
_( ) ( )dev meas M measFPI i FPI i FPI= −
1_
( )n
measi
M meas
FPI iFPI
n==∑
Specification_ME_performance_model_H_Asia_and_Hual_Trader_2006-05-05.xls Page 16 of 29

M13. VIT_Average FPs
Deviation from reference calculated on basis of fuel pump average VIT index absolute condition.Indicator referance: M9.
Reference value:0.00 00.00 100
Calculated value:
Index functionValue Index From reference-0.83 0 -15.0 %-0.55 80 -10.0 %-0.42 90 -7.5 %-0.28 100 -5.0 %0.28 100 5.0 %0.42 90 7.5 %0.55 80 10.0 %0.83 0 15.0 %
n
iVITVIT
n
imeasind
measM
∑== 1
_
_
)(
measMmeasinddev VITiVITiVIT __)()( −=
Fuel pump (i) VIT index [-]
020406080
100120
-1.00 -0.50 0.00 0.50 1.00
User function
Tech
nica
l Con
ditio
n In
dex
(TC
I)
Specification_ME_performance_model_H_Asia_and_Hual_Trader_2006-05-05.xls Page 17 of 29

M14. TempExhDev Cyl1
Deviation from reference calculated on basis of exhaust inlet temperature absolute condition. Indicator referance: M6.
Reference value:0.00 00.00 100
Calculated value:
Index functionValue Index From reference-36.45 0 -10.0 %-27.34 80 -7.5 %-22.78 90 -6.3 %-18.23 100 -5.0 %18.23 100 5.0 %22.78 90 6.3 %27.34 80 7.5 %36.45 0 10.0 %
Cylinder (i) exhaust temperature [°C]
020406080
100120
-40.00 -20.00 0.00 20.00 40.00
User function
Tech
nica
l Con
ditio
n In
dex
(TC
I)
n
inletCTTexhinletCTTexh
n
im easM
∑== 1
_
_/__/_
m easMm easdev inletCTTexhinletCTTexhinletCTTexh __/__/__/_ −=
Specification_ME_performance_model_H_Asia_and_Hual_Trader_2006-05-05.xls Page 18 of 29

M15. PmaxDev Cyl1
Deviation from reference calculated on basis of cylinder maximum pressure absolute condition. Indicator referance: M11.
Reference value:0.00 00.00 100
Calculated value:
Index functionValue Index From reference-10.49 0 -8.0 %-6.56 80 -5.0 %-5.25 90 -4.0 %-3.93 100 -3.0 %3.93 100 3.0 %5.25 90 4.0 %6.56 80 5.0 %
10.49 0 8.0 %
M16. MEP_Dev Cyl1
Deviation from reference calculated on basis of MEP_ref.
Reference value:0.00 1000.00 0
Calculated value:
Index functionValue Index From reference-1.51 0 -10.0 %-0.76 80 -5.0 %-0.61 90 -4.0 %-0.45 100 -3.0 %0.45 100 3.0 %0.61 90 4.0 %0.76 80 5.0 %1.51 0 10.0 %
measMmeasdev PiPP _max)max(max −=
Cylinder (i) maximum pressure [bar]
020406080
100120
-12.00 -8.00 -4.00 0.00 4.00 8.00 12.00
User function
Tech
nica
l Con
ditio
n In
dex
(TC
I)
Cylinder (i) mean effective pressure [bar]
020406080
100120
-1.60 -1.10 -0.60 -0.10 0.40 0.90 1.40
User function
Tech
nica
l Con
ditio
n In
dex
(TC
I)
n
iPP
n
im eas
m easM
∑== 1
_
)max(max
n
iMEPMEP
n
im eas
m easM
∑== 1
_
)(
m easMm easdev MEPiMEPMEP _)( −=
Specification_ME_performance_model_H_Asia_and_Hual_Trader_2006-05-05.xls Page 19 of 29

M17. Pdrop Filter TC1
Scavenging air pressure from "Introduction for 46 - 98 MC type engines operation" Edition 40E page 196.
Model performance1 2
Scav_air_pressmeas 2.00 3.00 [bar]Air_filter∆p(i) 27.0 43.0 [mmWc]
Calculated model value:Kscav_air_press = 16.00
Air filter pressure drop are not given in "Report of Sea Trial". Estimated from "Hual Asia Engine performance data sheet"from 0501 dated 2004-11-21, lowest value at T/C pressure drop.Scav_air_press0 from "Hual Asia Engine Performance data sheet" from 0501.
Ideal performance0501 ref
Air_filter∆p0 12.0 12.66 [mmWc]Scav_air_press0 1.95 2.04 [bar]
Reference value:12.66 0 2.0412.66 100 2.04
Calculated value:
KPscav_cailbrated = 7.2934
Index functionValue Index From reference
7.59 0 -40.0 %10.13 80 -20.0 %10.76 90 -15.0 %11.39 100 -10.0 %15.19 100 20.0 %16.45 90 30.0 %17.72 80 40.0 %22.78 0 80.0 %
Turbocharger (i) air filter pressure drop [mmWc]
020406080
100120
6.00 11.00 16.00 21.00
User function
Tech
nica
l Con
ditio
n In
dex
(TC
I)
12
12__ PscavPscav
ppK pressairscav −∆−∆
=
( )_ _ _filter corr filter meas Pscav calibrated ref measp p K Pscav Pscav∆ = ∆ + −
Air filter pressure drop [mmWC]
11.8
12.0
12.2
12.4
12.6
12.8
1.94 1.96 1.98 2 2.02 2.04
Scavenge air pressure [bar]
Air
filte
r pre
ssur
e dr
op
0 1_
1 0Pscav calibrated Pscav
p PscavK Kp Pscav
∆ ⋅= ⋅
∆ ⋅
Specification_ME_performance_model_H_Asia_and_Hual_Trader_2006-05-05.xls Page 20 of 29

M18. TdropExh TC1
Ideal performance
Engine load 75 85 100 [%]Texh_T/C_inlet 350 365 386 [˚C]Texh_T/C_outlet 231 233 236 [˚C]∆T T/C_exh (∆Ti) 119 132 150 [˚C]MEPmeas 13.92 15.14 16.93 [bar]
Reference value:131.56 0 15.14131.56 100 15.14
Calculated value:
K ∆T_T/C_exh = 10.2990
Index functionValue Index From reference98.67 0 -25.0 %
111.83 80 -15.0 %115.12 90 -12.5 %118.41 100 -10.0 %138.14 100 5.0 %139.79 90 6.3 %141.43 80 7.5 %164.46 0 25.0 %
Turbocharger (i) exhaust temperature drop [°C]
020406080
100120
95.00 115.00 135.00 155.00
User function
Tech
nica
l Con
ditio
n In
dex
(TC
I)
n
iMEPMEP
n
imeas
measM
∑== 1
_
)(
12
12_/_ MEPMEP
TTK exhCTT −∆−∆
=∆
( )measMrefexhCTTmeascorr MEPMEPKexhCTTexhCTT __/__/__/_ −+∆=∆ ∆
Exhaust temperature drop [°C]
100110120130140150160
13.50 14.50 15.50 16.50 17.50
MEP
Exha
ust t
empe
ratu
re
drop
Specification_ME_performance_model_H_Asia_and_Hual_Trader_2006-05-05.xls Page 21 of 29

M19. Rot_freq. TC1
Ideal performanceEngine load 75 85 100 [%]T/C_RPMmeas 11133 11720 12600 [rpm]Scav_air_press 1.7 2.04 2.55 [bar]
Reference value:11720.00 0 2.0411720.00 100 2.04
Calculated value:
KT/C_RPM = 1725.88
Index functionValue Index From reference
9962.00 0 -15.0 %11134.00 80 -5.0 %11280.50 90 -3.8 %11427.00 100 -2.5 %12013.00 100 2.5 %12159.50 90 3.8 %12306.00 80 5.0 %14064.00 0 20.0 %
Turbocharger (i) rotational frequency [rpm]
020406080
100120
10000.00 11000.00 12000.00 13000.00 14000.00
User function
Tech
nica
l Con
ditio
n In
dex
(TC
I)
12
12_/
_/_/PscavPscav
RPMCTRPMCTK RPMCT −−
=
( )/ _/ _ / _corr meas T C RPM ref measT C RPM T C RPM K Pscav Pscav= + −
Turbocharger rotational frequency [rpm]
11000113001160011900122001250012800
1.6 1.8 2 2.2 2.4 2.6
Scavenge air pressureR
otat
iona
l fre
quen
cy
Specification_ME_performance_model_H_Asia_and_Hual_Trader_2006-05-05.xls Page 22 of 29

M20. Index FP1
Ideal performance
0.966 [kg/l] 966 [kg/m³] 9690 [kcal/kg] 40570.09 [kJ/kg]
Engine load 0 75 85 100 [%]FPImeas -8.833 66.86 72.86 81.86 [-]MEP(i)meas 0 13.92 15.14 16.93 [bar]
Reference value:72.86 0 15.1472.86 100 15.14
Calculated reference:
KFuel_pump_index= 5.3958
Index functionValue Index From reference61.93 0 -15.0 %69.22 80 -5.0 %71.04 90 -2.5 %72.86 100 0.0 %80.15 100 10.0 %81.97 90 12.5 %83.79 80 15.0 %91.08 0 25.0 %
LCHVSTSpec. fuel grav. 15˚C Spec_ grav_ 15˚CST LCHV
Fuel pump (i) index [-]
020406080
100120
60.00 65.00 70.00 75.00 80.00 85.00 90.00 95.00
User function
Tech
nica
l Con
ditio
n In
dex
(TC
I)
2 1
2 1FPI
FPI FPIKMEP MEP
−=
−
Fuel pump (i) index [-]
65.00
70.00
75.00
80.00
85.00
13 14 15 16 17 18
MEP
Fuel
pum
p in
dex
1_
( )n
measi
M meas
FPI iFPI
n==∑
( )( ) _ _15( ) ( )_ _15
meas meascorr meas FPI ref meas
ST ST
Spec grav C LCHVFPI i FPI i K MEP MEPSpec grav C LCHV
⎛ ⎞° ⋅= + ⋅ − ⋅⎜ ⎟° ⋅⎝ ⎠
Specification_ME_performance_model_H_Asia_and_Hual_Trader_2006-05-05.xls Page 23 of 29

M21. Pdrop ScavCool1
Ideal performanceEngine load 75 85 100 [%]Scav_cool∆pmeas 150 164 185 [mmWc]Scav_air_press 1.70 2.04 2.55 [bar]
Reference value:164.00 0 2.04164.00 100 2.04
Calculatd value:
Kcool∆p = 41.1765
Index functionValue Index From reference41.00 0 -75.0 %
131.20 80 -20.0 %147.60 90 -10.0 %164.00 100 0.0 %196.80 100 20.0 %213.20 90 30.0 %229.60 80 40.0 %278.80 0 70.0 %
Scavenging air cooler (i) pressure drop [mmWc]
020406080
100120
40.00 90.00 140.00 190.00 240.00 290.00
User function
Tech
nica
l Con
ditio
n In
dex
(TC
I)
2 1
2 1cooler p
p pKPscav Pscav∆
∆ − ∆=
−
( )_ _ _cool corr cool meas pcool calibrated ref measp p K Pscav Pscav∆∆ = ∆ + −
Scavenging air cooler pressure drop [mmWc]
145
155
165
175
185
1.60 1.80 2.00 2.20 2.40 2.60
scavenging air pressurepr
essu
re d
rop
Specification_ME_performance_model_H_Asia_and_Hual_Trader_2006-05-05.xls Page 24 of 29

M22. Pcomp Cyl 1
Ideal performanceEngine load 75 85 100 [%]Cyl(i)_comp_press 95.0 106.0 125.0 [bar]MEPmeas 13.92 15.14 16.93 [bar]
reference value:106.00 0 15.14106.00 100 15.14
Calculated value:
Kcyl_comp_press_(MEP) 9.9668
Index functionValue Index From reference90.10 0 -15.0 %98.05 80 -7.5 %99.38 90 -6.3 %
100.70 100 -5.0 %111.30 100 5.0 %112.63 90 6.3 %113.95 80 7.5 %137.80 0 30.0 %
2 1
2 1Pcomp
Pcomp PcompKMEP MEP
−=
−
n
iMEPMEP
n
imeas
measM
∑== 1
_
)(
Cylinder (i) compression pressure (MEP) [bar]
020406080
100120
88.00 98.00 108.00 118.00 128.00 138.00
User function
Tech
nica
l Con
ditio
n In
dex
(TC
I)
Cylinder compression pressure (MEP) [bar]
90.0096.00
102.00108.00114.00120.00126.00
13 14 15 16 17 18
MEP
Cyl
inde
r com
pres
sion
pr
essu
re (M
EP) [
bar]
( )( ) ( )
_
3_
( ) ( )
25 2.954 10 1 ( )
corr meas Pcomp ref M meas
eng room meas
Pcomp i Pcomp i K MEP MEP
T Pcomp i−
= + ⋅ −
+ − ⋅ ⋅ ⋅ +
Specification_ME_performance_model_H_Asia_and_Hual_Trader_2006-05-05.xls Page 25 of 29

M23. TempExh Cyl1
Ideal performanceEngine load 75 85 100 [%]Exh temp after cyl 322.83 325.70 330.00 [°C]BHP 2097.66 2370.35 2773.94 [BHP]Power 1564.85 1768.28 2069.36 [kW]
Reference value:325.73 0 1768.28325.73 100 1768.28
Calculated value:
K_exh_temp 0.0143
Index functionValue Index From reference276.9 0 -15.0 %301.3 80 -7.5 %305.4 90 -6.3 %309.4 100 -5.0 %350.2 100 7.5 %358.3 90 10.0 %366.5 80 12.5 %390.9 0 20.0 %
2 1
2 1
_ _ _ __ _ T exh outlet T exh outletK exh tempPower Power
−=
−
( ) ( ) ( ) ( )( )( ) ( ) ( )( )
3_ _ _ _ _
3_ _
25 2.466 10 273
25 0.59 10 273
exh corr exh meas exh temp ref meas eng room exh meas
cool water exh meas
T T K Power Power T T
T T
−
−
= + ⋅ − + − ⋅ − ⋅ ⋅ +
+ − ⋅ − ⋅ ⋅ +
Exhaust gas temperature after cylinder [°C]
320.00
323.00
326.00
329.00
332.00
335.00
1500.00 1650.00 1800.00 1950.00 2100.00
Power [kW]
Exha
ust g
as te
mpe
ratu
re
Exhaust gas temperature after cylinder [°C]
020406080
100120
270.0 290.0 310.0 330.0 350.0 370.0 390.0
User function
Tech
nica
l Con
ditio
n In
dex
(TC
I)
Specification_ME_performance_model_H_Asia_and_Hual_Trader_2006-05-05.xls Page 26 of 29

Index-tree 2006-03-21 Index tree changedSpecific fuel oil consumption (SFOC) 2006-01-03 Operational reference load changed to 80 % for easy comparence to other ships.Specific fuel oil consumption (SFOC) 2006-01-18 Operational reference load changed to 85 %, Limits set by absolute deviation removed.Specific fuel oil consumption (SFOC) 2006-02-23 Acceptable limits for lowest value changed to include possible variationsSpecific fuel oil consumption (SFOC) 2006-03-21 Layout changedExhaust inlet temperature 2006-01-18 New indicator added to the specification.Exhaust inlet temperature 2006-02-23 Acceptable limits for lowest value changed to include possible variationsExhaust inlet temperature 2006-03-21 Layout changedExhaust temperature drop 2006-01-03 Operational reference load changed to 80 %.Exhaust temperature drop 2006-01-18 Operational reference load changed to 85 %, Limits set by absolute deviation removed.Exhaust temperature drop 2006-02-23 Acceptable limits for lowest value changed to include possible variationsExhaust temperature drop 2006-03-21 Layout changedAverage VIT index 2006-01-03 Operational reference load changed. Limits set by percentage deviation changed.Average VIT index 2006-01-18 Operational reference load changed to 85 %, Limits set by absolute deviation removed.Average VIT index 2006-02-23 Acceptable limits for lowest value changed to include possible variationsAverage VIT index 2006-03-21 Layout changedAverage Fuel pump index 2006-01-03 Operational reference load changed to 80 %.Average Fuel pump index 2006-01-18 Operational reference load changed to 85 %, Limits set by absolute deviation removed.Average Fuel pump index 2006-02-23 Acceptable limits for lowest value changed to include possible variationsAverage Fuel pump index 2006-03-21 Layout changedScavenging air pressure 2006-01-03 Operational reference load changed to 80 %.Scavenging air pressure 2006-01-18 Operational reference load changed to 85 %, Limits set by absolute deviation removed.Scavenging air pressure 2006-02-23 Acceptable limits for lowest value changed to include possible variationsScavenging air pressure 2006-03-21 Layout changedAverage Cylinder max pressure 2006-01-03 Operational reference load changed. Limits set by percentage deviation changed.Average Cylinder max pressure 2006-01-18 Operational reference load changed to 85 %, Limits set by absolute deviation removed.Average Cylinder max pressure 2006-03-21 Layout changedVIT index balance 2006-01-03 Limits changed. Now set by percentage deviation of reference load.VIT index balance 2006-01-18 Operational reference load changed to 85 %, Limits set by absolute deviation removed.VIT index balance 2006-03-21 Layout changedFuel pump index balance 2006-01-03 Limits changed. Now set by percentage deviation of reference load.Fuel pump index balance 2006-01-18 Operational reference load changed to 85 %, Limits set by absolute deviation removed.Fuel pump index balance 2006-03-21 Layout changedExhaust temperature balance 2006-01-18 Limits changed. Now set by percentage deviation of reference load.Exhaust temperature balance 2006-03-21 Layout changedCylinder max pressure balance 2006-01-03 Limits changed. Now set by percentage deviation of reference load.Cylinder max pressure balance 2006-01-18 Operational reference load changed to 85 %, Limits set by absolute deviation removed.Cylinder max pressure balance 2006-03-21 Layout changedMean effective pressure balance 2006-01-03 Limits changed. Now set by percentage deviation of reference load.Mean effective pressure balance 2006-01-18 Operational reference load changed to 85 %, Limits set by absolute deviation removed.Mean effective pressure balance 2006-03-21 Layout changedAir filter pressure drop 2006-01-03 Operational reference load changed. Limits set by percentage deviation changed.Air filter pressure drop 2006-01-18 Operational reference load changed to 85 %, Limits set by absolute deviation removed.Air filter pressure drop 2006-03-21 Layout changedExhaust temperature drop 2006-01-03 Operational reference load changed to 80 %.Exhaust temperature drop 2006-01-18 Operational reference load changed to 85 %, Limits set by absolute deviation removed.Exhaust temperature drop 2006-02-23 Acceptable limits for lowest value changed to include possible variationsExhaust temperature drop 2006-03-21 Layout changedRotational frequency 2006-01-03 Operational reference load changed. Measured values changed.Rotational frequency 2006-01-18 Operational reference load changed to 85 %, Limits set by absolute deviation removed.Rotational frequency 2006-02-23 Acceptable limits for lowest value changed to include possible variationsRotational frequency 2006-03-21 Layout changed

Air filter pressure drop relative condition 2006-01-03 Limits changed. Now set by percentage deviation of reference load.Air filter pressure drop relative condition 2006-01-18 Operational reference load changed to 85 %, Limits set by absolute deviation removed.Air filter pressure drop relative condition 2006-03-21 Indicator removed from specificationExhaust inlet temperature relative condition 2006-01-18 Limits changed. Now set by percentage deviation of reference load.Exhaust inlet temperature relative condition 2006-01-18 Limits changed. Now set by percentage deviation of reference load.Exhaust inlet temperature relative condition 2006-03-21 Indicator removed from specificationRotational frequency relative codition 2006-01-03 Limits changed. Now set by percentage deviation of reference load.Rotational frequency relative codition 2006-01-18 Operational reference load changed to 85 %, Limits set by absolute deviation removed.Rotational frequency relative codition 2006-02-23 Acceptable limits for lowest value changed to include possible variationsRotational frequency relative codition 2006-03-21 Indicator removed from specificationFuel pump index deviation 2006-01-03 Limits changed. Now set by percentage deviation of reference load.Fuel pump index deviation 2006-01-18 Operational reference load changed to 85 %, Limits set by absolute deviation removed.Fuel pump index deviation 2006-02-23 Acceptable limits for lowest value changed to include possible variationsFuel pump index 2006-02-23 FPI changed from deviation to absolute valueFuel pump index 2006-03-21 Layout changedScavenging air cooler (i) pressure drop 2006-01-03 Operational reference load changed to 80 %.Scavenging air cooler (i) pressure drop 2006-01-18 Operational reference load changed to 85 %, Limits set by absolute deviation removed.Scavenging air cooler (i) pressure drop 2006-02-23 Acceptable limits for lowest value changed to include possible variationsScavenging air cooler (i) pressure drop 2006-03-21 Layout changedScav air cooler pressure drop relative condition 2006-01-03 Limits changed. Now set by percentage deviation of reference load.Scav air cooler pressure drop relative condition 2006-01-18 Operational reference load changed to 85 %, Limits set by absolute deviation removed.Scav air cooler pressure drop relative condition 2006-03-21 Indicator removed from specificationCompression pressure (MEP) 2006-01-03 Operational reference load changed. Limits set by percentage deviation changed.Compression pressure (MEP) 2006-01-18 Operational reference load changed to 85 %, Limits set by absolute deviation removed.Compression pressure (MEP) 2006-02-23 Acceptable limits for lowest value changed to include possible variationsCompression pressure (MEP) 2006-03-21 Layout changedCompression pressure (Scav) 2006-01-03 Operational reference load changed. Limits set by percentage deviation changed.Compression pressure (Scav) 2006-01-18 Operational reference load changed to 85 %, Limits set by absolute deviation removed.Compression pressure (Scav) 2006-02-23 Acceptable limits for lowest value changed to include possible variationsCompression pressure (Scav) 2006-03-21 Indicator removed from specificationCompression pressure deviation 2006-01-03 Limits changed. Now set by percentage deviation of reference load.Compression pressure deviation 2006-01-18 Operational reference load changed to 85 %, Limits set by absolute deviation removed.Compression pressure deviation 2006-02-23 Acceptable limits for lowest value changed to include possible variationsCompression pressure deviation 2006-03-21 Indicator removed from specificationExhaust outlet temperature 2006-01-18 New indicator added to the specification.Exhaust outlet temperature 2006-02-23 Acceptable limits for lowest value changed to include possible variationsExhaust outlet temperature 2006-03-21 Layout changed

Variable in u.f. TOCC tag name Höegh tag name
SFOC L.Hoegh_Asia_Engine specific fuel oil consumptionFOCmeas L.Hoegh_Asia_Engine fuel oil consumption FO_KG_HRSHP[kW]meas L.Hoegh_Asia_Shaft torsion meter power indicator SHPLCHVmeas L.Hoegh_Asia_Engine fuel heat value FO_HEAT_VALT_eng_roommeas L.Hoegh_Asia_Ship engine room temperature AIR_TEMP_ENG_RT_scavmeas L.Hoegh_Asia_Scavenging air receiver 1 temperature REC_TEMPTexh_T/C_inletmeas L.Hoegh_Asia_Turbocharger 1exhaust gas inlet temperature EXH_TEMP1Texh_T/C_inletmeas L.Hoegh_Asia_Turbocharger 2exhaust gas inlet temperature EXH_TEMP2Texh_T/C_outletmeas L.Hoegh_Asia_Turbocharger 1exhaust gas outlet temperature OUTLET1Texh_T/C_outletmeas L.Hoegh_Asia_Turbocharger 2exhaust gas outlet temperature OUTLET2MIP(i)meas L.Hoegh_Asia_Cylinder 1 mean indicated pressure CYLINDER_PMI1MIP(i)meas L.Hoegh_Asia_Cylinder 2 mean indicated pressure CYLINDER_PMI2MIP(i)meas L.Hoegh_Asia_Cylinder 3 mean indicated pressure CYLINDER_PMI3MIP(i)meas L.Hoegh_Asia_Cylinder 4 mean indicated pressure CYLINDER_PMI4MIP(i)meas L.Hoegh_Asia_Cylinder 5 mean indicated pressure CYLINDER_PMI5MIP(i)meas L.Hoegh_Asia_Cylinder 6 mean indicated pressure CYLINDER_PMI6MIP(i)meas L.Hoegh_Asia_Cylinder 7 mean indicated pressure CYLINDER_PMI7VIT(i)ind_meas L.Hoegh_Asia_Cylinder 1 fuel pump VIT index CYLINDER_VIT1VIT(i)ind_meas L.Hoegh_Asia_Cylinder 2 fuel pump VIT index CYLINDER_VIT2VIT(i)ind_meas L.Hoegh_Asia_Cylinder 3 fuel pump VIT index CYLINDER_VIT3VIT(i)ind_meas L.Hoegh_Asia_Cylinder 4 fuel pump VIT index CYLINDER_VIT4VIT(i)ind_meas L.Hoegh_Asia_Cylinder 5 fuel pump VIT index CYLINDER_VIT5VIT(i)ind_meas L.Hoegh_Asia_Cylinder 6 fuel pump VIT index CYLINDER_VIT6VIT(i)ind_meas L.Hoegh_Asia_Cylinder 7 fuel pump VIT index CYLINDER_VIT7Fuel_pump_index(i)meas L.Hoegh_Asia_Cylinder 1 fuel pump index CYLINDER_FUEL1Fuel_pump_index(i)meas L.Hoegh_Asia_Cylinder 2 fuel pump index CYLINDER_FUEL2Fuel_pump_index(i)meas L.Hoegh_Asia_Cylinder 3 fuel pump index CYLINDER_FUEL3Fuel_pump_index(i)meas L.Hoegh_Asia_Cylinder 4 fuel pump index CYLINDER_FUEL4Fuel_pump_index(i)meas L.Hoegh_Asia_Cylinder 5 fuel pump index CYLINDER_FUEL5Fuel_pump_index(i)meas L.Hoegh_Asia_Cylinder 6 fuel pump index CYLINDER_FUEL6Fuel_pump_index(i)meas L.Hoegh_Asia_Cylinder 7 fuel pump index CYLINDER_FUEL7Spec_grav_15°Cmeas L.Hoegh_Asia_Engine fuel specific gravity at 15oC FUEL_DENSITYScav_air_pressmeas L.Hoegh_Asia_Scavenging air receiver 1 pressure REC_PRESS_BARPmax(i)_meas L.Hoegh_Asia_Cylinder 1 maximum pressure CYLINDER_PMAX1Pmax(i)_meas L.Hoegh_Asia_Cylinder 2 maximum pressure CYLINDER_PMAX2Pmax(i)_meas L.Hoegh_Asia_Cylinder 3 maximum pressure CYLINDER_PMAX3Pmax(i)_meas L.Hoegh_Asia_Cylinder 4 maximum pressure CYLINDER_PMAX4Pmax(i)_meas L.Hoegh_Asia_Cylinder 5 maximum pressure CYLINDER_PMAX5Pmax(i)_meas L.Hoegh_Asia_Cylinder 6 maximum pressure CYLINDER_PMAX6Pmax(i)_meas L.Hoegh_Asia_Cylinder 7 maximum pressure CYLINDER_PMAX7Air_filter∆pmeas L.Hoegh_Asia_Turbocharger 1 air filter pressure drop TC_DP1Air_filter∆pmeas L.Hoegh_Asia_Turbocharger 2 air filter pressure drop TC_DP2T/C_RPMmeas L.Hoegh_Asia_Turbocharger 1 rotational frequency TC1T/C_RPMmeas L.Hoegh_Asia_Turbocharger 2 rotational frequency TC2Scav_cool∆pmeas L.Hoegh_Asia_Scavenging air cooler 1 air pressure drop COOLER_DP1Scav_cool∆pmeas L.Hoegh_Asia_Scavenging air cooler 2 air pressure drop COOLER_DP2Cyl(i)_comp_pressmeas L.Hoegh_Asia_Cylinder 1 compression pressure CYLINDER_PCOMP1Cyl(i)_comp_pressmeas L.Hoegh_Asia_Cylinder 2 compression pressure CYLINDER_PCOMP2Cyl(i)_comp_pressmeas L.Hoegh_Asia_Cylinder 3 compression pressure CYLINDER_PCOMP3Cyl(i)_comp_pressmeas L.Hoegh_Asia_Cylinder 4 compression pressure CYLINDER_PCOMP4Cyl(i)_comp_pressmeas L.Hoegh_Asia_Cylinder 5 compression pressure CYLINDER_PCOMP5Cyl(i)_comp_pressmeas L.Hoegh_Asia_Cylinder 6 compression pressure CYLINDER_PCOMP6Cyl(i)_comp_pressmeas L.Hoegh_Asia_Cylinder 7 compression pressure CYLINDER_PCOMP7

ARKTRANSSystem Framework Architecture for Multimodal Freight and Passenger Transport
Hans Westerheim
Information and Communication Technology

ARKTRANS BackgroundNeed for harmonisation
Between transport modes (road, railway, sea, air)Between freight and passenger transport
The same information is requested by authorities, service users, service providers, transport users, etc.
Information is registered manually many timesFaulty and insufficient information, e.g for dangerous cargoMultimodal transport chains are not managed properlyLack of status information, estimated time of arrival, etc.
Lack of information, or available information is not utilised when transport is planned and carried out.
Dynamic information (e.g. traffic conditions, meteorological conditions)Route and traffic information across transport modesAvailable capacity across transport modes
Information and Communication Technology

The ARKTRANS projectPhase1: September 2000 – September 2001Phase 2 : January 2002 – December 2004Participants
The Norwegian Public Road Administration (contractor)The Norwegian Coast AdministrationThe Norwegian Civil Aviation AdministrationThe Norwegian National Rail AdministrationThe Norwegian State RailwaysTelenor R&DErgo SolutionTransportbedriftenes Landsforening (TL) – Federation of NorwegianTransport CompaniesThe SINTEF Group (technical manager/project leader)
User reference groupsARKTRANS is now managed by ITS Norway
Information and Communication Technology

The Transport DomainTerminal
• Authorities• Terminal operator
• Intermodality• Synchronisation
Transport Network
•Authorities•Service providers•Traffic control center
TransportUser / Logistics Provider
Fleet Operator
TransportMeans / Crew
Information and Communication Technology

ARKTRANSWhat we want to achieve
Establish a common view on the transport domainTransport domain organisation and structureMultimodal terminology for roles (representing the actors involved)Multimodal terminology for services and functionalitySpecifications of roles, services and functionality
Interoperable ICT solutionsDefined functionalityCan interact with other actors and other systems”Standardised” information exchange
Better basis for specification of ICT solutionsARKTRANS shall be a templateRequirements and solutions can be based on ARKTRANSSolutions can be evaluated towards ARKTRANS
Information and Communication Technology
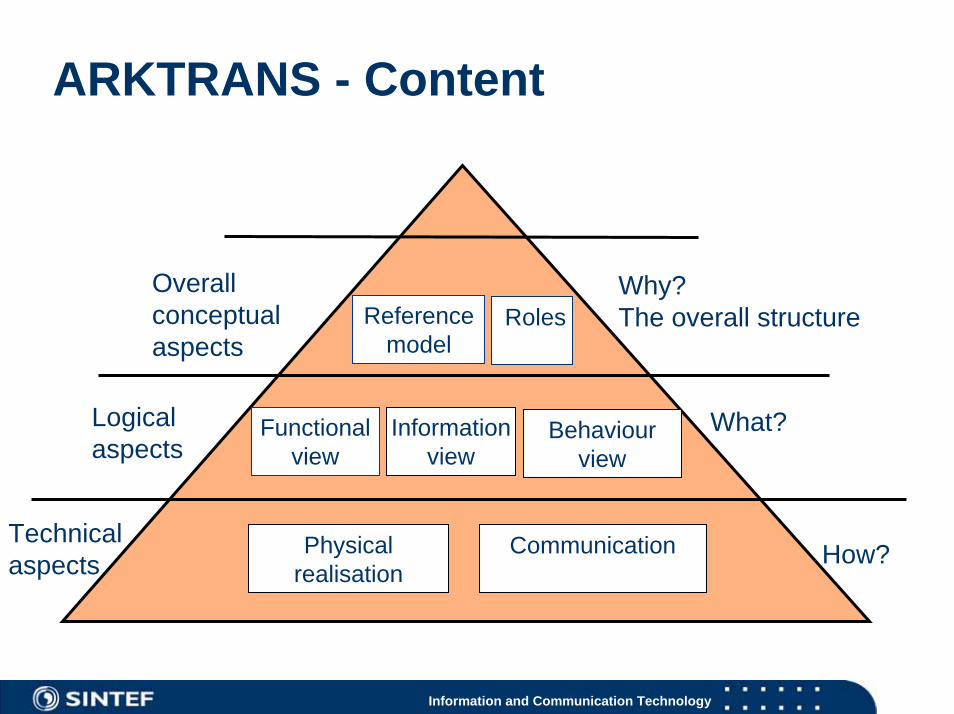
ARKTRANS - Content
Why? The overall structure
What?
How?
Referencemodel
Informationview
Physicalrealisation
Communication
Overall conceptualaspects
Logicalaspects
Technicalaspects
Functionalview
Roles
Behaviourview
Information and Communication Technology
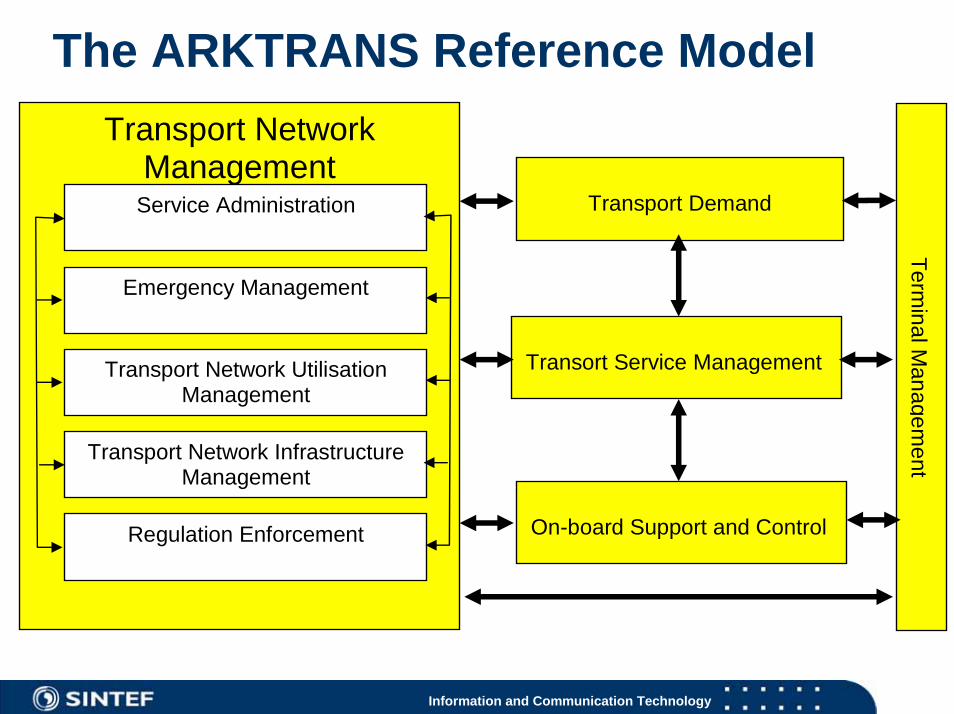
The ARKTRANS Reference Model
Transport Network Management
Service Administration
Emergency Management
Transport Network Utilisation Management
Transport Network Infrastructure Management
Regulation Enforcement
Transport Demand
Transort Service Management
On-board Support and Control
Terminal M
anagement
Information and Communication Technology

Roles – Some examples
Referring to stakeholders and systems that may interact with ITSCommon multimodal terminology – simplifies the architecture specificationMapping between multimodal and modal terms
Multimodal terms Modal terms Superior
roles Detailed
roles Road
Sea Rail Air
Transport Network
Transport Corridor
Road Fairway Railroad Corridor
Transport Means
Car, buss, etc.
Vessel, bark, etc.
Train Aircraft, helicopter
Terminal Stop, station
Terminal Station Airport
Captain Driver Captain Engine driver
Captain Crew
Driver Driver Helmsman Engine driver
Pilot
Traveller Transport Item Cargo
Information and Communication Technology

Functional view: Decomposition, scenarios, interactions
Functional decomposition of the reference model sub-domainsScenarios showing how the functionality can be used
Based on needs of different rolesVerifies the functionalityIdentifies required interactions – interoperability
Information and Communication Technology

Behavior view - ScenariosTransport User Scenarier
Transport PreparationChain Management
Transporter/Fleet Manager ScenariosStrategic and Tactical PlanningOperational PlanningTransport Operation Management
Start-up and administrationTransport Operation MonitoringSchedule ManagementDeviation ManagementIncident ManagementExceptional Transport Need Management
On-board ScenarierDriving supportNavigation supportAutomated operationsTransport operation
Terminal ScenarierStrategic and Tactical PlanningOperational Planning
Operational Inbound PlanningOperational Transhipment PlanningOperational Outbound Planning
Terminal Operation ManagementTerminal Operation MonitoringInbound ControlTranshipment and StorageOutbound Control Incident and Deviation Management
Transport Network Management ScenarierTIC/TCC/Traffic and transport planner
Strategic and Tactical PlanningTransport Operation PlanningTraffic MonitoringTraffic ControlIncident Handling
Service providerTravel Information Provider….
Transport Network ManagerStrategic and Tactical Planning…..
The scenarios are important for the identification and harmonisation of the information flow
Information and Communication Technology

Information and Communication Technology
Transport User Transporter or Fleet Manager Terminal actorServiceProvider
Transport Chain Definition
Transport Service Selection
Transport Plan Establishment
Exception Notification Definition
Transport OrderAdministration
Transport Plan Completition
Transport Service Marketing
Transport Request Management
Space and Resource Allocation
Order Information Administration
Passenger Information Mangement
/ Positive firm booking confirmations
/ Negative confirmation
Actual Transport Preferences Definition
Service information
Route planActual route plan
Firm transport bookingPreliminary transport booking
Transport booking cancellation
Transport plan
Transport booking confirmation
TicketTransport plan
/ No amendment
/ Amendment
Service Marketing
/ OK chain and services
Transport Order Amendment Appraisal
Transport Information Exchange Definition
Yield Management
/ No amendment
/ Amendment required
/ Chain or service not OK
/ Negativeconfirmation
re-do planning
Transport plan amendmentssuggested by the Transporter
(due to deviations) are notaccepted by the Transport User.
Transport Item Definition
Load Information Management
No Show Managment showsthat space is available.
Check and acceptTransport Items on
waiting list
Strategic and tacticalplanning
ScenariosUML swim lanes Show the use of functionalityVerify functionality
Identify interactions

Information focus: Information models and messages
Air_condition
Air temperature
Humidity
Air pressure
Pressure tendency
Air temp integration time
Humidity integration time
SeaCurrent
Current direction
Current speed
Current depth
Average from
Average to
Current integration time
Ice_condition
ice thickness
ice type
Ice condition integration time
Meteorological_statement
Statement text
Statement type
Metocean_condition
Valid from
Timestamp
Calc timestamp
Description
Tide_gauge
Timestamp
Name
Gauge status
Visibility
Horizontal visibility
Visibility integration time
Water_level
Total water level
Tidal water level
Surge
Water_level_zone
Created date
Expired date
Range
Delay
Offset
Description
Wave
Wave mean direction
Wave peak direction
Swell direction
Windsea direction
Direction convention
Significant wave height
Max wave height
Swell height Wind
Wind direction
Wind speed
Gust direction
Gust velocity
Wind height
Wind integration time
Gust integration time
Salinity
Depth
Method_used
EquipmentID
Equipment type
Link to description
Method
Fairway_object
Location
Location code
Location name
Accuracy
Conceptual information models defines common information
Message
Messages are composed by means of information elements from the information modelsMessage specifications are generated from the models
Interactions are message exchange sequences
Information and Communication Technology

The use of ARKTRANS
ARKTRANS has been used in several research and development projects as an architectural basis
MarNISMultiRITVIKING Ferry Data Pool
ARKTRANS may be used to set the context for theinformation flow realised by e.g. XML
www.arktrans.no
Information and Communication Technology