isometric assessment of muscular function: the effect …€¦ · journal of applied biomechanics,...
TRANSCRIPT

JOURNAL OF APPLIED BIOMECHANICS, 1995,11, 205-21 5 O 1995 by Human Kinetics Publishers, Inc.
isometric Assessment of Muscular Function: The Effect of Joint Angle
Aron 1. Murphy, Greg j. Wilson, john F. Pryor/ and Robert U. Newton
The purpose of this investigation was to determine the relationship between isometric measures of muscular function at two different joint angles and dynamic performance. Thirteen experienced weight trainers performed two isometric tests in a bench press position, at elbow angles of 90 and 120°. Performance was assessed by a one repetition maximum (1-RM) bench press and a series of upper body bench press throws at loads of 15, 30, and 60% of the 1-RM load. The results clearly show that changing the joint angle from 120 to 90' improved the relationship between most of the tests and performance by more than 100%, possibly due to differences in motor unit recruitment patterns and differing muscle mechanics (e.g., length-tension), at varying joint angles. It was suggested that the best angle at which to assess isometric function may be the joint angle at which peak force is developed in the performance of interest.
Isometric tests of muscular function are popular tests that have been widely used to assess the force-producing capacity of the neuromuscular system (Bell & Jacobs, 1986; Bemben, Clasey, & Massey, 1990; Bemben, Massey, Boileau, & Misner, 1992; Sale, 1991; Tidow, 1990). Both the rate at which isometric force can be developed and the maximum isometric force have been shown, by some researchers, to be significantly related to performance (Hakkinen, Komi, & Kauhanen, 1986; Viitasalo & Aura, 1984). Research has also demonstrated that isometric tests have the capacity to discriminate between athletes of differing performance levels (Mero, Luhtanen, Viitasalo, & Komi, 1981; Secher, 1975). In contrast, a number of studies have shown that isometric tests cannot differentiate between differing levels of performers (Abe, Kawakami, Ikegawa, Kanehisa, & Fukunaga, 1992; Fry et al., 1991) and are not related to dynamic performance (Komi, Suominen, Heikkinen, Karlsson, & Tesch, 1982; Young & Bilby, 1993).
One of the reasons for the disparity in the research findings may be the large variation in angles used in the isometric assessments. For example, isometric leg extension tests have been performed at knee angles ranging from 90 to 140" (Hakkinen, Palcarinen, Alen, Kauhanen, & Komi, 1987; Ryushi, Hakkinen,
The authors are with the Centre for Exercise Science & Sport Management, Southern Cross University, Lismore, 2480 NSW, Australia.

206 Murphy, Wilson, Pryor, and Newton
Kauhanen, & Komi, 1988; Sale, Martin, & Moroz, 1992; Viitasalo, Hakkinen, & Komi, 1981). Research has demonstrated that the isometric force-producing capa- bilities of the musculature fluctuate as a function of joint angle (Sale, 1991; Singh & Karpovich, 1966). However, limited research has examined the effect of joint angle on the relationship between isometric assessment and athletic performance.
Therefore, the purpose of this study was to investigate the relationship between isometric measures of muscular function at two different joint angles and dynamic performance. Specifically, the research was performed to determine what effect, if any, the variation of joint angle had on the relationship between the isometric tests and dynamic performance.
Methodology
Description of Subjects
Thirteen male subjects with at least 1 year of weight training experience, including regular performance of the bench press exercise, volunteered to participate in the present study. To be included as subjects they were required to bench press a load at least equivalent to body mass. Their mean f SD age, weight, and height were 23 f 4 years, 81 f 9 kg, and 178 f 7 cm, respectively. The subjects were all involved in recreational sports including basketball, football, soccer, and various track events; however, none was specifically trained in any upper body power event, such as the shot put or javelin. The study was approved by the Ethics Committee of Southern Cross University. Each subject was informed of the risks and stresses associated with the testing protocol and signed a written consent form prior to participation in the project.
Equipment
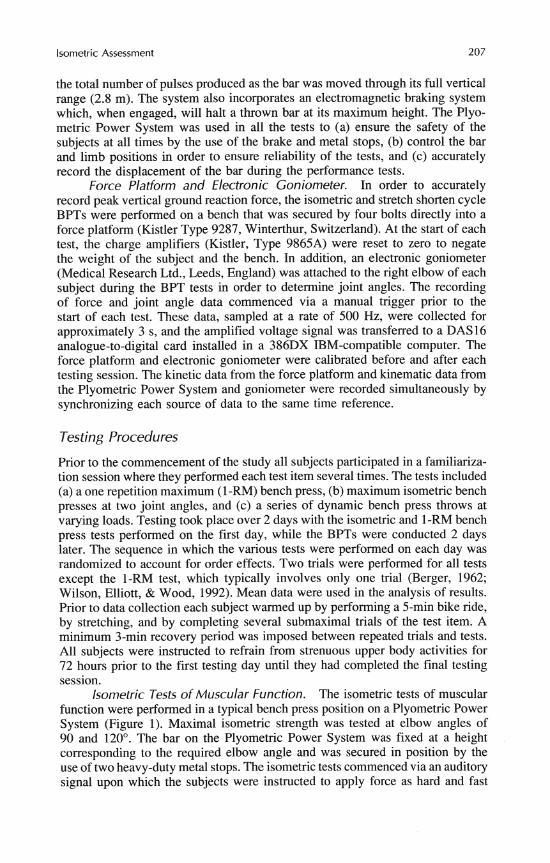
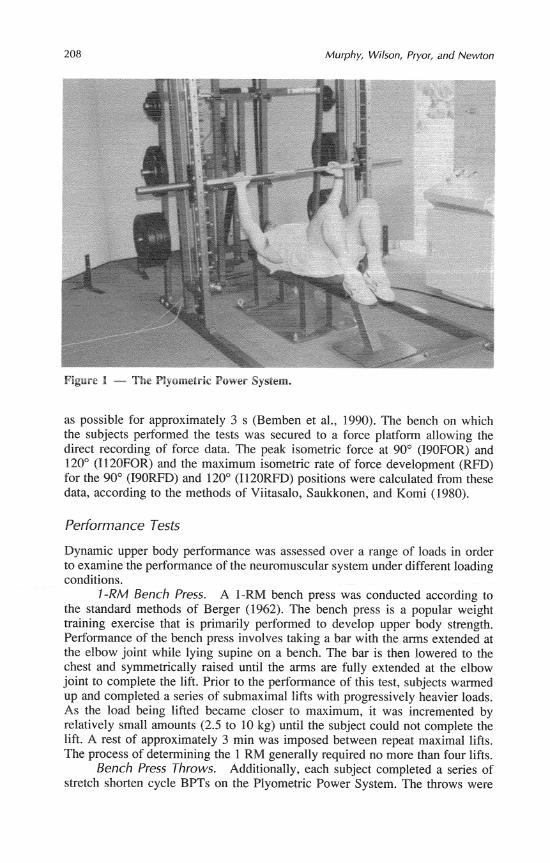
Plyometric Power System. The Plyometric Power System (Plyopower Technologies, Lismore, Australia) allows dynamic bench press throws (BPTs) to be safely performed while recording relevant kinematic data, including the height thrown and total work done (Figure 1). These data were collected using similar procedures recently outlined by Wilson, Newton, Murphy, and Humphries (1993), who reported a test-retest correlation of .972 using the system for a dynamic stretch shorten cycle action. The machine only allows vertical movement of the bar, and metal stops permit the initial or minimum height of the bar to be controlled with an accuracy of 0.02 m. Linear bearings, attached to either end of the bar, allow it to slide about two hardened axle steel shafts with a minimum of friction. A rotary encoder attached to the machine produced pulses indicating the displacement of the bar. The encoder samples at a rate of approximately 3000 Hz, with one pulse generated for each 0.001 m of bar movement. Each pulse was recorded by a counter timer board installed in a 386DX IBM-compatible computer, capable of measuring pulse frequencies up to 1 MHz. The above information was recorded by computer, and software calculated the work done as the amount of potential energy of the bar at the peak of the throw (mass x gravity x height). This measure was subsequently used as the performance variable for the bench press throws. The system was calibrated prior to use by measuring
Isometric Assessment 207
the total number of pulses produced as the bar was moved through its full vertical range (2.8 m). The system also incorporates an electromagnetic braking system which, when engaged, will halt a thrown bar at its maximum height. The Plyo- metric Power System was used in all the tests to (a) ensure the safety of the subjects at all times by the use of the brake and metal stops, (b) control the bar and limb positions in order to ensure reliability of the tests, and (c) accurately record the displacement of the bar during the performance tests.
Force Platform and Electronic Goniometer. In order to accurately record peak vertical ground reaction force, the isometric and stretch shorten cycle BPTs were performed on a bench that was secured by four bolts directly into a force platform (Kistler Type 9287, Winterthur, Switzerland). At the start of each test, the charge amplifiers (Kistler, Type 9865A) were reset to zero to negate the weight of the subject and the bench. In addition, an electronic goniometer (Medical Research Ltd., Leeds, England) was attached to the right elbow of each subject during the BPT tests in order to determine joint angles. The recording of force and joint angle data commenced via a manual trigger prior to the start of each test. These data, sampled at a rate of 500 Hz, were collected for approximately 3 s, and the amplified voltage signal was transferred to a DAS16 analogue-to-digital card installed in a 386DX IBM-compatible computer. The force platform and electronic goniometer were calibrated before and after each testing session. The kinetic data from the force platform and kinematic data from the ~c~omet r i c Power System and goniometer were recorded simultaneously by synchronizing each source of data to the same time reference.
Testing Procedures
Prior to the commencement of the study all subjects participated in a familiariza- tion session where they performed each test item several times. The tests included (a) a one repetition maximum (1-RM) bench press, (b) maximum isometric bench presses at two joint angles, and (c) a series of dynamic bench press throws at varying loads. Testing took place over 2 days with the isometric and 1-RM bench press tests performed on the first day, while the BPTs were conducted 2 days later. The sequence in which the various tests were performed on each day was randomized to account for order effects. Two trials were performed for all tests except the 1-RM test, which typically involves only one trial (Berger, 1962; Wilson, Elliott, & Wood, 1992). Mean data were used in the analysis of results. Prior to data collection each subject warmed up by performing a 5-min bike ride, by stretching, and by completing several submaximal trials of the test item. A minimum 3-min recovery period was imposed between repeated trials and tests. All subjects were instructed to refrain from strenuous upper body activities for 72 hours prior to the first testing day until they had completed the final testing session.
Isometric Tests of Muscular Function. The isometric tests of muscular function were performed in a typical bench press position on a Plyometric Power System (Figure 1). Maximal isometric strength was tested at elbow angles of 90 and 120". The bar on the Plyometric Power System was fixed at a height corresponding to the required elbow angle and was secured in position by the use of two heavy-duty metal stops. The isometric tests commenced via an auditory signal upon which the subjects were instructed to apply force as hard and fast
208 Murphy, Wilson, Pryor, and Newton
Figure 9 - The Pigometric Power System.
as possible for approximately 3 s (Bemben et al., 1990). The bench on which the subjects performed the tests was secured to a force platform allowing the direct recording of force data. The peak isometric force at 90' (190FOR) and 120" (1120FOR) and the maximum isometric rate of force development (RFD) for the 90" (I9ORFD) and 120" (I120RFD) positions were calculated from these data, according to the methods of Viitasalo, Saukkonen, and Komi (1980).
Performance Tests
Dynamic upper body performance was assessed over a range of loads in order to examine the performance of the neuromuscular system under different loading conditions.
1-RM Bench Press. A 1-RM bench press was conducted according to the standard methods of Berger (1962). The bench press is a popular weight training exercise that is primarily performed to develop upper body strength. Performance of the bench press involves taking a bar with the arms extended at the elbow joint while lying supine on a bench. The bar is then lowered to the chest and symmetrically raised until the arms are fully extended at the elbow joint to complete the lift. Prior to the performance of this test, subjects warmed up and completed a series of submaximal lifts with progressively heavier loads. As the load being lifted became closer to maximum, it was incremented by relatively small amounts (2.5 to 10 kg) until the subject could not complete the lift. A rest of approximately 3 min was imposed between repeat maximal lifts. The process of determining the 1 RM generally required no more than four lifts.
Bench Press Throws. Additionally, each subject completed a series of stretch shorten cycle BPTs on the Plyometric Power System. The throws were
Isometric Assessment 209
performed in the supine bench press position, with loads of 15,30, and 60% of the I-RM load (BPT 15%, BPT 30%, and BPT 60%, respectively). For each of these tests, the subjects were initially required to hold the bar with arms fully extended. They were then instructed to quickly lower and subsequently throw the bar for maximum height. The depth to which the bar was brought down was controlled to be within a range of 85 to 95" of elbow flexion. This was visually monitored at all times by the researchers and later checked by examination of the goniometer data. At maximum height, the bar was halted by the electromagnetic braking mechanism of the Plyometric Power System, so that the subjects did not have to catch the returning load. The total work done was calculated as the performance variable for the bench press throws.
Statistical Procedures
Pearson's product moment correlations were used to describe the relationship between the performance tests and the isometric measures of muscular function at each angle. Intraclass correlations were used to assess the interday reliability of the isometric tests. Statistical significance was accepted at an alpha level of .05.
Results
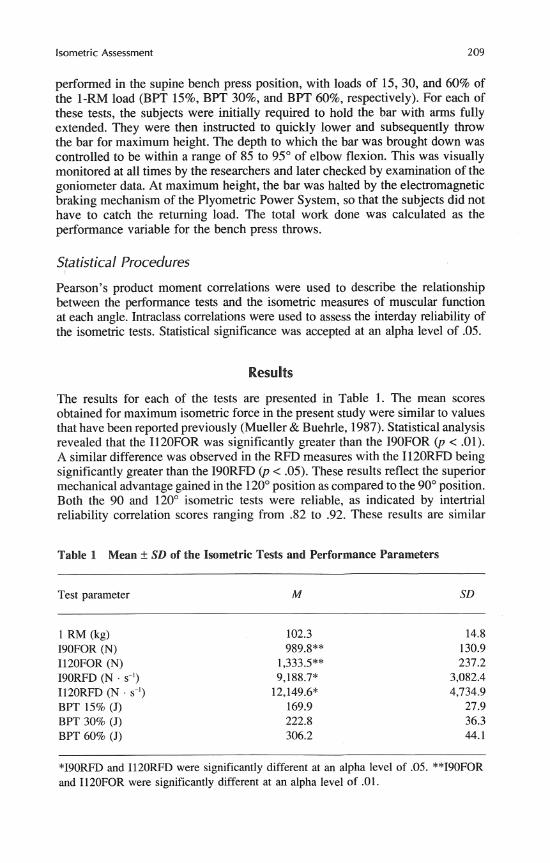
The results for each of the tests are presented in Table 1. The mean scores obtained for maximum isometric force in the present study were similar to values that have been reported previously (Mueller & Buehrle, 1987). Statistical analysis revealed that the I120FOR was significantly greater than the I90FOR (p < .01). A similar difference was observed in the RFD measures with the I120RFD being significantly greater than the I90RFD (p < .05). These results reflect the superior mechanical advantage gained in the 120" position as compared to the 90' position. Both the 90 and 120" isometric tests were reliable, as indicated by intertrial reliability correlation scores ranging from .82 to .92. These results are similar
Table 1 Mean + SD of the Isometric Tests and Performance Parameters
Test parameter M
1 RM (kg) I90FOR (N) 1120FOR (N) I90RFD (N . s-') I120RFD (N . s-') BPT 15% (J) BPT 30% (J) BPT 60% (J)
*I90RFD and I120RFD were significantly different at an alpha level of .05. **190FOR and 1120FOR were significantly different at an alpha level of .Ol.

210 Murphy, Wilson, Pryor, and Newton
Table 2 Correlation Coefficients Between Various Isometric Measures of Muscle Function
Test I90FOR I1 20FOR I90RFD I1 2ORFD
*Significant at .05 alpha level. **Significant at .O1 alpha level.
Table 3 Correlation Coefficients Between the Tests of Isometric Muscular Function and the Performance Parameters
Test BPT I90FOR I1 20FOR I90RFD I1 2ORFD
I RM .78** .47 .47 .42 BPT 15% .6 1 * .25 .49 .23 BPT 30% .69** .25 .58 .3 1 BPT 60% .67* .27 .59* .28
*Significant at .05 alpha level. **Significant at .O1 alpha level.
to intertrial reliability correlation coefficients previously reported for isometric testing (r = .84 to .98) (Viitasalo et al., 1980).
Pearson's product moment correlation statistics were performed to test for relationships between each of the isometric measures of muscular function. The correlation coefficients ranged from r = .43 to .77 and are presented in Table 2. The relationships between the isometric tests of muscular function and dynamic performance were also determined and are outlined in Table 3. The correlations between the isometric tests of muscular function and performance clearly show that changing the joint angle has a profound influence on the magnitude of the relationship. Indeed, in changing from 120 to 90°, the relationship to most of the performance tests improved by more than 100%.
Discussion
The Effect of Modifying Joint Angle on Isometric Muscular Assessment
When examining the relationship between dynamic performance and isometric tests of muscular function, most researchers have assessed the isometric measures at one arbitrary joint angle in the movement range (Hakkinen & Keskinen, 1989; Sale et at., 1992; Wilson et al., 1993). The choice of this angle has varied widely

Isometric Assessment 21 1
throughout the literature; for example, isometric leg extension tests have been performed at knee angles ranging from 90 to 140" (Hakkinen et al., 1987; Ryushi et al., 1988; Sale et al., 1992; Viitasalo et al., 1981).
Sale (1991) recommended that isometric testing be performed at a joint angle that corresponded to the peak of the strength curve for that particular muscle group to reduce the variability associated with small errors in the determination of joint angle. However, the use of such an angle may not necessarily be optimal in terms of relationship to dynamic performance. For example, in the present study, the 120" angle involved a significantly greater isometric force than the 90" position, but its relationship to performance was substantially worse (Tables 1 and 3). Furthermore, the correlations between the isometric tests of muscular function and performance clearly showed that changing the joint angle from 120 to 90" improved the relationship of most of the tests by more than 100% (Table 3).
The results of the present study strongly support the notion that the joint angle at which isometric testing takes place should not be arbitrary because the relationship between the isometric tests themselves, and between the isometric tests and performance, varies substantially as a function of angle (Tables 2 and 3). Such a finding is not surprising given that previous research has shown differences in motor unit recruitment patterns within isometric tasks with changes in the direction of force application (Ter Haar Romeny, Denier van der Gon, & Gielen, 1982) or the performance of different tasks of the same muscle (Ter Haar Romeny, Denier van der Gon, & Gielen, 1984). Further, and particularly relevant to multijoint tests, researchers have shown that the relationship between EMG activation level of synergistic muscle groups varies as a function of joint angle (Hasan & Enoka, 1985; Howard, Hoit, Enoka, & Hasan, 1986).
A remarkable finding from this study was that the correlation coefficient between I90RFD and Il20RFD was only .62. A similar result was observed between the I90FOR and 1120FOR (r = .69). Although these correlation coeffi- cients are statistically significant, they are smaller than what may have been expected. It is apparent that when an identical isometric movement is changed by 30°, the magnitudes of the change in both force and RFD are subject to large individual variations.
Therefore, if isometric tests are to be used to infer the functional capacity of the musculature in dynamic activities, it is likely that the best angle at which to perform isometric tests may be the joint angle at which peak force is developed in the performance of interest. In the present study, the isometric measures of muscular function administered in the 90" position proved to be more highly related to performance in the BPTs and 1-RM tests than those measured in the 120" position (Table 3). Perhaps this is because the 90" test is more specific to the range of motion where peak force was developed in the performance. The force profiles of the various BPT and 1-RM lifts were similar, with force maximized at the start of the concentric phase and gradually reducing as the movement pro- gressed, presumably due to the effects of the force-velocity relationship.
Figure 2 depicts the force-angle profile for a representative subject per- forming a BPT. It is apparent that peak force was developed at an elbow angle of approximately 95", which may explain the superiority of the isometric tests conducted at an angle approximate to this point compared to the force developed in the 120" position. Such an explanation may partly account for the conflicting

21 2 Murphy, Wilson, Pryor, and Newton
Biomechanical Profile BPT Representative Subject
Figure 2 - Force angle profile for a typical bench press throw (representative subject).
results noted in the literature concerning the relationship between isometric tests of muscular function and dynamic performance. Clearly more research into the optimal joint angle for isometric muscular assessment appears warranted, particu- larly given the popularity of this testing modality.
Relationship Between Maximum Isometric Force, RFD, and Dynamic Performance
The rate at which maximum isometric force can be developed has been shown by some researchers to be significantly related to performance (Hakkinen et al., 1986; Viitasalo & Aura, 1984). For example, Viitasalo et al. (1981) reported significant relationships (r = .49 to .72) between isometric RFD and jumping performance. Similarly, Hakkinen and Keskinen (1989) reported that RFD effec- tively differentiated between sprint and endurance athletes. As a result, isometric force-time curves, and in particular isometric RFD, are standard tests of muscular function (Bell & Jacobs, 1986; Bemben et al., 1990, 1992; Sale, 1991; Tidow, 1990).
However, the results of the present study revealed that isometric RFD, at either joint angle, was significantly related to only one of the performance tests (r = .59; Table 3). These findings are supported by researchers who found that isometric RFD tests were not related to athletic performance. For example, Mero et al. (1981) observed no relationship between maximum isometric RFD and sprint performance. Similarly, Wilson et al. (1993) reported improvements in various measures of dynamic performance after 5 weeks of resistance training; however, no change in maximum isometric RFD was recorded. Further, Young and Bilby (1993) reported no relationship (r = .07) between maximum isometric RFD and vertical jump performance.
The relationship between the isometric measures of maximal strength and RFD and their respective importance to performance has been suggested by

Isometric Assessment 21 3
Schmidtbleicher (1992) to change as a function of load. Schmidtbleicher has suggested that light load performances, such as a shot put, are best predicted by the isometric RFD. Alternatively, heavy load performances, such as in weight lifting, have been suggested to be best predicted by the maximum isometric strength. These postulations, in general, were not supported by the results observed in the present study. The I9ORFD was only significantly correlated (r = .59) to performance at the 60% load (Table 3) with the correlations decreasing as the load decreased. I90FOR was significantly correlated with all performance tests, including the two with the lightest loads, and the correlations increased with increasing loads, as suggested by Schmidtbleicher (1992). 1120FOR and Il20RFD did not correlate significantly with any of the performance measures. Therefore, at least in the assessment of strength-trained males in a bench press type move- ment, it would appear that caution is warranted when using isometric measures as indicators of dynamic performance (Hakkinen, 1989; Schmidtbleicher, 1992).
Conclusions
This research has examined the relationship between isometric measures of mus- cular function at two joint angles and dynamic performance. The results of this analysis have shown that the angle at which isometric tests are performed has a profound influence on the relationship between isometric measures of muscular function and dynamic performance. This is believed to be due to differing motor unit activation patterns being used in different positions and changes in mechani- cal properties of the muscle at each position.
This outcome may, at least partially, explain the disparities in the literature regarding the effectiveness of isometric assessment. The optimal angle for iso- metric muscular assessment is an area of research that requires further investiga- tion. However, there is some evidence to suggest that the optimal angle may be specific to the range of motion where maximum force is exerted in the perfor- mance of interest. The results of this research demonstrated that the isometric RFD, at either angle, was poorly related to performance. Consequently, caution is advised if using isometric RFD tests as indicators of dynamic performance, particularly when light loads are used.
References
Abe, T., Kawakami, Y., Ikegawa, S., Kanehisa, H., & Fukunaga, T. (1992). Isometric and isokinetic knee joint performance in Japanese alpine ski racers. Journal of Sports Medicine and Physical Fitness, 32(4), 353-357.
Bell, G.J., & Jacobs, I. (1986). Electro-mechanical response times and rate of force development in males and females. Medicine and Science in Sports and Exercise, 18(1), 31-36.
Bemben, M.G., Clasey, J.L., & Massey, B.H. (1990). The effect of the rate of muscle contraction on the force-time curve parameters of male and female subjects. Re- search Quarterly for Exercise and Sport, 61(1), 96-99.
Bemben, M.G., Massey, B.H., Boileau, R.A., & Misner, J.E. (1992). Reliability of isometric force-time curve parameters for men aged 20 to 79 years. Journal of Applied Sport Science Research, 6(3), 158-164.
214 Murphy, Wilson, Pryor, and Newton
Berger, R. (1962). Comparison of static and dynamic strength increases. The Research Quarterly, 33(3), 329-333.
Fry, A.C., Kraemer, W.J., Weseman, C.A., Conroy, B.P., Gordon, S.E., Hoffman, J.R., & Maresh, C.M. (1991). The effect of an off-season strength and conditioning program on starters and non-starters in women's intercollegiate volleyball. Journal of Applied Sports Science Research, 5, 174- 18 1.
Hakkinen, K. (1989). Neuromuscular and hormonal adaptations during strength and power training. Journal of Sports Medicine and Physical Fitness, 29(1), 9-26.
Hakkinen, K., & Keskinen, K.L. (1989). Muscle cross-sectional and voluntary force production characteristics in elite strength and endurance trained athletes and sprinters. European Journal of Applied Physiology, 59, 215-220.
Hakkinen, K., Komi, P.V., & Kauhanen, H. (1986). Electromyographic and force produc- tion characteristics of leg extensor muscles of elite weight lifters during isometric, concentric, and various stretch-shortening cycle exercises. International Journal of Sports Medicine, 7 , 144- 15 1.
Hakkinen, K., Pakarinen, A., Alen, M., Kauhanen, H., & Komi, P.V. (1987). Relationships between training volume, physical performance capacity, and serum hormone con- centrations during prolonged training in elite weight lifters. International Journal of Sports Medicine, 8, 61-65.
Hasan, Z., & Enoka, R.M. (1985). Isometric torque-angle relationship and movement- related activity of human elbow flexors: Implications of the equilibrium-point hypothesis. Experimental Brain Research, 59, 441-450.
Howard, J.D., Hoit, J.D., Enoka, R.M., & Hasan, Z. (1986). Relative activation of two human elbow flexors under isometric conditions: A cautionary note concerning flexor equivalence. Experimental Brain Research, 62, 199-202.
Komi, P.V., Suominen, H., Heikkinen, E., Karlsson, J., & Tesch, P. (1982). Effects of heavy resistance and explosive-type strength training methods on mechanical, functional, and metabolic aspects of performance. In P.V. Komi (Ed.), Exercise and sport biology (pp. 90-102). Champaign, IL: Human Kinetics.
Mero, A., Luhtanen, P., Viitasalo, J.T., & Komi, P.V. (1981). Relationship between the maximal running velocity, muscle fiber characteristics, force production and force relaxation of sprinters. Scandinavian Journal of Sports Science, 3, 16-22.
Mueller, K.J., & Buehrle, M. (1987). Comparison of static and dynamic strength of the arm extensor muscles. In B. Jonsson (Ed.), Biomechanics X-A (pp. 501-505). Champaign, IL: Human Kinetics.
Ryushi, T., Hakkinen, K., Kauhanen, H., & Komi, P.V. (1988). Muscle fibre characteristics, muscle cross-sectional area and force production in strength athletes, physically active males and females. Scandinavian Journal of Sports Science, 10(1), 7-15.
Sale, D.G. (1991). Testing strength and power. In J.D. MacDougall, H.A. Wenger, & H.J. Green (Eds.), Physiological testing of the high-performance athlete (pp. 21- 103). Champaign, IL: Human Kinetics.
Sale, D.G., Martin, J.E., & Moroz, D.E. (1992). Hypertrophy without increased isometric strength after weight training. European Journal of Applied Physiology, 64,51-55.
Schmidtbleicher, D. (1992). Training for power events. In P.V. Komi (Ed.), Strength and power in sport (pp. 381-395). Oxford, UK: Blackwell Scientific.
Secher, N.H. (1975). Isometric rowing strength of experienced and inexperienced oarsmen. Medicine and Science in Sports, 7(4), 280-283.
Singh, M., & Karpovich, P.V. (1966). Isotonic and isometric forces of forearm flexors and extensors. Journal of Applied Physiology, 21(4), 1435-1437.

Isometric Assessment 215
Ter Haar Romeny, B., Denier van der Gon, J., & Gielen, C. (1982). Changes in recruitment order of motor units in the human biceps muscle. Experimental Neurology, 78, 360-368.
Ter Haar Romeny, B., Denier van der Gon, J., & Gielen, C. (1984). Relation between location of a motor unit in the human biceps brachii and its critical firing levels for different tasks. Experimental Neurology, 85,631-650.
Tidow, G. (1990). Aspects of strength training in athletics. New Studies in Athletics, 1, 93-110.
Viitasalo, J.T., & Aura, 0. (1984). Seasonal fluctuation of force production in high jumpers. Canadian Journal of Applied Sports Science, 9(4), 209-213.
Viitasalo, J.T., Hakkinen, K., & Komi, P.V. (1981). Isometric and dynamic force produc- tion and muscle fibre composition in man. Journal of Human Movement Studies, 7(3), 199-209.
Viitasalo, J.T., Saukkonen, S., & Komi, P.V. (1980). Reproducibility of measurements of selected neuromuscular performance variables in man. Electromyographical and Clinical Neurophysiology, 20, 487-501.
Wilson, G.J., Elliott, B.C., & Wood, G.A. (1992). Stretch shorten cycle performance enhancement through flexibility training. Medicine and Science in Sports and Exer- cise, 24(1), 116-123.
Wilson, G.J., Newton, R.U., Murphy, A.J., & Humphries, B.J. (1993). The optimal training load for the development of dynamic athletic performance. Medicine and Science in Sport and Exercise, 25(1 I), 1279-1286.
Young, W.B., & Bilby, G.E. (1993). The effect of voluntary effort to influence speed of contraction on strength, muscular power and hypertrophy development. Journal of Strength and Conditioning Research, 7(3), 172-178.
Acknowledgment
This study was funded by a developing researcher grant from Southern Cross University.