iso-14001 certification and environmental performance in the
TRANSCRIPT

ISO 14001 Certification and Environmental Performance in the Quebec Pulp and Paper Industry
Philippe Barla*
First version: May 2005 (Preliminary)
Abstract
In this paper, we test if the adoption of the international norm ISO 14001 has a significant impact on environmental performance in the Quebec pulp and paper industry. Using monthly data for a panel of 38 plants over the 1997-2003 period, we show that: i) the ISO certification does not lead to a reduction in total suspended solids (TSS) emissions; ii) discharges of biological oxygen demand (BOD) appears to be significantly lower in the first year following certification; iii) this last impact does not appear to be lasting beyond the one-year window. We also show that, contrary to the group of plants that do not adopt the ISO norm, the adopting plants do not experience a significantly trendily reduction in emissions over our sample period. Key words: Environmental Management Systems, ISO 14001, Environmental Performance. JEL Classifications: Q50, Q52, Q58. * GREEN, département d’économique, Université Laval, Québec, Canada, G1K 7P4, E-mail : [email protected].
0

ISO 14001 Certification and Environmental Performance in the Quebec Pulp and Paper Industry
Philippe Barla
1. Introduction
Environmental policy has considerably evolved over the last decades. While in the seventies
command and control regulations were the norm, incentive based mechanisms such as tradable
permits have become increasingly popular in the eighties. More recently, governments and
industry lobbies have favoured the recourse to voluntary approaches in dealing with
environmental challenges. The basic idea is that business would adopt efficient pro-active
environmental initiatives as a result of raising public pressures and the threat of more stringent
governmental regulations. Besides lowering abatement costs, these voluntary measures would
also help reducing environmental policy monitoring and enforcement costs. One obvious
question that remains, at this stage, largely open is whether or not these voluntary actions actually
reduce pollution.
The growing interest for the international standard ISO 14001 relating to the
implementation of Environmental Management Systems (EMSs) illustrates very well the trend
toward voluntary self-regulation. As of December 2003, over 36,000 organizations worldwide
had voluntary established an EMS that was certified to respect the mandatory prescriptions of the
ISO 14001 norm. An EMS may be viewed as a set of management rules and procedures
designed at reducing the environmental impacts of an organization. It involves for example
reviewing and documenting the organization activities having a negative impact on the
environment, developing an environmental policy statement and a plan to achieve environmental
objectives. These targets are however, for the most part, decided internally by the organization.
In other words, the ISO norm does not prescribe any specific objective except for respecting the
existing regulations. Critics have therefore argued that ISO 14001 could be used a marketing
device for improving corporate image without having any significant impact on environmental
performance [17]. In this paper, we test the impact of ISO 14001 on the effluents of a sample of
38 Quebec pulp and paper plants using monthly data over the period 1997-2003. The
1

environmental performances of plants that have been registered ISO 14001 are compared to their
performance before certification and to the environmental performance of plants that are not (yet)
certified. Our results suggest that while the ISO 14001 certification does not have a significant
impact on total suspended solids (TSS), it does reduce the plant discharges of biological oxygen
demand (BOD) in the first year following certification. This impact does not however appear to
be lasting beyond the one-year window. Furthermore, the groups of plants that do not adopt the
ISO norm over our sample period experience an overall significant trendily reduction in
emissions (TSS and BOD) contrary to the group of plant that adopt the norm.
The empirical literature on corporate environmentalism is still quite limited and has been
mostly studying the adoption determinants of self regulations (see for example [7], [8], [13]). A
few recent works have nevertheless examined the impact of voluntary initiatives and particularly
EMS on environmental performance. Using a cross section of 150 US companies, Anton et al.
[1] find that the level of comprehensiveness of an EMS has a significant negative impact on the
toxic release emission rate. The reduction is particularly important for firms having high
pollution intensity in the past. Using a survey conducted among 236 Mexican manufacturer
plants, Dasgupta et al. [3] shows that plants with a high degree of conformity with ISO guidelines
are more likely to report (self-assessed) compliance with environmental regulations. However,
these two studies do not directly test the impact of ISO certification since they use data preceding
the official publication of the norm. Our main contribution is therefore to specifically test if the
adoption of an ISO 14001 certified EMS has a significant impact on environmental performance.
Moreover, the panel structure of our dataset allows us to control for plant specific unobservable
factors that may be correlated with the adoption decision thereby reducing missing variable
biases.
This paper also relates to the literature on the determinants of environmental performance.
Several studies have examined the impacts of monitoring and enforcement activities (inspections,
legal proceedings, fines) on environmental performance ([4],[6],[10],[11],[12]). More recently,
[5] compares these traditional enforcement strategies with those based on information disclosure
(i.e. publication of “worst” polluters lists). Of particular relevance for our analysis is the study by
2

Laplante and Rilstone [11] showing that inspections significantly reduces emissions in the
Quebec pulp and paper industry.
The rest of this paper is organized as follows. In Section 2, we provide a general
background on the ISO standard describing how it may affect environmental performance and we
briefly depict the Quebec pulp and paper industry. The data are described in Section 3 with some
preliminary evidence. The empirical model and the results are presented in Section 4 and 5
respectively. We conclude in Section 6.
2. Background
2.1 The ISO 14001 standard
The ISO 14001 requirements are contained in a short document entitled Environmental
management systems – Specification with guidance for use published by the International
Organization for Standardization (ISO). It was officially introduced in 1996 after having been
developed for a few years by a technical committee composed of “environmental experts”
representing over 50 national standards organizations. The ISO 14001 standard is part of a set of
guidelines that together constitute the ISO 14 000 series. ISO 14001 is however the only
mandatory guidelines that can be audited for certification (or registration) by an accredited third
party. These guidelines are applicable to any kind of organizations of various nationalities and
size.
We now briefly describe the main requirements contained in the ISO 14001 standard (for
a detailed description see [18]). To be certified ISO 14001, an EMS should to established and
operate using the following five steps. First, the high management of the organization must adopt
an environmental policy statement containing an explicit commitment to i) comply with all the
applicable regulations and other obligations and ii) continuously reduce and prevent pollution.
The statement should also provide a framework for establishing environmental targets and
objectives to be achieved by the organization. Second, in a planning stage, the organization
reviews the significant environmental impacts of its activities. It identifies all its legal,
3

contractual and voluntary environmental obligations and establishes procedures for meeting
them. Using these reviews and on the basis of the policy statement, the organization then defines
objectives and targets to be achieved through an implementation plan. The plan must assign
responsibilities within the organization and describe the resources dedicated to the plan as well as
its implementation schedule. Third, the plan is executed by, for example, setting up workers
training programs or developing operational and communication procedures designed at
preventing accidental pollution. Procedures must also be set up to properly documents the EMS
activities. Fourth, procedures and routines must be designed for controlling and monitoring the
organization environmental impacts. Corrective procedures must be established to deal with
cases of non-conformity. The EMS should also elaborate detailed procedures (frequency,
methodology) for regular auditing. To be certified, an accredited third party must regularly audit
the organization EMS in order to access if it respects the ISO requirements. Fifth, top
management periodically re-evaluates the operations of the EMS modifying them to continuously
improve their effectiveness.
An ISO-14001 certified EMS may therefore improve environmental performance through
i) the requirement of respecting all applicable environmental regulations, ii) the investment in
documenting and analyzing the plant environmental impacts and iii) the development of
systematic, written and standardized checklist-type procedures to reduce and prevent pollution.
In our analysis, the first aspect is likely to be of little importance since as we will show below, the
compliance rate with regulation is particularly high in the Quebec pulp and paper industry.
Several potential benefits may justify the decision by businesses to adopt the ISO 14001
norm. First, it may help the firm improving its corporate image toward consumers, investors and
the surrounding communities affected by the environmental externalities. Empirical studies (see
[1] and [7]) and managers’ survey [20] suggest that this is a significant factor favouring the
implementation of an EMS and its ISO certification. Being certification may also help firms
reducing their liability risks by demonstrating “due diligence” thereby reducing insurance costs.
For example, [1] and [7] show that US companies with a large number of Superfund sites (a
proxy for liability costs awareness) are more likely to adopt comprehensive EMS. Evidences also
suggest that adoption may result from regulatory pressures through regulator inspections for
4

example (see [3] and [7]). In some cases, regulations may provide direct incentives for the
adoption of an EMS and its ISO certification (see [9]). Moreover, the adoption of voluntary
measures by a significant portion of an industry could pre-empt more stringent environmental
regulations. The process required by the ISO standard may also lead to costs savings by
improving input productivity or by reducing waste disposal and pollution abatement costs (for a
case study see [2]). Finally, certified companies may pressure their suppliers to become
themselves certified.1
On the cost side, implementing and maintaining an ISO 14001 EMS involve internal costs
mostly administrative and external auditing and marketing expenditures. Szymanki and Tiwari
[17] reports costs of up to US$ 100,000 per year for US companies. For Canada, Yiridoe et al.
[20] find that, on average, organizations spend about 2% of total expenditures on obtaining and
maintaining their ISO 14001 EMS. Their estimates also suggest significant economies of scale in
adopting costs with the initial implementation cost varying from about CND$ 40,000 for small
organizations (less than 100 employees) to CND$ 75,000 for large organization (more than 500
employees). Scale is in fact a very significant factor for explaining the probability of adopting an
EMS. Other factors that increase the probability of adoption by reducing implementation costs
are: past experience with the ISO 9000 quality management standard and the average level of
worker education [13]. On the other hand, firm’s level of indebtedness reduces the likelihood of
adoption.
2.2 The Quebec pulp and paper industry
Over the last century, a vibrant pulp and paper industry has developed in Quebec based on
abundant forests and inexpensive energy. As of December 2002, 60 plants belonging to 28
different companies employed over 35,000 employees. Quebec produces about 30% of the
Canadian and 3% of the world paper and cardboard production. Its weight is event larger for
newsprint where it represents 10% of the world production. Close to 60% of its paper production
is exported to the US.
1 So far, empirical evidence suggests that this effect is not particularly strong (see [3], [13] and [20]). It may however become increasingly important as the number certifications grow. For example, Ford Motors is now requiring ISO 14001 3rd Party certification from its suppliers with manufacturing facilities.
5

Beside its economic importance, this sector is also a major source of pollution particularly
of effluent discharges. Given the availability of data (see Section 3), our analysis will focus on
two conventional indicators for water pollution in this industry namely Total Suspended Solids
(TSS) and Biological Oxygen Demand (BOD). TSS is a direct measure of the quantity of solid
waste (wood fibbers, ashes etc.) rejected in the production waters while BOD is an indirect
indicator of the environmental impacts of the effluent.2 Primary treatment using gravity is useful
to control TSS while a secondary treatment based on biological process is needed to reduce BOD.
Both aspects may also be controlled up streamed by reducing the effluents through the recycling
of the process water. The industry is also responsible for other water pollutants such as BPC,
dioxins and furans as well as air emissions (particles, SO2, sulphates, greenhouses gases) and
solid wastes.
Since the early seventies, the Quebec industry has been submitted to progressively more
stringent environmental regulations by both the federal and provincial governments leading to
significant abatement investments. For example over the 1992-1999 period, the industry spent
over 1.5 billions for improving its environmental performance (62% was directed toward water
pollution control). For the most part, regulations have taken the form of industry specific
performance standards. The last revision of the norms pertaining to BOD and TSS dates back to
1992. The norms are set in kilograms per ton of production and involve both a limit on the
average monthly and the daily maximal discharge. The limits are more severe for plants built
after 1992 and do not apply to plants rejecting their effluents in the municipal waste water system
(for an overview see [11]). Over our sample period, the compliance rate with regulations for
BOD and TSS has always exceeded 95%.
Interestingly, in 1993, the provincial government introduced a gradual process of plant
specific environmental certification that involves some of the steps required by ISO 14001. All
the plants have now received their first certification, which is valid for five years. This first
generation of attestations gathers in one document all the environmental regulations the plant has
2 BOD is an indicator of the total quantity of oxygen required over a five-day period for decomposing the organic matters contained in the water waste. High BOD may be damaging for the environment by asphyxiating the aquatics life.
6

to respect. It also describes a process for characterizing over a one-year period the plant effluent
using detailed indicators. This evaluation should eventually be used to define new plant specific
environmental targets that will be included in the second-generation attestation. These new
regulatory requirements have therefore provided strong incentives for plants to actually
implement an EMS. In fact, the Quebec Forest Industry Council [14] reports that in 2001 all the
Quebec plants were operating an EMS. Unfortunately, we do not dispose of any information on
the EMSs that are not ISO certified. In this paper, we are therefore not testing the impact of the
adoption of an EMS but rather examining if the ISO 14001 certification of an EMS is making a
difference. This precision is important to remember when interpreting our results.
3. Data and Preliminary Evidence
The main source of the data used in this paper is the Quebec Ministry of the Environment, which
collects information in order to access the industry conformity with existing environmental
regulations [15]. Under the Règlement sur les fabriques de pâtes et papiers, plants have to
continuously measure their effluent and report their daily discharges of TSS and BOD.
Obviously, the validity of these self-reported discharges could be questioned. However there are
a number of reasons to believe that these data are relatively accurate [11]. First, the Ministry
realizes each year five inspections for validating the accuracy of the reported data and five
inspections of the pollution monitoring equipments. For the two years for which we have the
information (2001 and 2002), the rate of conformity was 100%. The Ministry also realized each
year twenty tests of toxicity to validate the data reported by the plants (the conformity rate was
respectively 90% and 95% for 2001 and 2002). Second, the technologies used by these plants as
well as their productive capacity are relatively well known by the regulator making reporting
grossly inaccurate figures difficult. Third, reporting fraudulent information is a serious criminal
offence. Fourth, in the past, conformity rates with regulations have not always been as high as
those prevalent for our sample period suggesting that plants do report non-compliance. The
Ministry database also includes information on the production processes, the types of output
produced and the production for each plant. Unfortunately, this last information is confidential.
We were however able to recover from other variables the annual output, which combines with
the monthly water flow helps us construct a proxy for monthly production (see Section 4).
7

The date of ISO certification was obtained from the ISO 14001 Registered Company
Directory Database produced by QSU Publishing Company. The information was updated and
validated by directly contacting the plants.
We include in our sample all the Quebec plants that have been continuously operating
during the 1997-2003 period. In other words, we eliminated plants that have closed during our
sample period.3 We eliminate plants that produce paper based building materials as they operate
in a rather different market. We also exclude plants that reject their effluents into the municipal
water system for these plants are not in charge of pollution control of their effluent and are not
submitted to the same regulations. These criteria eliminate 21 plants leaving us with a sample of
38 mills observed over 84 months.4
Figure 1 presents the pattern of ISO 14001 certification over our sample period. The first
two plants were certified in 1998 and, as of December 2003, 18 plants were operating an ISO
14001 EMS. Overall, our sample includes 548 ISO 14001 observations from a total of 3192.
Figure 2 and 3 compare the average emission rates (i.e. emissions of TSS and BOD per unit of
output) for the group of plants that become ISO over our sample period (referred from now on as
the adopters) and the group that do not (the non-adopters).5 At this stage, it is worth noting that
i) adopters appear to have higher emission rates and ii) while for TSS, the adopters appear to be
catching up with the environmental performance of the non-adopters, the opposite seems to occur
for BOD. Obviously, several factors other than the ISO certification may determine the level of
emissions.
4. The Empirical Model
Our empirical specification is inspired by former empirical analysis of environmental
performance determinants especially [11] and [12]. It is also guided by the theoretical framework
3 We keep however plants that have experienced considerable output reduction as a result of strikes. Also, for nine observations, we used a regression on 12 months lags to complete the missing information. 4 We also use the data for 1996 when lags are required (see Section 4). 5 The average for the adopter group includes observations for plants that are not yet ISO but that will eventually obtain their certification over our sample period.
8

proposed by Dasgupta et al. [3] to explain variations in the environmental performance of plants
submitted to similar regulations. In this setting, the cost-minimizing level of a plant’s emissions
is determined by comparing the Marginal Abatement Cost (MAC) with the Expected Marginal
Penalty (EMP). Figure 4 illustrates the optimal level of pollution. The MAC is quite standard
and reflects the increasing marginal cost associated with reducing emissions. The EMP captures
the expected price of emissions, which increases with the level of emissions reflecting the raising
pressures on the plant as pollution augments even if it fully complies with formal regulations.
Indeed as emissions increases, not only regulatory scrutiny may intensify (e.g. marginal price
increases as a result of more frequent inspections by the regulator) but also informal pressures by
consumers, investors and local communities are likely to intensify. The equilibrium level of
emissions will therefore depend upon the various factors affecting the MAC and the EMP.
Based on this framework, our baseline reduced form emission equations take the following form:
)1(
___
)()()(
,12
1,
3
1,
8
1,,3,2,1
11
1,,3,2,112,0,
tir
irl
ill
jijjtititi
ktkktititititi
REGIONQTYPE
PROCESSSTRIKEADOPTERSTADOPTERSNONT
MONTHQLogINSPISOELogELog
ηθ
λγγγ
δβββφα
+++
++++
+++++=
∑∑
∑
∑
==
=
=−
The variable Ei,t measures the discharges of either BOD or TSS (in tons) by plant i over month t.
We also use in alternative specifications the emission rates (i.e. emissions per unit of production).
Following [11], [12], the emission level is regressed on its 12 months lag to capture the
underlying inertia associated with installing new equipments or adjusting the production process.
The variable ISO is a dichotomous variable taken the value 1 if plant i is certified ISO 14001 at
time t and 0 otherwise. As mentioned above, the implementation of an ISO certified EMS
implies reviewing the production process and developing systematic procedures, which may shift
the MAC curve down thereby reducing the equilibrium level of pollution.
Several researches have shown the significant impact of formal regulatory pressures on
environmental performance (see [5],[11],[12]). Increased regulatory scrutiny is likely to shift the
EMP up thereby leading to reduction in pollution. In line with these works, we introduce the
variables INSP that measures the number of toxicity inspections over the last six months at plant
9

i. Each year, the Ministry of the Environment carries out twenty toxicity inspections, which
consist in leaving 10 rainbow trout for 96 hours in a plant undiluted effluent. The test fails if
more than 50% of the trout die. These inspections may therefore trigger an overall improvement
in the plant performance including in terms of BOD and TSS.6 The absolute level of
discharge will also depend upon the plant production Qit. As already mentioned, the plant
production data are unfortunately confidential, however we were able to recover from the other
environmental data the annual production. To construct Qit, we combine the annual production
data with the monthly level of water flow, which should reflect variation in production.
Specifically for a specific year,
∑=
= 12
1,
,,
tti
tiiti
W
WYQ
with Yi the annual production of plant i and Wi,t the amount of water rejected by plant i during
month t.
Seasonal effects are captured by introducing month specific dummies (MONTH).
Temperature variations may affect the efficiency of the pollution control equipments (shifting the
MAC) as well as influencing public pressures (and thus EMP), as water pollution may be more
problematic during the warm seasons when rivers are used for leisurely activities. In view of the
preliminary evidence reported in figure 2 and 3, we allow the time trend to differ for the adopters
and the non-adopters. More precisely, we define the binary variable P_ISO, which takes the
value 1 (for all t) if plant i eventually becomes ISO during our sample period and zero otherwise.
T_ADOPTERS is equal to TREND x P_ISO while T_NON_ADOPTERS = TREND x (1-P_ISO).
Ignoring this possibility could bias our results since the variable ISO may be picking up trend
differences between the two groups (ISO takes the value 1 mostly at the end of our sample
period). If there is no difference, the coefficients on these two variables will not be statistically
different. The production of a few plants was disturbed by strikes that lasted several weeks and
even months. We control for these events by including a binary variable STRIKE. To control for
the type of production process, we include eight dummies (PROCESS) that are further defined in
6 Note that we tried several alternative specifications for capturing the impact of these inspections (e.g. current inspection plus lags). The results of these alternative specifications are very close to those reported here especially for the variable of interest in the paper namely ISO. We also tried specifications that include the other type of inspections (accuracy of the self-reporting emissions and inspections of the pollution monitoring equipments). These inspections had no significant impacts emissions.
10

table 1. We distinguish four types of outputs (QTYPE) namely newsprint (the reference group),
pulp, cardboard and other papers.7 Controlling for the technology and the nature of the output
produced is important as it may affect emissions by shifting the MAC curve. The variables
REGIONS indicates the plant area of operation. It is based on the administrative division of the
Quebec territory into 17 regions. The plants in our sample are present in 13 different regions.
These variables may capture variations in EMP. For example, plants located in highly populated
area are likely to experience more intense pressures to control emissions.
Finally, ti,η represents the error term. Given the panel structure of our data, we assume
that t,iiti, εµη += i.e. is composed of a plant specific component iµ and a plant-time varying term
ti,ε that is assumed, at this stage, IID Normal ti,ε ~N(0, ). 2εσ iµ accounts for any plant specific
unobservable factors. It also accounts for unobservables that vary little over our time period but
that may be quite different across plants. This may include for example the socio-economic
characteristics of the surrendering communities (education level, income), the importance of
R&D activities, the average age of the plant workers or their education level.8 These variables
may affect the plant environmental performance by shifting the EMP or the MAC. In the absence
of these plant effects, the model could be estimated by OLS. If they are present, the appropriate
estimation procedure depends upon whether these effects are correlated or not with the included
variables. In the latter case, they may be treated as random effects (RE) and the model may be
estimated by GLS. Otherwise, they should be treated as fixed effects (FE) (for details see [19]).9
In the FE specification, the coefficients on the variables that are time invariant such as REGION
cannot be identified. If we allow for the possibility that the plant effects are correlated with the
included explanatory variables, we do however maintain that the all the explanatory variables
including ISO may be treated as strictly exogenous.10
7 Note that most plants produce several output types implying several QTYPE being set to one. 8 See [1] and [3] for evidence on the impact of these variables using cross-section data. 9 In short panels, the introduction of lag endogenous variables (e.g. Log(Ei,t-12)) as an explanatory variable could lead to biased estimators (see [19]). This should however not be a major issue here as T is relatively large (T=84) (see [19]). Furthermore, in our case, the cure proposed in the literature could worse since it is based on first differencing the model in order to eliminate the plant specific effects and then proceed with an instrumental-variable procedure. First differencing may be problematic since our variable of interest (ISO) is a binary variable. Indeed, (ISOi,t-ISOi,t-1) will only be one when the plant becomes certified and zero otherwise. If the impact of ISO on emissions does not occur precisely at the certification time, we will be unable to detect its impact. 10 In other words, for all the included variables, we assume that stXE siti ,,0),( ,, ∀=ε . Clearly this could be problematic since past emission levels may affect the decision to adopt ISO (feedback effects). However, finding
11

Before turning to the estimation results, it is useful to examine some descriptive statistics.
Table 1 reports the variables mean and standard deviation both for the whole sample and for the
two groups of plants in our sample i.e. adopters and non-adopters. These figures confirm that
ISO adopters are polluting somewhat more than non-adopters. This could however be linked to
differences in the two groups characteristics. Adopters are larger (both in terms of production
and water flows), they also tend to be producing pulp and newsprints while non-adopters are
more often involve in cardboard and other paper production. Relating to these differences are
variations in the type of technology used. These observations strongly suggest that the variable
ISO is correlated with several of the included variables making the RE specification likely
inadequate.
5. The Results
5.1 The Base Case
Table 2 reports the estimation results for the BOD and TSS emission equations. Beside the RE
and FE estimates, we also report the OLS results. As expected, several coefficient estimates are
affected when plant specific effects are taken into account. For both equations in the RE
specification, the Breusch-Pagan test strongly rejects the hypothesis of . Similarly, in the
FE specification, the hypothesis of no plant specific effects is rejected for both cases.
Furthermore, for several variables including ISO, the RE and FE estimates are quite different
suggesting correlation between the plant effects and the included variables. Using a Hausman
type specification test, we strongly reject the null hypothesis of no correlation for both BOD and
TSS.
02 =ασ
11 We therefore focus our analysis on the FE results. As [11] and [12], the coefficients on
the 12 months lag emissions are positive and statistically significant. For BOD, ISO certification
is associated with a statistically significant reduction in emissions of about 8.6%. The ISO
certification does not however appear to have a significant impact on TSS discharges. The same
good instruments for ISO is difficult and there are mounting evidence that inference based on weak instruments may be very misleading [16]. 11 The test is based on the RE model augmented by the within transformation of the explanatory variables (see [19]). In the absence of correlation, these additional variables will not be jointly statistically significant. We obtain respectively for BOD and TSS F-values of 135.24 and 75.47 with (7, 3144) degrees of freedom clearly rejecting the null hypothesis of no correlation.
12
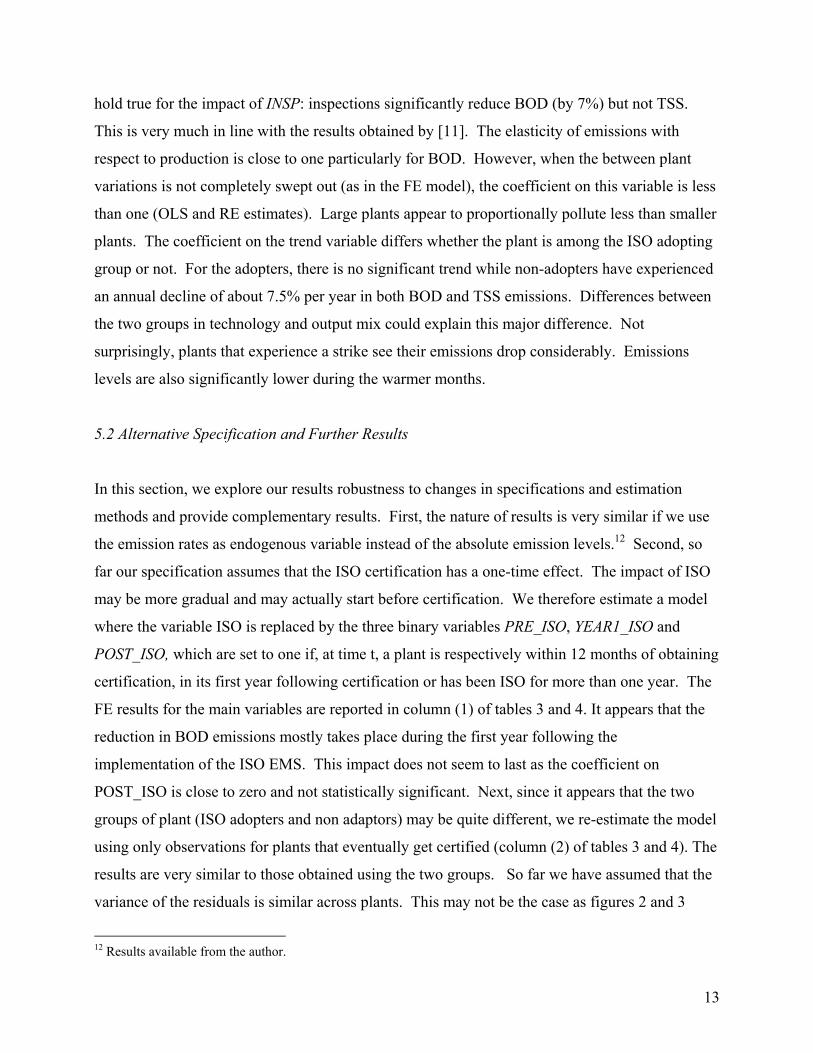
hold true for the impact of INSP: inspections significantly reduce BOD (by 7%) but not TSS.
This is very much in line with the results obtained by [11]. The elasticity of emissions with
respect to production is close to one particularly for BOD. However, when the between plant
variations is not completely swept out (as in the FE model), the coefficient on this variable is less
than one (OLS and RE estimates). Large plants appear to proportionally pollute less than smaller
plants. The coefficient on the trend variable differs whether the plant is among the ISO adopting
group or not. For the adopters, there is no significant trend while non-adopters have experienced
an annual decline of about 7.5% per year in both BOD and TSS emissions. Differences between
the two groups in technology and output mix could explain this major difference. Not
surprisingly, plants that experience a strike see their emissions drop considerably. Emissions
levels are also significantly lower during the warmer months.
5.2 Alternative Specification and Further Results
In this section, we explore our results robustness to changes in specifications and estimation
methods and provide complementary results. First, the nature of results is very similar if we use
the emission rates as endogenous variable instead of the absolute emission levels.12 Second, so
far our specification assumes that the ISO certification has a one-time effect. The impact of ISO
may be more gradual and may actually start before certification. We therefore estimate a model
where the variable ISO is replaced by the three binary variables PRE_ISO, YEAR1_ISO and
POST_ISO, which are set to one if, at time t, a plant is respectively within 12 months of obtaining
certification, in its first year following certification or has been ISO for more than one year. The
FE results for the main variables are reported in column (1) of tables 3 and 4. It appears that the
reduction in BOD emissions mostly takes place during the first year following the
implementation of the ISO EMS. This impact does not seem to last as the coefficient on
POST_ISO is close to zero and not statistically significant. Next, since it appears that the two
groups of plant (ISO adopters and non adaptors) may be quite different, we re-estimate the model
using only observations for plants that eventually get certified (column (2) of tables 3 and 4). The
results are very similar to those obtained using the two groups. So far we have assumed that the
variance of the residuals is similar across plants. This may not be the case as figures 2 and 3
12 Results available from the author.
13

suggest. Furthermore, serial correlation may be present. We re-estimate the model allowing the
variance of the residuals to differ across each plant (i.e. Var ) and allowing for an AR(1)
serial correlation structure (i.e.
2, )( iti σε =
tititi ,1,, ξρεε += − ). Our main conclusions are unaffected by these
changes (see column 3 tables 3 and 4).
6. Discussion and Conclusion
Despite growing interest in voluntary measures to address environmental externalities, there is, so
far, few empirical evidence of the effectiveness of these initiatives. One good example is the
international norm ISO 14001 that is becoming increasingly popular but whose environmental
impact has not yet been extensively evaluated. In this paper, we address this issue by testing if
the ISO certification of an EMS has a significant impact on two traditional indicators (BOD and
TSS) in the Quebec pulp and paper industry. Using a very rich panel dataset covering 38 plants
over the 1997-2003 period, we find rather mix evidence on the effectiveness of the ISO
certification. While it appears that BOD emission significantly decline as a result of the
certification, we find evidence that this decline is not permanent as emission returns to normal
after twelve months. ISO certification is not associated with any significant changes in TSS
emissions. Furthermore, we find that non-adopting plants have experienced overtime more
significant emission reductions than plants that eventually adopt ISO.
While one could conclude that the ISO norm is ineffective, several limitations of our
analysis could temper this conclusion. First, both BOD and TSS have long been regulated in the
pulp and paper industry and compliance has been relatively high. It may therefore well be that an
ISO – EMS put more emphases on newly regulated pollutants or even on contaminants that are
not yet legally controlled (for example green house gases). Unfortunately, data for other
pollutants are either unavailable or measured much less frequently making an econometric
analysis more perilous. Second, recall that our analysis specifically tests the impact of the ISO
certification of an EMS. The adoption of an EMS could therefore well have a significant
impact.13 Third, our maintain hypothesis of strict exogeneity of the regressors could bias our
results. Poor environmental performance could trigger the decision to adopt ISO thereby creating
feedbacks effects from past emissions to the ISO variable. In such circumstances, the FE
13 Note that our ISO variable should however be somewhat correlated with the adoption of an EMS.
14

estimators will be bias [19]. It is unclear however if the biases go against the effectiveness of
ISO in reducing emissions. These limitations suggest extensions for future research.
15

05
1015
20N
umbe
r of I
SO 1
4001
pla
nts
1996 1997 1998 1999 2000 2001 2002 2003
Figure 1. Number of ISO 14001 plants per year
.000
5.0
01.0
015
.002
.002
5N
on a
dopt
ers/
Ado
pter
s
Jan 1996 Jan 1998 Jan 2000 Jan 2002 Jan 2004date
Non adopters Adopters
Figure 2. Average BOD emission per unit of output (ton/ton)
.001
5.0
02.0
025
.003
.003
5.0
04N
on A
dopt
ers/
Ado
pter
s
Jan 1996 Jan 1998 Jan 2000 Jan 2002 Jan 2004date
Non Adopters Adopters
Figure 3. Average TSS emission per unit of output (ton/ton)
16

Figure 4. Determination of the Equilibrium Level of Emissions.
EMPMAC
Emissionse*
$
17

Table 1. Descriptive Statistics Variable Sample Adopters Non-Adopters
TSS emissions (tons) 52.20 (88.97)
66.44 (116.8)
39.38 (49.16)
TSS rate (emission/Q) 0.0021 (0.0024)
0.0024 (0.003)
0.0019 (0.0016)
BOD emissions (tons) 27.69 (56.80)
39.10 (77.58)
17.43 (22.20)
BOD rate (emission/Q) 0.0011 (0.0014)
0.0013 (0.0019)
0.0009 (0.0007)
Quantity of Water Rejected (W) (cube meter) 1252 (1103)
1590 (1134)
947 (974)
ISO 0.17 (0.37)
0.36 (0.48)
0 (0)
Number of Inspections in the last six months (INSP)
0.19 (0.40)
0.19 (0.40)
0.20 (0.40)
Production (Q) (ton) 21802 (13939)
25679 (12657)
18312 (14120)
Strike (STRIKE) 0.006 (0.078)
0.007 (0.088)
0.004 (0.068)
PROCESS 1 (1 = Mechanical Pulp) 0.10 (0.30)
0.05 (0.22)
0.14 (0.35)
PROCESS 2 (1 = Chemithermomechanical Pulp) 0.21 (0.40)
0.27 (0.44)
0.15 (0.35)
PROCESS 3 (1 = Kraft Pulp) 0.21 (0.40)
0.22 (0.41)
0.20 (0.40)
PROCESS 4 (1 = Other Chemical Pulp) 0.14 (0.35)
0.05 (0.22)
0.22 (0.41)
PROCESS 5 (1 = Recycled Pulp) 0.35 (0.47)
0.33 (0.47)
0.37 (0.48)
PROCESS 6 (1 = Pulp Bought) 0.38 (0.48)
0.33 (0.47)
0.42 (0.49)
PROCESS 7 (1 = De-inking) 0.21 (0.40)
0.27 (0.44)
0.15 (0.35)
PROCESS 8 (1 = Bleaching) 0.21 (0.40)
0.27 (0.44)
0.15 (0.35)
PROCESS 9 (Base: Thermomechanical Pulp) 0.38 (0.48)
0.50 (0.50)
0.27 (0.44)
QTYPE 1 (1 = Pulp) 0.26 (0.44)
0.33 (0.47)
0.20 (0.40)
QTYPE 2 (1 = Other Paper) 0.44 (0.49)
0.33 (0.47)
0.55 (0.49)
QTYPE 3 (1 = Cardboard) 0.21 0.11 0.30
18

(0.40) (0.31) (0.45) QTYPE 4 (Base: Newsprint) 0.39
(0.48)
0.44 (0.49)
0.35 (0.47)
Number of observations 3192 1512 1680
19
Table 2. Results for the Base Case. BOD Emissions TSS Emissions Explanatory Variables
OLS RE FE OLS RE FE
Constant -3.119*** ( 0.3478)
-4.107*** (0.3999)
-6.227*** (0.5555)
-3.794*** (0.3252)
-4.539*** (0.3788)
-5.071*** (0.5793)
Log( )12, −tiE 0.5244*** ( 0.0141)
0.2782*** (0.0149)
0.1222*** (0.0148)
0.4379*** (0.0149)
0.2992*** (0.0154)
0.2051*** (0.0158)
ISO -0.173*** ( 0.0416)
-0.0227 (0.0393)
-0.0861** (0.0448)
-0.1667*** (0.0385)
-0.0338 (0.0384)
-0.0236 (0.0467)
INSP -0.079*** ( 0.0290)
0.0786*** (0.0256)
-0.0772*** (0.0229)
-0.0194 (0.0269)
-0.0154 (0.0251)
-0.0117 (0.0239)
Q 0.3636*** ( 0.0238)
0.6161*** (0.0341)
1.0243*** (0.0573)
0.5220*** (0.0233)
0.6809*** (0.0321)
0.9371*** (0.0598)
T_NON_ADOPTERS 0.0004 ( 0.0005)
-0.0018*** (0.0004)
-0.0065*** (0.0005)
-0.0005 (0.0005)
-0.0018*** (0.0004)
-0.0046*** (0.0005
T_ADOPTERS 0.0005 ( 0.0005)
-0.0018*** (0.0005)
0.0007 (0.0008)
-0.0006 (0.0005)
-0.0021*** (0.0005)
-0.00110 (0.0008)
STRIKE -1.752*** ( 0.1536)
-1.4733*** (0.1435)
-0.8506*** (0.1534)
-0.8423*** (0.1426)
-0.6590*** (0.1399)
-0.2701** (0.1599)
MONTH 1 0.0243 ( 0.0556)
0.0579 (0.0488)
0.0690 (0.0437)
-0.0081 (0.0514)
-0.00015 (0.0479)
-0.00118 (0.0455)
MONTH 2 0.0280 ( 0.0555)
0.0504 (0.0487)
0.0743 (0.0436)
-0.0366 (0.0514)
-0.0337 (0.0479)
-0.02613 (0.0454)
MONTH 3 0.0266 ( 0.0555)
0.0347 (0.0487)
0.0254 (0.0436)
-0.0546 (0.0514)
-0.0647 (0.0479)
-0.0803* (0.0455)
MONTH 4 -0.0164 ( 0.0554)
-0.0240 (0.0487)
-0.0403 (0.0435)
-0.0498 (0.0513)
-0.0619 (0.0478)
-0.0769* (0.0454)
MONTH 5 -0.0403 ( 0.0555)
-0.0669 (0.0488)
-0.1105** (0.0439)
-0.0544 (0.0514)
-0.0737 (0.0479)
-0.1026** (0.0457)
MONTH 6 -0.0398 ( 0.0555)
-0.0915* (0.0489)
-0.1549*** (0.0440)
-0.0828 (0.0514)
-0.1081** (0.0480)
-0.1432*** (0.0459)
MONTH 7 -0.0558 ( 0.0556)
-0.1237** (0.0492)
-0.2197*** (0.0450)
-0.0845 (0.0515)
-0.1201** (0.0482)
-0.1756*** (0.0469)
MONTH 8 -0.0797 ( 0.0556)
-0.1481*** (0.0491)
-0.2439*** (0.0450)
-0.1040** (0.0515)
-0.1397*** (0.0482)
0.1949*** (0.0469)
MONTH 9 -0.0590 ( 0.0554)
-0.1120*** (0.0488)
-0.1752*** (0.0439)
-0.0934* (0.0513)
-0.1213** (0.0479)
-0.1577*** (0.0458)
MONTH 10 -0.0507 ( 0.0554)
-0.0918* (0.0487)
-0.1422*** (0.0437)
-0.0667 (0.0513)
-0.0830* (0.0478)
-0.1080** (0.0455)
MONTH 11 0.0049 ( 0.0553)
-0.0084 (0.0486)
-0.0272 (0.0434)
-0.0443 (0.0512)
-0.0551 (0.0477)
-0.0679 (0.0453)
PROCESS 1 -0.0091 ( 0.0595)
0.0248 (0.0829)
- 0.02018*** (0.0555)
0.1993** (0.0773)
-
PROCESS 2 0.3520*** ( 0.0545)
0.6087*** (0.0854)
- 0.2133*** (0.0498)
0.3666*** (0.0766)
-
20
PROCESS 3 0.1777 ( 0.1150)
0.3360* (0.1950)
- -0.6128*** (0.1064)
-0.6789*** (0.1743)
-
PROCESS 4 0.3291*** ( 0.0767)
0.4331*** (0.1101)
- -0.1805** (0.0710)
-0.0792 (0.1010)
-
PROCESS 5 -0.0074 ( 0.0555)
0.0505 (0.0892)
- -0.0391 (0.0515)
0.0208 (0.0804)
-
PROCESS 6 0.0491 ( 0.0413)
0.0837 (0.0605)
- 0.0618 (0.0382)
0.1430** (0.0552)
-
PROCESS 7 0.1412* ( 0.0612)
0.0667 (0.1035)
- -0.0471 (0.0567)
-0.0993 (0.0926)
-
PROCESS 8 -0.491*** ( 0.1810)
-0.9114*** (0.2958)
- -0.5967*** (0.1673)
-0.6297** (0.2653)
-
QTYPE 1 0.9917*** ( 0.1420)
1.531*** (0.2324)
- 1.6207*** (0.1340)
1.8752*** (0.2099)
-
QTYPE 2 0.0538 ( 0.0376)
0.0706 (0.0639)
- -0.0824** (0.0348)
-0.0882 (0.0571)
-
QTYPE 3 -0.193*** ( 0.0541)
-0.2646*** (0.090)
- -0.2452*** (0.0502)
-0.3355*** (0.0808)
-
R2: 0.81 ^2ασ =0.008
^2εσ =0.248
H0: =0 2ασ
2χ (1)=5386
R2: 0.88 H0: all iα =0 F(37,3136)= 77.78
R2: 0.84 ^2ασ =0.007
^2εσ =0.271
H0: =0 2ασ
2χ (1)=2646
R2: 0.88 H0: all iα =0 F(37,3136)= 55.05
21

Table 3. Alternative Specification Results – BOD emissions. Explanatory Variables
(1) (2) (3)
Constant -3.450*** (0.4174)
-8.314*** (0.8690)
-5.517*** (0.5846)
Log( )12, −tiE 0.1225*** (0.0148)
0.1085*** (0.0201)
0.0828** (0.0153)
ISO - -0.0746* (0.0411)
-0.1083** (0.0526)
PRE_ISO -0.0193 (0.0467)
- -
YEAR1_ISO -0.1403** (0.0566)
- -
POST_ISO -0.0204 (0.0703)
- -
INSP -0.0778*** (0.0229)
-0.0450 (0.0303)
-0.0322 (0.0239)
Q 1.031*** (0.0574)
1.255*** (0.0819)
1.157*** (0.0499)
T_NON_ADOPTERS -0.0065*** (0.0005)
-0.0059*** (0.0007)
T_ADOPTERS 0.0003 (0.0010)
0.00005 (0.0007)
0.00055 (0.0009)
R2 0.88 0.86 ^ρ =0.54
22

Table 3. Alternative Specification Results – TSS emissions. Explanatory Variables
(1) (2) (3)
Constant -3.758*** (0.4343)
-5.656*** (0.8861)
-7.501*** (0.5850)
Log( )12, −tiE 0.2046*** (0.0158)
0.1363*** (0.0225)
-0.1159*** (0.0163)
ISO - -0.0213 (0.0418)
-0.0442 (0.0528)
PRE_ISO 0.0347 (0.0486)
- -
YEAR1_ISO -0.0541 (0.0589)
- -
POST_ISO 0.1169 (0.0732)
- -
INSP -0.0119 (0.0238)
-0.0012 (0.0309)
-0.0142 (0.0241)
Q 0.9459*** (0.0598)
1.0832*** (0.0832)
1.0032*** (0.0515)
T_NON_ADOPTERS -0.0046*** (0.0005)
-0.0028*** (0.0006)
T_ADOPTERS -0.0024** (0.0010)
-0.0012 (0.0007)
-0.00028 (0.0009)
R2 0.88 0.79 ^ρ =0.51
23

References [1] W. R. Q. Anton, G. Deltas and M. Khanna, Incentives for environmental self-regulation and
implications for environmental performance, Journal of Environmental Economics and Management 48 (2004) 632-654.
[2] O. Boiral and J.-M. Sala, Environmental Management: Should Industry Adopt ISO 14001?,
Business Horizons / January-February 1998. [3] Dasgupta S., H. Hettige and D. Wheeler, What Improves Environmental Compliance?
Evidence from Mexican Industry, Journal of Environmental Economics and Management, 39, 39-66 (2000).
[4] C. Dion, P. Lanoie and B. Laplante, Monitoring of Pollution Regulation: Do Local
Conditions Matter?, Journal of Regulatory Economics; 13:5-18 (1998). [5] J. Foulon, P. Lanoie and B. Laplante, Incentives for Pollution Control : Regulation or
Information?, Journal of Environmental Economics and Management 44, 169-187 (2002). [6] E. Helland, The Enforcement of Pollution Control Laws: Inspections, Violations, and Self-
Reporting, The Review of Economics and Statistics, Vol. 80, No. 1 (Feb., 1998), 141-153. [7] M. Khanna and W.R. Q. Anton, Corporate Environmental Management, Land Economics,
Vol. 78 (4), 539-557. [8] M. Khanna and L. A. Damon, EPA’s Voluntary 33/50 Program: Impact on Toxic Releases
and Economic Performance of Firms, Journal of Environmental Economics and Management 37, 1-25 (1999).
[9] K. Kollman and A. Prakash, EMS-based Environmental Regimes as Club Goods: Examining
Variations in Firm-level Adoption of ISO 14001 and EMAS in U.K., U.S. and Germany, Policy Sciences; March 2002; 35: 43-67, 2002.
[10] P. Lanoie, M. Thomas and J. Fearnley, Firms Responses to Effluent Regulations: Pulp and
Paper in Ontario, 1985-1989, Journal of Regulatory Economics; 13:103-120 (1998). [11] B. Laplante and P. Rilstone, Environmental Inspections and Emissions of the Pulp and
Paper Industry in Quebec, Journal of Environmental Economics and Management, 31, 19-36 (1996).
[12] W. A. Magat and W. K. Viscusi, Effectiveness of the EPA’s Regulatory Enforcement: The
Case of Industrial Effluent Standards, Journal of Law and Economics, Vol. 33, No. 2 (Oct., 1990), 331-360.
24

25
[13] M. Nakamura, T. Takahashi and I. Vertinsky, Why Japanese Firms Choose to Certify: A Study of Managerial Responses to Environmental Issues, Journal of Environmental Economics and Management 42, 23-52 (2001).
[14] Quebec Forest Industry Council, Environnemental Performance, Quebec (2001). [15] Quebec Ministry of the Environment, Bilan de conformité environnementale – secteur des
pâtes et papiers, (1996-2002). [16] D. Staiger and J.H. Stock, Instrumental variables regressions with weak instruments,
Econometrica 65(3), 557-586. [17] M. Szymanski and P. Tiwari, ISO 14001 and the Reduction of Toxic Emissions, Policy
Reform, March 2004, Vol. 7(1), pp. 31-42. [18] E. Wall, A. Weersink and C. Swanton, Agriculture and ISO 14000, Food Policy 26 (2001)
35-48. [19] J.M. Wooldridge, Econometric Analysis of Cross Section and Panel Data, The MIT Press,
Cambridge MA, 2002. [20] E. K. Yiridoe, J. S. Clark, G. E. Marett, R. Gordon and P. Duinker, ISO 14001 EMS
Standard Registration Decisions Among Canadian Organizations, Agribusiness; Fall 2003; 19, 4; 439-457.