islamic republic of iran: 2009 article iv consultation—staff … · 2010-04-08 · iran’s...
TRANSCRIPT

© 2010 International Monetary Fund March 2010 IMF Country Report No. 10/74
January 11, 2010 February 3, 2010 January 11, 2010 December 10, 2009 2009 January 29, 2001 Islamic Republic of Iran: 2009 Article IV Consultation—Staff Report; Staff Supplement; Public Information Notice on the Executive Board Discussion; and Statement by the Executive Director for Iran Under Article IV of the IMF’s Articles of Agreement, the IMF holds bilateral discussions with members, usually every year. In the context of the 2009 Article IV consultation with Iran, the following documents have been released and are included in this package: The staff report for the 2009 Article IV consultation, prepared by a staff team of the IMF,
following discussions that ended on December 10, 2009, with the officials of Iran on economic developments and policies. Based on information available at the time of these discussions, the staff report was completed on January 11, 2010. The views expressed in the staff report are those of the staff team and do not necessarily reflect the views of the Executive Board of the IMF.
A staff supplement of January 11, 2010 updating information on recent developments.
A Public Information Notice (PIN) summarizing the views of the Executive Board as expressed during its February 3, 2010 discussion of the staff report that concluded the Article IV consultation.
A statement by the Executive Director for Iran.
The document listed below has been or will be separately released. Selected Issues Paper
The policy of publication of staff reports and other documents allows for the deletion of market-sensitive information.
Copies of this report are available to the public from
International Monetary Fund Publication Services 700 19th Street, N.W. Washington, D.C. 20431
Telephone: (202) 623-7430 Telefax: (202) 623-7201 E-mail: [email protected] Internet: http://www.imf.org
Price: $18.00 a copy
International Monetary Fund
Washington, D.C.

INTERNATIONAL MONETARY FUND
ISLAMIC REPUBLIC OF IRAN
Staff Report for the 2009 Article IV Consultation
Prepared by the Middle East and Central Asia Department
Approved by Juan Carlos Di Tata (MCD) and David Marston (SPR)
January 11, 2010
Mission Dates: February 23–March 10, 2009, Tehran. The consultation discussions continued at the time of the Spring Meetings in Washington D.C., and during November 29-December 9, 2009 in Tehran.
Team: Mr. Guillaume (head), Ms. Farahbaksh, Ms. Zermeño, Mr. Zytek (all MCD), Mr. Krelove (FAD), Mr. Schmidt (MCM expert, Bank of France), and Ms. Djahanyekta (Administrative Assistant, MCD). Mr. Di Tata (MCD) and Mr. Mojarrad (OED) participated in some of the policy discussions.
Meetings: The mission met with the Governor of the Central Bank, the Minister of Economy and Finance, other senior officials, and representatives of the commercial banks.
Exchange arrangement: Iran maintains one exchange restriction and two multiple currency practices subject to approval under Article VIII, Sections 2(a) and 3, respectively. The Fund approved the retention of the two multiple currency practices (MCPs) through March 25, 2010 or the conclusion of the Article IV consultation, whichever is earlier. The exchange rate arrangement has been reclassified as other managed arrangement (Iran maintains a managed float vis-à-vis a basket of currencies). Past surveillance: The authorities and the Fund have generally agreed on broad policy priorities, including in the context of the 2008 Article IV consultation concluded on July 1, 2008. The report and PIN are available at http://www.imf.org/external/pubs/cat/longres.cfm?sk=22281.0

2
Contents Page
Executive Summary ...................................................................................................................3
I. Iran in the Global Economy ...........................................................................................4
II. Recent Political and Economic Developments ..............................................................4
III. Macroeconomic and Financial Policies to Address the Global Economic Downturn and the Recent Drop in Oil Prices..................................................................................9 A. Short- and Medium-Term Outlook .........................................................................10 B. Fiscal Policy ............................................................................................................11 C. Monetary and Financial Policies .............................................................................12 D. External Current Account and Exchange Rate Policy ............................................13 E. Energy Price Reform ...............................................................................................13 F. Risks to the Macroeconomic Outlook .....................................................................16
IV. Staff Appraisal .............................................................................................................18
Text Table Medium-Term Scenario, 2006/07–2014/15 .............................................................................11
Boxes 1. Exchange Rate Assessment............................................................................................9 2. Impact of High Energy Subsidies on Iran’s Economy.................................................14 3. Impact of Oil Price at $40 per Barrel on the Macroeconomic Outlook .......................16
Figures 1. Growth, Unemployment, and Per Capita Income, 2000/01–2008/09 ............................5 2. CPI Inflation and Global Food Prices, 2000/01–2008/09 ..............................................5 3. Fiscal Developments, 2000/01–2008/09 ........................................................................5 4. Monetary Developments, 2000/01–2008/09 ..................................................................6 5. Banking Sector Developments .......................................................................................7 6. Stock Exchange Developments, 2000–09......................................................................8 7. External Sector Developments, 2000/01–2008/09 ........................................................8 8. Energy Price Reform Medium-Term Scenario, 2006/07–2014/15 ..............................15 9. Medium-Term Scenario with Oil Price of $40 per barrel, 2006/07–2014/15..............17
Tables 1. Selected Macroeconomic Indicators, 2006/07–2014/15 ..............................................20 2. Balance of Payments, 2006/07–2014/15......................................................................21 3. Consolidated Accounts of the Central Government and the Oil Stabilization Fund, 2006/07–2009/10 (in billions of Rials) ........................................................................22 4. Consolidated Accounts of the Central Government and the Oil Stabilization Fund, 2006/07–2009/10 (in percent of GDP) ........................................................................23 5. Central Bank Balance Sheet, 2006/07–2009/10 ..........................................................24 6. Monetary Survey, 2006/07–2009/10 ...........................................................................25 7. Vulnerability Indicators, 2003/04–2008/09 .................................................................26
Attachment Draft Public Information Notice ..............................................................................................27

3
EXECUTIVE SUMMARY
Background and outlook
Iran’s economic performance was strong in recent years, supported by high oil prices and expansionary fiscal and monetary policies. However, real GDP growth has slowed following the recent decline in oil prices, the non-oil fiscal position has become tighter, and the banks’ financial situation has weakened. The recent approval of an ambitious energy price reform by Parliament could bring significant medium- and long-term benefits by increasing economic efficiency, and would help improve the macroeconomic outlook.
The 2009/10 budget envisages an increase in non-oil revenue, but the overall fiscal deficit will need to be financed by resorting to Oil Stabilization Fund (OSF) resources. Gross official reserves remained at a comfortable level at end-September 2009. Over the medium term, based on the current WEO oil price projections, government spending will need to be adjusted significantly, in the absence of economic reforms, to achieve a sustainable fiscal position.
Authorities’ views
The authorities were in broad agreement with the staff’s assessment and recommendations.
On fiscal policy, further consolidation is envisaged by broadening the base of the newly implemented VAT and implementing other tax policy and administration measures, and by reducing fuel and nonfuel subsidies.
On monetary policy, the main objectives are to consolidate the recent gains in reducing inflation to low single digit levels, while ensuring adequate liquidity growth to support economic recovery; contain the commercial banks’ access to Central Bank of Iran’s (CBI) lending; and improve the banking system’s regulatory and supervisory framework.
Structural reforms have focused on the proposed energy price reform. The authorities also plan to strengthen the soundness of the banking system.
Staff recommendations
A reduction of energy subsidies and a significant increase of non-oil revenue are needed to improve economic efficiency and achieve a more sustainable medium-term fiscal position.
Monetary policy should aim at consolidating the recent gains in reducing inflation and encouraging financial intermediation. The CBI should limit banks’ access to its lending facilities, and gradually liberalize interest rates. The steady deterioration of banks’ soundness indicators needs to be addressed upfront by restructuring loan portfolios and recapitalizing banks. Greater exchange rate flexibility is needed to support the ongoing external adjustment.

4
I. IRAN IN THE GLOBAL ECONOMY
1. In the last three years, Iran’s economic growth has been robust and its external position has strengthened on the back of rising international oil prices and procyclical policies. Real GDP growth averaged an estimated 5.6 percent a year during 2005/06–2008/09,1
2. Although the Iranian economy is relatively insulated from the recent turmoil in international financial markets, it has been severely affected by the slowdown in global demand and the associated drop in oil prices. Given the limited scope for capital inflows due to international sanctions, the decline in fiscal and export oil revenues has recently led to a reduction in government spending and imports as a percentage of GDP. Although negative spillovers from the U.S. and European banking systems have been limited by the absence of exposure to international assets and the small foreign exposure of Iranian banks, the banking sector’s soundness indicators have deteriorated. Iran’s stock market index has recently rebounded after dropping sharply in the second half of 2008 and early 2009, in line with other global and regional markets.
while gross official reserves reached $80.5 billion (about 12 months of imports) by end-September 2009. Income per capita increased, unemployment declined to about 10 percent, and reportedly general welfare indicators improved. High oil revenues financed an increase in public spending, and boosted liquidity growth. Easy access by banks to the CBI’s lending facilities and negative real interest rates fuelled a credit boom. Higher government spending and subsidized credit contributed to the economic expansion.
3. Iran has the third largest proven oil and gas reserves, and is one of the world’s largest oil producers. Nevertheless, its oil production has declined in recent years and medium term production capacity depends on the resources available for investment in the sector. The prospects for oil investment are uncertain because of Iran’s limited access to external and domestic financing and artificially low domestic energy prices.
II. RECENT ECONOMIC DEVELOPMENTS
4. The sharp decline in the oil price and rising inflation led the authorities to tighten fiscal and monetary policies in the second half of 2008/09. As a result, both economic growth and inflation fell.
• Real GDP growth is estimated by staff to have declined to 2-2½ percent in 2008/09 from almost 7 percent in 2007/08.2
1 The fiscal Iranian year starts on March 21.
This reflects a reduction in oil production and a weakening of non-oil real GDP growth. Domestic activity and demand growth slowed significantly due to the global economic slowdown and lower credit growth (Figure 1).
2 There is a significant margin of error for these estimates as a result of the lack of information on the performance of large enterprises since September 2008.

5
• Tight monetary policy and
continued real exchange rate appreciation succeeded in sharply reducing twelve-month end-of-period CPI inflation from almost 30 percent in October 2008 to about 7½ percent in October 2009. The drop in international commodity prices and good harvest in 2009 have also contributed to the decline in inflation (Figure 2).
5. In line with Iran’s procyclical fiscal stance3
to replace the system of integrated levies.
and the drop in oil prices, the non-oil fiscal deficit is estimated to have declined by one percentage point of GDP, to about 18 percent GDP, in 2008/09 (Figure 3). This was mainly due to a reduction in expenditure. A VAT with a three percent rate was successfully implemented across Iran in September 2008
4
3 See paragraph 15.
4 Under the VAT, tobacco products are taxed at a rate of 15 percent, and the rate on fuel products is 30 percent. No separate set of excise taxes has been introduced. Revenues are shared equally between the central
(continued)
Figure 1. Islamic Republic of Iran: Growth, Unemployment, and Per Capita Income, 2000/01–2008/09 1/
Contribution to Growth by Sector(In percent)
-4
-2
0
2
4
6
8
10
12
2000/01 2002/03 2004/05 2006/07 2008/09
Services Industry
Agriculture Hydrocarbon
Real GDP at factor cost
Sources: Iranian authorities; and Fund staff estimates.
1/ Data for 2008/09 are preliminary. 2/ Last observation December 2008.
Unemployment and Per Capita Income Growth (In percent)
0
2
4
6
8
10
12
14
16
2000/01 2002/03 2004/05 2006/07 2008/09
Per capita income growth
Unemployment rate 2/
Figure 2. Islamic Republic of Iran: CPI inflation and Global Food Prices, 2000/01–2008/09(Twelve-month percentage change)
-30
-20
-10
0
10
20
30
40
50
2000 2001 2002 2003 2004 2005 2006 2007 2008 2009
Overall
Food and Beverages
Core CPI (excludes food and beverages)
Global food price index
Sources: Iranian authorities; and Fund staff estimates. 1/ Last observation: March 2009. Figure 3. Islamic Republic of Iran: Fiscal Developments, 2000/01–2008/09 1/
(In percent of GDP)
Sources: Iranian authorities; and Fund staff estimates
-35
-25
-15
-5
5
15
25
35
2000/01 2002/03 2004/05 2006/07 2008/09
Oil revenue Non oil revenue
Total expenditure Non oil balance
OSF balance

6
6. CBI’s measures to reduce liquidity growth helped contain credit expansion in 2008/09 (Figure 4). While the growth of broad money (M2) and credit was above 20 percent a year over the last three years, in the second half of 2008/09, to bring down liquidity growth, the CBI restructured its lending facilities and issued high denomination CBI notes to replace commercial bank checks.5
Base money contracted in the first half of 2009/10 as banks repaid credit lines opened by the central bank to facilitate the substitution of bank checks in 2008/09. Credit growth declined from 22½ percent in September 2008 to 11 percent in September 2009 as real lending rates increased sharply and banks were reluctant to extend new loans in light of the steady deterioration of their portfolios.
7. The recent data from the banking sector shows a steady weakening of soundness indicators as a result of distorted credit policies and slower domestic demand growth (Figure 5). It also shows an increase in the market share of private banks, which have become leaders in the provision of participatory facilities6
government and the municipalities. Initially, all importers, exporters, and incorporated businesses with annual turnover in excess of three billion rials (about $300,000) are subject to VAT. The VAT law was approved by the Expediency Council rather than the whole Parliament; the Council’s decisions are valid for a period of five years. At that time, the VAT law will need to be submitted to the entire Parliament for approval.
.
5 Commercial bank endorsable checks were effectively circulating in lieu of high-denomination bills. They were issued directly by commercial banks, undermining the CBI’s ability to earn seignorage. 6 Participatory lending is based on profit sharing between bank and customer on the proceeds of the loan. It includes Mosharekat Madani, a joint venture, and Mozarebeh, a contract wherein the bank undertakes to provide the cash capital and other party undertakes to use it for commercial purposes and divide the profit at a specified ratio between the two parties at the end of the term of the contract.
Figure 4. Islamic Republic of Iran: Monetary Developments, 2000/01–2008/09 1/
Sources: Iranian authorities; and Fund staff estimates. 1/ Data through December 2008.
Growth in Monetary Aggregates (In percent)
-10
0
10
20
30
40
50
60
70
2000/01 2002/03 2004/05 2006/07 2008/09
M1
Credit to Economy
Nominal and Real Interest Rates (Lending)(In percent)
-15
-10
-5
0
5
10
15
20
25
2000/01 2002/03 2004/05 2006/07 2008/09
Real lending rate
Nominal lending rate

7
• The use of the banking sector to provide direct financing to mostly private beneficiaries through central bank credit, and limited tools to monitor credit risk and credit quality, have led to strong balance sheet growth, a decline in capital adequacy ratios, and a significant increase in nonperforming assets.
• The decline in the spread between lending and deposit rates has hampered banks’ profitability.
• The deterioration of the banks’ loan portfolios has been broad-based. Despite a decline in real estate prices, the share of NPLs related to housing and construction has been relatively small in comparison to other countries in the region.
Figure 5. Islamic Republic of Iran: Banking Sector Developments 1/(In percent)
Sources: Iranian authorities; and Fund Staff estimates.
1/ Median emerging market data from IMF "Summary of Economic and Financial Indicators for Emerging Market Countries, April 16, 2009."
0%10%20%30%40%50%60%70%80%90%
100%
Mar-03 Mar-04 Mar-05 Mar-06 Mar-07 Mar-08 Sep-08
Share of Banks in the Aggregated Total Balance Sheet of the Banking Sector
Private banks and nonbank credit institutionsSpecialized ba nks
Comme rcial banks
0% 20% 40% 60% 80% 100%
Installment saleCivil partnership
Other*Mozarebeh
HavalehForward transact ions
Gharz-al-hasanehHire purchase
Legal partnershipDirect investment
Facilities Extended Under Islamic Contracts
Comm ercia l banks
Specia lize d b anks
Private banks
0
2
4
6
8
10
12
14
16
18
20
0
2
4
6
8
10
12
14
16
18
20
2004/05 2005/06 2006/07 2007/08
Banks' Capital Adequacy Ratio, 2004/05–2007/08
Ira n Emerging Ma rket Median
0
2
4
6
8
10
12
14
16
18
20
0
2
4
6
8
10
12
14
16
18
20
2004/05 2005/06 2006/07 2007/08
Banks' Return On Assets, 2004/05–2007/08
IranEmerging Market M edian
Average lendin g and deposit rate spread (in perce nt)
Manuf actur in g and mining
Trade
Agriculture
Hou sing
Exports
Con struction0
5
10
15
20
25
30
0
5
10
15
20
25
30
2004/05 2005/06 2006/07 2007/08
Banks' Nonperforming Loans Ratio (Gross), 2004/05–2007/08
IranEmerging marke t median
Iran provisioning rate
Sectoral Breakdown of NPLs, 2008 (In percent of total)
8
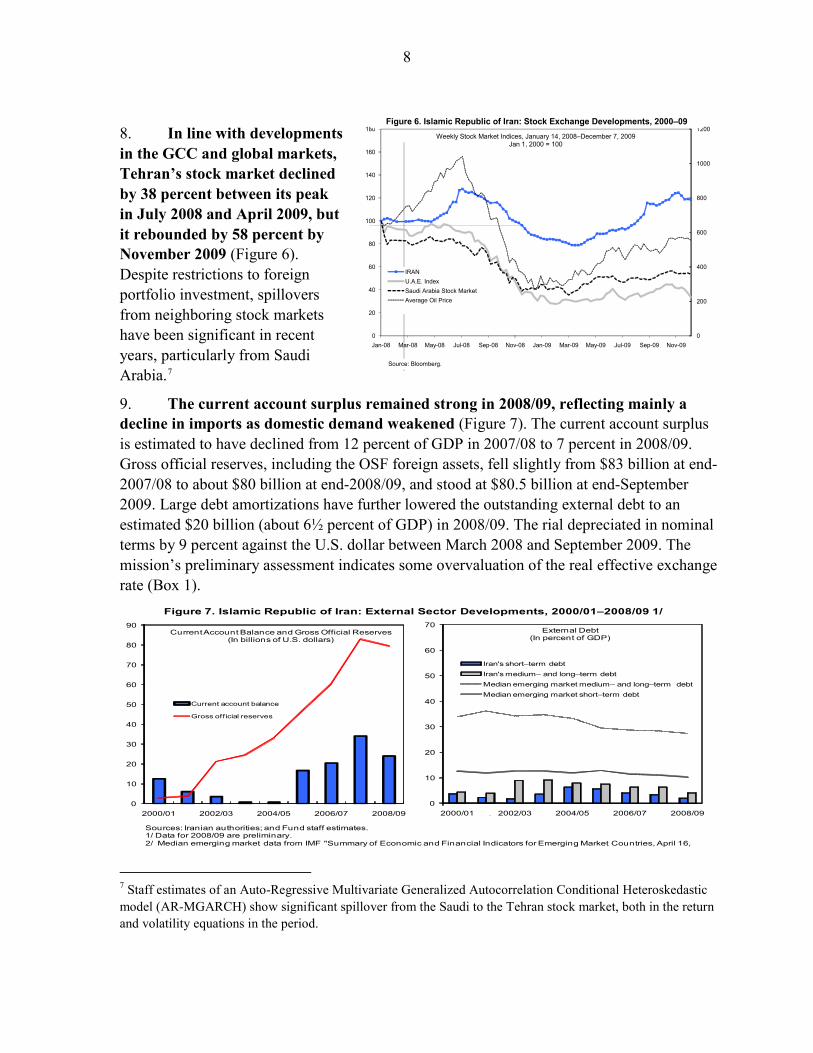
8. In line with developments in the GCC and global markets, Tehran’s stock market declined by 38 percent between its peak in July 2008 and April 2009, but it rebounded by 58 percent by November 2009 (Figure 6). Despite restrictions to foreign portfolio investment, spillovers from neighboring stock markets have been significant in recent years, particularly from Saudi Arabia.7
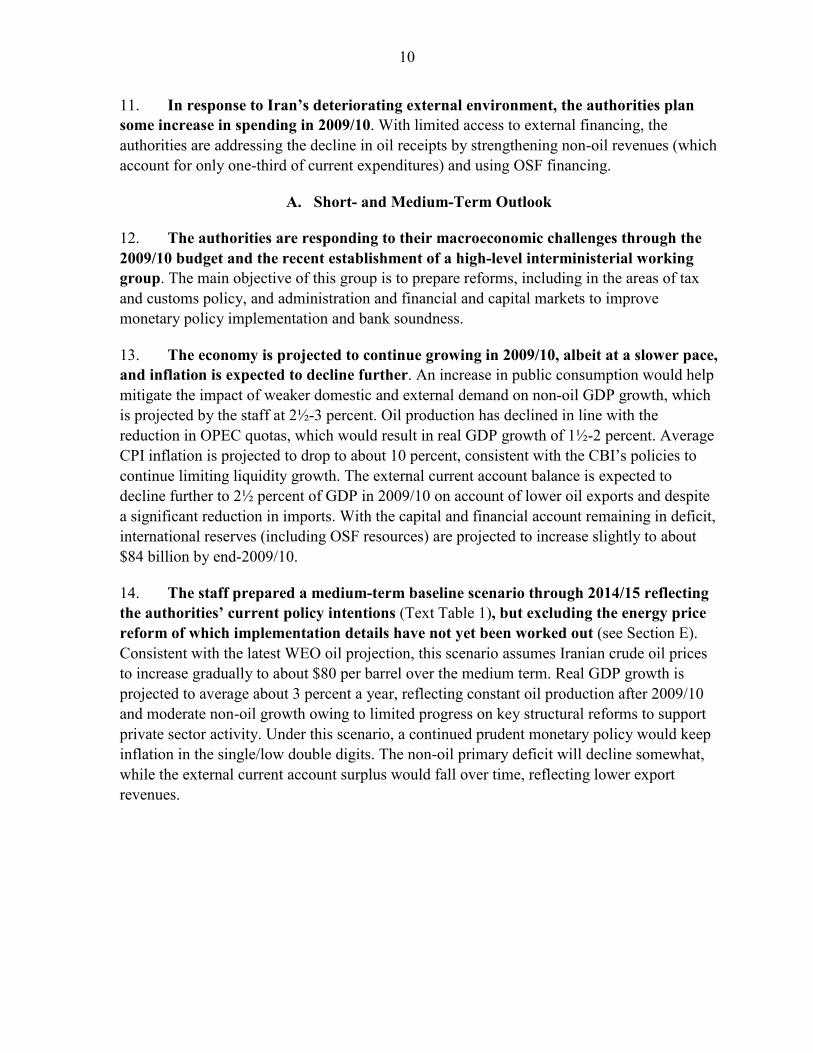
9. The current account surplus remained strong in 2008/09, reflecting mainly a decline in imports as domestic demand weakened (Figure 7). The current account surplus is estimated to have declined from 12 percent of GDP in 2007/08 to 7 percent in 2008/09. Gross official reserves, including the OSF foreign assets, fell slightly from $83 billion at end-2007/08 to about $80 billion at end-2008/09, and stood at $80.5 billion at end-September 2009. Large debt amortizations have further lowered the outstanding external debt to an estimated $20 billion (about 6½ percent of GDP) in 2008/09. The rial depreciated in nominal terms by 9 percent against the U.S. dollar between March 2008 and September 2009. The mission’s preliminary assessment indicates some overvaluation of the real effective exchange rate (Box 1).
s
0
10
20
30
40
50
60
70
2000/01 2002/03 2004/05 2006/07 2008/09
External Debt(In percent of GDP)
Iran's short–term debtIran's medium– and long–term debtMedian emerging market medium– and long–term debtMedian emerging market short–term debt
0
10
20
30
40
50
60
70
80
90
2000/01 2002/03 2004/05 2006/07 2008/09
Current Account Balance and Gross Official Reserves (In billions of U.S. dollars)
Current account balance
Gross official reserves
Figure 7. Islamic Republic of Iran: External Sector Developments, 2000/01–2008/09 1/
Sources: Iranian authorities; and Fund staff estimates. 1/ Data for 2008/09 are preliminary.2/ Median emerging market data from IMF "Summary of Economic and Financial Indicators for Emerging Market Countries, April 16,
7 Staff estimates of an Auto-Regressive Multivariate Generalized Autocorrelation Conditional Heteroskedastic model (AR-MGARCH) show significant spillover from the Saudi to the Tehran stock market, both in the return and volatility equations in the period.
0
200
400
600
800
1000
1200
0
20
40
60
80
100
120
140
160
180
Jan-08 Mar-08 May-08 Jul-08 Sep-08 Nov-08 Jan-09 Mar-09 May-09 Jul-09 Sep-09 Nov-09
Weekly Stock Market Indices, January 14, 2008–December 7, 2009 Jan 1, 2000 = 100
IRANU.A.E. IndexSaudi Arabia Stock MarketAverage Oil Price
Figure 6. Islamic Republic of Iran: Stock Exchange Developments, 2000–09
Source: Bloomberg.

9
Box 1. Islamic Republic of Iran: Exchange Rate Assessment
Staff’s econometric estimates suggest that the rial was slightly overvalued at end-2008. A CGER-type assessment using the equilibrium real effective exchange rate (ERER) approach suggests that the rial was undervalued during the late 1990s up to 2003/04.1 Starting in 2005/06, the terms of trade gains owing to higher oil prices appreciated the equilibrium REER. At the same time, Iran’s high inflation relative to its trading partners appreciated the actual REER considerably, ultimately reversing the estimated undervaluation. In 2008/09, the rial became slightly overvalued with the worsening of the terms of trade and the increase in domestic inflation relative to partner countries. Panel mean estimates for oil producing countries suggest some overvaluation as of end-2008/09.
The macroeconomic balance (MB) approach also indicates a small overvaluation of the rial in 2008. Based on a panel regression for oil-exporting countries, the current account norm for Iran would be a surplus of about eight percent of GDP. This compares with a projected surplus of about 1½ percent over the medium term. As for other oil-producing countries, these estimates are subject to a high degree of uncertainty.
________________
1/ “Methodology for CGER Exchange Rate Assessments,” IMF, November 2006 www.imf.org/external/np/pp/eng/2006/110806.pdf).
III. MACROECONOMIC AND FINANCIAL POLICIES TO ADDRESS THE GLOBAL ECONOMIC DOWNTURN AND THE RECENT DROP IN OIL PRICES
10. The authorities’ main medium-term macroeconomic challenges are to support non-oil GDP growth, further reduce inflation, and lessen Iran’s fiscal dependency on oil. As part of Iran’s reform efforts, the Parliament has recently approved an important energy price reform to be implemented in the context of the 2010/11 budget. The reform aims at reducing/eliminating price subsidies on domestic energy consumption and other commodities in order to remove a major economic distortion, enhance economic efficiency, and improve the fiscal position in the medium term. The authorities also intend to strengthen the banking sector to ensure that it continues to support growth.
Sources: Iranian authorities and Fund staff estimates.
-150
-50
50
150
250
350
450
550
650
750
850
1981 1984 1987 1990 1993 1996 1999 2002 2005 2008
Actual and Equilibrium Real Effective Exchange Rate Indices, 1981–2008
Actual REER 2000 = 100
Misalignment (in percent)
Equilibrium REER (Index)
Actual REER (Index)
-12
-8
-4
0
4
8
12
2007 2008 2009 2010 2011 2012 2013 2014
Projected Current Account Balance and Norm, 2007–2014(In percent of GDP)
Misalignment (in percent)
Projected Current Account Balance
Current Account Norm (2014)
10
11. In response to Iran’s deteriorating external environment, the authorities plan some increase in spending in 2009/10. With limited access to external financing, the authorities are addressing the decline in oil receipts by strengthening non-oil revenues (which account for only one-third of current expenditures) and using OSF financing.
A. Short- and Medium-Term Outlook
12. The authorities are responding to their macroeconomic challenges through the 2009/10 budget and the recent establishment of a high-level interministerial working group. The main objective of this group is to prepare reforms, including in the areas of tax and customs policy, and administration and financial and capital markets to improve monetary policy implementation and bank soundness.
13. The economy is projected to continue growing in 2009/10, albeit at a slower pace, and inflation is expected to decline further. An increase in public consumption would help mitigate the impact of weaker domestic and external demand on non-oil GDP growth, which is projected by the staff at 2½-3 percent. Oil production has declined in line with the reduction in OPEC quotas, which would result in real GDP growth of 1½-2 percent. Average CPI inflation is projected to drop to about 10 percent, consistent with the CBI’s policies to continue limiting liquidity growth. The external current account balance is expected to decline further to 2½ percent of GDP in 2009/10 on account of lower oil exports and despite a significant reduction in imports. With the capital and financial account remaining in deficit, international reserves (including OSF resources) are projected to increase slightly to about $84 billion by end-2009/10.
14. The staff prepared a medium-term baseline scenario through 2014/15 reflecting the authorities’ current policy intentions (Text Table 1), but excluding the energy price reform of which implementation details have not yet been worked out (see Section E). Consistent with the latest WEO oil projection, this scenario assumes Iranian crude oil prices to increase gradually to about $80 per barrel over the medium term. Real GDP growth is projected to average about 3 percent a year, reflecting constant oil production after 2009/10 and moderate non-oil growth owing to limited progress on key structural reforms to support private sector activity. Under this scenario, a continued prudent monetary policy would keep inflation in the single/low double digits. The non-oil primary deficit will decline somewhat, while the external current account surplus would fall over time, reflecting lower export revenues.

11
B. Fiscal Policy
15. The overall fiscal deficit (on a cash basis) is projected to widen moderately to 2.7 percent in 2009/10 from 0.7 percent in 2008/09, owing mainly to lower oil revenues. The 2009/10 budget envisages a decline in the non-oil primary fiscal deficit to about 16 percent of GDP, from 18 percent in 2008/09, mainly as a result of a further strengthening of tax administration and larger VAT registration that more than offsets a planned increase in spending. There is no scope of fiscal stimulus due to the lack of access to external financing and limited OSF resources. The authorities are accelerating their privatization program to help finance the non-oil deficit.
16. The system of indirect taxes is being modernized with the introduction of the VAT, and the authorities are considering other measures to improve tax policy and administration. The VAT net is to be broadened by widening registration to smaller and unincorporated businesses, closely monitoring the processing of VAT refunds, and strengthening the audit function. Over the medium term, the authorities intend to study the benefits of increasing the standard VAT rate and broadening the tax base by including real estate and fee-based financial services. They will also assess the benefits of reducing the dispersion in import tariff rates and broadening the import base.
17. Looking forward, the authorities plan to modernize the income tax and customs duty systems to support a diversification away from oil. In particular, they are focusing on
2006/07 2007/08 2008/09 2009/10 2010/11 2011/12 2012/13 2013/14 2014/15
Real GDP at market prices 5.8 7.8 2.3 1.8 3.0 3.2 3.2 3.2 3.2CPI inflation (average) 11.9 18.4 25.4 10.3 8.5 10.0 10.0 10.0 10.0
Overall general government balance (cash basis) 0.7 2.7 -0.7 -2.7 -1.4 -1.3 -1.3 -1.2 -0.7Non-oil primary balance (commitment basis) -20.7 -19.0 -17.9 -16.1 -15.6 -14.7 -14.0 -12.9 -11.3Non-oil primary balance in percent of non-oil GDP (commitment basis) -28.2 -26.4 -23.7 -20.0 -19.6 -18.3 -17.3 -15.8 -13.8
Gross government debt 19.7 17.9 16.1 16.3 14.8 13.9 12.8 11.9 10.9Gross assets 2/ 15.5 17.4 14.2 12.2 10.2 8.6 6.8 5.4 4.5
External current account balance 9.2 11.9 7.2 2.6 2.4 1.6 1.3 0.6 0.2Investment 32.6 33.2 34.5 31.9 31.5 31.1 30.5 29.4 27.7
Change in stocks 6.2 7.4 8.0 9.4 9.0 8.6 8.3 8.0 7.6Total fixed capital investment 26.4 25.8 26.5 22.6 22.5 22.5 22.2 21.4 20.1
Public 11.1 8.6 9.9 7.9 8.0 8.0 7.6 6.9 5.6Private 15.3 17.1 16.6 14.6 14.5 14.5 14.6 14.6 14.5
Gross national savings 41.7 45.1 41.7 34.5 34.0 32.7 31.8 30.0 27.9Public 11.8 11.3 9.2 5.2 6.6 6.7 6.3 5.7 4.8Private 30.0 33.8 32.5 29.3 27.4 26.0 25.5 24.3 23.0
Gross official reserves (in billions of U.S. dollars) 60.5 82.9 79.6 84.3 89.5 93.4 96.8 98.2 98.0 In months of imports of goods and services 10.1 11.5 12.5 12.0 11.9 12.0 11.9 11.8 11.9
Memorandum items:Oil and gas sector
Total oil and gas exports (in billions of U.S. dollars) 62.0 81.8 81.9 59.2 64.4 64.4 63.4 62.2 60.7Average oil export price (in U.S. dollar/barrel; WEO proj.) 63.3 80.7 84.2 69.1 77.6 80.3 82.0 83.9 85.6Average oil export price (in U.S. dollars/barrel) 57.5 75.5 79.7 65.4 73.5 76.0 77.6 79.4 81.1Crude oil production (in millions of barrels/day) 4.0 4.1 3.9 3.7 3.7 3.7 3.7 3.7 3.7
Sources: Iranian authorities; and Fund staff estimates and projections.
1/ The Iranian fiscal year ends March 20.2/ Government deposits with the banking system.
Staff Projections
Text Table 1. Islamic Republic of Iran: Medium-Term Scenarios, 2006/07–2014/15 1/
I. Baseline Scenario
(Annual percentage change)
(In percent of GDP; unless otherwise indicated)

12
ways to develop self-assessment procedures for corporate income taxes. They are also considering simplifying capital income regulations, introducing general tax incentives such as accelerated depreciation provisions in the business income tax, and reforming taxes on assets.
18. The authorities believe that there is also a need to reduce nonfuel subsidies and are considering phasing out agricultural and food subsidies over the medium term. Substituting targeted transfers to households for these subsidies would result in fiscal savings and would help rationalize consumption.
C. Monetary and Financial Policies
19. Consistent with one of its main policy objectives, the CBI has been implementing measures to reduce inflation. Starting in July 2008, the CBI has taken steps to consolidate its overdraft facility into credit lines. As noted above, it has also regained control over monetary policy by replacing banks’ checks with CBI issued high-denomination bills. These bills are issued at the request of banks, provided they are fully covered by their deposits at the CBI. The CBI also established an interbank market in July 2008 to reduce the banks’ demand for central bank facilities and help improve liquidity management.
20. As a first step toward the gradual liberalization of rates of return, state-owned banks were allowed to equalize the rates of return on term deposits with those of private banks. Moreover, the CBI has proposed to continue adjusting rates of returns in line with trends in consumer price inflation.
21. The authorities have also been taking measures to strengthen banks’ risk management. In particular, they have improved bank supervision by implementing a new banking supervision framework, including a new loan classification system. The CBI has also established a credit rating institute to enhance the transparency of banks’ information on customer credit risk.
22. The authorities intend to recapitalize the banking sector ahead of their full privatization. To this end, a company for the resolution of nonperforming loans was recently created.
23. The authorities adopted implementing regulations for the Anti-Money Laundering (AML) law on December 5, 2009 which incorporate advice provided by staff and reflect progress towards establishing a more comprehensive AML framework. The authorities have prepared a draft law on combating the financing of terrorism (CFT) and have requested further technical assistance to bring Iran’s CFT framework more in line with the international standard. Staff provided preliminary comments on the draft CFT Law and is planning a follow up TA mission in 2010 focusing on CFT and on the various aspects of Iran's developing AML framework.
13
D. External Current Account and Exchange Rate Policy
24. The authorities intend to manage the exchange rate flexibly vis-à-vis a basket of currencies, while preserving an adequate level of international reserves. The staff noted that in the current global economic environment greater exchange rate flexibility would help adjust the external current account and preserve external competitiveness, particularly if consumer prices were to increase significantly after the implementation of the proposed energy price reform.
25. The staff also suggested gradually liberalizing the trade regime, improving customs procedures, and pursuing preparatory work toward WTO accession. The authorities believe in the advantages of a simplified customs tariff schedule and are considering changes as part of their review of tax policy and administration.
E. Energy Price Reform8
26. To reduce the negative impact on the economy of high energy subsidies (Box 2), the Parliament has approved a bill to increase domestic energy prices and phase out subsidies on several other commodities and services.
9
27. The proposed energy price reform could bring significant medium- and long-term benefits by increasing economic efficiency, and would help address the risks to the macroeconomic outlook. The reform would strengthen the fiscal and external positions by reducing implicit energy subsidies and gasoline imports. It would also facilitate higher investment in oil production capacity and electricity generation. The authorities are aware that, in the short-run, the reform could trigger major changes in the economy by (i) increasing the cost of energy and non-energy products made in Iran, which would result in a one-off-increase in production costs and output prices, and would affect the external competitiveness of some Iranian producers; and (ii) changing the demand pattern of goods and services.
While details on the implementation of the energy bill still need to be worked out, the reform bill envisages a gradual price increase over a period of 5 years towards Iran border f.o.b. prices, with a significant upfront price adjustment. To offset the short-term negative impact on wealth and consumption, the bill also contemplates compensatory measures for households and enterprises, including cash transfers and incentives to support the adoption of more energy-efficient technologies. To facilitate the implementation of the proposed reform, the authorities have initiated a media campaign to make the public aware of the need to adjust fuel prices.
8 See selected issues paper on “The Economics of Energy Price Reform in the Islamic Republic of Iran”. 9 The bill targets subsidies on gasoline, diesel, natural gas, LNG, CNG, electricity, water, wheat, flour, rice milk, sugar, edible oils, and aviation, rail, and postal services.

14
Box 2. Impact of High Energy Subsidies on Iran’s Economy
At a price of 10 cents per liter of gasoline, Iran’s energy products are amongst the most heavily subsidized in the world. This has encouraged excessive use of energy (both in per capita terms and per unit of GDP), as reflected by Iran’s move from being one of the lowest energy intensity users in the world in 1980 to one of the highest in 2009 (Figure 8). Low energy prices have encouraged the development of energy intensive industries and excessive consumption, causing pollution and environmentally related damage. Low energy prices have also resulted in insufficient resources for adequate investment in oil production and refineries. Excessive gasoline consumption has turned Iran into a net gasoline importer, with a negative impact on the external current account and the fiscal balance.
Sources: Country authorities; EIA; Eurostat; International Energy Annual 2006; U.S. Department of Energy; and Fund staff estimates.
International Comparison of Primary Energy Intensities in 1980(Energy consumption, Btu per 2000 U.S. dollars at purchasing
power parity GDP)
0 4,000 8,000 12,000 16,000
Iran
U.A.E.
Mexico
Switzerland
Pakistan
Venezuela
United States
International Comparison of Primary Energy Intensities in 2006(Energy consumption, Btu per 2000 U.S. dollars at purchasing
power parity GDP)
0 5,000 10,000 15,000 20,000
Switzerland
Mexico
Pakistan
United States
Venezuela
Iran
U.A.E.
Retail Gasoline Price in Selected Middle East Countries, Q1 2008(In Rials per liter)
0 2,000 4,000 6,000 8,000 10,000 12,000
IranLibyaEgyptQatar
BahrainIraq
United Arab EmiratesTurkmenistan
Kyrgyz_RepublicAzerbaijan
KazakhstanPakistan
Mauritania
Islamic Republic of Iran: Comparison of Primary Energy Intensity and Gasoline Prices

15
Figure 8. Islamic Republic of Iran: Energy Price Reform Medium-Term Scenario, 2006/07–2014/15
0
2
4
6
8
10
0
2
4
6
8
10
2006/07 2008/09 2010/11 2012/13 2014/15
Real GDP Growth
BaselineEnergy price reform
0
5
10
15
20
25
30
35
0
5
10
15
20
25
30
35
2006/07 2008/09 2010/11 2012/13 2014/15
CPI Inflation
BaselineEnergy price reform
-10
-5
0
5
10
15
-10
-5
0
5
10
15
2006/07 2008/09 2010/11 2012/13 2014/15
Current Account Balance
BaselineEnergy price reform
0
2
4
6
8
10
0
2
4
6
8
10
2006/07 2008/09 2010/11 2012/13 2014/15
Real Non-Oil GDP Growth
BaselineEnergy price reform
(In percent)
0
50
100
150
200
250
300
0
50
100
150
200
250
300
2006/07 2008/09 2010/11 2012/13 2014/15
Gross Official Reserves
BaselineEnergy price reform
(In billions of U.S. dollars)
1
1.5
2
2.5
3
1
1.5
2
2.5
3
2006/07 2008/09 2010/11 2012/13 2014/15
Crude Oil Exports
Baseline
Energy price reform
(In millions of barrels per day)
(In percent)
(In percent)
(In percent of GDP)

16
28. To illustrate the potential impact of the energy price reform, the staff formulated an alternative macroeconomic scenario assuming a gradual energy price increase starting in 2010/11, with significant frontloading in the first three years (Figure 8). Under this scenario, consumer prices would initially jump as domestic energy prices increase, but inflation would gradually subside thereafter with the appropriate mix of fiscal, monetary, and exchange rate policies. The adjustment of domestic energy prices to international levels would remove a major price distortion in the economy, thereby increasing energy efficiency and improving resource allocation. The reform would also help strengthen the fiscal position by increasing the revenues accruing to the government and energy producers from domestic sales of fuel products, and would provide resources for investment in production capacity. As a result, real non-oil GDP growth is expected to increase gradually to 6½–7½ percent a year over the medium term. The external position would also strengthen because of higher oil export volumes and lower gasoline imports, and official reserves would rise significantly.
F. Risks to the Macroeconomic Outlook
29. The medium-term macroeconomic outlook is subject to considerable downside risks.
• Delays in adopting the appropriate measures to strengthen the banking sector could jeopardize public confidence and banks’ capacity to provide the credit necessary to support higher real GDP growth.
• The upside risk of the planned domestic energy price reform could be more than offset by a lack of social consensus on the appropriate policy mix to accompany the increase in domestic energy prices. This could potentially derail the adjustment process and encourage excessive recourse to CBI financing for on-lending by banks, further weakening the banks’ credit portfolios.
• A decline in oil prices below current WEO projections would put Iran’s economy under serious stress, particularly in the absence of domestic energy price reform. To illustrate this risk, the staff has produced a macroeconomic scenario with international oil prices at $40 per barrel over the next five years (Box 3 and Figure 9).
Box 3. Impact of Oil Price at $40 per Barrel on the Macroeconomic Outlook
The staff assessed the macroeconomic impact of a drop in crude oil prices to $40 per barrel over 2009/10–2014/15. Under this scenario, real GDP growth would decline to about 2½ percent a year, reflecting lower oil production and slower growth in the non-oil sectors owing to reduced public spending and limited credit growth. Revenues of the oil company would be insufficient to ensure the investment necessary to sustain production. Public spending, particularly capital expenditure, would have to contract substantially by 2010/11, given the limited resources available in the OSF. Over the medium term, the projected 11 percent contraction in public spending required in the absence of domestic energy price reform is unlikely to be sustainable. Because of Iran’s relatively high international reserves, the immediate impact of lower export revenues on imports would be limited in the first two years.

17
Figure 9. Islamic Republic of Iran: Medium–Term Scenario with Oil Price of $40 Per Barrel, 2006/07–2014/15
Sources: Iranian authorities; and Fund staff estimates and projections.
0
2
4
6
8
10
0
2
4
6
8
10
2006/07 2008/09 2010/11 2012/13 2014/15
Real GDP Growth
Baseline$40 oil price
-10
-5
0
5
10
15
-10
-5
0
5
10
15
2006/07 2008/09 2010/11 2012/13 2014/15
Current Account Balance
Baseline
$40 oil price
0
2
4
6
8
10
0
2
4
6
8
10
2006/07 2008/09 2010/11 2012/13 2014/15
Real Non-Oil GDP Growth
Baseline
$40 oil price
(In percent)
0
50
100
150
200
250
0
50
100
150
200
250
2006/07 2008/09 2010/11 2012/13 2014/15
Gross Official Reserves
Baseline
$40 oil price
(In billions of U.S. dollars)
1
1.5
2
2.5
3
1
1.5
2
2.5
3
2006/07 2008/09 2010/11 2012/13 2014/15
Crude Oil Exports
Baseline
$40 oil price
(In millions of barrels per day)
0
20
40
60
80
100
0
20
40
60
80
100
2006/07 2008/09 2010/11 2012/13 2014/15
Crude Oil Price
WEO oil prices as of October 2009$40 oil price
(In U.S. dollars per barrel)
(In percent)
(In percent of GDP)
18
IV. STAFF APPRAISAL
30. Iran’s economic performance was strong in recent years, supported by high oil prices and expansionary fiscal and monetary policies. Real GDP growth was above five percent a year, the external position strengthened, and welfare indicators improved. The authorities’ response to the deterioration in the external economic environment, particularly to the sharp decline in oil prices, has been broadly adequate. The non-oil primary deficit was reduced, inflation dropped markedly in the second half of 2008/09 and the first half of 2009/10, and the external position remains strong.
31. However, there are significant risks to the macroeconomic outlook. These include delays in adopting the measures necessary to strengthen the banking sector; possible difficulties in reaching a consensus on the appropriate policy mix to accompany the planned energy price reform; and a significant decline in oil prices.
32. Looking forward, fiscal policy should aim at addressing the impact of the decline in oil revenues in order to contain the need for OSF resources. In this regard, the staff welcomes the non-oil revenue effort envisaged in 2009/10, which is expected to help reduce the non-oil fiscal deficit while allowing for some increase in spending relative to the level of the previous fiscal year. Achieving the projected increase in non-oil revenues will require broadening the VAT registration net, strengthening tax administration to collect arrears from large state-owned enterprises, and simplifying the import tariff schedule to increase the effective tariff rate on imports.
33. The proposed domestic energy price reform is a major step towards improving Iran’s medium-term macroeconomic outlook and fiscal position. This reform will help strengthen the fiscal and external balances, allow for higher investment in the energy sector, and support higher real GDP growth over the medium-term. The success of the reform will depend critically on the effective and timely implementation of a well-targeted mechanism of cash transfers to the poor and steps to facilitate the adoption of energy efficient technologies by the corporate sector. To anchor expectations, it will be important to outline clear macroeconomic policies in support of the reform, including avoiding quasi-fiscal financing through the banking sector and the accumulation of energy-related payment arrears, ensuring adequate tightening of monetary policy to limit the secondary effects of the price increase on the aggregate price level while maintaining sufficient liquidity in the banking sector, and preserving an adequate level of external competitiveness.
34. The recent high volatility of oil prices and the worsened global economic outlook also highlight the need to put in place a rolling medium-term fiscal framework. Such framework should integrate the operations of the central government budget and the OSF in order to reduce macroeconomic volatility and domestic and external vulnerabilities. At the same time, further measures are needed to improve the business climate and encourage the participation of domestic and foreign investors in the privatization and restructuring of public enterprises. In this regard, a close dialogue with World Bank staff on improving the privatization process and implementing other macro-critical reforms would be very helpful.
19
35. The CBI has been successful in regaining control over monetary policy and reducing liquidity to lower inflation. In this regard, the restructuring of overdraft lending into a short-term liquidity facility is a step in the right direction. Going forward, access to the liquidity facility should require the use of collateral, possibly in the form of government participation paper or CBI paper. This would also help develop a secondary market. The staff also welcomes the recent establishment of an interbank market, which constitutes another important step to help improve liquidity management. Going forward, CBI lending to commercial banks for on-lending to the private sector should be discouraged, and the cost of providing assistance to enterprises should be borne by the government through direct budgetary subsidies.
36. The staff welcomes the steps taken thus far to equalize the rates of return on term deposits between different categories of banks and recommends a gradual liberalization of rates of returns, particularly on the lending side. This reform is particularly important in view of the planned domestic energy price reform. The liberalization of rates of return would eliminate distortions, allow for a transparent transmission of the CBI’s monetary policy, restore credit market fluidity, and improve the banking system’s soundness indicators. More generally, the CBI’s independence to implement monetary policy should be strengthened in order to enable it to achieve its price and financial stability objectives.
37. Although Iran’s banking sector has remained relatively insulated from the ongoing international financial crisis, the steady increase in nonperforming loans needs to be addressed upfront, particularly in view of the planned energy price reform. Banks’ balance sheets are likely to be affected by the impact of the increase in energy prices on corporate profits, and the recapitalization of the banking sector is essential to strengthen solvency and liquidity. Equally critical are further efforts to improve data collection on banking facilities and assessment of customer credit risk, and to enhance the regulatory framework on asset and liability management.
38. Recent estimates suggest that the rial is broadly in line with fundamentals. However, in light of the high oil price volatility, greater exchange rate flexibility would help adjust the external current account and maintain a strong reserve position.
39. The authorities should persevere with their efforts to bring Iran’s AML/CFT framework in line with the international standard, with the continued cooperation of international organizations.
40. Although data is broadly adequate for surveillance purposes, the staff recommends improving the timeliness of macroeconomic data provision. High frequency indicators on real sector activity will be especially important to tailor monetary policy during the implementation of the planned domestic energy price reform.
41. It is recommended that the next Article IV consultation with the Islamic Republic of Iran be held on the standard 12-month cycle.

20
Est.2006/07 2007/08 2008/09 2009/10
Oil and gas sectorTotal oil and gas exports (in billions of U.S. dollars) 62.0 81.8 81.9 59.2 64.4 64.4 63.4 62.2 60.7Average oil export price (in U.S. dollars/barrel) 57.5 75.5 79.7 65.4 73.5 76.0 77.6 79.4 81.1Crude oil production (in millions of barrels/day) 4.0 4.1 3.9 3.7 3.7 3.7 3.7 3.7 3.7
National accountsNominal GDP at market prices (in billions of Iranian rials) 2,044,024 2,654,949 3,188,609 3,265,231 3,673,364 4,138,915 4,711,626 5,354,474 6,092,326Nominal GDP (in billions of U.S. dollars) 222.1 285.9 333.1 327.1 353.7 377.2 397.6 420.9 447.7Real GDP at market prices 6.2 8.1 2.3 1.8 3.0 3.2 3.2 3.2 3.2Real GDP at factor cost 6.6 6.7 2.3 1.8 3.0 3.2 3.2 3.2 3.2
Real oil and gas GDP 3.0 0.8 -3.7 -6.7 0.0 0.0 0.0 0.0 0.0Real non-oil GDP 6.6 7.6 2.9 2.7 3.3 3.5 3.5 3.5 3.5
CPI inflation (average) 11.9 18.4 25.4 10.3 8.5 10.0 10.0 10.0 10.0CPI inflation (end of period) 15.3 22.5 17.8 8.0 10.0 10.0 10.0 10.0 10.0GDP deflator at factor cost 13.8 20.5 17.4 0.6 9.2 9.2 10.3 10.1 10.2Unemployment rate (in percent of labor force) 12.1 10.6 9.8 ... ... ... ... ... ...
Investment and savingsInvestment 32.6 33.2 34.5 31.9 31.5 31.1 30.5 29.4 27.7
Change in stocks 6.2 7.4 8.0 9.4 9.0 8.6 8.3 8.0 7.6Total fixed capital investment 26.4 25.8 26.5 22.6 22.5 22.5 22.2 21.4 20.1
Public 11.1 8.6 9.9 7.9 8.0 8.0 7.6 6.9 5.6Private 15.3 17.1 16.6 14.6 14.5 14.5 14.6 14.6 14.5
Gross national savings 41.7 45.1 41.7 34.5 34.0 32.7 31.8 30.0 27.9Public 11.8 11.3 9.2 5.2 6.6 6.7 6.3 5.7 4.8Private 30.0 33.8 32.5 29.3 27.4 26.0 25.5 24.3 23.0
Savings/investment balance 9.2 11.9 7.2 2.6 2.4 1.6 1.3 0.6 0.2Public 0.7 2.7 -0.7 -2.7 -1.4 -1.3 -1.3 -1.2 -0.7Private 8.5 9.3 7.9 5.3 3.9 2.8 2.6 1.8 0.9
Budgetary operations Revenue 29.9 30.9 27.0 24.4 24.7 23.6 22.8 21.7 20.5
Oil 20.8 21.8 17.9 13.4 14.2 13.5 12.7 11.7 10.6Non-oil 8.9 9.0 8.9 10.9 10.3 10.0 9.9 10.0 9.8
Expenditure and net lending, of which: 29.8 28.3 27.0 27.1 26.1 24.9 24.1 23.0 21.3Current 20.3 21.2 18.7 20.7 19.6 18.4 18.0 17.6 17.2Capital 7.1 5.6 7.7 6.4 6.5 6.4 6.1 5.3 4.0
Balance (commitment basis) 0.0 2.7 0.0 -2.7 -1.4 -1.3 -1.3 -1.2 -0.7Balance (cash basis) 0.7 2.7 -0.7 -2.7 -1.4 -1.3 -1.3 -1.2 -0.7Financing -0.7 -2.7 0.7 2.7 1.4 1.3 1.3 1.2 0.7
Domestic financing (banking sector) -1.5 -4.4 0.8 1.7 0.6 0.5 0.7 0.7 0.2Domestic financing (nonbank, including privatization) 0.8 1.7 -0.1 0.9 0.7 0.6 0.6 0.5 0.4External financing 0.0 0.0 0.0 0.1 0.1 0.1 0.1 0.1 0.1
Non-oil balance (commitment basis) -20.7 -19.1 -17.9 -16.1 -15.6 -14.7 -14.0 -12.9 -11.4Non-oil primary balance (commitment basis) -20.7 -19.0 -17.9 -16.1 -15.6 -14.7 -14.0 -12.9 -11.3Non-oil balance (cash basis) -20.0 -19.1 -18.6 -16.1 -15.6 -14.7 -14.0 -12.9 -11.4Non-oil balance in percent of non-oil GDP (commitment basis) -28.3 -26.5 -23.7 -19.9 -19.6 -18.3 -17.4 -15.9 -13.9
Monetary sectorNet foreign assets 16.9 26.9 4.6 10.9 ... ... ... ... ...Net domestic assets 68.2 30.2 18.5 25.9 ... ... ... ... ...Credit to the private sector 34.0 33.3 11.4 11.3 ... ... ... ... ...Narrow money (M1) 29.6 29.7 -2.1 11.1 ... ... ... ... ...Broad money (M3) 39.2 28.6 16.6 14.7 ... ... ... ... ...Velocity of broad money (ratio of GDP to M3) 1.7 1.7 1.7 1.5 ... ... ... ... ...
External sectorExports of goods and services 84.6 107.0 111.1 85.5 92.9 96.2 98.3 99.5 100.5Imports of goods and services -64.7 -73.4 -87.9 -77.8 -85.2 -91.4 -94.4 -98.3 -100.9Current account balance 20.4 34.1 24.0 8.6 8.6 5.9 5.0 2.5 0.9
In percent of GDP at market prices 9.2 11.9 7.2 2.6 2.4 1.6 1.3 0.6 0.2External public and publicly guaranteed debt 23.2 28.1 20.1 16.3 14.2 12.5 11.1 10.1 9.1
Of which: short-term debt 9.1 9.9 6.3 3.3 3.3 3.3 3.3 3.3 3.3Gross official reserves 60.5 82.9 79.6 84.3 89.5 93.4 96.8 98.2 98.0
In months of the following year's imports of goods and services 10.1 11.5 12.5 12.0 11.9 12.0 11.9 11.8 11.9
Memorandum items:Nominal effective exchange rate, 2000/01=100 72.7 68.5 68.0 … … … … … …Real effective exchange rate, 2000/01=100 129.9 139.6 165.8 … … … … … …Average exchange rate (Iranian rials per U.S. dollar) 9,202 9,285 9,574 … … … … … …End-of-period exchange rate (Iranian rials per U.S. dollar) 9,243 8,956 9,717 … … … … … …
Sources: Iranian authorities; and Fund staff estimates and projections.
1/ The Iranian fiscal year ends March 20.
2014/15
(In billions of U.S. dollars; unless otherwise indicated)
(Annual change; in percent; unless otherwise indicated)
(In percent of GDP at market prices; unless otherwise indicated)
(Annual change; in percent; unless otherwise indicated)
2/ In the absence of details on the recently approved bill on removing subsidies in the energy sector, the projections assume no changes in subsidy policies.
Table 1. Islamic Republic of Iran: Selected Macroeconomic Indicators, 2006/07–2014/15 1/ 2/
2010/11 2011/12 2012/13 2013/14Proj.

21
Est. Proj.2006/07 2007/08 2008/09 2009/10 2010/11 2011/12 2012/13 2013/14 2014/15
Current account balance 20,402 34,081 23,987 8,573 8,613 5,852 5,037 2,540 912(in percent of GDP at market prices) 9.2 11.9 7.2 2.6 2.4 1.6 1.3 0.6 0.2
Trade balance 26,035 40,819 32,039 17,081 16,870 12,806 10,888 8,392 6,745Exports 76,055 97,401 100,572 77,408 83,482 84,488 85,079 85,779 86,385
Oil and gas 62,011 81,764 81,855 59,240 64,427 64,355 63,361 62,233 60,746Crude oil 50,717 68,646 70,291 50,502 55,889 56,452 55,820 54,619 53,114Petroleum products and natural gas 11,294 13,118 11,564 8,738 8,538 7,904 7,541 7,614 7,632
Non-oil and gas 14,044 15,637 18,717 18,168 19,055 20,133 21,718 23,546 25,640Imports -50,020 -56,582 -68,533 -60,327 -66,612 -71,683 -74,191 -77,387 -79,640
Services (net) -6,146 -7,198 -8,837 -9,371 -9,207 -7,998 -7,001 -7,116 -7,224
Credits 8,554 9,610 10,566 8,059 9,426 11,756 13,216 13,768 14,077Debits -14,700 -16,808 -19,403 -17,431 -18,633 -19,754 -20,217 -20,884 -21,301
Transfers (net) 513 460 785 864 950 1,045 1,149 1,264 1,391
Capital and financial account balance -4,014 -12,357 -9,597 -3,904 -3,369 -1,985 -1,599 -1,177 -1,127Foreign direct investment and portfolio equity 60 -1,491 -695 -219 -268 -314 -214 -164 -114
Medium- and long-term debt -25 -62 -2,967 -1,702 -2,101 -1,671 -1,385 -1,013 -1,013Trade credit -2,369 -3,693 -5,098 -2,124 0 0 0 0 0
Other capital -1,680 -7,111 -837 141 -1,000 0 0 0 0
Errors and omissions -2,784 690 -17,666 0 0 0 0 0 0
Overall balance 13,604 22,413 -3,276 4,669 5,244 3,867 3,437 1,363 -215
Change in gross official reserves (increase -) -13,604 -22,413 3,276 -4,669 -5,244 -3,867 -3,437 -1,363 215Change in central bank reserve liabilities (increase -) 4,162 1,626 -2,859 0 0 0 0 0 0Change in net official reserves (increase -) -9,442 -20,787 417 -4,669 -5,244 -3,867 -3,437 -1,363 215
Memorandum items:Gross official reserves (in millions of U.S. dollars) 60,450 82,863 79,587 84,257 89,501 93,367 96,804 98,167 97,952
(in months of the following year’s imports) 10.1 11.5 12.5 12.0 11.9 12.0 11.9 11.8 11.9
Gross foreign liabilities of the Central Bank of Iran (in millions of dollars) 8,439 10,065 7,206 7,206 7,206 7,206 7,206 7,206 7,206External debt service (as percent of exports) 4.0 3.6 2.3 4.9 4.1 3.5 3.2 2.7 2.6External debt (in percent of GDP) 10.4 9.8 6.0 5.0 4.0 3.3 2.8 2.4 2.0
Sources: Iranian authorities; and Fund staff estimates and projections.
1/ The Iranian fiscal year ends March 20.
Table 2. Islamic Republic of Iran: Balance of Payments, 2006/07–2014/15 1/(In millions of U.S. dollars; unless otherwise indicated)

22
Est.2006/07 2007/08 2008/09 2009/10 2010/11
Revenues 610,262 821,152 859,906 796,697 905,989
Oil revenues 424,150 578,708 569,951 436,159 521,988
Oil revenues to the budget 392,761 444,278 559,589 498,071 549,211Profit tax on NIOC 1/ 26,134 29,237 36,700 37,000 51,259Dividend transfers from NIOC 23,521 32,425 58,721 60,310 82,014Domestic sale of petroleum products 0 0 0 0 0Budget allocation 181,881 173,519 279,933 177,662 174,190Transfers from OSF 161,225 209,098 184,235 223,099 241,748
Oil revenues transferred to the OSF (after transfers to the budget) 31,389 134,430 10,362 -61,912 -27,223
Non-oil revenues to the budget 182,387 237,893 283,918 354,315 378,974Tax 125,487 162,579 203,042 240,454 270,079
Direct tax 71,557 97,097 130,453 153,994 171,741Indirect tax 14,123 16,663 15,900 29,771 33,202Customs duties 39,806 48,819 56,689 56,689 65,136
Nontax 56,900 75,314 80,876 113,861 108,895
Non-oil revenues to the OSF 3,725 4,551 6,038 6,223 5,027
Expenditure 609,741 750,311 860,240 884,798 958,037
Central government expenditures 561,365 710,022 841,093 884,798 958,037
Current expenditures 415,804 562,306 595,254 676,682 720,837Compensation of employees 133,584 151,583 211,000 229,000 255,465Interest payments 4,743 7,371 5,982 5,982 5,234Subsidies 60,600 62,862 61,000 68,000 73,780Goods and services 32,263 39,119 55,000 71,600 80,686Grants 43,857 13,823 50,800 28,700 32,287Social benefits 69,959 64,492 139,605 181,000 208,385Gasoline imports 43,959 33,820 60,867 34,300 35,000Other 26,839 189,236 11,000 58,100 30,000
Capital expenditures 145,561 147,716 245,839 208,116 237,199
OSF expenditures 48,376 40,289 19,148 0 0Domestic on-lending 48,376 40,289 19,148 0 0Other 0 0 0 0 0
Overall balance (commitment basis) 521 70,841 -334 -88,101 -52,048Overall balance (cash basis) 14,799 70,841 -22,520 -88,100 -52,048
Non-oil balance (commitment basis) -423,629 -507,867 -570,285 -524,259 -574,035Non-oil balance (cash basis) -409,351 -507,867 -592,471 -524,259 -574,035
Financing -14,799 -70,841 22,520 88,100 52,048Foreign financing 673 1,233 858 3,702 3,852Domestic financing -15,472 -72,074 21,663 84,398 48,196
Banking system -30,927 -115,890 24,935 55,689 22,196Central bank -34,913 -132,770 7,142 55,689 22,196Commercial banks 3,987 16,881 17,792 0 0
Other domestic, including privatization 15,455 43,815 -3,272 28,709 26,000
Sources: Iranian authorities; and Fund staff estimates and projections.
1/ National Iranian Oil Corporation.
Proj.
Table 3. Islamic Republic of Iran: Consolidated Accounts of the CentralGovernment and the Oil Stabilization Fund, 2006/07–20010/11
(In billions of rials)

23
Est.2006/07 2007/08 2008/09 2009/10 2010/11
Revenues 29.9 30.9 27.0 24.4 24.7
Oil revenues 20.8 21.8 17.9 13.4 14.2
Oil revenues to the budget 19.2 16.7 17.5 15.3 15.0Profit tax on NIOC 1.3 1.1 1.2 1.1 1.4Dividend transfers from NIOC 1.2 1.2 1.8 1.8 2.2Domestic sale of petroleum products 0.0 0.0 0.0 0.0 0.0Budget allocation 8.9 6.5 8.8 5.4 4.7Transfers from OSF 7.9 7.9 5.8 6.8 6.6
Oil revenues transferred to the OSF 1.5 5.1 0.3 -1.9 -0.7
Non-oil revenues to the budget 8.9 9.0 8.9 10.9 10.3Tax 6.1 6.1 6.4 7.4 7.4
Direct tax 3.5 3.7 4.1 4.7 4.7Indirect tax 0.7 0.6 0.5 0.9 0.9Customs duties 1.9 1.8 1.8 1.7 1.8
Nontax 2.8 2.8 2.5 3.5 3.0
Non-oil revenues to the OSF 0.2 0.2 0.2 0.2 0.1
Expenditure 29.8 28.3 27.0 27.1 26.1
Central government expenditures 27.5 26.7 26.4 27.1 26.1
Current expenditures 20.3 21.2 18.7 20.7 19.6Compensation of employees 6.5 5.7 6.6 7.0 7.0Interest payments 0.2 0.3 0.2 0.2 0.1Subsidies 3.0 2.4 1.9 2.1 2.0Goods and services 1.6 1.5 1.7 2.2 2.2Grants 2.1 0.5 1.6 0.9 0.9Social benefits 3.4 2.4 4.4 5.5 5.7Gasoline imports 2.2 1.3 1.9 1.1 1.0Other 1.3 7.1 0.3 1.8 0.8
Capital expenditures 7.1 5.6 7.7 6.4 6.5
OSF expenditures 2.4 1.5 0.6 0.0 0.0Domestic on-lending 2.4 1.5 0.6 0.0 0.0Other 0.0 0.0 0.0 0.0 0.0
Overall balance (commitment basis) 0.0 2.7 0.0 -2.7 -1.4Overall balance (cash basis) 0.7 2.7 -0.7 -2.7 -1.4
Non-oil balance (commitment basis) -20.7 -19.1 -17.9 -16.1 -15.6Non-oil balance (cash basis) -20.0 -19.1 -18.6 -16.1 -15.6Non-oil primary balance (commitment basis) -20.7 -19.0 -17.9 -16.1 -15.6Non-oil primary balance (cash basis) -20.0 -19.0 -18.6 -16.1 -15.6
Non-oil revenues 12.4 12.7 12.1 13.7 13.1Expenditure 40.7 39.2 35.8 33.7 32.7Non-oil budget balance -28.3 -26.5 -23.7 -19.9 -19.6
Memorandum items:Net public debt 4.2 0.5 1.9 4.1 4.6
Gross public debt 19.7 17.9 16.1 16.3 14.8Government financial assets 15.5 17.4 14.2 12.2 10.2
Sources: Iranian authorities; and Fund staff estimates and projections.
(In percent of GDP; unless otherwise indicated)
(In percent of non-oil GDP)
Proj.
Government and the Oil Stabilization Fund, 2006/07–20010/11Table 4. Islamic Republic of Iran: Consolidated Accounts of the Central
(In percent of GDP; unless otherwise indicated)

24
Prel.2006/07 2007/08 2008/09 2009/10
Net foreign assets (NFA) 480,740 651,980 703,329 789,498 In millions of U.S. dollars 52,011 72,798 72,381 77,050
Foreign assets 558,740 742,122 773,352 863,336 In millions of U.S. dollars 60,450 82,863 79,587 84,257
Foreign liabilities 1/ 78,000 90,142 70,023 73,839 In millions of U.S. dollars 8,439 10,065 7,206 7,206
Net domestic assets (NDA) -163,596 -250,586 -139,843 -225,654 Net domestic credit -75,882 -119,265 -5,141 21,083 Central government, net -158,107 -290,877 -283,735 -228,046 Claims 87,450 81,197 74,779 74,779 Deposits 245,557 372,074 358,514 302,824 Claims on banks 54,887 137,694 239,758 206,409 Claims on nonfinancial public enterprises (NFPEs) 27,337 33,918 38,836 42,719 Other items net, excluding central bank participation papers (CPPs) -87,714 -131,321 -134,701 -246,737
Base money 292,064 382,980 556,925 556,925 Currency 67,489 88,047 206,352 200,745 Currency in circulation 61,452 79,909 157,764 153,478 Cash in vaults 6,038 8,138 48,588 47,268 Reserves 212,486 277,452 334,495 338,445 Required reserves 184,828 235,841 225,228 307,757 Excess reserves 27,658 41,611 109,267 30,688 Deposits of NFPE and municipalities 12,089 17,481 16,078 17,734
Other liabilities 25,079 18,414 6,561 6,919CPPs 21,566 16,372 0 0Foreign currency deposits of NFPEs and municipalities 3,514 2,042 6,561 6,919
Memorandum items:End-period change (in percent of base money)
Base money 26.0 31.1 45.4 0.0NFA 39.5 58.6 13.4 15.5NDA (net of other liabilities) -13.6 -27.5 32.0 -15.5
Sources: Central Bank of Iran; and Fund staff estimates and projections.
1/ Includes some liabilities in foreign currency to residents.
(In billions of rials; unless otherwise indicated)Table 5. Islamic Republic of Iran: Central Bank Balance Sheet, 2006/07–20009/10
Proj.

25
Prel.2006/07 2007/08 2008/09 2009/10
Net foreign assets (NFA) 656,772 833,482 872,006 967,367In millions of U.S. dollars 71,056 93,064 89,740 94,409
Foreign assets 820,599 1,040,061 1,053,093 1,158,322In millions of U.S. dollars 88,781 116,130 108,376 113,045
Foreign liabilities 2/ 163,828 206,580 181,087 190,955In millions of U.S. dollars 17,725 23,066 18,636 18,636
Net domestic assets (NDA) 726,828 946,434 1,121,883 1,412,824 Net domestic credit 1,414,560 1,790,723 2,035,525 2,345,498 Net credit to government -172,688 -288,577 -263,643 -207,954 Claims on nonfinancial public enterprises (NFPEs) 95,951 91,913 84,614 88,497 Claims on the private sector 3/ 1,491,297 1,987,387 2,214,554 2,464,955
Of which: Foreign currency claims 3/ 265,096 323,661 348,003 366,967 Other items, net, excluding CPPs -687,732 -844,289 -913,642 -932,674
Broad money (M3) 1,383,600 1,779,916 2,076,040 2,380,191 M2 1,296,288 1,657,774 1,917,444 2,209,609 Cash 61,452 79,909 157,764 153,478 Deposits 1,234,837 1,577,865 1,759,680 2,056,131 Demand deposits 365,182 473,279 383,796 448,454 Time deposits 869,655 1,104,586 1,375,884 1,607,677
CPPs held by nonbanks 21,566 16,372 0 0Foreign currency deposits 65,746 105,770 158,595 170,583
Memorandum items:Base money 292,064 382,980 556,925 556,925M1 426,634 553,188 541,560 601,931Multiplier (M3/base money) 4.74 4.65 3.73 4.27Income velocity of M3 1.72 1.68 1.65 1.47
Annual percentage changeNFA 16.9 26.9 4.6 10.9NDA 68.2 30.2 18.5 25.9Base money 26.0 31.1 45.4 0.0M1 29.6 29.7 -2.1 11.1M2, excluding foreign currency deposits and CPPs 39.0 27.9 15.7 15.2M3 39.2 28.6 16.6 14.7Credit to the private sector and NFPEs in rials 37.0 32.8 11.1 12.1Credit to private sector in rials 41.7 35.7 12.2 12.4Total claims on private sector 34.0 33.3 11.4 11.3
Sources: Central Bank of Iran; and Fund staff estimates and projections.
1/ The Iranian fiscal year ends March 20.2/ Includes some liabilities in foreign currency to residents.3/ Includes on-lending of the Oil Stabilization Fund resources and claims under letters of credit for trade financing.
Table 6. Islamic Republic of Iran: Monetary Survey, 2006/07–20009/10 1/(In billions of rials; unless otherwise indicated)
Proj.

26
2003/04 2004/05 2005/06 2006/07 2007/08 2008/09
External solvency indicatorsReal effective exchange rate (REER) (end of period; percent change) -2.1 1.0 6.1 2.5 7.4 18.8 6/Total public and publicly guaranteed external debt (in billions of U.S. dollars) 17.1 23.1 24.8 23.2 28.1 20.1 6/
(In percent of GDP) 12.7 14.3 13.2 10.4 9.8 6.0 6/Short-term external debt (in billions of U.S. dollars) 4.8 10.2 10.7 9.1 9.9 6.3 6/
(In percent of GDP) 3.6 6.3 5.7 4.1 3.5 1.9 6/(In percent of exports of goods and services) 2/ 12.1 20.7 15.1 11.0 9.4 5.8 6/
External debt service (in percent of exports of goods and services) 2/ 3/ 4.5 6.5 4.4 4.0 3.6 2.3 6/
External liquidity indicatorsTotal official reserves (in billions of U.S. dollars) 24.7 33.3 46.8 60.5 82.9 79.6
(In months of the following year's imports of goods and services) 2/ 6.1 7.3 8.9 10.1 11.5 12.5 6/(In percent of short-term external debt) 517 326 439 664 838 1265 6/
Commercial banks net foreign assets (in billions of U.S. dollars) 4.6 12.2 18.9 19.0 20.3 17.4Foreign assets 6.6 27.1 29.1 28.3 33.3 28.8Foreign liabilities 4/ 2.0 15.0 10.2 9.3 13.0 11.4
Oil and oil-related exports (in percent of exports of goods) 80.5 82.6 83.6 81.5 83.9 81.4
Public sector solvency indicators Public and publicly guaranteed debt (in percent of GDP) 26.5 26.3 23.7 19.7 17.9 16.1 6/Oil revenue (in percent of total revenue) 69.4 69.1 72.2 69.5 70.5 66.3
Financial sector indicatorsRisk-weighted capital adequacy of banks (in percent) 5/ 5.7 9.8 9.9 9.1 6.5 …Ratio of nonperforming loans of banks (in percent of total loans) 5/ 7.4 7.7 9.9 15.7 18.3 …Loan provisions as a percentage of nonperforming loans 44.6 57.9 47.1 … 30.0 …Net profit margin of banks to total assets (in percent) 1.0 1.2 0.8 0.7 0.8 …Net domestic credit (percent change) 58.9 18.5 22.3 32.1 26.6 13.7Private sector credit in local currency (percent change) 73.8 23.0 32.1 34.0 33.3 11.4Net domestic credit (in percent of GDP) 66.6 62.3 63.1 69.2 67.4 63.8
Market assessment/financial market indicators Stock market price index (percent change; end-of-period) 124.8 6.4 -21.9 5.3 2.7 -21.0Stock market capitalization (in percent of GDP) 22.0 22.8 15.9 16.8 17.8 …Fitch sovereign rating B+ BB- BB- B+ B+ B+
Sources: Iranian authorities; and Fund staff estimates.
1/ The Iranian fiscal year ends March 20.2/ Excluding interest receipts and payments. 3/ Excluding service of short-term external debt.4/ Including contingent liabilities under letters of credit.5/ Islamic banks exhibit important differences in their risk profile and asset classification, which limit international comparability.6/ Estimate.
Table 7. Islamic Republic of Iran: Vulnerability Indicators, 2003/04–2008/09 1/
INTERNATIONAL MONETARY FUND
ISLAMIC REPUBLIC OF IRAN
2009 Article IV Consultation
Informational Annex
Prepared by Middle East and Central Asia Department (In consultation with other Departments)
January 11, 2010
Contents Page I. Relations with the Fund .................................................................................................. 2 II. World Bank-IMF Relations ........................................................................................... 4 III. Statistical Issues ............................................................................................................. 5

2
APPENDIX I. ISLAMIC REPUBLIC OF IRAN: RELATIONS WITH THE FUND (As of November 30, 2009)
I. Membership Status Joined: 12/29/1945; Article VIII
II. General Resources Account SDR Million Quota 1,497.20 100.00
Percent of Quota
Fund holdings of currency 1,497.20 100.00 Reserve position 0.01 0.00
III. SDR Department SDR Million
Net cumulative allocation 1,426.06 100.00 Percent of Allocation
Holdings 1,535.53 107.68
IV. Outstanding Purchases and Loans None V. Financial Arrangements None
VI. Projected Payments to Fund (SDR Million; based on existing use of resources and present holdings of SDRs) Forthcoming 2010 2011 2012 Principal
2013
Charges/Interest 0.11 0.11 0.11 Total
0.11 0.11 0.11 0.11 0.11
Nonfinancial Relations
VII. Exchange System The exchange rate is determined in the interbank foreign exchange market. The Islamic Republic of Iran maintains a de jure managed floating arrangement against a basket. The rial gradually depreciated against a composite of currencies, including the Euro, the U.S. dollar, and the Japanese yen. Effective January 4, 2008, the classification of the de facto exchange rate arrangement was changed from a conventional pegged arrangement to a crawling peg, and later in 2008, in view of further increase in exchange rate flexibility, the arrangement was reclassified to other managed arrangement. With effect from September 6, 2004, the Islamic Republic of Iran accepted the obligations under Article VIII, Sections 2, 3, and 4 of the Fund’s Articles of Agreement. Iran maintains one exchange restriction and two multiple currency practices subject to Fund jurisdiction under Article VIII, Sections 2(a) and 3.

3
a. The exchange restriction arises from limitations on the transferability of rial profits from certain investments under the Foreign Investment Promotion and Protection Act and from limitations on other investment-related current international payments under this act. b. The multiple currency practices arise from the following: 1. Budget subsidies for foreign exchange purchases in connection with payments of certain letters of credit opened prior to March 21, 2002 under the previous multiple exchange rate system; and 2. Obligations of entities that had received allocations of foreign exchange at subsidized “allocated rates” under the previous multiple exchange rate system to surrender unused allocations to the Central Bank of Iran at the allocation rate.
VIII. Last Article IV Consultation The last Article IV consultation was concluded by the Executive Board on July 14, 2008. IX. Technical Assistance Since FY 2006, Iran received the following technical assistance: FAD FY 2009 – Tax administration and VAT FY 2010 -- Tax policy LEG FY 2007 – Anti-Money Laundering/Combating Financing of Terrorism regulations FY 2009 – Anti-Money Laundering/Combating Financing of Terrorism regulations MCM FY 2007 – Banking regulation and supervision FY 2008 – Technical assistance assessment visit FY 2008 – Currency reform FY 2008 – Macroeconomic and monetary modeling.

4
APPENDIX II. ISLAMIC REPUBLIC OF IRAN: RELATIONS WITH THE WORLD BANK
Area Product Delivery date
World BankFiscal sector Public expenditure review FY 2009Labor market Report on employment growth FY 2009Private sector development Technical assistance report FY 2009Regional development Technical assistance report FY 2009Energy Sector Electricity Pricing and Power Sector Reform - report FY 2010Private sector development Programmatic analytical and advisory work on investment climate -ongoing FY 2010
IMF Financial sector 2009 Article IV consultation staff report
Technical assistanceCurrency reform FY 2008-10Monetary policy modeling FY 2009-10AML/CFT FY 2009-10Bank restructuring and supervision FY 2010
Fiscal sector 2009 Article IV consultation staff reportSelected issues papers:
Energy sector reform FY 2009-10Technical assistance:
Major tax reforms FY 2009-10
Trade and exchange restrictions 2009 Article IV consultation staff reportExchange rate assessment: CGER Methodologies
Technical assistance:Implementing changes to the foreign investment regulatory framework FY 2009-10
Shared responsibility Fiscal sector Introduction of VAT FY 2010Financial sector FSAP update FY 2011–12
The Islamic Republic of Iran: JMAP Implementation

5
APPENDIX III. ISLAMIC REPUBLIC OF IRAN: STATISTICAL ISSUES Data provision to the Fund is generally adequate for effective surveillance; however, the data are reported with significant delays. The Central Bank of Iran (CBI) disseminates key statistical aggregates in its quarterly Economic Trends, also available at <http://www.cbi.ir/e/>
Real sector statistics
. Since 2002, the Fund’s Statistics Department has assisted the authorities in their efforts to subscribe to the Special Data Dissemination Standard (SDDS). The progress, however, has been slow and gaps in meeting SDDS requirements for data coverage, periodicity, and timeliness remain.
• National accounts statistics are reasonably sound. Improvements have been made in
the coverage of the informal economy. However, there is scope for further progress, especially in the coverage of small-scale industries and services. Also, the CBI and the Statistical Council of Iran (SCI) have undertaken to review and unify their respective GDP estimates.
• Price statistics are sound and released in a timely manner. The official labor market statistics are released by the SCI, and are based on the definitions recommended by the International Labor Organization (ILO). The data are based on an urban and rural population sample of about 100,000 households, and the threshold for considering a person employed is two days a week. Labor market statistics, however, could benefit from further improvement, particularly with regard to employment and wage data.
Government finance statistics • The data are compiled in accordance with the Government Finance Statistics Manual,
2001 (GFSM 2001) for the core central government operations. Starting 2003/04, the fiscal data include implicit energy subsidies.
• Data on central government operations cover the general budget, the special purpose funds, and certain transactions with the Social Security Organization. These data are not consolidated. There is a need to expand the coverage of central government to include the complete transactions of the Social Security Organization, four pension funds, five procurement and distribution centers, and the OSF.
• The submission for the 2006 Government Finance Statistics Yearbook included for the first time data for general and local governments.
• The existing cash-based government accounting system should be upgraded to enable recording of expenditures at the pre-payment stage.
• Financing data in the GFS are not broken down by residency of debt holders or by type of debt instruments. The discrepancy between fiscal and monetary data on deficit financing has often been relatively large, partly due to foreign currency valuation

6
problems. There is a need to develop a comprehensive database on domestic public debt, with a breakdown by domestic creditor.
• The Bonyad-e-Mostazafan va Janbazan (BMJ, Foundation of the Oppressed and Injured) could be considered a holding company and classified in the nonfinancial public corporations sector.
Monetary statistics • Monthly monetary data are reported to STA for publication in IFS, but periodicity has
been lagging.
• Compilation of monetary statistics diverges from international standards in the application of the residency criterion and in sectorization and classification of accounts. The authorities are undertaking improvements in each of these areas, in line with the recommendations of STA missions.
• The measure of broad money employed by the CBI does not include deposits of public nonfinancial corporations, local governments, or foreign-currency deposits of residents.
External sector data • The accounting system for foreign exchange receipts and payments of the CBI and
banks is being implemented in line with the methodological guidelines of the Fund’s Balance of Payments Manual, fifth edition (BPM5). This will allow compilation of balance of payments statistics on a quarterly basis. Annual balance of payments data up to 2000 have been reported to STA for publication in BOPSY and IFS.
• Data on the international investment position are compiled, but not disseminated. Only data on public and publicly guaranteed debt are disseminated, but classifications do not fully accord with the guidelines of the External Debt Guide. The data template on international reserves and foreign currency liquidity is not compiled.

7
Islamic Republic of Iran: Table of Common Indicators Required for Surveillance (As of December 16, 2009)
Date of latest Observation
Date Received
Frequency of
Data6
Frequency of
Reporting6
Frequency of
Publication6
Exchange Rates Dec. 16, 2009 Dec. 16, 2009
D D D
International Reserve Assets and Reserve Liabilities of the Monetary Authorities1
Sept. 2009 Dec. 2009 M M M
Reserve/Base Money Sept. 2009 Dec. 2009 M M M
Broad Money Sept. 2009 Dec. 2009 M M M
Central Bank Balance Sheet Sept. 2009 Dec. 2009 M M M
Consolidated Balance Sheet of the Banking System Sept. 2009 Dec. 2009 M M M
Interest Rates2 Sept. 2009 Dec. 2009 M M M
Consumer Price Index Oct. 2009 Dec. 2009 M M Q
Revenue, Expenditure, Balance and Composition of Financing3–General Government4
June 2009
Dec. 2009 M M M
Revenue, Expenditure, Balance and Composition of Financing3–Central Government
June 2009 Dec. 2009 A A A
Stocks of Central Government and Central Government-Guaranteed Debt5
June 2009 Dec. 2009 A A A
External Current Account Balance Sept. 2009 Dec. 2009 M Q Q
Exports and Imports of Goods and Services Sept. 2009 Dec. 2009 M Q Q
GDP/GNP Q2 2008/09 March 2009 Q Q Q
Gross External Debt Sept. 2009 Dec. 2009 M Q Q
International Investment Position 7/ Sept. 2009 Dec. 2009 A I NA
1/ Includes reserve assets pledged or otherwise encumbered as well as net derivative positions. 2/ Both market-based and officially determined, including discount rates, money market rates, rates on treasury bills, and notes and bonds. 3/ Foreign, domestic bank, and domestic nonbank financing. 4/ The general government consists of the central government (budgetary funds, extra budgetary funds, and social security funds) and state and local
governments. 5/ Including currency and maturity composition. 6/ Daily (D), weekly (W), monthly (M), quarterly (Q), annually (A), irregular (I), and not available (NA). 7/ Includes the external financial assets and liabilities vis-à-vis nonresidents of the financial sector.

Public Information Notice (PIN) No. 10/24 FOR IMMEDIATE RELEASE February 18, 2010
IMF Executive Board Concludes 2009 Article IV Consultation with the Islamic Republic of Iran
On February 3, 2010 the Executive Board of the International Monetary Fund (IMF) concluded the Article IV consultation with the Islamic Republic of Iran.1
Background Iran’s economic performance was strong in recent years, supported by high oil prices and expansionary fiscal and monetary policies. Real GDP growth was above 5 percent a year, the external position strengthened, and welfare indicators improved. The recent drop in oil prices and rising inflation, however, led the authorities to tighten fiscal and monetary policies since the second half of 2008/09. Real GDP growth is estimated by staff to have decelerated to 2–2½ percent in 2008/09, from almost 7 percent in 2007/08, owing to a reduction in oil production and slower growth in the non-oil sector. At the same time, inflation has declined significantly. The current account surplus is estimated to have remained strong in 2008/09 despite the drop in oil prices, reflecting a good performance of non-oil exports. Preliminary estimates suggest that the surplus narrowed from 12 percent of GDP in 2007/08 to 7 percent in 2008/09. Gross official reserves, including the Oil Stabilization Fund (OSF) foreign assets, declined slightly from $83 billion at end-2007/08 to $80.5 billion at end-September 2009. Large debt amortizations
1 Under Article IV of the IMF's Articles of Agreement, the IMF holds bilateral discussions with members, usually every year. A staff team visits the country, collects economic and financial information, and discusses with officials the country's economic developments and policies. On return to headquarters, the staff prepares a report, which forms the basis for discussion by the Executive Board. At the conclusion of the discussions, the Managing Director, as Chairman of the Board, summarizes the views of Executive Directors, and this summary is transmitted to the country's authorities. An explanation of any qualifiers used in summings up can be found here: http://www.imf.org/external/np/sec/misc/qualifiers.htm.
International Monetary Fund 700 19th Street, NW Washington, D. C. 20431 USA

2 have further lowered the outstanding external debt to an estimated $20 billion (6½ percent of GDP) in 2008/09. The rial depreciated in nominal terms by 9 percent against the U.S. dollar in the period March 2008-September 2009. Twelve-month CPI inflation dropped to 7½ percent in October 2009, from almost 30 percent in October 2008, as money (M1) growth slowed, reversing the increasing trend of recent years. The drop in international commodity prices contributed to the decline in inflation. In 2008/09, the non-oil fiscal deficit is estimated to have declined by one percentage point of GDP, to about 18 percent of GDP. This was mainly achieved through a reduction in government expenditure. In addition, a VAT with a three percent rate was successfully implemented across Iran in September 2008 to replace the system of integrated levies. The Central Bank of Iran (CBI) also introduced measures to tighten monetary policy, in particular, in the second half of 2008/09 it restructured its lending facilities and issued high-denominated notes to replace commercial bank checks. The recent performance of the banking sector shows a steady increase in the market share of private banks, which have become leaders in the provision of participatory facilities, and a weakening of soundness indicators because of credit policies and slower domestic demand growth. In the structural area, the approval of an ambitious energy price reform by the Parliament in December 2009 is expected to bring about an improvement in both the fiscal and external positions, facilitate higher investment in the energy sector, and support higher real GDP growth. In the financial area, the CBI established an interbank market in July 2008 to reduce the banks’ demand for central bank facilities and help improve liquidity management. The authorities have also improved bank supervision by implementing a new banking supervision framework, including a new loan classification system. In addition, the CBI has put in place a credit rating agency to enhance transparency regarding customer credit risk. The authorities have also adopted implementing regulations for the Anti-Money Laundering (AML) law as another step toward establishing a more comprehensive AML framework. The authorities have requested additional technical assistance with the drafting of a law on combating the financing of terrorism and to bring Iran’s AML/CFT more in line with international standards. Looking forward, the authorities’ main macroeconomic challenges are to support non-oil GDP growth, further reduce inflation, and lessen Iran’s fiscal dependency on oil by expanding domestic sources of revenue. The 2009/10 budget envisages a reduction in the non-oil fiscal deficit to be achieved through an increase in non-oil revenue. Gross official reserves are projected to remain at a comfortable level at end-2009/10, and inflation is expected to decline further. Over the medium term, based on current WEO oil price projections, measures will be needed to further reduce the non-oil fiscal deficit. Against this background, the implementation of the proposed energy price reform is a critical step to improve the medium-term fiscal outlook and increase economic efficiency.

3 Executive Board Assessment Directors noted that Iran’s economy had performed strongly in recent years supported by high oil prices and expansionary fiscal and monetary policies. However, declining oil prices have had an adverse effect on output and external fiscal balances. In light of this, Directors supported the authorities’ plans to increase non-oil revenue and reduce subsidies, and stressed the need to address forcefully the soundness of the banking system. Directors emphasized the positive medium-term impact of the planned domestic energy price reform on the macroeconomic outlook. This reform would help strengthen the fiscal and external accounts, enable higher investment in the energy sector, and support stronger and more sustainable growth. Directors stressed that the success of the planned energy price reform will depend importantly on the effective and timely implementation of a well-targeted mechanism of cash transfers to the poor as well as the transition to using energy efficient technologies. Anchoring expectations through prudent macroeconomic policies will be important for limiting the secondary effects of the energy price increases on the general price level. Directors particularly stressed the need to avoid quasi-fiscal operations through the banking sector. This will also require a sufficiently tight monetary policy, while providing adequate liquidity to the banking sector. Directors encouraged the implementation of a rolling medium-term fiscal framework which integrates the operations of the central government budget and the Oil Stabilization Fund to help reduce domestic and external vulnerabilities. Directors complimented the authorities for sharply bringing down inflation by tightening fiscal policies and liquidity conditions. They recommended that access to the CBI’s liquidity facility be made subject to the use of collateral. Directors welcomed the steps taken to equalize the rates of return on term deposits between public and private banks, and stressed the need to gradually liberalize rates of return, particularly on the lending side. Many Directors called for strengthening the independence of the central bank. Directors emphasized the importance of addressing the increase in banks’ nonperforming loans and welcomed the authorities’ intention to take additional measures as necessary. They noted that balance sheets of banks were likely to be affected by the impact of the increase in energy prices on corporate profits and encouraged the authorities to recapitalize the banking system. Directors observed that recent estimates suggested that the rial was broadly in line with fundamentals. However, they were broadly of the view that in light of the high oil price volatility, greater exchange rate flexibility would help adjust the external current account and preserve a strong international reserves position.

4 Directors noted the progress made towards establishing a more comprehensive AML/CFT framework and urged the authorities to strengthen this effort so as to bring their AML/CFT framework in line with international standards. Directors considered that economic data were broadly adequate for surveillance purposes but recommended that its timeliness be improved.
Public Information Notices (PINs) form part of the IMF's efforts to promote transparency of the IMF's views and analysis of economic developments and policies. With the consent of the country (or countries) concerned, PINs are issued after Executive Board discussions of Article IV consultations with member countries, of its surveillance of developments at the regional level, of post-program monitoring, and of ex post assessments of member countries with longer-term program engagements. PINs are also issued after Executive Board discussions of general policy matters, unless otherwise decided by the Executive Board in a particular case.
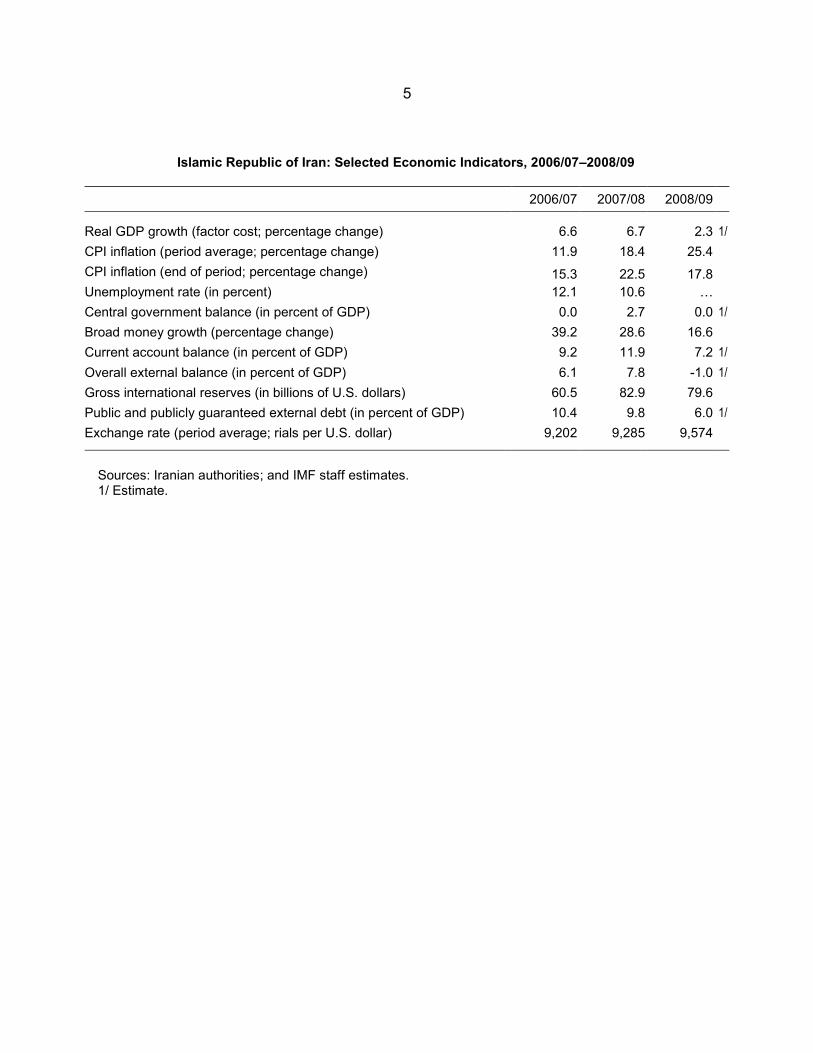
5
Islamic Republic of Iran: Selected Economic Indicators, 2006/07–2008/09
2006/07 2007/08 2008/09
Real GDP growth (factor cost; percentage change) 6.6 6.7 2.3 1/ CPI inflation (period average; percentage change) 11.9 18.4 25.4 CPI inflation (end of period; percentage change) 15.3 22.5 17.8 Unemployment rate (in percent) 12.1 10.6 … Central government balance (in percent of GDP) 0.0 2.7 0.0 1/ Broad money growth (percentage change) 39.2 28.6 16.6 Current account balance (in percent of GDP) 9.2 11.9 7.2 1/ Overall external balance (in percent of GDP) 6.1 7.8 -1.0 1/ Gross international reserves (in billions of U.S. dollars) 60.5 82.9 79.6 Public and publicly guaranteed external debt (in percent of GDP) 10.4 9.8 6.0 1/ Exchange rate (period average; rials per U.S. dollar) 9,202 9,285 9,574
Sources: Iranian authorities; and IMF staff estimates. 1/ Estimate.

Statement by Jafar Mojarrad, Executive Director for the Islamic Republic of Iran February 3, 2010
My authorities thank staff for their hard work and the constructive discussions and useful analysis, including the high-quality selected issues paper. They continue to value the professional work of staff on Iran, as well as Fund’s policy advice. They are also grateful for the technical assistance provided by FAD and LEG, and look forward to further close collaboration with Fund TA departments in the period ahead. Overview Since the last Article IV consultation, economic developments in Iran have been marked by the global economic turmoil, which led to a sharp drop in oil prices, and a decline in demand for exports and foreign financing, in particular in the oil sector. These factors have impacted economic activity, albeit less than expected. Notwithstanding these unfavorable developments, the authorities have remained focused on implementing their reform agenda, and the achievements in this regard are satisfactory. As highlighted in the staff report, real GDP growth averaged 5.6 percent during 2005/06–2008 /09, which translated into a significant increase in per capita income, inflation was brought down to a single digit level, and unemployment declined to about 10 percent. The external position is strong and there are no immediate risks to its viability. Despite the sharp contraction in oil export receipts, the current account remained in surplus, albeit less than in previous years, and gross official reserves at a comfortable level equivalent to 12 months of imports. Iran’s external debt has continued to decline, reaching 5 percent of GDP. The managed floating exchange rate regime has continued to serve the economy well, and we note staff assessment that the exchange rate is broadly in line with fundamentals. My authorities are fully aware of the remaining challenges ahead, which will be addressed in the forthcoming five-year development plan. These include sustaining high growth rates to provide employment opportunities for a growing labor force, maintaining a low inflation rate, diversifying the economy away from the hydrocarbon sector, enhancing non-oil revenue performance and base, fostering efficiency and private sector development, and reducing regional and social disparities. Reducing inflation The authorities have given priority to addressing the issue of high inflation, a major concern during previous Article IV consultations. Notwithstanding the fallout from the global economic slowdown and lower oil prices, the authorities tightened fiscal and monetary policies in 2008/09 and 2009/10 to reduce inflation. Consequently, as highlighted in the staff report, inflation was brought down to 7½ percent in October 2009, from 30 percent a year earlier and 19 percent on average over the last three years. Nonetheless, the tighter fiscal and monetary policies, combined with lower oil output,

2
have inevitably affected real GDP growth, which is estimated at 2.3 percent in 2008/09 and 2 percent in 2009/10, even though growth in the non-oil sector has shown signs of resilience. Fiscal policy Fiscal policy was tightened in 2008/09 and 2009/10, in a departure from past years’ stance. The non-oil fiscal balance, which was reduced by 1 percentage point of GDP in 2008/09, is estimated to decline further by 2 percentage points to 16 percent of GDP in 2009/10, one of the lowest non-oil fiscal deficits among the oil producing countries in the MENA region, as shown in the October 2009 Regional Economic Outlook. This has been achieved mainly through improvement in non-oil revenue mobilization, including the successful implementation of a VAT and further strengthening of tax administration. On the expenditure side, the authorities have kept the lid on total spending, which is estimated to decline by 6½ percent in real terms in 2009/10 (assuming an average inflation rate of 10 percent). Privatization receipts continue to contribute to financing the non-oil deficit. Continued efforts in enhancing the non-oil revenue performance should bring Iran close to insulating the budget from the volatility of oil prices. The draft budget law for fiscal year 2010/11 was submitted to Parliament on January 23, 2010. While detailed information will be available in the coming weeks, there are indications that fiscal policy will remain prudent to help address temporary effects of the energy price reform, which will be introduced in 2010/11 (see below). Monetary policy Monetary policy was aimed at containing the growth of domestic liquidity and keeping credit growth under control. The Central Bank of Iran (CBI) has continued to reduce its lending to banks, while directing banks to the interbank money market to meet their liquidity needs. Moreover, the CBI has replaced banks’ checks in circulation with CBI-issued high denomination bills, thereby regaining control of monetary growth. In recent years, commercial banks were allowed to issue endorsable checks backed by client deposits to facilitate cash transactions in large denominations. However, these quasi-monetary instruments had grown to the point of complicating the task of controlling money growth. Monetary policy in 2010/11 will be attentive to the need to support economic activity, while helping smooth the impact of the energy price reform and preserving the gains achieved in reducing inflation. Financial sector The financial sector has been insulated from the global turmoil, and bank intermediation has continued to grow, reflecting in part the expansion of private banks, which have increased their market share. To foster competition and efficiency in the delivery of

3
financial services, the authorities have allowed public banks to match the rates of return on term deposit facilities offered by private banks. The CBI has stepped up its efforts to preserve bank soundness and strengthen supervisory standards. A new banking supervision framework, including a new loan classification system, has been implemented. In addition, the CBI has established a credit rating entity to help improve information on customer credit risk. Other steps include the establishment of a bank-owned company for the resolution of nonperforming loans and the planned recapitalization of certain banks before their privatization. My authorities are of the view that the rise in nonperforming loans is essentially due to the slowdown in economic activity and the depressed external demand, as happened in many other countries. They intend to continue to monitor the situation closely and take additional measures as needed to ensure that financial institutions remain solvent and profitable. Medium-term outlook and reforms Iran’s medium-term economic prospects will be shaped by the ambitious reforms of the next five-year development plan. The draft plan law, which is being debated by Parliament, sets ambitious, but achievable targets for growth, unemployment, inflation, and improvement in the living conditions. My authorities are convinced that with sustained implementation of wide-ranging reforms, Iran will be able to fully tap its economic potential, given the country’s endowment in energy resources, its abundant and skilled labor force, and its entrepreneurial business community. As such, they are confident that the medium-term outlook is favorable. The energy price reform, which has been under preparation for several years, was approved by Parliament on January 05, 2010, and implementation is expected to start in April of this year, once the related regulations are approved. This reform will be a major step toward enhancing energy efficiency, improving resource allocation, and targeting and reducing the high cost of subsidies on energy. My authorities are aware of the challenges of implementing such an important, but complex reform, as outlined in the useful SIP, including in particular its economic and social impact in the short and long run. Preparations are underway to work out detailed implementation steps, including active communication to keep the public well informed. The authorities agree with staff that the energy price reform will bring about significant benefits in the medium and long term, and stand ready to address any short-term adverse effects. Efforts will continue to focus also on improving the business environment by streamlining procedures, facilitating access to credit by SMEs, encouraging technological innovation, and fostering job training and employment. In the fiscal area, the authorities will continue to enhance non-oil revenue by broadening the tax base, reviewing income and trade taxes, and strengthening tax administration. Efforts will also be made to streamline public administration and enhance the efficiency of government spending, including reducing the subsidies and improving their targeting. In the financial sector, the authorities intend to improve the performance and financial strength of public banks, while further encouraging the development of private banks.

4
Conclusion The Iranian economy has continued to exhibit strong performance, despite adverse external developments. High rates of growth and employment creation have been achieved, and the external position has strengthened. The authorities have shown determination in bringing inflation down to a low level, and will seek to preserve this achievement. They are also embarking on more ambitious and wide-ranging reforms in the context of the forthcoming five-year development plan, including the far-reaching energy price reform. My authorities highly appreciate the technical assistance and policy advice provided by the IMF as they set to tackle challenging tasks in the period ahead.