is oxidative stress a cause or consequence of disuse ... · is oxidative stress a cause or...
TRANSCRIPT
Exp Physiol 00.00 pp 1–20 1
Experimental Physiology – Research Paper
Is oxidative stress a cause or consequence of disusemuscle atrophy in mice? A proteomic approachin hindlimb-unloaded mice
Lorenza Brocca1,2, Maria Antonietta Pellegrino1,2, Jean-Francois Desaphy3, Sabata Pierno1,2,Diana Conte Camerino3 and Roberto Bottinelli1,2
1Department of Physiology, Human Physiology Unit and 2Interuniversity Institute of Myology, University of Pavia, Italy3Section of Pharmacology, Department of Pharmacobiology, Faculty of Pharmacy, University of Bari, Italy
Two-dimensional proteomic maps of soleus (Sol), a slow oxidative muscle, and gastrocnemius(Gas), a fast glycolytic muscle of control mice (CTRL), of mice hindlimb unloaded for 14 days(HU mice) and of HU mice treated with trolox (HU-TRO), a selective and potent antioxidant,were compared. The proteomic analysis identified a large number of differentially expressedproteins in a pool of ∼800 proteins in both muscles. The protein pattern of Sol and Gas adaptedvery differently to hindlimb unloading. The most interesting adaptations related to the cellulardefense systems against oxidative stress and energy metabolism. In HU Sol, the antioxidantdefense systems and heat shock proteins were downregulated, and protein oxidation index andlipid peroxidation were higher compared with CTRL Sol. In contrast, in HU Gas the antioxidantdefense systems were upregulated, and protein oxidation index and lipid peroxidation werenormal. Notably, both Sol and Gas muscles and their muscle fibres were atrophic. Antioxidantadministration prevented the impairment of the antioxidant defense systems in Sol and furtherenhanced them in Gas. Accordingly, it restored normal levels of protein oxidation and lipidperoxidation in Sol. However, muscle and muscle fibre atrophy was not prevented either in Solor in Gas. A general downsizing of all energy production systems in Sol and a shift towardsglycolytic metabolism in Gas were observed. Trolox administration did not prevent metabolicadaptations in either Sol or Gas. The present findings suggest that oxidative stress is not a majordeterminant of muscle atrophy in HU mice.
(Received 15 August 2009; accepted after revision 9 October 2009; first published online 9 October 2009)Corresponding author R. Bottinelli: Department of Physiology, Human Physiology Unit, University of Pavia,Via Forlanini 6, 27100 Pavia, Italy. Email: [email protected]
Decrease in neuromuscular activity is a major factorthat shapes structure and function of skeletal muscle,determining a loss of mass and strength and a shift inthe contractile and metabolic properties towards a fasterphenotype (Baldwin, 1996a,b).
It is generally accepted that the loss in muscle massdepends on an imbalance between protein synthesisand degradation (Thomason & Booth, 1990; Gamrinet al. 1998). Among the potential triggers of proteindegradation, recent works have highlighted the role ofoxidative stress due to an imbalance between the cellularantioxidant systems and free radical (ROS) production
L.B. and M.A.P. contributed equally to this work.
(Lawler et al. 2003, 2006b; Smith & Reid, 2006; Powers et al.2007). Accordingly, amelioration of disuse muscle atrophyfollowing antioxidant administration has been observed(Kondo et al. 1992; Appell et al. 1997; Arbogast et al.2007). Therefore, a pivotal role is now widely recognizedfor oxidative stress in the pathogenesis of muscle wasting indisuse and in a variety of pathological conditions (Moylan& Reid, 2007).
However, many unanswered questions still remainregarding the mechanisms underlying muscle atrophyfollowing disuse. A major puzzle is whether oxidativestress is a requirement or merely plays a regulatory role(Lawler et al. 2003; Powers et al. 2007). In this respect, it isnoteworthy that contradictory results have been obtainedregarding the impact of antioxidants on muscle atrophy
C© 2009 The Authors. Journal compilation C© 2009 The Physiological Society DOI: 10.1113/expphysiol.2009.050245
411
2 L. Brocca and others Exp Physiol 00.00 pp 1–20
(Koesterer et al. 2002). Moreover, Servais et al. (2007)have shown that vitamin E ameliorated muscle atrophy,but, surprisingly, its protective effect did not depend on itsantioxidant function, but probably on a direct modulationof muscle proteolysis.
It is also unclear whether fast and slow muscles share thesame mechanisms of disuse atrophy. Most studies (Kondoet al. 1992; Appell et al. 1997; Lawler et al. 2003, 2006b;Arbogast et al. 2007; Servais et al. 2007) focused on soleusmuscle which, being a postural slow muscle, is severelyaffected by muscle atrophy, whereas limited informationis available on fast muscles because they have beenconsidered to be little involved in the process (Thomason& Booth, 1990). However, fast muscles have recently beenshown to go through significant atrophy in some animalstudies (Stelzer & Widrick, 2003; Ferreira et al. 2007).Moreover, a major potential mechanism of disuse atrophy,such as oxidative stress, might not be equally relevantin slow and fast muscles. In fact, slow and fast musclescould be exposed to ROS production to different extents,owing to their widely different phenotype and oxidativemetabolism.
To clarify the mechanisms of disuse atrophy, this studycompared the adaptations to hindlimb unloading (HU)of the protein pattern of the soleus (Sol), a slow oxidativemuscle, and of the gastrocnemius (Gas), a fast glycoliticmuscle, of the mouse.
The proteomic approach appeared particularly wellsuited to address the complexity of muscle phenotypicadaptations (Spangenburg & Booth, 2003), because itcan be used to compare the expression of severalhundreds proteins (∼800; Gelfi et al. 2006; Broccaet al. 2008) and provides a very comprehensive pictureof the adaptations in the global protein pattern of adisused muscle. Importantly, the observation that proteinsinvolved in the cellular defense systems against oxidativestress adapted very differently to HU in Sol and Gasprompted experiments to clarify the role of oxidative stressin disuse atrophy. The comparison between Sol and Gaswas combined with the analysis of trolox administration,an antioxidant compound.
Two-dimensional (2-D) proteome maps were obtainedfrom Sol and Gas muscles of the following groups of mice:(i) control, ground-based mice (CTRL mice); (ii) micehindlimb unloaded for 14 days (HU mice); and (iii) HUmice subjected to trolox treatment (HU-TRO mice) for1 week before HU and during the 2 weeks of HU. Theprotein pattern of Sol and Gas showed large differencesin adaptation to HU, which comprised the antioxidantdefense systems and stress proteins, myofibrillar proteins,energy production systems, transport proteins and severalother proteins having a variety of functional roles. Inparticular, the following points were noted: (i) antioxidantdefense systems were impaired in HU Sol and enhanced inHU Gas; (ii) consistently, protein oxidation index and lipid
peroxidation were higher in HU Sol, but normal in HUGas; and (iii) trolox administration did not prevent muscleatrophy, notwithstanding normal defense systems againstoxidative stress and normal levels of protein oxidationand lipid peroxidation in HU-TRO Sol and Gas muscles.Thus, the results of this study indicate that oxidative stressis unlikely to be a major cause of muscle atrophy inhindlimb-unloaded mice.
Methods
Animal care and hindlimb unloading
Experiments were approved by the Italian HealthDepartment and complied with the Italian guidelinesfor the use of laboratory animals, which conform withthe European Community Directive published in 1986(86/609/ECC). Six-month-old male C57BL mice weighing27–32 g (Charles River Laboratories, Calco, Italy) wererandomly assigned to four groups: a control group(CTRL, n = 5); a hindlimb-suspended group (HU, n = 5);a hindlimb-suspended group which was treated withan antioxidant, trolox (HU-TRO, n = 5; Sigma, Milan,Italy); and a ground-based group (TRO; n = 3) whichwas treated with trolox in the exactly same way as theHU-TRO group, but was not hindlimb suspended. TheCTRL and TRO mice were maintained free in single cagesfor 14 days. The method to induce muscle unloading byhindlimb suspension (HU) has been described in detailbefore (Desaphy et al. 2005). Briefly, the animals of HUgroup were suspended individually in special cages for2 weeks by thin string tied at one end to the tail andat the other end to the top of the cage. All mice hadwater ad libitum and received 8 g a day of standard rodentchow. The HU-TRO and TRO mice received daily anintraperitoneal injection of 0.25 ml of a 1 M NaHCO3
solution containing 5 g l−1 trolox, corresponding to∼45 mg kg−1 day−1 for 3 weeks, commencing 1 weekbefore HU and continuing for the 2 weeks of HU.Trolox [(±)-6-hydroxy-2,5,7,8-tetramethylchromane-2-carboxylic acid, Sigma, Milan, Italy] is a water-solublevitamin E analogue that freely crosses cell membranes.The drug displays a very high antioxidant capacity andmay lack antioxidant-unrelated side-effects, so that itis widely used as a standard compound in antioxidantcapacity assays. At the end of suspension, the micewere unfastened from the string and killed by cervicaldislocation. The ground-based (TRO) or hindlimb-unloaded (HU-TRO) mice receiving trolox injectiondaily showed no difference in body weight and foodconsumption compared with CTRL and HU non-treatedanimals, respectively. Soleus (Sol) and gastrocnemius(Gas) muscles were dissected and accurately weighed.Muscles from one leg were immediately frozen in liquidnitrogen and used for proteomic and oxyblot analysis,
C© 2009 The Authors. Journal compilation C© 2009 The Physiological Society
412
Exp Physiol 00.00 pp 1–20 Proteomic analysis of disused mouse muscles 3
while muscles from the other leg were placed into OCT(Tissue-Tek, Sakura Finetek Europe, Zoeterwoude, TheNetherlands) embedding medium, immediately frozen inliquid nitrogen and thereafter used for cross-sectional areaanalysis (CSA). All the muscle samples were stored at−80◦C.
Cross-sectional area analysis
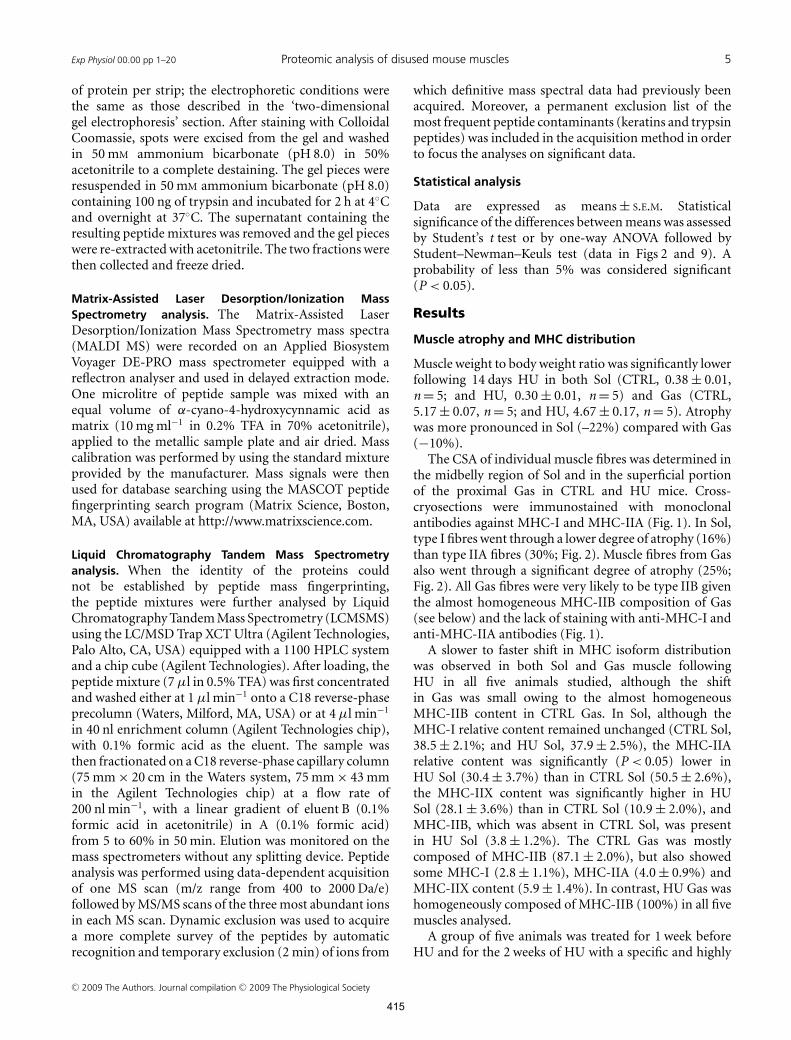
The CSA of individual muscle fibres was determinedboth in the midbelly region of Sol (n = 5) and inthe superficial portion of the Gas muscles (n = 5)for all experimental groups. Serial transverse sections(10 μm thick) of the muscle samples mounted in OCTembedding medium were cut in a cryostat at −20◦Cand collected on coated slides. The cross-cryosectionswere immunostained using two monoclonal antibodiesagainst myosin heavy chain (MHC) isoforms (BA-F8against MHC-I and SC-71 against MHC-IIA) as previouslydescribed in detail (Bottinelli et al. 1991). A secondaryrabbit antimouse immunoglobulin G (IgG) antibodyconjugated with peroxidase (P-0260, DAKO, Glostrup,Denmark) was used to reveal the binding of the primaryantibodies. The antibodies enabled identification of type Iand type IIA muscle fibres. In Sol muscles, most fibres wereeither stained by BA-F8 (type I) or by SC-71 (type IIA)or by both antibodies (hybrid fibres). However, severalfibres were not stained and were very probably type IIXfibres, given the very low content in MHC-IIB of Sol evenfollowing HU. In Sol, the CSA was determined only forpure type I and type IIA fibres. The superficial Gas did notshow any positively stained fibres for either the antibodyagainst MHC-I or the antibody against MHC-IIA. Giventhe lack of staining with such antibodies and the almosthomogeneous MHC-IIB content (∼90% in CTRL and100% in HU and HU-TRO) of the Gas muscles in thepopulation of mice used, all fibres in the cross-sections ofthe Gas samples were very probably type IIB. Therefore,in Gas, CSA was determined in all fibres of the sectionsand fibres were considered type IIB. Images of the stainedsections were captured from a light microscope (LeicaDMLS) and transferred to a personal computer using avideo camera (Leica DFC 280). Cross-sectional areas ofidentified fibres was measured with Scion Image analysissoftware (NIH, Bethesda, MD, USA) and expressed inmicrometres squared.
Analysis of MHC isoform content
The MHC isoform content was determined by anapproach previously described in detail (Pellegrino et al.2003). Briefly, about 6 μg of each muscle sample weredissolved in lysis buffer containing 8 M urea, 2 M thiourea,4% Chaps, 65 mM dithiothreitol (DTT) and 40 mM Trisbase. The lysates were loaded onto 8% polyacrylamideSDS-PAGE gels. Electrophoresis was run for 2 h at 200 V
and then for 24 h at 250 V; the gels were stained withCoomassie Blue staining. Four bands could be separated inthe region of MHC isoforms. These bands corresponded,in order of migration from the fastest to the slowest,to MHC-I or slow, MHC-IIB, MHC-IIX and MHC-IIA.Densitometric analysis of MHC bands was performed toassess the relative proportion of the four MHC isoformsin the samples (Pellegrino et al. 2003). It should be notedthat the same samples, made from the whole Sol or Gasmuscles, were used for both analysis of MHC isoformdistribution and proteomic analysis, whereas CSA of Gasfibres was determined in the superficial portion of themuscle only where MHC-I and MHC-IIA were absent.
Oxyblot analysis
Muscle homogenates. Muscle samples previously storedat −80◦C were homogenized at 4◦C in an antioxidantbuffer containing protease inhibitors, 25 mM imidazoleand 5 mM EDTA, pH 7.2 adjusted with NaOH. The proteinsuspension was centrifuged at 12 000g for 10 min and thepellet resuspended in 0.01% tetrafluoroacetic acid solution(200 μl of TFA for 0.1 g of tissue). Following a secondcentrifugation for 5 min at 12 000g , the supernatant wascollected and the protein concentration determined (RCDC protein assay, Bio-Rad Laboratories, Hercules, CA,USA).
Oxyblot procedure. The principle of oxyblot procedureis to detect carbonyl groups deriving from proteinoxidation in the protein side-chains. The OxyblotOxidized Protein Detection Kit was purchased fromMillipore (Vimodrone, Italy). The same experimentalapproach has been used previously (Barreiro et al. 2003,2005; Coirault et al. 2007) and was applied here withminor modifications. Protein carbonyls were derivatizedto dinitrophenylhydrazone (DNP) by reaction with 2,4-dinitrophenylhydrazine (DNPH). The DNP-derivatizedprotein samples were separated by polyacrylamide gelelectrophoresis followed by Western blotting. In detail,6 μg of proteins for each muscle sample were denaturedwith SDS solution at a final concentration of 6%. TheDNPH solution was added to obtain the derivation;the reaction was stopped after 15 min of incubation atroom temperature. One-dimensional electrophoresis wascarried out on 15% SDS-polyacrylamide gels loaded with6 μg of derivatized proteins. A mixture of proteins ofknown molecular weight, provided with the kit, was alsoloaded to provide molecular weight markers. Proteins weretransferred to nitrocellulose membranes at 100 V for 2 h,stained with Ponceau Red (Sigma) and then scanned. Themembranes were blocked by incubation with 3% bovineserum albumin for 1 h and then incubated with rabbitanti-DNP antibody (at 1:150 dilution) for 1 h at roomtemperature. Blots were washed three times for 10 min
C© 2009 The Authors. Journal compilation C© 2009 The Physiological Society
413
4 L. Brocca and others Exp Physiol 00.00 pp 1–20
and were then incubated with peroxidase-labelled anti-rabbit IgG for 1 h.
Blots were developed by using an enhancedchemiluminescence method in which luminol was excitedby peroxidase in the presence of H2O2 (ECL advance,Healthcare, Chalfont St. Giles, UK). To assess theselectivity of carbonyl measurements, a negative controlwas always loaded (muscle protein sample without thederivatization step). Autoradiographic films were imagedusing a high-resolution scanner (Epson V750 PRO imagesystem), and densitometric analysis was performed usingthe software Adobe Photoshop 5.5 (Adobe; D’Antona et al.2003). Protein oxidation was quantified by defining theoxidative index (OI), i.e. the ratio between densitometricvalues of the oxyblot bands and those stained with PonceauRed (Oxy/PR). To compare different experiments, the OIwas expressed relative to control samples.
Measurement of malondialdehyde (MDA) levels
To assess oxidative stress using a method independentfrom oxyblot, we determined the levels ofmalondialdehyde in three Sol and three Gas musclesdissected from separate groups of three hindlimb-suspended mice and three hindlimb-suspended micesubjected to trolox administration. Muscles weredissected, weighed and frozen in liquid nitrogen. TheMDA level, which reflects the level of lipid peroxidation,was measured by fluorescence assay of thiobarbituricacid reactive substance (TBARS) formation, followingthe indications of a commercial kit (OXItek, ZeptoMetrixCorp., Buffalo, NY, USA). Fluorescence measurementswere performed in triplicate using a 96-well plate reader(Victor3V mutilabel counter, Perkin Elmer, Waltham,MA, USA). The measured MDA levels were normalizedwith respect to homogenization volume and muscleweight.
Proteome analysis [two-dimensional (2-D) gelelectrophoresis, 2-DE]
Sample preparation. The methods of proteome analysisare mostly the same as those previously used (Brocca et al.2008). Muscle samples previously stored at −80◦C werepulverized in a steel mortar with liquid nitrogen to obtain apowder that was immediately resuspended in a lysis buffer(8 M urea, 2 M thiourea, 4% Chaps, 65 mM DTT and 40 mM
Tris base). The samples were vortexed, frozen with liquidnitrogen and thawed at room temperature four times andthen incubated with DNase and RNase for 45 min at 4◦Cto separate proteins from nucleic acids and then spun at35 000g for 30 min. Protein concentration in the dissolvedsamples was determined with a protein assay kit (2D quantKit, GE Healthcare).
In order to perform proteome analysis, a sample mixwas obtained for each experimental animal group (CTRL,
HU and HU-TRO) for both soleus and gastrocnemius.Sample mix contained an equal quantity of protein takenfrom each muscle sample of CTRL, HU and HU-TRO.As the TRO group did not differ from the CTRL group itwas not subjected to proteome analysis (see ‘Adaptationto protein pattern’ for detail).
Two-dimensional gel electrophoresis. Isoelectrofocusingwas carried out using the IPGphor system (Ettan IPGphorisoelectric focusing system, GE Healthcare). The IPGgel strips, pH 3–11 NL (non-linear), 13 cm long, wererehydrated for 14 h, at 30 V and 20◦C, in 250 μl ofreswelling buffer [8 M urea, 2 M thiourea, 2% (w/v) Chaps,0.1% (v/v) tergitol NP7 (Sigma), 65 mM DTT and 0.5%(v/v) pH 3–11NL (GE Healthcare)] containing 100 μgprotein sample. Strips were focused at 20 000 V h–1, ata constant temperature of 20◦C, and the current waslimited to 50 μA per IPG gel strip. After isoelectrofocusing,the strips were stored at −80◦C until use or equilibratedimmediately for 10–12 min in 5 ml of equilibration buffer[50 mM Tris pH 6.8, 6 M urea, 30% (v/v) glycerol, 2% (w/v)SDS and 3% (w/v) iodoacetamide]. Then, the immobilizedIPG gel strips were applied to 15% total acrylamide-bisacrylamide monomer concentration, 2.5% crosslinkerconcentration polyacrylamide gels without a stacking gel.The separation was performed at 80 V for 17 h at roomtemperature.
The 2-D gels were fixed for 2 h in fixing solution [40%(v/v) ethanol and 10% (v/v) acetic acid], stained withfluorescent staining (FlamingoTM fluorescent gel stain,Bio-Rad) for 3 h and destained with 0.1% (w/v) Tween 20solution for 10 min.
Triplicate gels of each sample were visualized usinga Typhoon laser scanner (GE Healthcare) and analysedwith Platinum software (GE Healthcare). One gel waschosen as the master gel, and used for the automaticmatching of spots in the other 2-D gels. Only spotspresent in all gels used for the analysis were considered.The software provided the normalized volume for eachspot (representing the amount of protein). A very goodreproducibility of the spots among the triplicate gelsof each experimental group was found. When the spotvolumes for matched spots were plotted on a linearscale, regression analysis yielded correlation coefficientsin the range 0.89–0.94. The volumes of each spots inthe triplicate gels were averaged, and spots statisticallychanged were obtained (P < 0.05). The average volumes ofeach differentially expressed spot were used to determinethe volume ratios reported in the figures and Supplementaltables. Supplemental Tables 1–4 also report the P values ofeach differentially expressed spot.
Protein identification
Electrophoresis fractionation and in situ digestion. Forprotein identification, 2-D gels were loaded with 300 μg
C© 2009 The Authors. Journal compilation C© 2009 The Physiological Society
414
Exp Physiol 00.00 pp 1–20 Proteomic analysis of disused mouse muscles 5
of protein per strip; the electrophoretic conditions werethe same as those described in the ‘two-dimensionalgel electrophoresis’ section. After staining with ColloidalCoomassie, spots were excised from the gel and washedin 50 mM ammonium bicarbonate (pH 8.0) in 50%acetonitrile to a complete destaining. The gel pieces wereresuspended in 50 mM ammonium bicarbonate (pH 8.0)containing 100 ng of trypsin and incubated for 2 h at 4◦Cand overnight at 37◦C. The supernatant containing theresulting peptide mixtures was removed and the gel pieceswere re-extracted with acetonitrile. The two fractions werethen collected and freeze dried.
Matrix-Assisted Laser Desorption/Ionization MassSpectrometry analysis. The Matrix-Assisted LaserDesorption/Ionization Mass Spectrometry mass spectra(MALDI MS) were recorded on an Applied BiosystemVoyager DE-PRO mass spectrometer equipped with areflectron analyser and used in delayed extraction mode.One microlitre of peptide sample was mixed with anequal volume of α-cyano-4-hydroxycynnamic acid asmatrix (10 mg ml−1 in 0.2% TFA in 70% acetonitrile),applied to the metallic sample plate and air dried. Masscalibration was performed by using the standard mixtureprovided by the manufacturer. Mass signals were thenused for database searching using the MASCOT peptidefingerprinting search program (Matrix Science, Boston,MA, USA) available at http://www.matrixscience.com.
Liquid Chromatography Tandem Mass Spectrometryanalysis. When the identity of the proteins couldnot be established by peptide mass fingerprinting,the peptide mixtures were further analysed by LiquidChromatography Tandem Mass Spectrometry (LCMSMS)using the LC/MSD Trap XCT Ultra (Agilent Technologies,Palo Alto, CA, USA) equipped with a 1100 HPLC systemand a chip cube (Agilent Technologies). After loading, thepeptide mixture (7 μl in 0.5% TFA) was first concentratedand washed either at 1 μl min−1 onto a C18 reverse-phaseprecolumn (Waters, Milford, MA, USA) or at 4 μl min−1
in 40 nl enrichment column (Agilent Technologies chip),with 0.1% formic acid as the eluent. The sample wasthen fractionated on a C18 reverse-phase capillary column(75 mm × 20 cm in the Waters system, 75 mm × 43 mmin the Agilent Technologies chip) at a flow rate of200 nl min−1, with a linear gradient of eluent B (0.1%formic acid in acetonitrile) in A (0.1% formic acid)from 5 to 60% in 50 min. Elution was monitored on themass spectrometers without any splitting device. Peptideanalysis was performed using data-dependent acquisitionof one MS scan (m/z range from 400 to 2000 Da/e)followed by MS/MS scans of the three most abundant ionsin each MS scan. Dynamic exclusion was used to acquirea more complete survey of the peptides by automaticrecognition and temporary exclusion (2 min) of ions from
which definitive mass spectral data had previously beenacquired. Moreover, a permanent exclusion list of themost frequent peptide contaminants (keratins and trypsinpeptides) was included in the acquisition method in orderto focus the analyses on significant data.
Statistical analysis
Data are expressed as means ± S.E.M. Statisticalsignificance of the differences between means was assessedby Student’s t test or by one-way ANOVA followed byStudent–Newman–Keuls test (data in Figs 2 and 9). Aprobability of less than 5% was considered significant(P < 0.05).
Results
Muscle atrophy and MHC distribution
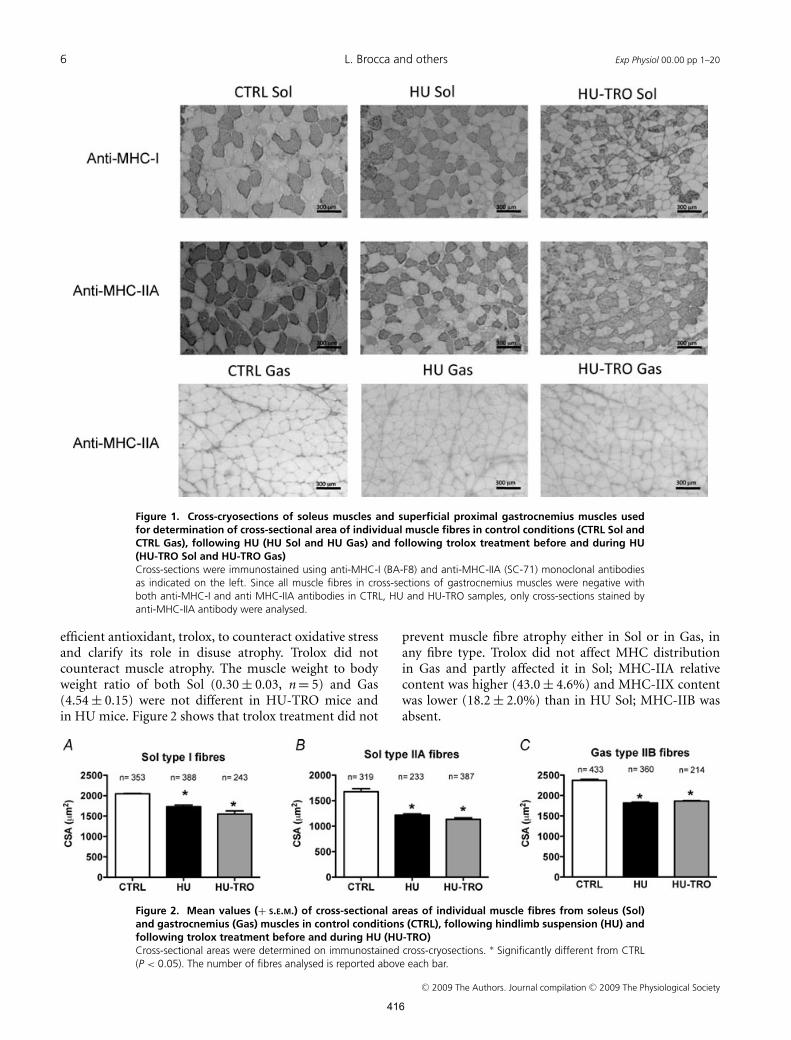
Muscle weight to body weight ratio was significantly lowerfollowing 14 days HU in both Sol (CTRL, 0.38 ± 0.01,n = 5; and HU, 0.30 ± 0.01, n = 5) and Gas (CTRL,5.17 ± 0.07, n = 5; and HU, 4.67 ± 0.17, n = 5). Atrophywas more pronounced in Sol (–22%) compared with Gas(−10%).
The CSA of individual muscle fibres was determined inthe midbelly region of Sol and in the superficial portionof the proximal Gas in CTRL and HU mice. Cross-cryosections were immunostained with monoclonalantibodies against MHC-I and MHC-IIA (Fig. 1). In Sol,type I fibres went through a lower degree of atrophy (16%)than type IIA fibres (30%; Fig. 2). Muscle fibres from Gasalso went through a significant degree of atrophy (25%;Fig. 2). All Gas fibres were very likely to be type IIB giventhe almost homogeneous MHC-IIB composition of Gas(see below) and the lack of staining with anti-MHC-I andanti-MHC-IIA antibodies (Fig. 1).
A slower to faster shift in MHC isoform distributionwas observed in both Sol and Gas muscle followingHU in all five animals studied, although the shiftin Gas was small owing to the almost homogeneousMHC-IIB content in CTRL Gas. In Sol, although theMHC-I relative content remained unchanged (CTRL Sol,38.5 ± 2.1%; and HU Sol, 37.9 ± 2.5%), the MHC-IIArelative content was significantly (P < 0.05) lower inHU Sol (30.4 ± 3.7%) than in CTRL Sol (50.5 ± 2.6%),the MHC-IIX content was significantly higher in HUSol (28.1 ± 3.6%) than in CTRL Sol (10.9 ± 2.0%), andMHC-IIB, which was absent in CTRL Sol, was presentin HU Sol (3.8 ± 1.2%). The CTRL Gas was mostlycomposed of MHC-IIB (87.1 ± 2.0%), but also showedsome MHC-I (2.8 ± 1.1%), MHC-IIA (4.0 ± 0.9%) andMHC-IIX content (5.9 ± 1.4%). In contrast, HU Gas washomogeneously composed of MHC-IIB (100%) in all fivemuscles analysed.
A group of five animals was treated for 1 week beforeHU and for the 2 weeks of HU with a specific and highly
C© 2009 The Authors. Journal compilation C© 2009 The Physiological Society
415
6 L. Brocca and others Exp Physiol 00.00 pp 1–20
Figure 1. Cross-cryosections of soleus muscles and superficial proximal gastrocnemius muscles usedfor determination of cross-sectional area of individual muscle fibres in control conditions (CTRL Sol andCTRL Gas), following HU (HU Sol and HU Gas) and following trolox treatment before and during HU(HU-TRO Sol and HU-TRO Gas)Cross-sections were immunostained using anti-MHC-I (BA-F8) and anti-MHC-IIA (SC-71) monoclonal antibodiesas indicated on the left. Since all muscle fibres in cross-sections of gastrocnemius muscles were negative withboth anti-MHC-I and anti MHC-IIA antibodies in CTRL, HU and HU-TRO samples, only cross-sections stained byanti-MHC-IIA antibody were analysed.
efficient antioxidant, trolox, to counteract oxidative stressand clarify its role in disuse atrophy. Trolox did notcounteract muscle atrophy. The muscle weight to bodyweight ratio of both Sol (0.30 ± 0.03, n = 5) and Gas(4.54 ± 0.15) were not different in HU-TRO mice andin HU mice. Figure 2 shows that trolox treatment did not
Figure 2. Mean values (+ S.E.M.) of cross-sectional areas of individual muscle fibres from soleus (Sol)and gastrocnemius (Gas) muscles in control conditions (CTRL), following hindlimb suspension (HU) andfollowing trolox treatment before and during HU (HU-TRO)Cross-sectional areas were determined on immunostained cross-cryosections. ∗ Significantly different from CTRL(P < 0.05). The number of fibres analysed is reported above each bar.
prevent muscle fibre atrophy either in Sol or in Gas, inany fibre type. Trolox did not affect MHC distributionin Gas and partly affected it in Sol; MHC-IIA relativecontent was higher (43.0 ± 4.6%) and MHC-IIX contentwas lower (18.2 ± 2.0%) than in HU Sol; MHC-IIB wasabsent.
C© 2009 The Authors. Journal compilation C© 2009 The Physiological Society
416
Exp Physiol 00.00 pp 1–20 Proteomic analysis of disused mouse muscles 7
To ensure that trolox treatment per se did not determinemuscle atrophy or relevant changes in muscle phenotype,a ground-based group of mice (n = 3) was treated withtrolox. The muscle weight to body weight ratio ofSol (0.42 ± 0.04, n = 3) and Gas muscles (5.45 ± 0.31,n = 3) was not different from CTRL. The myosin heavychain isoform distribution was also not different fromcontrol values either in Sol (MHC-I, 37.4 ± 3.1%; MHC-IIA, 51.55 ± 4.63%; MHC-IIX, 10.91 ± 3.5%; and MHC-IIB, 0%) or in Gas (MHC-I, 1.51 ± 0.31%; MHC-IIA,2.49 ± 0.81%; MHC-IIX, 6.01 ± 0.49%; and MHC-IIB,90.0 ± 2.2%).
Adaptations of protein pattern
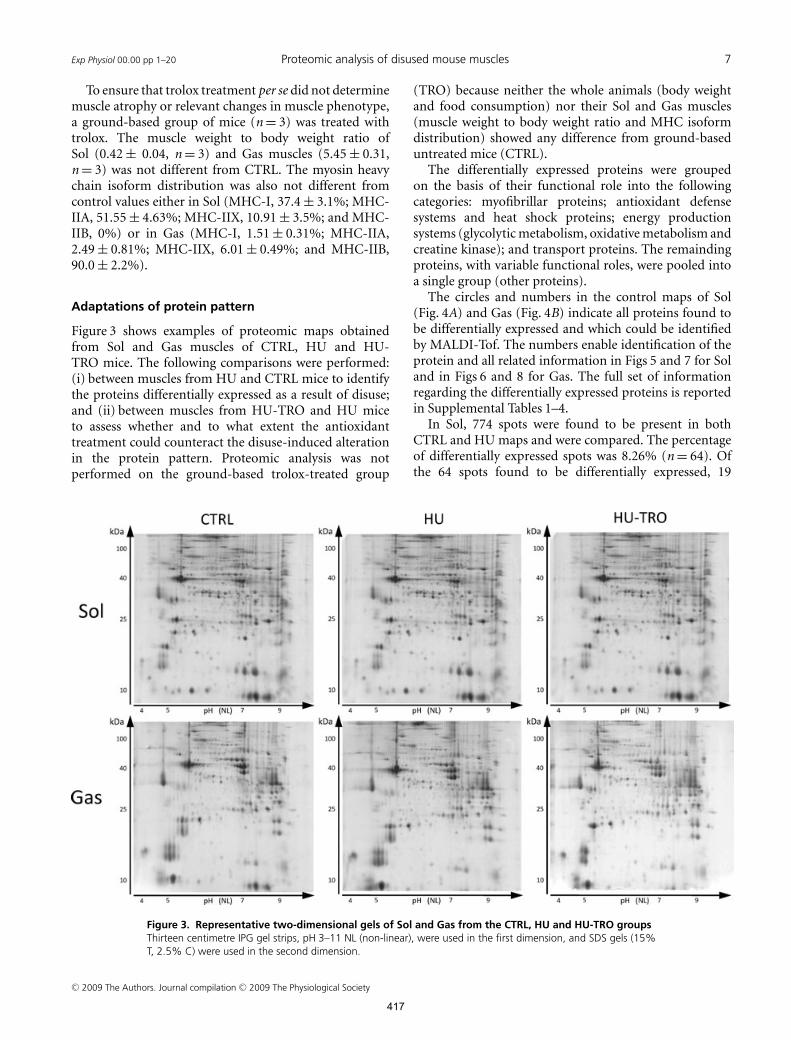
Figure 3 shows examples of proteomic maps obtainedfrom Sol and Gas muscles of CTRL, HU and HU-TRO mice. The following comparisons were performed:(i) between muscles from HU and CTRL mice to identifythe proteins differentially expressed as a result of disuse;and (ii) between muscles from HU-TRO and HU miceto assess whether and to what extent the antioxidanttreatment could counteract the disuse-induced alterationin the protein pattern. Proteomic analysis was notperformed on the ground-based trolox-treated group
Figure 3. Representative two-dimensional gels of Sol and Gas from the CTRL, HU and HU-TRO groupsThirteen centimetre IPG gel strips, pH 3–11 NL (non-linear), were used in the first dimension, and SDS gels (15%T, 2.5% C) were used in the second dimension.
(TRO) because neither the whole animals (body weightand food consumption) nor their Sol and Gas muscles(muscle weight to body weight ratio and MHC isoformdistribution) showed any difference from ground-baseduntreated mice (CTRL).
The differentially expressed proteins were groupedon the basis of their functional role into the followingcategories: myofibrillar proteins; antioxidant defensesystems and heat shock proteins; energy productionsystems (glycolytic metabolism, oxidative metabolism andcreatine kinase); and transport proteins. The remaindingproteins, with variable functional roles, were pooled intoa single group (other proteins).
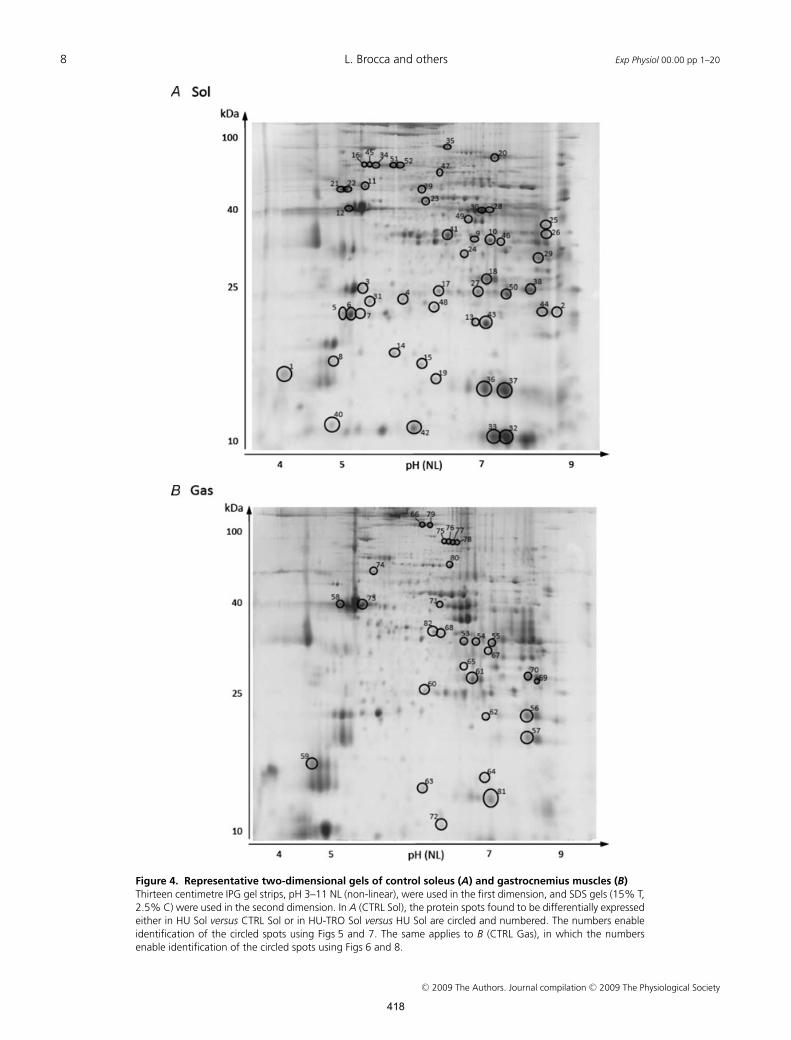
The circles and numbers in the control maps of Sol(Fig. 4A) and Gas (Fig. 4B) indicate all proteins found tobe differentially expressed and which could be identifiedby MALDI-Tof. The numbers enable identification of theprotein and all related information in Figs 5 and 7 for Soland in Figs 6 and 8 for Gas. The full set of informationregarding the differentially expressed proteins is reportedin Supplemental Tables 1–4.
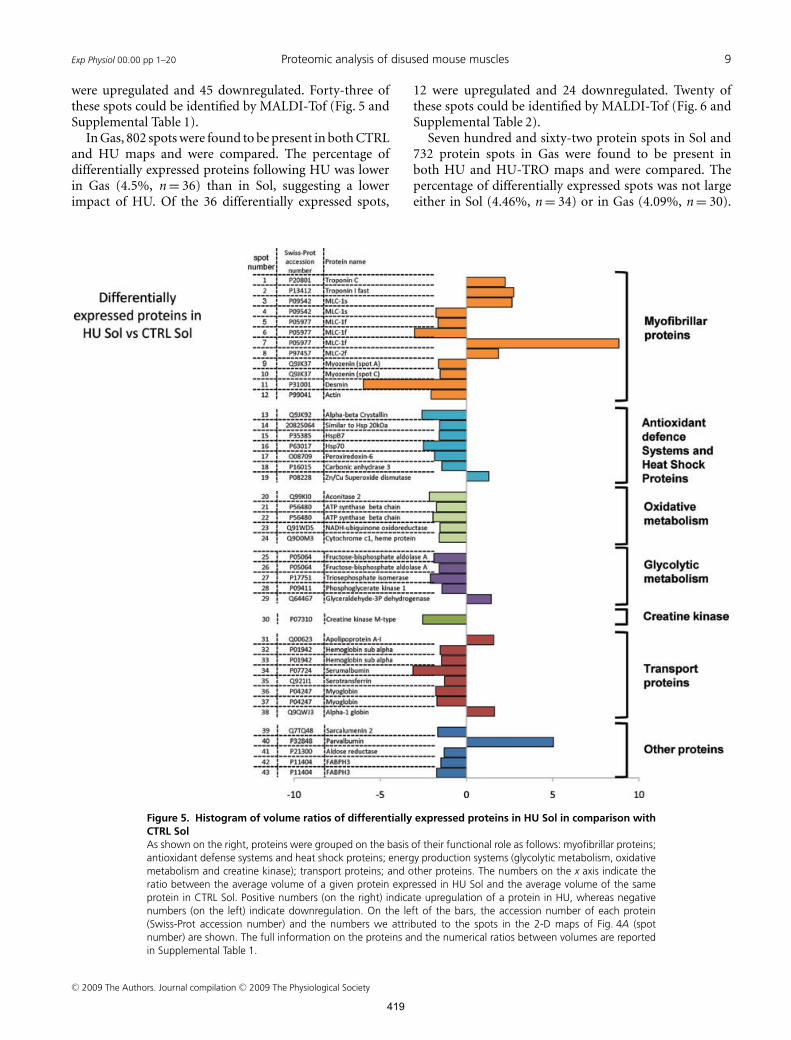
In Sol, 774 spots were found to be present in bothCTRL and HU maps and were compared. The percentageof differentially expressed spots was 8.26% (n = 64). Ofthe 64 spots found to be differentially expressed, 19
C© 2009 The Authors. Journal compilation C© 2009 The Physiological Society
417
8 L. Brocca and others Exp Physiol 00.00 pp 1–20
Figure 4. Representative two-dimensional gels of control soleus (A) and gastrocnemius muscles (B)Thirteen centimetre IPG gel strips, pH 3–11 NL (non-linear), were used in the first dimension, and SDS gels (15% T,2.5% C) were used in the second dimension. In A (CTRL Sol), the protein spots found to be differentially expressedeither in HU Sol versus CTRL Sol or in HU-TRO Sol versus HU Sol are circled and numbered. The numbers enableidentification of the circled spots using Figs 5 and 7. The same applies to B (CTRL Gas), in which the numbersenable identification of the circled spots using Figs 6 and 8.
C© 2009 The Authors. Journal compilation C© 2009 The Physiological Society
418
Exp Physiol 00.00 pp 1–20 Proteomic analysis of disused mouse muscles 9
were upregulated and 45 downregulated. Forty-three ofthese spots could be identified by MALDI-Tof (Fig. 5 andSupplemental Table 1).
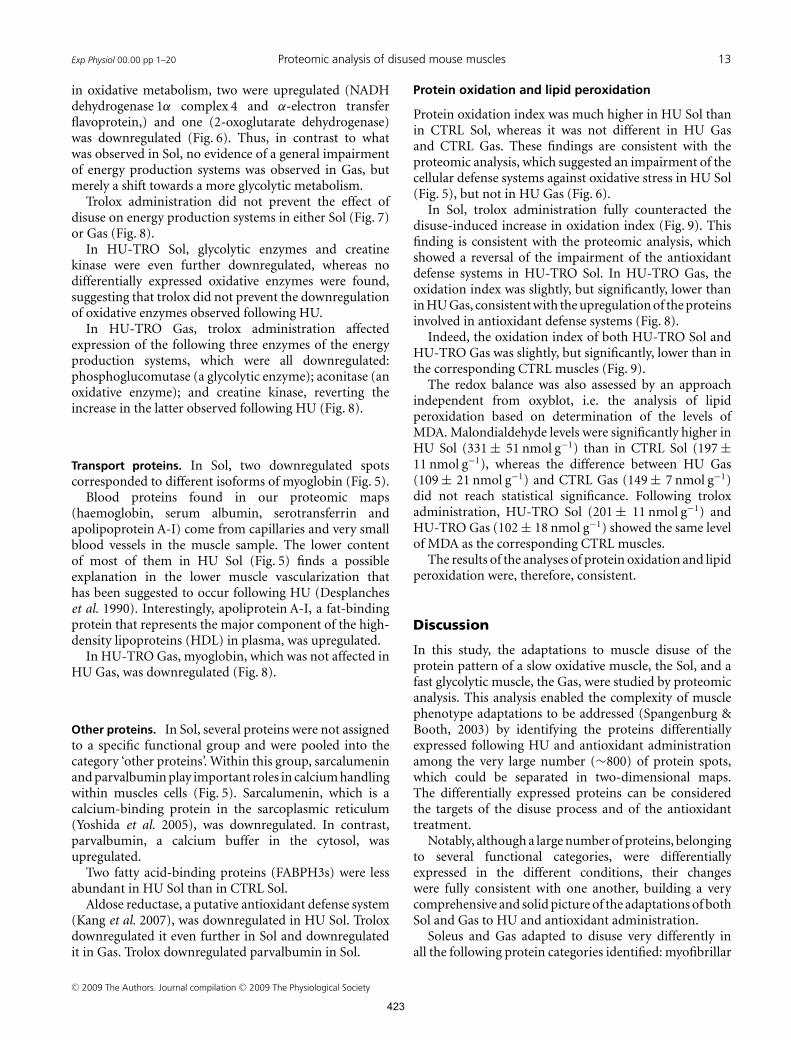
In Gas, 802 spots were found to be present in both CTRLand HU maps and were compared. The percentage ofdifferentially expressed proteins following HU was lowerin Gas (4.5%, n = 36) than in Sol, suggesting a lowerimpact of HU. Of the 36 differentially expressed spots,
Figure 5. Histogram of volume ratios of differentially expressed proteins in HU Sol in comparison withCTRL SolAs shown on the right, proteins were grouped on the basis of their functional role as follows: myofibrillar proteins;antioxidant defense systems and heat shock proteins; energy production systems (glycolytic metabolism, oxidativemetabolism and creatine kinase); transport proteins; and other proteins. The numbers on the x axis indicate theratio between the average volume of a given protein expressed in HU Sol and the average volume of the sameprotein in CTRL Sol. Positive numbers (on the right) indicate upregulation of a protein in HU, whereas negativenumbers (on the left) indicate downregulation. On the left of the bars, the accession number of each protein(Swiss-Prot accession number) and the numbers we attributed to the spots in the 2-D maps of Fig. 4A (spotnumber) are shown. The full information on the proteins and the numerical ratios between volumes are reportedin Supplemental Table 1.
12 were upregulated and 24 downregulated. Twenty ofthese spots could be identified by MALDI-Tof (Fig. 6 andSupplemental Table 2).
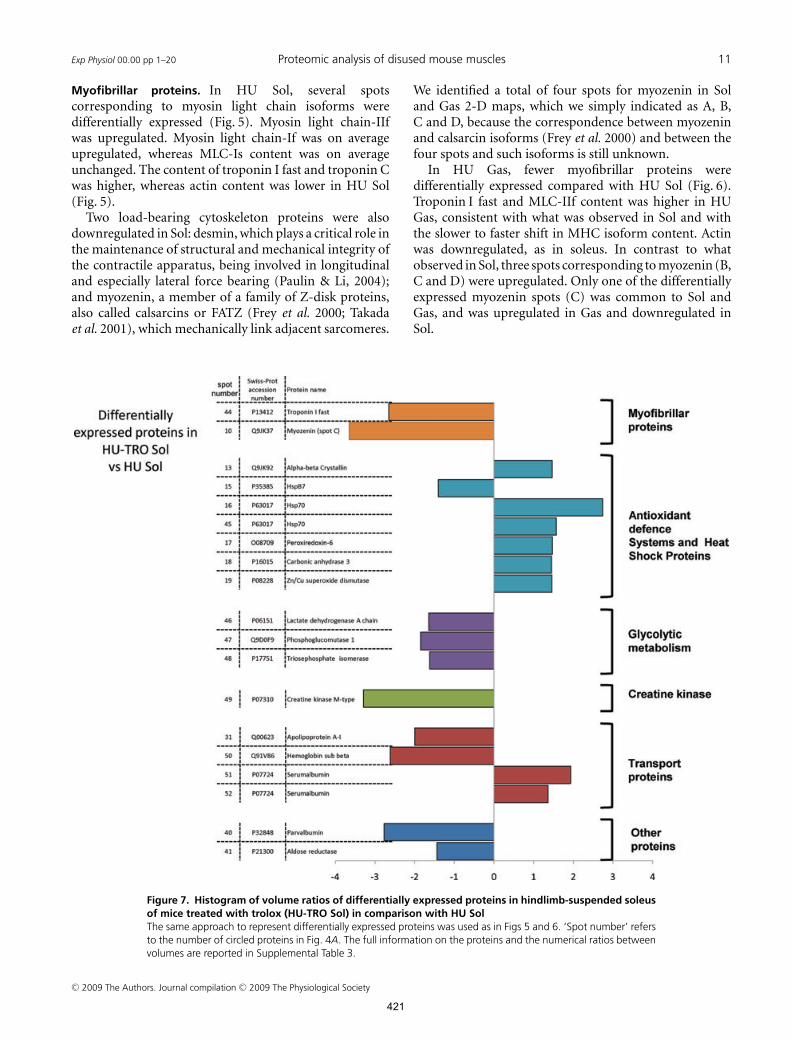
Seven hundred and sixty-two protein spots in Sol and732 protein spots in Gas were found to be present inboth HU and HU-TRO maps and were compared. Thepercentage of differentially expressed spots was not largeeither in Sol (4.46%, n = 34) or in Gas (4.09%, n = 30).
C© 2009 The Authors. Journal compilation C© 2009 The Physiological Society
419

10 L. Brocca and others Exp Physiol 00.00 pp 1–20
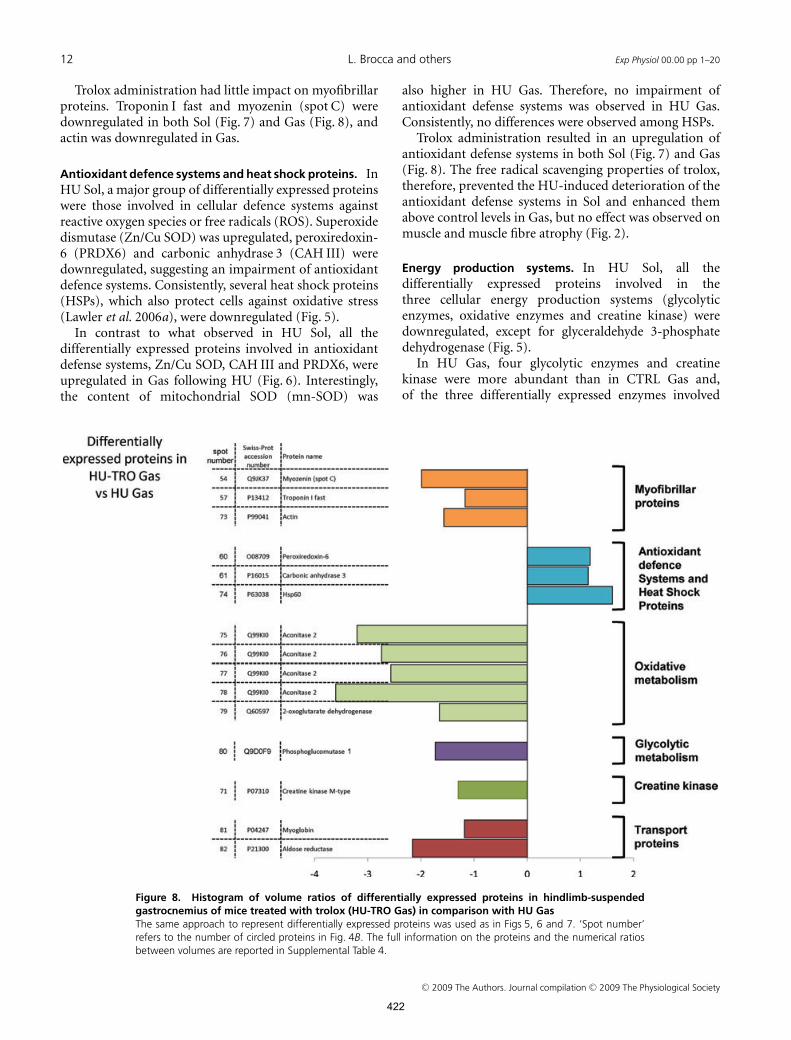
Of the 34 spots found to be differentially expressed in Sol,nine were upregulated and 25 downregulated. Nineteenof these spots could be identified by MALDI-Tof (Fig. 7and Supplemental Table 3). Of the 30 spots found tobe differentially expressed in Gas, 8 were upregulatedand 22 downregulated. Fifteen of such spots couldbe identified by MALDI-Tof (Fig. 8 and SupplementalTable 4).
Several of the differentially expressed proteins reportedin Figs 5–8 and Supplemental Tables 1–4 were found atmultiple spot locations (see, for example, myozenin inFig. 5 and Supplemental Table 1 and aconitase in Fig. 8 andSupplemental Table 4) and therefore appear more thanonce in the figures and Supplemental tables. The presence
Figure 6. Histogram of volume ratios of differentially expressed proteins in HU Gas in comparison withCTRL GasThe same approach to represent differentially expressed proteins was used as in Fig. 5. ‘Spot number’ refers tothe number of circled proteins in Fig. 4B. The full information on the proteins and the numerical ratios betweenvolumes are reported in Supplemental Table 2.
of multiple spots of a protein is frequent in 2-D gels andis due to the existence of isoforms or to post-translationalmodifications of a protein. Different isoforms of thesame protein might differ both in molecular weightand in isoelectric point, whereas multiple spots due topost-translational modifications usually have the samemolecular weight. Mass spectrometry was not able toidentify all isoforms of some proteins or the nature oftheir post-translational modifications. However, in onlytwo cases, MLC-Is and MLC-If, the multiple spots of aprotein varied in opposite directions (some upregulatedand some downregulated). In such cases, to assess whetherthe trend was towards up- or downregulation, the multiplespots of MLC-Is and MLC-If were averaged.
C© 2009 The Authors. Journal compilation C© 2009 The Physiological Society
420
Exp Physiol 00.00 pp 1–20 Proteomic analysis of disused mouse muscles 11
Myofibrillar proteins. In HU Sol, several spotscorresponding to myosin light chain isoforms weredifferentially expressed (Fig. 5). Myosin light chain-IIfwas upregulated. Myosin light chain-If was on averageupregulated, whereas MLC-Is content was on averageunchanged. The content of troponin I fast and troponin Cwas higher, whereas actin content was lower in HU Sol(Fig. 5).
Two load-bearing cytoskeleton proteins were alsodownregulated in Sol: desmin, which plays a critical role inthe maintenance of structural and mechanical integrity ofthe contractile apparatus, being involved in longitudinaland especially lateral force bearing (Paulin & Li, 2004);and myozenin, a member of a family of Z-disk proteins,also called calsarcins or FATZ (Frey et al. 2000; Takadaet al. 2001), which mechanically link adjacent sarcomeres.
Figure 7. Histogram of volume ratios of differentially expressed proteins in hindlimb-suspended soleusof mice treated with trolox (HU-TRO Sol) in comparison with HU SolThe same approach to represent differentially expressed proteins was used as in Figs 5 and 6. ‘Spot number’ refersto the number of circled proteins in Fig. 4A. The full information on the proteins and the numerical ratios betweenvolumes are reported in Supplemental Table 3.
We identified a total of four spots for myozenin in Soland Gas 2-D maps, which we simply indicated as A, B,C and D, because the correspondence between myozeninand calsarcin isoforms (Frey et al. 2000) and between thefour spots and such isoforms is still unknown.
In HU Gas, fewer myofibrillar proteins weredifferentially expressed compared with HU Sol (Fig. 6).Troponin I fast and MLC-IIf content was higher in HUGas, consistent with what was observed in Sol and withthe slower to faster shift in MHC isoform content. Actinwas downregulated, as in soleus. In contrast to whatobserved in Sol, three spots corresponding to myozenin (B,C and D) were upregulated. Only one of the differentiallyexpressed myozenin spots (C) was common to Sol andGas, and was upregulated in Gas and downregulated inSol.
C© 2009 The Authors. Journal compilation C© 2009 The Physiological Society
421
12 L. Brocca and others Exp Physiol 00.00 pp 1–20
Trolox administration had little impact on myofibrillarproteins. Troponin I fast and myozenin (spot C) weredownregulated in both Sol (Fig. 7) and Gas (Fig. 8), andactin was downregulated in Gas.
Antioxidant defence systems and heat shock proteins. InHU Sol, a major group of differentially expressed proteinswere those involved in cellular defence systems againstreactive oxygen species or free radicals (ROS). Superoxidedismutase (Zn/Cu SOD) was upregulated, peroxiredoxin-6 (PRDX6) and carbonic anhydrase 3 (CAH III) weredownregulated, suggesting an impairment of antioxidantdefence systems. Consistently, several heat shock proteins(HSPs), which also protect cells against oxidative stress(Lawler et al. 2006a), were downregulated (Fig. 5).
In contrast to what observed in HU Sol, all thedifferentially expressed proteins involved in antioxidantdefense systems, Zn/Cu SOD, CAH III and PRDX6, wereupregulated in Gas following HU (Fig. 6). Interestingly,the content of mitochondrial SOD (mn-SOD) was
Figure 8. Histogram of volume ratios of differentially expressed proteins in hindlimb-suspendedgastrocnemius of mice treated with trolox (HU-TRO Gas) in comparison with HU GasThe same approach to represent differentially expressed proteins was used as in Figs 5, 6 and 7. ‘Spot number’refers to the number of circled proteins in Fig. 4B. The full information on the proteins and the numerical ratiosbetween volumes are reported in Supplemental Table 4.
also higher in HU Gas. Therefore, no impairment ofantioxidant defense systems was observed in HU Gas.Consistently, no differences were observed among HSPs.
Trolox administration resulted in an upregulation ofantioxidant defense systems in both Sol (Fig. 7) and Gas(Fig. 8). The free radical scavenging properties of trolox,therefore, prevented the HU-induced deterioration of theantioxidant defense systems in Sol and enhanced themabove control levels in Gas, but no effect was observed onmuscle and muscle fibre atrophy (Fig. 2).
Energy production systems. In HU Sol, all thedifferentially expressed proteins involved in thethree cellular energy production systems (glycolyticenzymes, oxidative enzymes and creatine kinase) weredownregulated, except for glyceraldehyde 3-phosphatedehydrogenase (Fig. 5).
In HU Gas, four glycolytic enzymes and creatinekinase were more abundant than in CTRL Gas and,of the three differentially expressed enzymes involved
C© 2009 The Authors. Journal compilation C© 2009 The Physiological Society
422
Exp Physiol 00.00 pp 1–20 Proteomic analysis of disused mouse muscles 13
in oxidative metabolism, two were upregulated (NADHdehydrogenase 1α complex 4 and α-electron transferflavoprotein,) and one (2-oxoglutarate dehydrogenase)was downregulated (Fig. 6). Thus, in contrast to whatwas observed in Sol, no evidence of a general impairmentof energy production systems was observed in Gas, butmerely a shift towards a more glycolytic metabolism.
Trolox administration did not prevent the effect ofdisuse on energy production systems in either Sol (Fig. 7)or Gas (Fig. 8).
In HU-TRO Sol, glycolytic enzymes and creatinekinase were even further downregulated, whereas nodifferentially expressed oxidative enzymes were found,suggesting that trolox did not prevent the downregulationof oxidative enzymes observed following HU.
In HU-TRO Gas, trolox administration affectedexpression of the following three enzymes of the energyproduction systems, which were all downregulated:phosphoglucomutase (a glycolytic enzyme); aconitase (anoxidative enzyme); and creatine kinase, reverting theincrease in the latter observed following HU (Fig. 8).
Transport proteins. In Sol, two downregulated spotscorresponded to different isoforms of myoglobin (Fig. 5).
Blood proteins found in our proteomic maps(haemoglobin, serum albumin, serotransferrin andapolipoprotein A-I) come from capillaries and very smallblood vessels in the muscle sample. The lower contentof most of them in HU Sol (Fig. 5) finds a possibleexplanation in the lower muscle vascularization thathas been suggested to occur following HU (Desplancheset al. 1990). Interestingly, apoliprotein A-I, a fat-bindingprotein that represents the major component of the high-density lipoproteins (HDL) in plasma, was upregulated.
In HU-TRO Gas, myoglobin, which was not affected inHU Gas, was downregulated (Fig. 8).
Other proteins. In Sol, several proteins were not assignedto a specific functional group and were pooled into thecategory ‘other proteins’. Within this group, sarcalumeninand parvalbumin play important roles in calcium handlingwithin muscles cells (Fig. 5). Sarcalumenin, which is acalcium-binding protein in the sarcoplasmic reticulum(Yoshida et al. 2005), was downregulated. In contrast,parvalbumin, a calcium buffer in the cytosol, wasupregulated.
Two fatty acid-binding proteins (FABPH3s) were lessabundant in HU Sol than in CTRL Sol.
Aldose reductase, a putative antioxidant defense system(Kang et al. 2007), was downregulated in HU Sol. Troloxdownregulated it even further in Sol and downregulatedit in Gas. Trolox downregulated parvalbumin in Sol.
Protein oxidation and lipid peroxidation
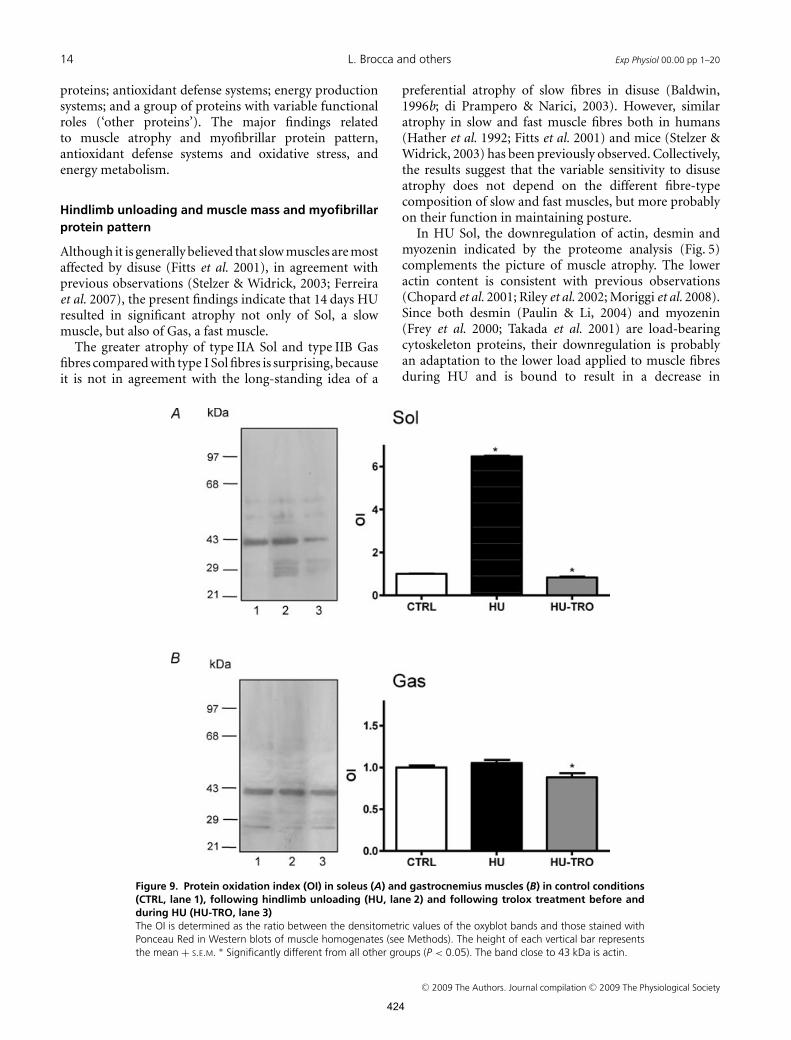
Protein oxidation index was much higher in HU Sol thanin CTRL Sol, whereas it was not different in HU Gasand CTRL Gas. These findings are consistent with theproteomic analysis, which suggested an impairment of thecellular defense systems against oxidative stress in HU Sol(Fig. 5), but not in HU Gas (Fig. 6).
In Sol, trolox administration fully counteracted thedisuse-induced increase in oxidation index (Fig. 9). Thisfinding is consistent with the proteomic analysis, whichshowed a reversal of the impairment of the antioxidantdefense systems in HU-TRO Sol. In HU-TRO Gas, theoxidation index was slightly, but significantly, lower thanin HU Gas, consistent with the upregulation of the proteinsinvolved in antioxidant defense systems (Fig. 8).
Indeed, the oxidation index of both HU-TRO Sol andHU-TRO Gas was slightly, but significantly, lower than inthe corresponding CTRL muscles (Fig. 9).
The redox balance was also assessed by an approachindependent from oxyblot, i.e. the analysis of lipidperoxidation based on determination of the levels ofMDA. Malondialdehyde levels were significantly higher inHU Sol (331 ± 51 nmol g−1) than in CTRL Sol (197 ±11 nmol g−1), whereas the difference between HU Gas(109 ± 21 nmol g−1) and CTRL Gas (149 ± 7 nmol g−1)did not reach statistical significance. Following troloxadministration, HU-TRO Sol (201 ± 11 nmol g−1) andHU-TRO Gas (102 ± 18 nmol g−1) showed the same levelof MDA as the corresponding CTRL muscles.
The results of the analyses of protein oxidation and lipidperoxidation were, therefore, consistent.
Discussion
In this study, the adaptations to muscle disuse of theprotein pattern of a slow oxidative muscle, the Sol, and afast glycolytic muscle, the Gas, were studied by proteomicanalysis. This analysis enabled the complexity of musclephenotype adaptations to be addressed (Spangenburg &Booth, 2003) by identifying the proteins differentiallyexpressed following HU and antioxidant administrationamong the very large number (∼800) of protein spots,which could be separated in two-dimensional maps.The differentially expressed proteins can be consideredthe targets of the disuse process and of the antioxidanttreatment.
Notably, although a large number of proteins, belongingto several functional categories, were differentiallyexpressed in the different conditions, their changeswere fully consistent with one another, building a verycomprehensive and solid picture of the adaptations of bothSol and Gas to HU and antioxidant administration.
Soleus and Gas adapted to disuse very differently inall the following protein categories identified: myofibrillar
C© 2009 The Authors. Journal compilation C© 2009 The Physiological Society
423
14 L. Brocca and others Exp Physiol 00.00 pp 1–20
proteins; antioxidant defense systems; energy productionsystems; and a group of proteins with variable functionalroles (‘other proteins’). The major findings relatedto muscle atrophy and myofibrillar protein pattern,antioxidant defense systems and oxidative stress, andenergy metabolism.
Hindlimb unloading and muscle mass and myofibrillarprotein pattern
Although it is generally believed that slow muscles are mostaffected by disuse (Fitts et al. 2001), in agreement withprevious observations (Stelzer & Widrick, 2003; Ferreiraet al. 2007), the present findings indicate that 14 days HUresulted in significant atrophy not only of Sol, a slowmuscle, but also of Gas, a fast muscle.
The greater atrophy of type IIA Sol and type IIB Gasfibres compared with type I Sol fibres is surprising, becauseit is not in agreement with the long-standing idea of a
Figure 9. Protein oxidation index (OI) in soleus (A) and gastrocnemius muscles (B) in control conditions(CTRL, lane 1), following hindlimb unloading (HU, lane 2) and following trolox treatment before andduring HU (HU-TRO, lane 3)The OI is determined as the ratio between the densitometric values of the oxyblot bands and those stained withPonceau Red in Western blots of muscle homogenates (see Methods). The height of each vertical bar representsthe mean + S.E.M. ∗ Significantly different from all other groups (P < 0.05). The band close to 43 kDa is actin.
preferential atrophy of slow fibres in disuse (Baldwin,1996b; di Prampero & Narici, 2003). However, similaratrophy in slow and fast muscle fibres both in humans(Hather et al. 1992; Fitts et al. 2001) and mice (Stelzer &Widrick, 2003) has been previously observed. Collectively,the results suggest that the variable sensitivity to disuseatrophy does not depend on the different fibre-typecomposition of slow and fast muscles, but more probablyon their function in maintaining posture.
In HU Sol, the downregulation of actin, desmin andmyozenin indicated by the proteome analysis (Fig. 5)complements the picture of muscle atrophy. The loweractin content is consistent with previous observations(Chopard et al. 2001; Riley et al. 2002; Moriggi et al. 2008).Since both desmin (Paulin & Li, 2004) and myozenin(Frey et al. 2000; Takada et al. 2001) are load-bearingcytoskeleton proteins, their downregulation is probablyan adaptation to the lower load applied to muscle fibresduring HU and is bound to result in a decrease in
C© 2009 The Authors. Journal compilation C© 2009 The Physiological Society
424
Exp Physiol 00.00 pp 1–20 Proteomic analysis of disused mouse muscles 15
load-bearing capacity upon reloading. Contradictoryfindings have previously been reported on the impactof disuse on desmin content in both humans and rats(Chopard et al. 2001, 2005; Moriggi et al. 2008).
In HU Gas, actin was downregulated, in agreement withthe observation of a disproportionate loss of thin filamentsin Gas (Riley et al. 2002). Myozenin was upregulated, incontrast to what was observed in Sol (Fig. 6). This findingsuggests that there are different adaptations of the Z-disksto HU in the two muscles. It should be noted that Z-disks are not only mere mechanical joints between adjacentsarcomeres, but can also play a role in sensing the stressapplied to muscle cells (Hoshijima, 2006).
The variations of MHC isoform distribution and ofMLC and troponin I isoform content (Figs 5 and 6)observed in both Sol and Gas confirm the slower to fastershift in muscle phenotype generally observed in disuse(Fitts et al. 2001) and are consistent with a very recent anddetailed analysis of myofibrillar protein isoforms in disuse(Yu et al. 2007). In Gas, the almost homogeneous MHC-IIB content of control muscles prevented a large slower tofaster shift in MHC content.
Interestingly, some adaptations of the Sol proteinpattern, i.e. the downregulation of desmin, variousoxidative enzymes and carbonic anhydrase and theupregulation of parvalbumin, might depend on the disuse-induced activation of a gene expression programmetransforming Sol muscle fibres from slower to faster. Suchproteins are, in fact, differentially expressed in slow andfast muscles or muscle fibres (Celio & Heizmann, 1982;Schiaffino & Reggiani, 1996; Chopard et al. 2001). Incontrast, many adaptations observed either did not havea known relation with a shift in muscle fibre types orwere in the opposite direction of what was expected,among which were the adaptations of glycolytic enzymesand creatine kinase. It is interesting to note that mostprotein adaptations in Gas could not be related to ashift in MHC isoform distribution because very limitedshift was observed. These observations are consistent withthe hypothesis that differences among muscle fibres arecontrolled by several gene expression programmes, andnot by a single ‘master switch’, changing fibre type and allother proteins in co-ordinated fashion (Spangenburg &Booth, 2003)
Importantly, antioxidant administration did notprevent muscle and muscle fibre atrophy either in Sol or inGas. The downregulation of myozenin in both HU-TROSol and HU-TRO Gas and of actin in HU-TRO Gas (Figs 7and 8) is consistent with persistent muscle atrophy.
Hindlimb unloading and oxidative stress
Profound alterations in antioxidant defense systems andHSPs (Fig. 5), fully consistent with a higher protein
oxidation index (Fig. 9) and lipid peroxidation, occurredin HU Sol. Zinc/copper superoxide dismutase wasupregulated, whereas all other differentially expressedproteins of this category were downregulated. Althoughan increase in Zn/Cu SOD might at first appear protectiveagainst oxidative stress, the decrease in the capacity toconvert hydrogen peroxide into water resulting froma downregulation of enzymes downstream of Zn/CuSOD, including peroxiredoxin (PRDX6), can indeed resultin accumulation of hydrogen peroxide and promoteoxidative stress (Lawler et al. 2003). Carbonic anhydrase 3(CAH III) protects against oxidative damage by bindingfree radicals (Cabiscol & Levine, 1995; Raisanen et al.1999). Its reduced content is in agreement with arecent gene expression study in mouse HU Sol (Dappet al. 2004). Heat shock proteins work downstreamof the other antioxidant defense systems by removingproducts caused by the formation of free radicals andby protecting cells against oxidative stress (Lawler et al.2006b). The downregulation of HSPs is consistent withthe lower content of Hsp70 and Hsp25 previously observedfollowing HU (Lawler et al. 2006b).
Notably, the findings in mouse Sol recapitulated whatwas previously observed using different experimentalapproaches in rat Sol and consequently could suggest amajor pathogenic role of oxidative stress in disuse atrophy,in agreement with previous studies (Lawler et al. 2003,2006b; Servais et al. 2007).
Surprisingly, the analysis of HU Gas which, being afast muscle, has been little studied, suggests the oppositeconclusion that oxidative stress, at least in mice, doesnot play a major role in determining atrophy. In HUGas, Zn/Cu SOD, CAH III and PRDX6 were upregulated(Fig. 6), HSPs were not differentially expressed, proteinoxidation index (Fig. 9) and lipid peroxidation were notdifferent from control Gas, but muscle and muscle fibre(Fig. 2) atrophy occurred. Importantly, the effects ofantioxidant treatment on Sol and Gas strongly supportthe lack of a major causal role of oxidative stress.Trolox prevented the HU-induced deterioration of theantioxidant defense systems in Sol (Fig. 7) and enhancedthem above control levels in Gas (Fig. 8). Consistently, itcounteracted the increase in oxidation index in HU Sol,decreased it below normal in Gas (Fig. 9) and counteractedthe increase in lipid peroxidation in HU Sol. However, noeffect was observed on muscle and muscle fibre atrophy(Fig. 2).
To reduce the risk of an unexpected non-specific effect,the dose of trolox was chosen at an intermediate levelbetween the minimal (10 mg kg−1 day−1, e.g. Sagach et al.Pharmacol Res 2002) and maximal doses (92 mg kg−1 d−1;e.g. McClung et al. 2007) reported in the literature. Thepossibility that maximal doses of trolox could have affectedmuscle atrophy cannot definitely be rule out, although itappears very unlikely because lipid and protein oxidation
C© 2009 The Authors. Journal compilation C© 2009 The Physiological Society
425
16 L. Brocca and others Exp Physiol 00.00 pp 1–20
were fully prevented and antioxidant defense systems wereupregulated by trolox treatment.
No information was available on antioxidant defensesystems in HU Gas until a very recent study in rats (Siuet al. 2008). Interestingly, in substantial agreement withthe present work, Siu et al. (2008) showed no impairmentin antioxidant defense systems, in contrast to what waspreviously observed in rat soleus (Lawler et al. 2003, 2006b;Servais et al. 2007). However, the authors suggested apathogenic role of oxidative stress based on higher lipidperoxidation, whereas we did not find a significant increasein lipid peroxidation, in agreement with no increasein protein oxidation index in Gas (Fig. 9). The slowerphenotype and higher oxidative metabolism of rat Gas(Rijkelijkhuizen et al. 2003) compared with mouse Gascould explain the somewhat different adaptation to disusereported by Siu et al. (2008) and by this work (Dapp et al.2004).
The impact of antioxidant treatments on muscleatrophy has been studied previously, and contradictoryresults have been obtained. Amelioration of disuse atrophywas observed in some studies (Kondo et al. 1992; Appellet al. 1997; Arbogast et al. 2007; McClung et al. 2007;Servais et al. 2007), but not in others (Koesterer et al.2002; Matuszczak et al. 2004). The discrepancies coulddepend on the disuse models and on the drugs employed,which could have a more complex action than onlyan antioxidant action. Disuse atrophy resulting frommechanical ventilation (McClung et al. 2007) and one-leg immobilization (Kondo et al. 1992; Appell et al. 1997)could be more sensitive to antioxidant treatment becausethese models result in a much faster atrophy, which mighthave pathogenic mechanisms somewhat different fromHU. Servais et al. (2007) suggested that the ameliorationof Sol atrophy following vitamin E administration didnot depend on its antioxidant properties, but on itsinhibition of proteolytic enzymes. The Bowman–Birkinhibitor used by Arbogast et al. (2007) has multipleactions, including the inhibition of serine proteases, andnot only an antioxidant action.
Hindlimb unloading and energy metabolism
In HU Sol, a general downsizing of all energy productionsystems occurred for glycolytic enzymes, oxidativeenzymes and creatine kinase. While the downregulationof oxidative enzymes is expected on the basis of theslower to faster shift in muscle phenotype (Abadi et al.2009), the downregulation of glycolytic enzymes is not inagreement with their higher activity generally observed inrats following HU or space flight (Fitts et al. 2001) andwith a very recent proteomic analysis of rat Sol musclefollowing HU (Moriggi et al. 2008). However, Dapp
et al. (2004) have shown a lower expression of glycolyticenzymes following 7 days HU in mice and suggested thatthe discrepancy with rat Sol could depend on the muchfaster starting phenotype of mice and on the consequentlydifferent shift in fibre types following HU. Notably, asimilar downregulation of glycolytic enzymes has beenobserved following 4–11 days immobilization in humansby microarray analysis (Chen et al. 2007).
Moreover, the downregulation of desmin, myoglobinand FABPH3 in Sol are consistent with and could indeedcontribute to a major impairment of cell metabolism.In fact, desmin is not only a load-bearing protein, butis involved in mitochondrial positioning and respiratoryfunction (Milner et al. 2000). Myoglobin is not only ashort-term oxygen reservoir, but could facilitate oxygendiffusion within the cell and stimulate mitochondrialbiogenesis by downregulating NO (Flogel et al. 2001).It is noteworthy that desmin-null mice have structuraland functional alterations of the mitochondria (Goldfarbet al. 2004). Moreover, FABPH3s could control lipidmetabolism and fuel usage (Makowski & Hotamisligil,2004) and could play a central role in the control of lipidsignalling in the cells (Makowski & Hotamisligil, 2004),which might be involved in modulating inflammation andmetabolism.
Interstingly, the downregulation of NADH-ubiquinoneoxidoreductase 49 kDa, cytochrome c1 and ATP synthase(Fig. 5), belonging to mitochondrial complex I, III and V,respectively, could not only impair energy metabolism,but also contribute to ROS production in HU Sol. Therespiratory chain is in fact a major site of ROS production.A slowing down of any of its steps (Powers et al. 2007)and its asymmetric inhibition could increase its ROSproduction.
In HU Gas, an upregulation of glycolytic enzymes andno evidence of a general impairment of energy productionsystems were observed. The higher content of glycolyticenzymes in a fast muscle following disuse is in agreementwith previous observations (Thomason & Booth, 1990).It is unlikely that this shift can be explained by thesmall slower to faster shift in MHC isoform distributionobserved in HU Gas. It is more likely that unloadingdetermined an increase in glycolytic metabolism mostlyindependent of fibre-type shift (Grichko et al. 2000). Thehigher content of glycolytic enzymes following HU in Gasis consistent with a shift in substrate usage away fromlipids and towards glucose and could determine metabolicinflexibility, a phenomenon recently suggested to play arole in disuse atrophy (Mazzatti et al. 2008).
Trolox administration did not counteract, but evenfurther decreased glycolytic metabolism, creatine kinaseand myoglobin in Sol and decreased oxidative andglycolytic metabolism and myoglobin in Gas, suggestingthat the impairment of energy metabolism in disuse is notdue to free radical production.
C© 2009 The Authors. Journal compilation C© 2009 The Physiological Society
426
Exp Physiol 00.00 pp 1–20 Proteomic analysis of disused mouse muscles 17
Several observations reported here suggest thatmetabolic adaptations could concur to the pathogenesisof disuse atrophy and not be a mere consequence ofit. Together with myofibrillar proteins and antioxidantdefense systems, the proteins directly (metabolic enzymes)or indirectly involved (myoglobin, desmin, FHBS) inenergy metabolism were the most important targets ofHU. Their adaptations were not merely a consequence ofa slow to fast shift in muscle phenotype. The antioxidanttreatment, which restored apparently normal defensesystems against oxidative stress and counteracted proteinoxidation and lipid peroxidation, did not reverse bothmetabolic adaptations and muscle atrophy.
The possible contribution of a metabolic programmein modulating cell size is now widely recognized (Sandri,2008). Indeed, a general impairment in energy productionhas also been observed in a number of pathologicalconditions in which muscle wasting occurs, such asmuscular dystrophy (Porter et al. 2004), cancer, fasting,diabetes and uraemia (Lecker et al. 2004) and in burnsepsis (Duan et al. 2006). Recently, metabolic inflexibilityhas been stressed as a possible cause of disuse atrophy(Mazzatti et al. 2008).
The possible link between metabolic adaptations andstructural and functional alterations in disused muscle isstill unclear. Interestingly, an impaired energy metabolismper se could decrease protein synthesis, which is anATP-requiring process. Moreover, the downregulation ofcreatine kinase might play a role in muscle atrophy. Intransgenic mice lacking either the cytoplasmic (M-CK) orboth the cytoplasmic and mitochondrial creatine kinase,muscle atrophy and damage occur (Momken et al. 2005).Interestingly, RING-finger protein-1 (MuRF1), a majorubiquitin ligase involved in muscle proteolysis in disuse,has very recently been found to ubiquinate creatine kinaseand to favour its catabolism (Koyama et al. 2008).
In Gas, metabolic inflexibility per se could play a rolein muscle deterioration following disuse (Mazzatti et al.2008), although metabolic alterations appear much lessevident than in Sol.
Hindlimb unloading and calcium handling
The downregulation of sarcalumenin and the upregulationof parvalbumin suggest a disuse-induced alteration ofcalcium handling within the cell. The lower contentof sarcalumenin suggests a weakening of the calcium-handling capacity of the sarcoplasmic reticulum (Yoshidaet al. 2005), whereas the upregulation of parvalbuminsuggests an increase in the calcium-buffering capacity ofthe cytosol. The higher content of parvalbumin followingHU could be related to the slow to fast shift in musclephenotype (Celio & Heizmann, 1982). The upregulationof parvalbumin is in agreement with previous gene
expression studies on immobilized human muscle (St-Amand et al. 2001) and on muscles of small mammals ina variety of conditions characterized by muscle wasting(Lecker et al. 2004; Duan et al. 2006). In this respect, itshould be noted that disuse-induced alterations of restingcalcium concentration following HU have been observed,although there is no agreement on whether resting calciumconcentration increases (Ingalls et al. 1999) or decreases(Fraysse et al. 2003).
Conclusions
The present findings indicate, surprisingly, that oxidativestress is more likely to be a consequence than a causeof muscle atrophy following HU in mice, either in aslow oxidative muscle, the soleus, or in a fast glycoliticmuscle, the gastrocnemius. Although the roles of differentpathogenic mechanisms in disuse muscle atrophy couldvary according to species and experimental models, ourfindings in mice open the possibility that oxidative stressmight not be a major requirement of muscle atrophyalso in other conditions. Metabolic alterations emergeas a possible component of the pathogenesis of disuseatrophy in mice Sol, whereas in Gas their role is muchless clear. This study does not rule out the possibilitythat oxidative stress can play a role in disuse-inducedalterations of muscle force production through oxidationof myofibrillar proteins (Dalla Libera et al. 2005) andeffects on electrophysiological parameters (Desaphy et al.2005; Powers & Jackson, 2008), independently from itslack of effect on muscle atrophy.
References
Abadi A, Glover EI, Isfort RJ, Raha S, Safdar A, Yasuda N,Kaczor JJ, Melov S, Hubbard A, Qu X, Phillips SM &Tarnopolsky M (2009). Limb immobilization induces acoordinate down-regulation of mitochondrial and othermetabolic pathways in men and women. PLoS ONE 4,e6518.
Appell HJ, Duarte JA & Soares JM (1997). Supplementation ofvitamin E may attenuate skeletal muscle immobilizationatrophy. Int J Sports Med 18, 157–160.
Arbogast S, Smith J, Matuszczak Y, Hardin BJ, Moylan JS,Smith JD, Ware J, Kennedy AR & Reid MB (2007).Bowman-Birk inhibitor concentrate prevents atrophy,weakness, and oxidative stress in soleus muscle ofhindlimb-unloaded mice. J Appl Physiol 102,956–964.
Baldwin KM (1996a). Effect of spaceflight on the functional,biochemical, and metabolic properties of skeletal muscle.Med Sci Sports Exerc 28, 983–987.
Baldwin KM (1996b). Effects of altered loading states onmuscle plasticity: what have we learned from rodents? MedSci Sports Exerc 28, S101–106.
C© 2009 The Authors. Journal compilation C© 2009 The Physiological Society
427
18 L. Brocca and others Exp Physiol 00.00 pp 1–20
Barreiro E, de la Puente B, Minguella J, Corominas JM, SerranoS, Hussain SN & Gea J (2005). Oxidative stress andrespiratory muscle dysfunction in severe chronic obstructivepulmonary disease. Am J Respir Crit Care Med 171,1116–1124.
Barreiro E, Gea J, Corominas JM & Hussain SN (2003). Nitricoxide synthases and protein oxidation in the quadricepsfemoris of patients with chronic obstructive pulmonarydisease. Am J Respir Cell Mol Biol 29, 771–778.
Bottinelli R, Schiaffino S & Reggiani C (1991). Force–velocityrelations and myosin heavy chain isoform compositions ofskinned fibres from rat skeletal muscle. J Physiol 437,655–672.
Brocca L, D’Antona G, Bachi A & Pellegrino MA (2008).Amino acid supplements improve native antioxidant enzymeexpression in the skeletal muscle of diabetic mice. Am JCardiol 101, 57E–62E.
Cabiscol E & Levine RL (1995). Carbonic anhydrase III.Oxidative modification in vivo and loss of phosphataseactivity during aging. J Biol Chem 270, 14742–14747.
Celio MR & Heizmann CW (1982). Calcium-binding proteinparvalbumin is associated with fast contracting musclefibres. Nature 297, 504–506.
Chen YW, Gregory CM, Scarborough MT, Shi R, Walter GA &Vandenborne K (2007). Transcriptional pathways associatedwith skeletal muscle disuse atrophy in humans. PhysiolGenomics 31, 510–520.
Chopard A, Arrighi N, Carnino A & Marini JF (2005). Changesin dysferlin, proteins from dystrophin glycoprotein complex,costameres, and cytoskeleton in human soleus and vastuslateralis muscles after a long-term bedrest with or withoutexercise. FASEB J 19, 1722–1724.
Chopard A, Pons F & Marini JF (2001). Cytoskeletal proteincontents before and after hindlimb suspension in a fast andslow rat skeletal muscle. Am J Physiol Regul Integr CompPhysiol 280, R323–R330.
Coirault C, Guellich A, Barbry T, Samuel JL, Riou B &Lecarpentier Y (2007). Oxidative stress of myosincontributes to skeletal muscle dysfunction in rats withchronic heart failure. Am J Physiol Heart Circ Physiol 292,H1009–H1017.
Dalla Libera L, Ravara B, Gobbo V, Danieli Betto D,Germinario E, Angelini A & Vescovo G (2005). Skeletalmuscle myofibrillar protein oxidation in heart failure and theprotective effect of Carvedilol. J Mol Cell Cardiol 38,803–807.
D’Antona G, Pellegrino MA, Adami R, Rossi R, Carlizzi CN,Canepari M, Saltin B & Bottinelli R (2003). The effect ofageing and immobilization on structure and function ofhuman skeletal muscle fibres. J Physiol 552, 499–511.
Dapp C, Schmutz S, Hoppeler H & Fluck M (2004).Transcriptional reprogramming and ultrastructure duringatrophy and recovery of mouse soleus muscle. PhysiolGenomics 20, 97–107.
Desaphy JF, Pierno S, Liantonio A, De Luca A, Didonna MP,Frigeri A, Nicchia GP, Svelto M, Camerino C, Zallone A &Camerino DC (2005). Recovery of the soleus muscle aftershort- and long-term disuse induced by hindlimb unloading:effects on the electrical properties and myosin heavy chainprofile. Neurobiol Dis 18, 356–365.
Desplanches D, Kayar SR, Sempore B, Flandrois R & HoppelerH (1990). Rat soleus muscle ultrastructure after hindlimbsuspension. J Appl Physiol 69, 504–508.
di Prampero PE & Narici MV (2003). Muscles in microgravity:from fibres to human motion. J Biomech 36, 403–412.
Duan X, Berthiaume F, Yarmush D & Yarmush ML (2006).Proteomic analysis of altered protein expression in skeletalmuscle of rats in a hypermetabolic state induced by burnsepsis. Biochem J 397, 149–158.
Ferreira R, Vitorino R, Neuparth MJ, Appell HJ, Amado F &Duarte JA (2007). Cellular patterns of the atrophic responsein murine soleus and gastrocnemius muscles submitted tosimulated weightlessness. Eur J Appl Physiol 101,331–340.
Fitts RH, Riley DR & Widrick JJ (2001). Functional andstructural adaptations of skeletal muscle to microgravity. JExp Biol 204, 3201–3208.
Flogel U, Merx MW, Godecke A, Decking UK & Schrader J(2001). Myoglobin: a scavenger of bioactive NO. Proc NatlAcad Sci U S A 98, 735–740.
Fraysse B, Desaphy JF, Pierno S, De Luca A, Liantonio A, MitoloCI & Camerino DC (2003). Decrease in resting calcium andcalcium entry associated with slow-to-fast transition inunloaded rat soleus muscle. FASEB J 17, 1916–1918.
Frey N, Richardson JA & Olson EN (2000). Calsarcins, a novelfamily of sarcomeric calcineurin-binding proteins. Proc NatlAcad Sci U S A 97, 14632–14637.
Gamrin L, Berg HE, Essen P, Tesch PA, Hultman E, Garlick PJ,McNurlan MA & Wernerman J (1998). The effect ofunloading on protein synthesis in human skeletal muscle.Acta Physiol Scand 163, 369–377.
Gelfi C, Vigano A, Ripamonti M, Pontoglio A, Begum S,Pellegrino MA, Grassi B, Bottinelli R, Wait R & Cerretelli P(2006). The human muscle proteome in aging. J ProteomeRes 5, 1344–1353.
Goldfarb LG, Vicart P, Goebel HH & Dalakas MC (2004).Desmin myopathy. Brain 127, 723–734.
Grichko VP, Heywood-Cooksey A, Kidd KR & Fitts RH (2000).Substrate profile in rat soleus muscle fibers after hindlimbunloading and fatigue. J Appl Physiol 88, 473–478.
Hather BM, Adams GR, Tesch PA & Dudley GA (1992). Skeletalmuscle responses to lower limb suspension in humans. JAppl Physiol 72, 1493–1498.
Hoshijima M (2006). Mechanical stress-strain sensorsembedded in cardiac cytoskeleton: Z disk, titin, andassociated structures. Am J Physiol Heart Circ Physiol 290,H1313–H1325.
Ingalls CP, Warren GL & Armstrong RB (1999). IntracellularCa2+ transients in mouse soleus muscle after hindlimbunloading and reloading. J Appl Physiol 87, 386–390.
Kang ES, Woo IS, Kim HJ, Eun SY, Paek KS, Chang KC, Lee JH,Lee HT, Kim JH, Nishinaka T, Yabe-Nishimura C & Seo HG(2007). Up-regulation of aldose reductase expressionmediated by phosphatidylinositol 3-kinase/Akt and Nrf2 isinvolved in the protective effect of curcumin againstoxidative damage. Free Radic Biol Med 43, 535–545.
Koesterer TJ, Dodd SL & Powers S (2002). Increasedantioxidant capacity does not attenuate muscleatrophy caused by unweighting. J Appl Physiol 93,1959–1965.
C© 2009 The Authors. Journal compilation C© 2009 The Physiological Society
428
Exp Physiol 00.00 pp 1–20 Proteomic analysis of disused mouse muscles 19
Kondo H, Miura M, Nakagaki I, Sasaki S & Itokawa Y (1992).Trace element movement and oxidative stress in skeletalmuscle atrophied by immobilization. Am J PhysiolEndocrinol Metab 262, E583–E590.
Koyama S, Hata S, Witt CC, Ono Y, Lerche S, Ojima K, ChibaT, Doi N, Kitamura F, Tanaka K, Abe K, Witt SH, Rybin V,Gasch A, Franz T, Labeit S & Sorimachi H (2008). MuscleRING-finger protein-1 (MuRF1) as a connector of muscleenergy metabolism and protein synthesis. J Mol Biol 376,1224–1236.
Lawler JM, Kwak HB, Song W & Parker JL (2006a). Exercisetraining reverses downregulation of HSP70 and antioxidantenzymes in porcine skeletal muscle after chronic coronaryartery occlusion. Am J Physiol Regul Integr Comp Physiol 291,R1756–R1763.
Lawler JM, Song W & Demaree SR (2003). Hindlimbunloading increases oxidative stress and disrupts antioxidantcapacity in skeletal muscle. Free Radic Biol Med 35,9–16.
Lawler JM, Song W & Kwak HB (2006b). Differential responseof heat shock proteins to hindlimb unloading and reloadingin the soleus. Muscle Nerve 33, 200–207.
Lecker SH, Jagoe RT, Gilbert A, Gomes M, Baracos V, Bailey J,Price SR, Mitch WE & Goldberg AL (2004). Multiple types ofskeletal muscle atrophy involve a common program ofchanges in gene expression. FASEB J 18, 39–51.
McClung JM, Kavazis AN, Whidden MA, DeRuisseau KC, FalkDJ, Criswell DS & Powers SK (2007). Antioxidantadministration attenuates mechanical ventilation-inducedrat diaphragm muscle atrophy independent of proteinkinase B (PKB Akt) signalling. J Physiol 585, 203–215.
Makowski L & Hotamisligil GS (2004). Fatty acid bindingproteins—the evolutionary crossroads of inflammatory andmetabolic responses. J Nutr 134, 2464S–2468S.
Matuszczak Y, Arbogast S & Reid MB (2004). Allopurinolmitigates muscle contractile dysfunction caused byhindlimb unloading in mice. Aviat Space Environ Med 75,581–588.
Mazzatti DJ, Smith MA, Oita RC, Lim FL, White AJ & Reid MB(2008). Muscle unloading-induced metabolic remodelling isassociated with acute alterations in PPARδ and UCP-3expression. Physiol Genomics 34, 149–161.
Milner DJ, Mavroidis M, Weisleder N & Capetanaki Y (2000).Desmin cytoskeleton linked to muscle mitochondrialdistribution and respiratory function. J Cell Biol 150,1283–1298.
Momken I, Lechene P, Koulmann N, Fortin D, Mateo P, DoanBT, Hoerter J, Bigard X, Veksler V & Ventura-Clapier R(2005). Impaired voluntary running capacity of creatinekinase-deficient mice. J Physiol 565, 951–964.
Moriggi M, Cassano P, Vasso M, Capitanio D, Fania C,Musicco C, Pesce V, Gadaleta MN & Gelfi C (2008). A DIGEapproach for the assessment of rat soleus muscle changesduring unloading: effect of acetyl-L-carnitinesupplementation. Proteomics 8, 3588–3604.
Moylan JS & Reid MB (2007). Oxidative stress, chronic disease,and muscle wasting. Muscle Nerve 35, 411–429.
Paulin D & Li Z (2004). Desmin: a major intermediate filamentprotein essential for the structural integrity and function ofmuscle. Exp Cell Res 301, 1–7.
Pellegrino MA, Canepari M, Rossi R, D’Antona G, Reggiani C& Bottinelli R (2003). Orthologous myosin isoforms andscaling of shortening velocity with body size in mouse, rat,rabbit and human muscles. J Physiol 546, 677–689.
Porter JD, Merriam AP, Leahy P, Gong B, Feuerman J, Cheng G& Khanna S (2004). Temporal gene expression profiling ofdystrophin-deficient (mdx) mouse diaphragm identifiesconserved and muscle group-specific mechanisms in thepathogenesis of muscular dystrophy. Hum Mol Genet 13,257–269.
Powers SK & Jackson MJ (2008). Exercise-induced oxidativestress: cellular mechanisms and impact on muscle forceproduction. Physiol Rev 88, 1243–1276.
Powers SK, Kavazis AN & McClung JM (2007). Oxidative stressand disuse muscle atrophy. J Appl Physiol 102, 2389–2397.
Raisanen SR, Lehenkari P, Tasanen M, Rahkila P, Harkonen PL& Vaananen HK (1999). Carbonic anhydrase III protectscells from hydrogen peroxide-induced apoptosis. FASEB J13, 513–522.
Rijkelijkhuizen JM, de Ruiter CJ, Huijing PA & de Haan A(2003). Force/velocity curves of fast oxidative and fastglycolytic parts of rat medial gastrocnemius muscle vary forconcentric but not eccentric activity. Pflugers Arch 446,497–503.
Riley DA, Bain JL, Thompson JL, Fitts RH, Widrick JJ, TrappeSW, Trappe TA & Costill DL (2002). Thin filament diversityand physiological properties of fast and slow fiber types inastronaut leg muscles. J Appl Physiol 92, 817–825.
Sagach VF, Scrosati M, Fielding J, Rossoni G, Galli C & VisioliF (2002). The water-soluble vitamin E analogue Troloxprotects against ischaemia/reperfusion damage in vitro andex vivo. A comparison with vitamin E. Pharmacol Res 44,435–439.
Sandri M (2008). Signaling in muscle atrophy andhypertrophy. Physiology (Bethesda) 23, 160–170.
Schiaffino S & Reggiani C (1996). Molecular diversity ofmyofibrillar proteins: gene regulation and functionalsignificance. Physiol Rev 76, 371–423.
Servais S, Letexier D, Favier R, Duchamp C & Desplanches D(2007). Prevention of unloading-induced atrophy byvitamin E supplementation: links between oxidative stressand soleus muscle proteolysis? Free Radic Biol Med 42,627–635.
Siu PM, Pistilli EE & Alway SE (2008). Age-dependent increasein oxidative stress in gastrocnemius muscle with unloading. JAppl Physiol 105, 1695–1705.
Smith MA & Reid MB (2006). Redox modulation of contractilefunction in respiratory and limb skeletal muscle. RespirPhysiol Neurobiol 151, 229–241.
Spangenburg EE & Booth FW (2003). Molecular regulation ofindividual skeletal muscle fibre types. Acta Physiol Scand178, 413–424.
St-Amand J, Okamura K, Matsumoto K, Shimizu S & Sogawa Y(2001). Characterization of control and immobilized skeletalmuscle: an overview from genetic engineering. FASEB J 15,684–692.
Stelzer JE & Widrick JJ (2003). Effect of hindlimb suspensionon the functional properties of slow and fast soleus fibersfrom three strains of mice. J Appl Physiol 95,2425–2433.
C© 2009 The Authors. Journal compilation C© 2009 The Physiological Society
429
20 L. Brocca and others Exp Physiol 00.00 pp 1–20
Takada F, Vander Woude DL, Tong HQ, Thompson TG,Watkins SC, Kunkel LM & Beggs AH (2001). Myozenin: anα-actinin- and γ-filamin-binding protein of skeletal muscleZ lines. Proc Natl Acad Sci U S A 98, 1595–1600.
Thomason DB & Booth FW (1990). Atrophy of the soleusmuscle by hindlimb unweighting. J Appl Physiol 68, 1–12.
Yoshida M, Minamisawa S, Shimura M, Komazaki S, Kume H,Zhang M, Matsumura K, Nishi M, Saito M, Saeki Y, IshikawaY, Yanagisawa T & Takeshima H (2005). Impaired Ca2+ storefunctions in skeletal and cardiac muscle cells fromsarcalumenin-deficient mice. J Biol Chem 280, 3500–3506.
Yu ZB, Gao F, Feng HZ & Jin JP (2007). Differential regulationof myofilament protein isoforms underlying the contractilitychanges in skeletal muscle unloading. Am J Physiol CellPhysiol 292, C1192–C1203.
Acknowledgements
This work was supported by the Italian Space Agency grantsto R. Bottinelli and D. Conte Camerino (project OSMA
‘Osteoporosis and Muscle Atrophy’). We thank CEINGEAdvanced Biotecnologies s.c.a.r.l. center, Naples, Italy, for helpin protein identification by MALDI-Tof analysis.
Supplemental material
Online supplemental material for this paper can be accessed at:http://jp.physoc.org/cgi/content/full/expphysiol.2009.050245/DC1
As a service to our authors and readers, this journalprovides supporting information supplied by the authors.Such materials are peer-reviewed and may be re-organizedfor online delivery, but are not copy-edited or typeset.Technical support issues arising from supporting information(other than missing files) should be addressed to theauthors.
C© 2009 The Authors. Journal compilation C© 2009 The Physiological Society
430